Review

Role of Förster Resonance Energy Transfer in Graphene-Based Nanomaterials for Sensing

1
Fluorensic Materials Laboratory, Department of Applied Chemistry, Karunya Institute of Technology and Sciences (Deemed-to-be University), Karunya Nagar, Coimbatore 641 114, India
2
College of Material Science and Technology, Nanjing University of Aeronautics and Astronautics, Nanjing 211100, China
*
Author to whom correspondence should be addressed.
Appl. Sci. 2022, 12(14), 6844; https://doi.org/10.3390/app12146844
Submission received: 20 March 2022 / Revised: 28 April 2022 / Accepted: 4 May 2022 / Published: 6 July 2022
(This article belongs to the Special Issue Applications of Graphene Family Materials for Environmental Sensing)

Abstract

:
Förster resonance energy transfer (FRET)-based fluorescence sensing of various target analytes has been of growing interest in the environmental, bioimaging, and diagnosis fields. Graphene-based zero- (0D) to two-dimensional (2D) nanomaterials, such as graphene quantum dots (GQDs), graphene oxide (GO), reduced graphene oxide (rGO), and graphdiyne (GD), can potentially be employed as donors/acceptors in FRET-based sensing approaches because of their unique electronic and photoluminescent properties. In this review, we discuss the basics of FRET, as well as the role of graphene-based nanomaterials (GQDs, GO, rGO, and GD) for sensing various analytes, including cations, amino acids, explosives, pesticides, biomolecules, bacteria, and viruses. In addition, the graphene-based nanomaterial sensing strategy could be applied in environmental sample analyses, and the reason for the lower detection ranges (micro- to pico-molar concentration) could also be explained in detail. Challenges and future directions for designing nanomaterials with a new sensing approach and better sensing performance will also be highlighted.

Graphical Abstract

1. Introduction

Graphene-based nanomaterials are composed of sp2 and sp3 hybridized carbons by the introduction of functionality, which provides an optical bandgap that leads to fluorescence [1,2,3,4,5,6,7,8,9]. In particular, GO is rich in oxygen functionality and can lead to the partial reduction of GO-containing functional groups to produce rGO. GQDs are obtained by cutting layered graphene sheets to a nanometer size [10,11,12,13,14]. They contain a size-dependent optical bandgap via the quantum confinement effect. GO and its derivatives are water-soluble, non-toxic, cost-effective, biocompatible, eco-friendly, have a high photostability, and display excitation-wavelength-dependent fluorescence [15,16,17,18,19,20,21]. In particular, 2D materials have strong interactions with adsorbed conjugated molecules through various interactions, such as π–π stacking, hydrogen bonding, and electrostatic interactions, which could offer a significant platform for conjugated systems. Therefore, graphene-based nanomaterials have been utilized extensively in fluorescent sensing and imaging applications to date. These materials not only act as a tunable fluorophore, but are also sometimes employed as an efficient quencher in fluorescence.
Over the years, graphene-based nanomaterials have been utilized for various applications, such as in energy, photoelectronic, catalyst, biomedicine, and sensing fields [22,23,24,25]. To date, various review articles in the field of sensing utilizing graphene-based materials have been reported [26,27,28,29]. Despite this, the role of the FRET process in graphene-based nanomaterials and its various modes of target sensing applications have not been discussed. Therefore, the present review aims to discuss the nature of the fluorescence originating from graphene derivatives, and shows the design principles of graphene-based fluorescent chemosensors. In addition, we reviewed the sensing of various target analytes through utilizing graphene nanomaterials as donors/acceptors via the FRET process. Furthermore, future directions, challenges, and outlooks for the sensing of graphene-based nanomaterials are also highlighted.

2. Origin of Fluorescence in Graphene-Based Nanomaterials and the FRET Process

The transitions of electrons from various excited states to the ground state are responsible for GO fluorescence. Each band of functionalized GO appears as a result of particular electronic transitions between the antibonding and non-bonding (σ*→n and π*→n) and bonding (π*→π) orbitals (Figure 1) [30,31]. For instance, GO composed of carboxyl-, hydroxyl-, carbonyl-, and epoxy-conjugated rings, thus providing multiple bands in the fluorescence for various electronic transitions. These multiple bands could overlap with each other to produce a broad signal in the emission wavelength.
The introduction of various functionalities, strains, localized domains, lateral sizes, and dopants with GO could tune the energy levels, which leads to significant changes in the shape and width of the signals, as well as peak shifts in the longer wavelength region [32,33]. For instance, when GO is treated with aq. KOH or HNO3, the number of –OH or –COOH functionalities, respectively, increases, which leads to considerable changes in the absorbance and emission wavelengths (Figure 1). Notably, the GO bandgap is generated by the introduction of various functional groups, resulting in sp2 and sp3 hybridized carbon atoms. In addition, tuning the ratio of sp2 and sp3 hybridized carbon shifts the visible fluorescence to the near-infrared (NIR) wavelength [34]. Similar to GO, GQDs also have the same fluorescence properties via the doping process, which modulates the nature of the electronic properties and fluorescence. For instance, when increasing the doping of N in GQDs, the emission wavelength was shifted from green to red, and to NIR via a quantum confinement effect, i.e., π electrons detained in localized sp2 domains [35,36].

Förster Resonance Energy Transfer (FRET)

FRET is a distance-dependent energy transfer from an excited donor fluorophore to another acceptor fluorophore through dipole–dipole interactions, as shown in Figure 2 [1,2,3,4,5]. During excitation, the ground state donor fluorophore reaches an excited state, and the acceptor molecule accepts the transferred energy from the donor and provides a fluorescence signal at the acceptor wavelength, as shown below:
D + hυ → D*
D* + A → D + A*
A* → A + hυ
where h is known as Planck’s constant and υ is the radiation frequency.
In general, the FRET process concerns donating energy from a donor and an acceptor within distances of 6–10 nm. The distance separation between the donor and acceptor should lie on the Forster radius, where complete energy can be successfully exchanged between the donor and acceptor molecules [6,7,8]. The energy transfer occurring between the donor and acceptor is mainly influenced by several factors, including the FRET pair proximity, quantum yield in donors, acceptor in absorption coefficient, and dipoles from the FRET pairs. During this process, there is a decrease in the donor emission intensity and an increase in the acceptor emission intensity, which results in ratiometric signals with an “isoemissive point”. In the FRET process [37,38,39,40,41,42,43], there is a large shift in stoke between the acceptor and donor, which is almost equivalent to the vibronic transitions. The spectral overlapping of the acceptor absorption and donor emission could produce an efficient FRET process in covalent/non-covalent systems [44,45,46,47,48,49,50,51,52].

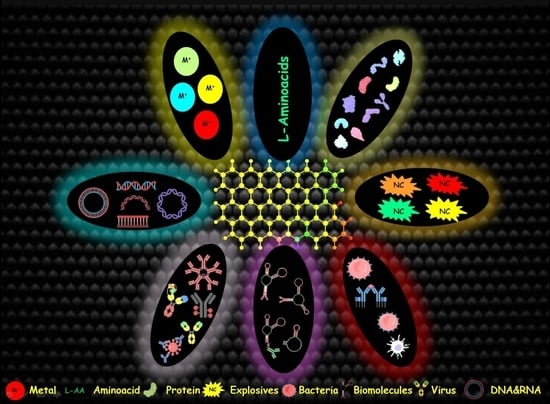
3. Application of Graphene-Based Nanomaterials in Sensing

The present review is focused on designing graphene-based nanomaterials, as well as their sensing of various target analytes, such as metal ions, nitro compounds, amino acids, biomolecules, bacteria, viruses, proteins, DNA, and RNA, as shown in Scheme 1.

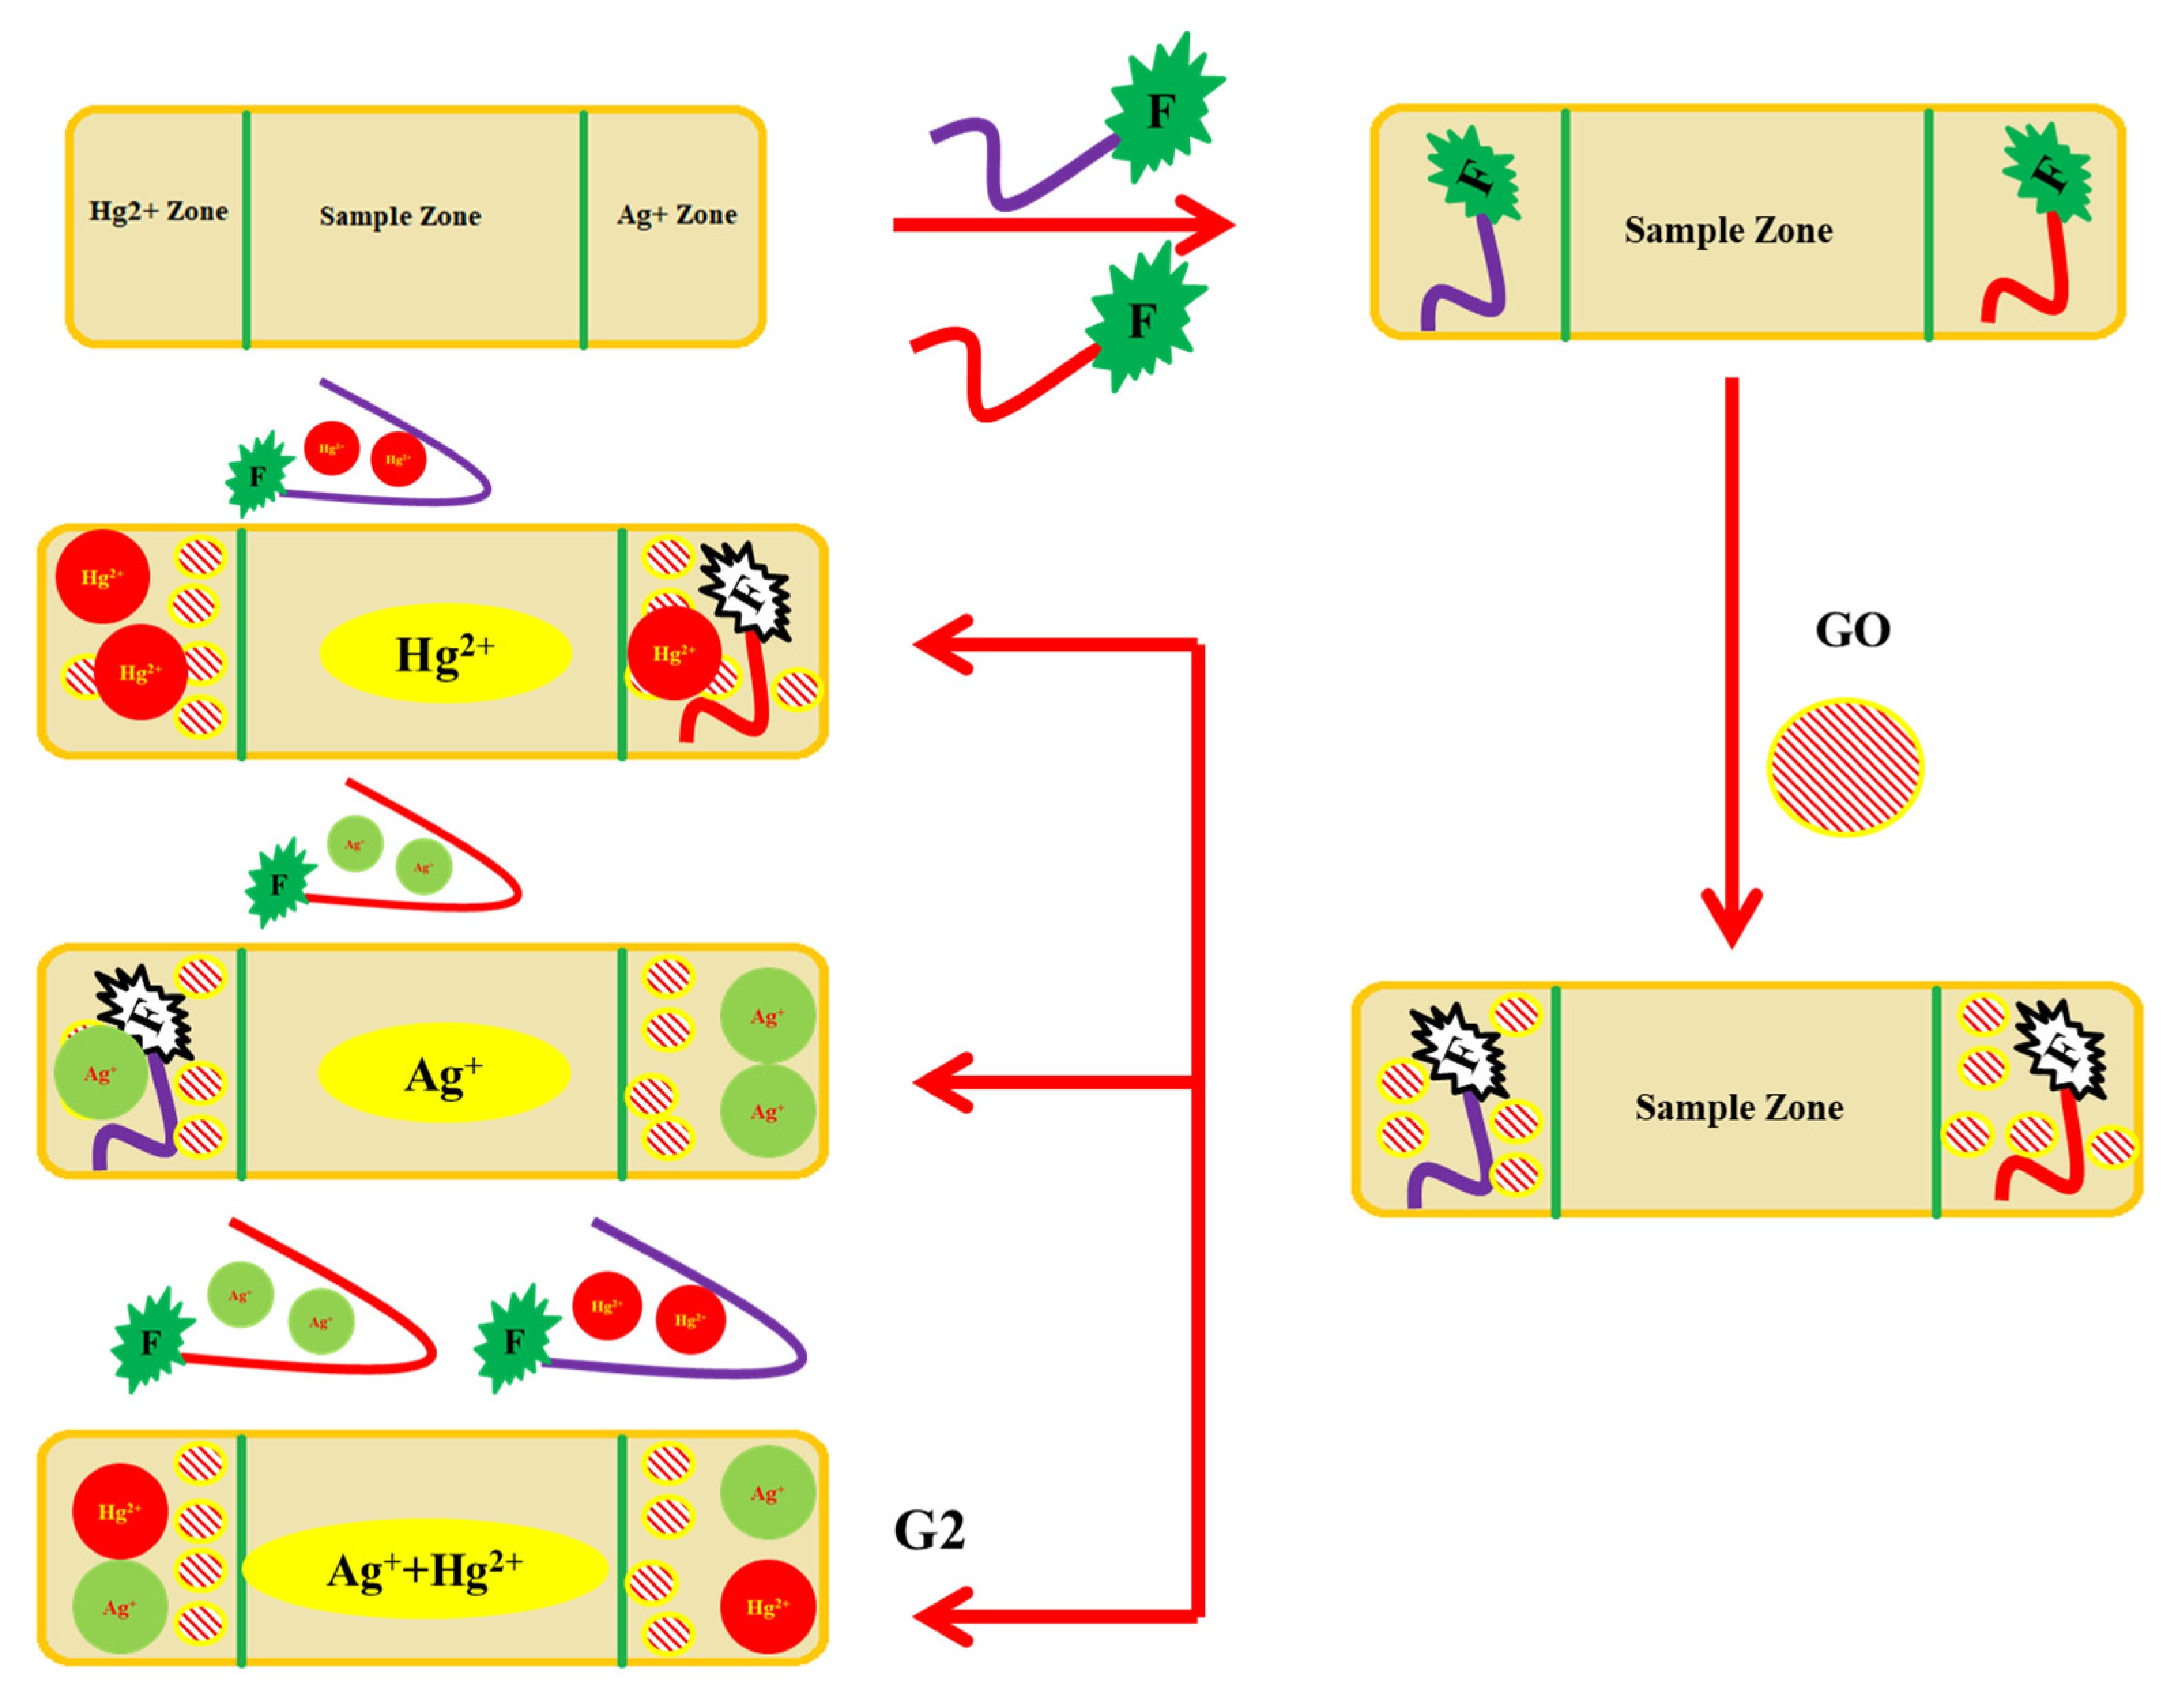
3.1. Metal Ion Sensor

Heavy metal ion contamination in environmental and biological systems causes adverse effects to mankind, even at low concentrations, including cardiovascular, mental defects, neurological, and renal disorders [53]. Keeping this in mind, Housaindokht et al. [54] developed a paper-based aptasensor G1 combining a graphene oxide (GO) quencher via π–π staking, which quenched the aptamer fluorescence through the FRET process (Figure 3). The synthesized aptasensor G1 could selectively detect Pb2+ ions without interference from other metal ions. Briefly, the addition of the Pb2+ ion into the aptasensor enhanced the fluorescence through the conformational switching of the aptasensor from a random coil to a G-quadruplex structure. The Pb2+ ion sensing mechanism of G1 was further applied in various real samples, such as tap water, lake water, milk, and human blood serum, and the ultra-low limit of detection (LOD) was calculated to be 0.5 pM.
Similarly, the same research group [55] reported a low-cost paper-based aptasensor G2 for the detection of Hg2+ and Ag+ ions (Figure 4). In detail, the G2 zones were utilized for dual metal ion detection using a T12 aptamer for the Hg2+ zone and a C12 aptamer for the Ag+ zone. For each zone, Hg2+/Ag+ ions, separately, were injected, while the center part was left out for the sample zone. The detection zone was injected with GO, and the other two zones were already injected with metal ions. After the incubation of solutions to particular zones, the detection zone was monitored using a microscope and the images were captured through the digital camera. The basic mechanism involves the conformational change of a specific aptamer with Hg2+/Ag+, followed by aptamer release from the GO surface through the addition of target metal ions on paper. Finally, the G2 metal ion sensing approach was applied in milk, water, and human serum samples (LOD: 1.33 (Hg2+) and 1.01 pM (Ag+)).
Chandra and co-workers [56] prepared a GQD/nitrogen-doped GQD (NGQD) modified with a DNA G3 probe for the detection of Ag+ ions (Figure 5). Here, GQDs acted as the fluorophore and Ag+ acted as the quencher. Upon the addition of Ag+ ions into G3, the fluorescence intensity was heavily quenched by increasing the concentrations of Ag+ ions and inhibited the FRET process. The LOD of G3 was decreased to 0.05 to 0.02 nM, which was lower than the concentration allowed by the U.S. Environmental Protection Agency (US-EPA).
In 2019, Liu et al. [57] synthesized a fluorescent nanosensor (HRGO-AuNCs) G4 for the detection of Cd2+ based on glutathione-gold nanoclusters (GSH-AuNCs) and a holey reduced graphene oxide (HRGO) quencher. First, HRGO was prepared through the hydrothermal method in the presence of GO, an etchant (H2O2), and a reducing agent (ascorbic acid (AA)) (Figure 6). The FRET process between GSH-AuNCs and HRGO was confirmed through lifetime analysis. After the addition of Cd2+ with G4, the fluorescence intensity was recovered through in situ Cd-GSH complex formation at the AuNC surface, and blocked the FRET process. Furthermore, G4 was applied to real water analysis for the detection of Cd2+ ions (LOD = 42 nM).
Suresh and co-workers [58] fabricated a GO-based carbonaceous fluorescent material G5 using GO and 2-(bis(Pyridin-2-ylmethyl)amino)ethan-1-ol (PAE) through the Steglich esterification method. G5 could detect Zr4+ ions in the presence of other metal ions with an LOD of 27 ng/mL. During the sensing process, Zr4+ ions coordinated with the pyridyl motifs of GO through the FRET process between the PAE donor and GO acceptor (Figure 7). Furthermore, the G5 sensing approach was applied to contaminated water samples from the river. In addition, G5 was further tested with a metal-organic framework (MOF) coated with zirconium ions in an aqueous medium.

3.2. Explosive Sensor

In particular, explosives are handled in military and aerospace fields, and their residues in the environment cause adverse effects to human beings, such as abnormal liver function and anemia [59]. Based on these aspects, Sun et al. [60] fabricated a fluorescent probe G6 through the combination of GQDs and amino groups of APTES via the solvothermal process. G6 was treated against 2,4,6-trinitrotoluene (TNT) for 2 h in an ethanol solution, and later their complexation ability was observed using fluorescence with an excitation wavelength of 360 nm (Figure 8). G6 containing amino groups could adsorb a large number of TNT via pores and could be involved in the accumulation process. During these processes, Meisenheimer complexation was observed between TNT and amino groups, which produced the sensing layer mediated FRET process. In this manner, compared with other nitro groups, TNT had a high binding affinity with G6, and the LOD was calculated to be 0.6 nM. Furthermore, the FRET mechanism was confirmed through the decay curves in the presence and absence of TNT with G6. Notably, the G6 detection approach was successfully applied in TNT-spiked water samples.

3.3. H2O2 Sensor

Hydrogen peroxide (H2O2) is one of the reactive oxygen species (ROS) that plays many roles in biomedical processes, and its disorder causes central nervous system (CNS) and cancer diseases [61]. Therefore, Cui et al. [62] fabricated a core–shell Ag@AuNP as a receptor, which was decorated with a red emissive GQDs donor via π–π stacking between the single-strand DNA modified Ag@AuNPs and GQDs (Figure 9). The absorption spectrum of Ag@AuNPs overlapped with the donor emission spectrum, which produced a strong FRET process, leading to fluorescence quenching. To evaluate the selectivity of the probe G7, it was treated with various interfering compounds. Upon increasing the concentration of H2O2 with G7, fluorescence was enhanced to 560 nm. For further confirmation, 1.0 mM of ROS scavengers was added to G7, the fluorescence recovery was predominantly successful; this confirmed that G7 could detect H2O2, followed by a Fenton-like-reaction. The detection limit was observed to be 0.49 µM. Moreover, probe G7 was analysed against H2O2 detection in living cells.

3.4. Theophylline Sensor

Theophylline (1,3-dimethylxanthine) has been used as a respiratory stimulator and bronchodilator for acute and chronic asthmatic treatments [63]. However, it causes adverse effects on the neurological system and other diseases. Hence, Zhao and co-workers [64] fabricated a GO-QDs-modified ssRNA aptamer for the sensing of theophylline (Figure 10). Initially, quantum dots (QDs) with modified ssRNA were prepared for the sensing of theophylline. The prepared G8 had a low fluorescence intensity because of the presence of a noncovalent assembly between GO and ssRNA. Because of this ability, the fluorescence was quenched via the FRET process from QDs to GO. Under optimal conditions, G8 was used for the detection of theophylline. Upon increasing the concentration of theophylline (0 to 300 nM), the maximum fluorescence intensity was achieved at 120 nM. The LOD of theophylline binding with G8 was calculated to be 4 nM.

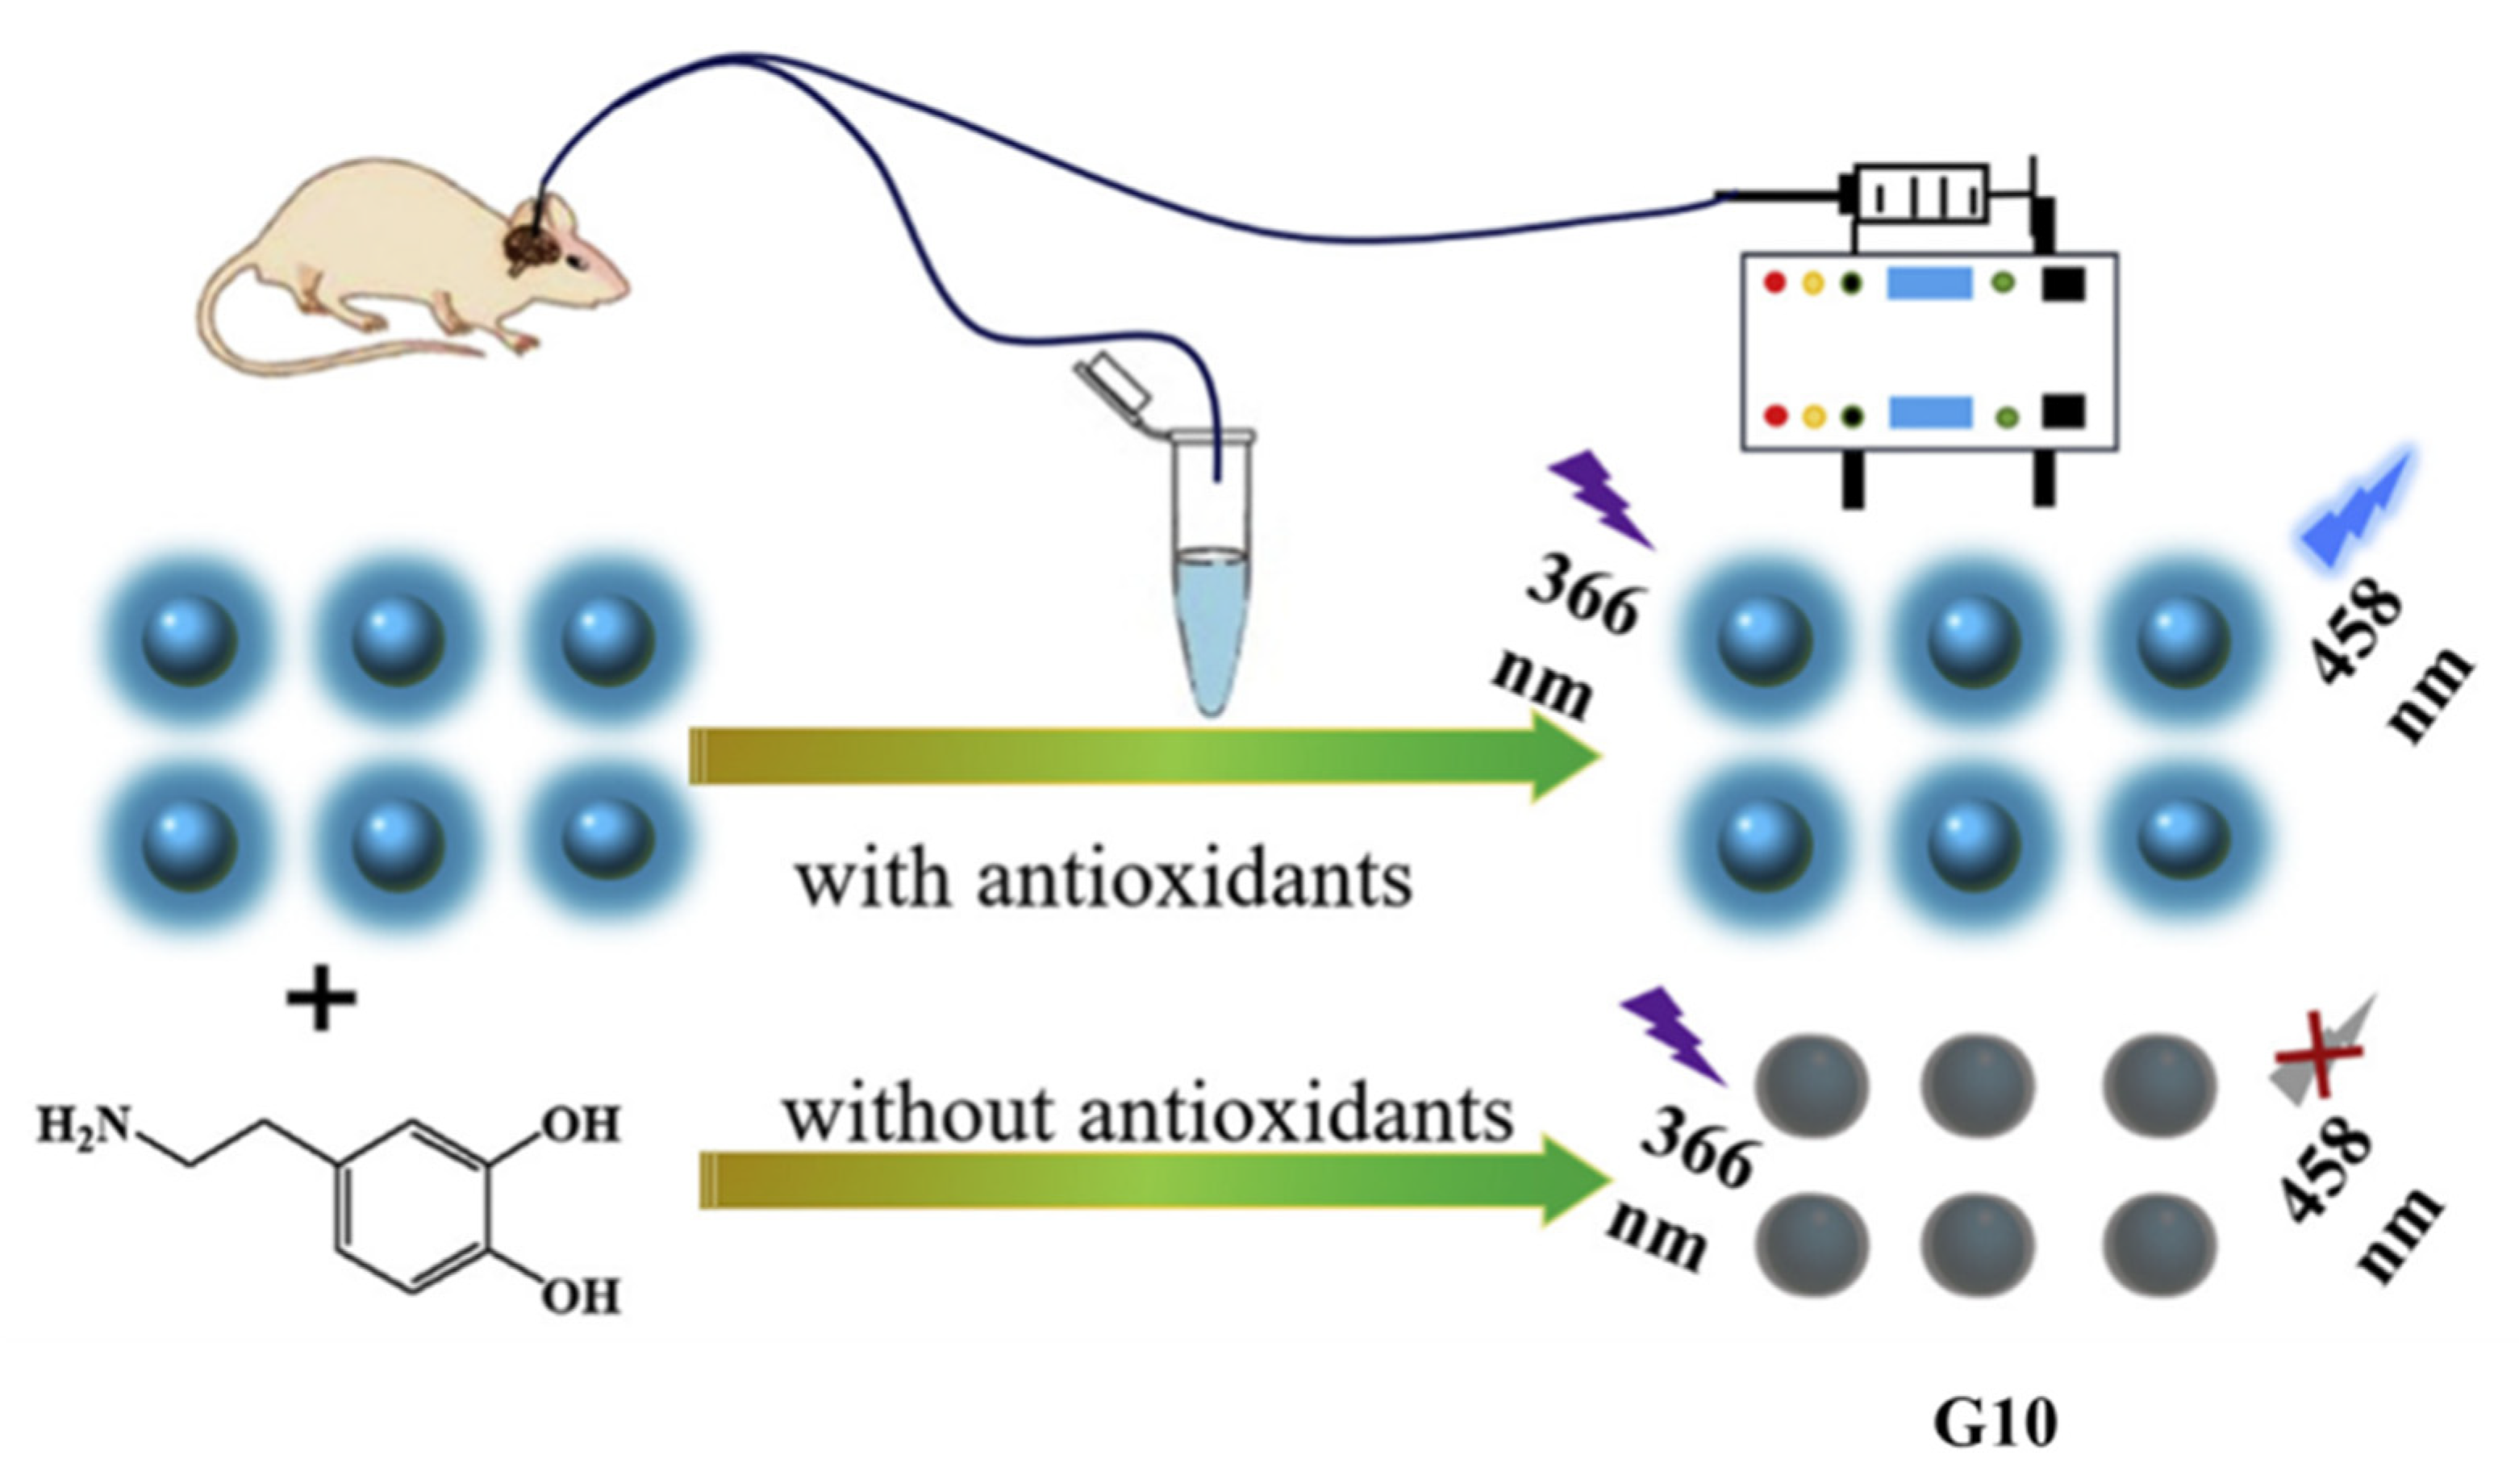
3.5. Glutathione Sensor

Glutathione (GSH) is one of the best defenses against ROS, and plays ample roles in pathological situations [65]. The improper content of GSH at an intracellular level indicates that the human body contains various diseases, such as Alzheimer’s disease, human immunodeficiency virus (HIV), acquired immune deficiency syndrome (AIDS), and diabetes. In addition, tumor cells contain more GSH discrepancy than normal cells, which could be utilized to identify cancer diagnostics. In 2020, Shuang et al. [66] developed a fluorescent nanosensor G9 using the ultra-sonication method of mixing the GQDs-MnO2 complexation in the presence of potassium permanganate under poly(allylamine hydrochloride) (PAH) via an in situ redox procedure (Figure 11). First, to verify the FRET process, a wide range of spectral overlapping was monitored between GQDs and MnO2, and the fluorescence lifetime was also decreased after the binding of MnO2 with GQDs. Upon the addition of GSH into the nanocomposite, the binding between GQDs and GSH decomposed the MnO2 and enhanced the fluorescence. The LOD of G9 was calculated to be 48 nM, and GSH detection was applied in bioimaging and human serum samples.
Zhu et al. [67] reported a fluorescent turn-on assay for antioxidants using GQDs. In the absence of dopamine (DA), GQDs imposed a high fluorescent intensity, which was reduced with the addition of DA and polymerized to form a polydopamine (PDA) film. The PDA settled on the surface of the GQDs (G10), which resulted in quenching their fluorescence through the FRET process (Figure 12). G10 was treated against a series of antioxidants, including GSH, AA, Cys, and HCys, and the fluorescence intensity of G10 was restored. This process was confirmed through time-resolved fluorescent decay analysis. The LOD of G10 with all four antioxidants was reported to be 2.4 nM, 1.5 nM, 4.2 nM, and 4.4 nM, respectively. The developed fluorescent assay G10 was analyzed against rat brains for the detection of GSH, AA, Cys, and Hcys antioxidants.

3.6. Proteins (Cancer Biomarkers) Sensor

Lately, ovarian cancer (OVC) has posed a high risk to women’s health, and late diagnosis can cause death. Protein biomarkers such as cancer antigen 125 (CA125) and human epididymis protein 4 (HE4) are utilized to identify OVC malignancies. Based on the above, Hu and Qu et al. developed p-phenylenediamine functionalized GQDs through a solvothermal method [68]. Of the two GQDs, one exhibited green emission (515 nm) as a donor and the other exhibited red emission (615 nm) (acceptor). The combination of both GQDs showed better spectral overlapping and exhibited the FRET process (Figure 13). G11 was taken for the sensing of different proteins, which showed a high fluorescence intensity against a single protein and combined proteins of HE4. The conjugated HE4 with G11 could detect HE4 through ratiometric sensing with a low detection limit (4.8 pM).

3.7. Biomolecule, Bacteria, and Virus Sensor

In 2019, the FRET-based GO/aptamer complex (G12) was fabricated using the DNase I-assisted cyclic enzymatic signal amplification (CESA) method, and thus could be further utilized to detect specific antibiotics reported by Ban et al. [69]. The synthesized aptasensor was selective to sulfadimethoxine (SD), kanamycin (KM), and ampicillin (AMP), which were linked to cyanine 3 (Cy3), 6-Carboxyfluorescein (FAM), and Cyanin 5 (Cy5), respectively (Figure 14). The fluorescence intensities of three different fluorophores, Cy3, Cy5, and FAM, were quenched through the influence of GO. The LODs of the G12 modified aptasensor with different antibiotics were calculated to be 1.997 (SD), 2.664 (KM), and 2.337 (AMP) ng/mL, respectively. The results from the G12 aptasensor indicated that it could detect multiple antibiotics at the same time, and its sensing approach was further evaluated in milk samples.
In this work, Mohammadnejad and Hosseini et al. [70] proposed a new way of synthesizing probe G13 with the bioconjugation of antibodies with GQDs. The synthesized G13 used for the specific detection of Campylobacter jejuni, which made a new distance between GO and GQDs, was fluorescent ON and FRET OFF (Figure 15). In the absence of Campylobacter jejuni, the distance between GO and GQD was low via π–π stacking and caused fluorescence OFF and FRET ON. The LODs were calculated to be 10 CFU/mL and 100 CFU/mL in the PBS buffer and poultry liver, respectively.
Faridbod and Ganjali et al. [71] synthesized a fluorescent apta-nanobiosenesor G14 with the help of rGQDs in connection with a biological fluid. Here, rGQDs were used as an optical probe, and a biological fluid digoxin (DX) aptamer was used as a sensing element. The synthesized G14 probe was allowed to interact with free biological aptamers, and caused fluorescence enhancement. Later, upon the addition of the targeted biological fluid DX molecule, G14 was bound with DX and resulted in a decreased fluorescence intensity (Figure 16). Reversibility was carried out using oxidized carbon nanotubes with G14-DX complexation aptamers through FRET. Upon the addition of DX into the aptamer, there was a notable interconnection between CNTs and rGQDs, and thus recovery of the rGQDs. The LOD was calculated to be 29.87 ± 1.01 × 10⁻¹² mol L−1. Alternatively, the G14 probe with CNT and rGQDs showed a high selectivity and reproducibility towards the detection of DX, with an ultra-low detection limit of 7.95 ± 0.22 × 10⁻¹² mol L−1. Both aptabiosensors were successfully applied in human urine and serum samples for the detection of DX biological fluid.
Ghourchian and co-workers [72] synthesized a GQD-based fluorescent probe G15 for the selective detection of Vi antigens. The probe iron porphyrin bio-mimicking Fe-N-GQDs were prepared using a solvothermal approach through mechanochemical mixing of Fe, N, and C sources. The prepared G15 could act as an energy donor because of π–π stacking, and GO could act as a quencher (Figure 17). As a result of the specific antibody–antigen interaction in G15 in the presence of the Vi antigen, the distance between the probe and GO was increased, which hindered the FRET process. When an antibody was introduced to G15, the fluorescence response of Fe-N-GQD/Ab was quenched because of the FRET assay. During this process, the antigen and antibody were involved in binding because of the antibody–antigen interaction to make the complexation of Fe-N-GQD/Ab/Ag. Therefore, the gap between the antigen and antibody with GO increased and the fluorescence was recovered. This immunosensor was applied in human serum for the detection of the salmonella Typhi Vi antigen (LOD = 1 pg/mL).
Wang and co-workers [73] constructed a sandwich-structured upconversion nanoparticle (UCNP) G16 based on the combination of an HA aptamer, GO, and polyacrylic acid for the detection of H5N1 IAV hemagglutinin (HA). In G16, the energy transfer process occurred because of the π–π interaction between the aptamer and GO, which reduced the gap between the UCNP and GO (Figure 18). In the presence of HA, G16 enabled the changes in conformations, and moved away from GO with a detection of 60.9 pg mL−1. Based on the above results, the G16 aptamer was also used for the specific detection of H5N1 HA in blood and HA protein in human serum.

3.8. DNA and RNA Sensor

Recently, Salimi et al. [74] developed a GDQDs (G17) probe for the sensing of miRNA-21 via the FRET process (Figure 19). Hence, GDQDs acted as a donor and GQDs behaved as an acceptor. During the sensing process, GDQDs conjugated with DNA showed a high fluorescence intensity in the presence of GQDs via the FRET process. In the presence of miRNA with conjugated GDQDs with DNA, the distance between the GDQDs and GQDs increased, which was confirmed through the average lifetime analysis. The LOD was noted to be 0.5 pM (S/N = 3). Moreover, G17 could be used to detect miRNA-21 in human serum, biological cell lines, and MDA-MB231 living cancer cells.
Zhang et al. [75] developed a fluorescence magnetic nanoparticle (FMNP) modified with target DNA-t (G18), which was bound onto the modified GO (Figure 20). The G18 probe could act as a fluorescence quencher, and was further used for the detection of DNA-t and DNA-c through fluorescence techniques. The detection of hybridization occurred between DNA-t and DNA-c, due to π–π*/n–π* transitions and the sp2 hybridization of GO, which led to a decrease in the fluorescence intensity of G18 through the FRET quenching mechanism (LOD = 0.12 µM).
To overcome antibiotic resistance, Kim et al. [76] synthesized a ZFP-GO (G19) probe through the interconnection of zinc finger proteins (ZFPs) and 2D nanosheet GO. ZFP-labeled quantum dots (QD) were applied over the GO nanosheet, which quenched the fluorescence intensity via the FRET mechanism (Figure 21). In the selective detection of the antibiotic resistance gene (ARG) in bacteria, the probe G19 behaved as a turn OFF and ON in the presence and absence of ARG. During this process, engineered DNA took 10 min to detect the DNA-t, as per the detection system. Notably, G19 was modified with GO-ZFP, which could detect ARG quickly with a LOD of 1 nM. Furthermore, G19 DNA-binding domains could be utilized for the specific detection of dsDNA.
Xiao and He et al. [77] fabricated GOQDs (G20) for the detection of DNA sequences (Figure 22). Briefly, G20 was treated with three different fluorescent dyes to check the photoluminescence properties and quenching effect. The selected fluorescent dyes were tested against prepared G20 at different wavelengths to observe the quenching effect. Many hydroxyl groups in G20 exhibited weak fluorescence and behaved as a fluorescent quencher for conjugated dyes in the real-time fluorescence quantitative polymerase chain reaction (qRT-PCR) via the FRET process. Furthermore, GOQDs combined with the qRT-PCR system could detect DNA sequences, with a high detection rate of 104–1010 copies per µL range.
The comparison of all essential properties, such as sensors, analytes, LOD, binding constants, and sensing mechanisms, is specified in Table 1.

4. Conclusions and Perspectives

In this review, we have summarized the significant progress in graphene-based nanomaterials such as GO, rGO, and GQDs, and discussed the synthesis, fluorescence properties, and FRET-based sensing of various target analytes. In the past 3 years, various methodologies have been developed to fabricate graphene-based pure and composite nanomaterials and their excellent photophysical performances, bringing them into practical applications. Despite this, various fabrication methodologies have been reported in graphene-related material research, but they are still at the primary stage in this field. For instance, atom-precise structures and well-defined protocols have not been developed to date. Therefore, start-of-the-art methodologies, structural relationships and properties, and technological fields of applications need to be well explored. In addition, graphene-based optical materials and their properties related to theoretical studies can be implemented in the future to obtain better-defined materials.
In the field of sensing, we believe FRET-based sensors are less explored and most graphene-based nanomaterials are involved in fluorescence quenching. However, knowing how to avoid the quenching process and achieve better selectivity is far from our understanding. Moreover, a single sensor for multi-analyte-detection-approach-related investigations and their mechanisms are also less studied. Therefore, more understanding is required in the case of target sensing with high selectivity. On the other hand, doping and surface modifications are important, and there seems to be a long way to go before understanding the complex mechanism. Until now, some preliminary research has been carried out in this field, and major opportunities will be available in the future. More importantly, commercial-sensing-device-fabrication-related research is still at a basic level, and enormous efforts are required in order to achieve a final sensor device meeting industrial standards.
With inorganic/organic species in graphene composites, transduction mechanisms and specific selectivity-related questions are difficult to answer. These issues can be addressed by suitable functionality introduced on the surface of the composite and by understanding the role of functional fluorophores. Moreover, the development of a biosensor-related FRET sensing mechanism is in the initial stages. In addition, the immobilization of biomolecules in the composite system might increase the biocompatibility and could produce suitable binding sites for the target analytes.
To summarize, graphene-based-nanomaterial-related research and its potential applications have become an exciting field of interest within a short period of time. We expect that sensing fields need to cross the boundary and produce novel synthetic methods, new concepts of sensing, methodologies, optical properties, and so on. To develop a robust FRET-based sensing device, we need to understand the material synthesis and surface modification, as well as how these fabricated materials can affect the optical properties, depth understanding of transduction mechanism, and better selectivity. Similarly, we need to explore how the above sensing concepts could be implemented with other materials, which could open a new avenue for future research directions.

Author Contributions

Conceptualization G.P., K.V. and R.N., writing—original draft preparation, G.P., K.V. and C.I.D., writing—review and editing, G.P., K.V. and R.N. All authors have read and agreed to the published version of the manuscript.

Funding

This research received no external funding.

Institutional Review Board Statement

Not applicable.

Informed Consent Statement

Not applicable.

Conflicts of Interest

The authors declare no conflict of interest.

References

  1. Kadian, S.; Sethi, S.K.; Manik, G. Recent advancements in synthesis and property control of graphene quantum dots for biomedical and optoelectronic applications. Mater. Chem. Front. 2021, 5, 627–658. [Google Scholar] [CrossRef]
  2. Zahra, Q.U.A.; Luo, Z.; Ali, R.; Khan, M.I.; Li, F.; Qiu, B. Advances in Gold Nanoparticles-Based Colorimetric Aptasensors for the Detection of Antibiotics: An Overview of the Past Decade. Nanomaterials 2021, 11, 840. [Google Scholar] [CrossRef] [PubMed]
  3. Yim, Y.; Shin, H.; Ahn, S.M.; Min, D.H. Graphene oxide-based fluorescent biosensors and their biomedical applications in diagnosis and drug discovery. Chem. Commun. 2021, 57, 9820–9833. [Google Scholar] [CrossRef] [PubMed]
  4. Zahra, Q.U.A.; Fang, X.; Luo, Z.; Ullah, S.; Fatima, S.; Batool, S.; Qiu, B.; Shahzad, F. Graphene Based Nanohybrid Aptasensors in Environmental Monitoring: Concepts, Design and Future Outlook. Crit. Rev. Anal. Chem. 2022, 1–22. [Google Scholar] [CrossRef]
  5. Milosavljevic, V.; Mitrevska, K.; Adam, V. Benefits of oxidation and size reduction of graphene/graphene oxide nanoparticles in biosensing application: Classification of graphene/graphene oxide nanoparticles. Sensors Actuators B Chem. 2022, 353, 131122. [Google Scholar] [CrossRef]
  6. Gao, W.; Alemany, L.B.; Ci, L.; Ajayan, P.M. New insights into the structure and reduction of graphite oxide. Nat. Chem. 2009, 1, 403–408. [Google Scholar] [CrossRef]
  7. Huang, X.; Yin, Z.; Wu, S.; Qi, X.; He, Q.; Zhang, Q.; Yan, Q.; Boey, F.; Zhang, H. Graphene-Based Materials: Synthesis, Characterization, Properties, and Applications. Small 2011, 7, 1876–1902. [Google Scholar] [CrossRef]
  8. Hunt, A.; Dikin, D.A.; Kurmaev, E.Z.; Boyko, T.D.; Bazylewski, P.; Chang, G.S.; Moewes, A. Epoxide Speciation and Functional Group Distribution in Graphene Oxide Paper-Like Materials. Adv. Funct. Mater. 2012, 22, 3950–3957. [Google Scholar] [CrossRef]
  9. Benjamin, C.B. XIII. On the atomic weight of graphite. Philos. Trans. R. Soc. Lond. 1859, 149, 249–259. [Google Scholar] [CrossRef] [Green Version]
  10. Hummers, W.S.; Offeman, R.E. Preparation of Graphitic Oxide. J. Am. Chem. Soc. 2002, 80, 1339. [Google Scholar] [CrossRef]
  11. Staudenmaier, L. Verfahren zur Darstellung der Graphitsäure. Ber. Der Dtsch. Chem. Ges. 1898, 31, 1481–1487. [Google Scholar] [CrossRef] [Green Version]
  12. Imani, M.; Mohajeri, N.; Rastegar, M.; Zarghami, N. Recent advances in FRET-Based biosensors for biomedical applications. Anal. Biochem. 2021, 630, 114323. [Google Scholar] [CrossRef] [PubMed]
  13. Klymchenko, A.S. Solvatochromic and Fluorogenic Dyes as Environment-Sensitive Probes: Design and Biological Applications. Acc. Chem. Res. 2017, 50, 366–375. [Google Scholar] [CrossRef] [PubMed] [Green Version]
  14. Zhang, Y.; Ren, B.; Zhang, D.; Liu, Y.; Zhang, M.; Zhao, C.; Zheng, J. Design principles and fundamental understanding of biosensors for amyloid-β detection. J. Mater. Chem. B 2020, 8, 6179–6196. [Google Scholar] [CrossRef]
  15. Wang, L.; Wang, J.; Xia, S.; Wang, X.; Yu, Y.; Zhou, H.; Liu, H. A FRET-based near-infrared ratiometric fluorescent probe for detection of mitochondria biothiol. Talanta 2020, 219, 121296. [Google Scholar] [CrossRef]
  16. Wu, L.; Huang, C.; Emery, B.P.; Sedgwick, A.C.; Bull, S.D.; He, X.P.; Tian, H.; Yoon, J.; Sessler, J.L.; James, T.D. Förster resonance energy transfer (FRET)-based small-molecule sensors and imaging agents. Chem. Soc. Rev. 2020, 49, 5110–5139. [Google Scholar] [CrossRef]
  17. Ghosh, A.; Chizhik, A.I.; Karedla, N.; Enderlein, J. Graphene- and metal-induced energy transfer for single-molecule imaging and live-cell nanoscopy with (sub)-nanometer axial resolution. Nat. Protoc. 2021, 16, 3695–3715. [Google Scholar] [CrossRef]
  18. He, L.; Lu, D.Q.; Liang, H.; Xie, S.; Luo, C.; Hu, M.; Xu, L.; Zhang, X.; Tan, W. Fluorescence Resonance Energy Transfer-Based DNA Tetrahedron Nanotweezer for Highly Reliable Detection of Tumor-Related mRNA in Living Cells. ACS Nano 2017, 11, 4060–4066. [Google Scholar] [CrossRef] [Green Version]
  19. Kim, J.; Park, S.J.; Min, D.H. Emerging Approaches for Graphene Oxide Biosensor. Anal. Chem. 2016, 89, 232–248. [Google Scholar] [CrossRef]
  20. Pehlivan, Z.S.; Torabfam, M.; Kurt, H.; Ow-Yang, C.; Hildebrandt, N.; Yüce, M. Aptamer and nanomaterial based FRET biosensors: A review on recent advances (2014–2019). Microchim. Acta 2019, 186, 563. [Google Scholar] [CrossRef]
  21. Su, S.; Chen, S.; Fan, C. Recent advances in two-dimensional nanomaterials-based electrochemical sensors for environmental analysis. Green Energy Environ. 2018, 3, 97–106. [Google Scholar] [CrossRef]
  22. Su, S.; Wu, W.; Gao, J.; Lu, J.; Fan, C. Nanomaterials-based sensors for applications in environmental monitoring. J. Mater. Chem. 2012, 22, 18101–18110. [Google Scholar] [CrossRef]
  23. Suguna, S.; David, C.I.; Prabhu, J.; Nandhakumar, R. Functionalized graphene oxide materials for the fluorometric sensing of various analytes: A mini review. Mater. Adv. 2021, 2, 6197–6212. [Google Scholar] [CrossRef]
  24. Ueno, Y. Graphene-Based FRET Aptasensors. Anal. Sci. 2021, 37, 439–446. [Google Scholar] [CrossRef] [PubMed]
  25. Li, B.; Wang, Y.; Huang, L.; Qu, H.; Han, Z.; Wang, Y.; Kipper, M.J.; Belfiore, L.A.; Tang, J. Review of performance improvement strategies for doped graphene quantum dots for fluorescence-based sensing. Synth. Met. 2021, 276, 116758. [Google Scholar] [CrossRef]
  26. Ansari, A.A.; Thakur, V.K.; Chen, G. Functionalized upconversion nanoparticles: New strategy towards FRET-based luminescence bio-sensing. Coord. Chem. Rev. 2021, 436, 213821. [Google Scholar] [CrossRef]
  27. Loh, K.P.; Bao, Q.; Eda, G.; Chhowalla, M. Graphene oxide as a chemically tunable platform for optical applications. Nat. Chem. 2010, 2, 1015–1024. [Google Scholar] [CrossRef]
  28. Kaiser, A.B.; Cristina, G.N.; Sundaram, R.S.; Burghard, M.; Kern, K. Electrical Conduction Mechanism in Chemically Derived Graphene Monolayers. Nano Lett. 2009, 9, 1787–1792. [Google Scholar] [CrossRef]
  29. Eda, G.; Lin, Y.Y.; Miller, S.; Chen, C.W.; Su, W.F.; Chhowalla, M. Transparent and conducting electrodes for organic electronics from reduced graphene oxide. Appl. Phys. Lett. 2008, 92, 233305. [Google Scholar] [CrossRef]
  30. Zhu, S.; Zhang, J.; Qiao, C.; Tang, S.; Li, Y.; Yuan, W.; Li, B.; Tian, L.; Liu, F.; Hu, R.; et al. Strongly green-photoluminescent graphene quantum dots for bioimaging applications. Chem. Commun. 2011, 47, 6858–6860. [Google Scholar] [CrossRef]
  31. Li, M.; Cushing, S.K.; Zhou, X.; Guo, S.; Wu, N. Fingerprinting photoluminescence of functional groups in graphene oxide. J. Mater. Chem. 2012, 22, 23374–23379. [Google Scholar] [CrossRef]
  32. Zhu, Y.; Murali, S.; Cai, W.; Li, X.; Suk, J.W.; Potts, J.R.; Ruoff, R.S. Graphene and Graphene Oxide: Synthesis, Properties, and Applications. Adv. Mater. 2010, 22, 3906–3924. [Google Scholar] [CrossRef] [PubMed]
  33. Krishnan, S.K.; Singh, E.; Singh, P.; Meyyappan, M.; Nalwa, H.S. A review on graphene-based nanocomposites for electrochemical and fluorescent biosensors. RSC Adv. 2019, 9, 8778–8881. [Google Scholar] [CrossRef] [PubMed]
  34. Swathi, R.S.; Sebastian, K.L. Resonance energy transfer from a dye molecule to graphene. J. Chem. Phys. 2008, 129, 054703. [Google Scholar] [CrossRef]
  35. Swathi, R.S.; Sebastian, K.L. Long range resonance energy transfer from a dye molecule to graphene has (distance)−4 dependence. J. Chem. Phys. 2009, 130, 086101. [Google Scholar] [CrossRef]
  36. Zhang, Z.; Yang, J.; Pang, W.; Yan, G. An aptamer-based fluorescence probe for facile detection of lipopolysaccharide in drinks. RSC Adv. 2017, 7, 54920–54926. [Google Scholar] [CrossRef] [Green Version]
  37. Zheng, P.; Wu, N. Fluorescence and Sensing Applications of Graphene Oxide and Graphene Quantum Dots: A Review. Chem. –Asian J. 2017, 12, 2343–2353. [Google Scholar] [CrossRef]
  38. Gilboa, T.; Garden, P.M.; Cohen, L. Single-molecule analysis of nucleic acid biomarkers—A review. Anal. Chim. Acta 2020, 1115, 61–85. [Google Scholar] [CrossRef]
  39. Goldoni, R.; Farronato, M.; Connelly, S.T.; Tartaglia, G.M.; Yeo, W.H. Recent advances in graphene-based nanobiosensors for salivary biomarker detection. Biosens. Bioelectron. 2021, 171, 112723. [Google Scholar] [CrossRef]
  40. Johnson, A.P.; Sabu, C.; Swamy, N.K.; Anto, A.; Gangadharappa, H.V.; Pramod, K. Graphene nanoribbon: An emerging and efficient flat molecular platform for advanced biosensing. Biosens. Bioelectron. 2021, 184, 113245. [Google Scholar] [CrossRef]
  41. Lahcen, A.A.; Rauf, S.; Beduk, T.; Durmus, C.; Aljedaibi, A.; Timur, S.; Alshareef, H.N.; Amine, A.; Wolfbeis, O.S.; Salama, K.N. Electrochemical sensors and biosensors using laser-derived graphene: A comprehensive review. Biosens. Bioelectron. 2020, 168, 112565. [Google Scholar] [CrossRef] [PubMed]
  42. Siefe, C.; Mehlenbacher, R.D.; Peng, C.S.; Zhang, Y.; Fischer, S.; Lay, A.; McLellan, C.A.; Alivisatos, A.P.; Chu, S.; Dionne, J.A. Sub-20 nm Core-Shell-Shell Nanoparticles for Bright Upconversion and Enhanced Förster Resonant Energy Transfer. J. Am. Chem. Soc. 2019, 141, 16997–17005. [Google Scholar] [CrossRef] [PubMed]
  43. Wang, L.; Yan, R.; Huo, Z.; Wang, L.; Zeng, J.; Bao, J.; Wang, X.; Peng, Q.; Li, Y. Fluorescence Resonant Energy Transfer Biosensor Based on Upconversion-Luminescent Nanoparticles. Angew. Chem. Int. Ed. 2005, 44, 6054–6057. [Google Scholar] [CrossRef] [PubMed]
  44. Jin, B.; Wang, S.; Lin, M.; Jin, Y.; Zhang, S.; Cui, X.; Gong, Y.; Li, A.; Xu, F.; Lu, T.J. Upconversion nanoparticles based FRET aptasensor for rapid and ultrasenstive bacteria detection. Biosens. Bioelectron. 2017, 90, 525–533. [Google Scholar] [CrossRef] [PubMed]
  45. He, Y.; Jiao, B. DNA covalently linked to graphene oxide for biotin–streptavidin interaction assay. Talanta 2017, 163, 140–145. [Google Scholar] [CrossRef]
  46. Yan, Q.; Chen, Z.H.; Xue, S.F.; Han, X.Y.; Lin, Z.Y.; Zhang, S.; Shi, G.; Zhang, M. Lanthanide-doped nanoparticles encountering porphyrin hydrate: Boosting a dual-mode optical nanokit for Cu2+ sensing. Sensors Actuators B Chem. 2018, 268, 108–114. [Google Scholar] [CrossRef]
  47. Tu, D.; Liu, L.; Ju, Q.; Liu, Y.; Zhu, H.; Li, R.; Chen, X. Time-Resolved FRET Biosensor Based on Amine-Functionalized Lanthanide-Doped NaYF4 Nanocrystals. Angew. Chem. Int. Ed. 2011, 50, 6306–6310. [Google Scholar] [CrossRef]
  48. Jung, J.H.; Cheon, D.S.; Liu, F.; Lee, K.B.; Seo, T.S. A Graphene Oxide Based Immuno-biosensor for Pathogen Detection. Angew. Chem. 2010, 122, 5844–5847. [Google Scholar] [CrossRef]
  49. Hai, X.; Li, Y.; Yu, K.; Yue, S.; Li, Y.; Song, W.; Bi, S.; Zhang, X. Synergistic in-situ growth of silver nanoparticles with nanozyme activity for dual-mode biosensing and cancer theranostics. Chin. Chem. Lett. 2021, 32, 1215–1219. [Google Scholar] [CrossRef]
  50. Soundharraj, P.; Dhinasekaran, D.; Aruna, P.; Ganesan, S. Facile synthesis of biomass silica-silver colloidal nanoparticles and its application as highly sensitive fluorescent biosensor. Surf. Interfaces 2021, 23, 101010. [Google Scholar] [CrossRef]
  51. Li, Z.; Hu, J.; Lou, Z.; Zeng, L.; Zhu, M. Molecularly imprinted photoelectrochemical sensor for detecting tetrabromobisphenol A in indoor dust and water. Microchim. Acta 2021, 188, 320. [Google Scholar] [CrossRef] [PubMed]
  52. Li, Z.; Zhu, M. Detection of pollutants in water bodies: Electrochemical detection or photo-electrochemical detection? Chem. Commun. 2020, 56, 14541–14552. [Google Scholar] [CrossRef] [PubMed]
  53. Jaishankar, M.; Tseten, T.; Anbalagan, N.; Mathew, B.B.; Beeregowda, K.N. Toxicity, mechanism and health effects of some heavy metals. Interdiscip. Toxicol. 2014, 7, 60–72. [Google Scholar] [CrossRef] [PubMed] [Green Version]
  54. Khoshbin, Z.; Housaindokht, M.R.; Izadyar, M.; Verdian, A.; Bozorgmehr, M.R. A simple paper-based aptasensor for ultrasensitive detection of lead (II) ion. Anal. Chim. Acta 2019, 1071, 70–77. [Google Scholar] [CrossRef]
  55. Khoshbin, Z.; Housaindokht, M.R.; Verdian, A. A low-cost paper-based aptasensor for simultaneous trace-level monitoring of mercury (II) and silver (I) ions. Anal. Biochem. 2020, 597, 113689. [Google Scholar] [CrossRef]
  56. Mandal, D.; Khatun, S.; Gupta, A.N.; Chandra, A. DNA supported graphene quantum dots for Ag ion sensing. Nanotechnology 2019, 30, 255501. [Google Scholar] [CrossRef] [Green Version]
  57. Mo, F.; Ma, Z.; Wu, T.; Liu, M.; Zhang, Y.; Li, H.; Yao, S. Holey reduced graphene oxide inducing sensitivity enhanced detection nanoplatform for cadmium ions based on glutathione-gold nanocluster. Sensors Actuators B Chem. 2019, 281, 486–492. [Google Scholar] [CrossRef]
  58. Asha, J.B.; Suresh, P. Covalently Modified Graphene Oxide as Highly Fluorescent and Sustainable Carbonaceous Chemosensor for Selective Detection of Zirconium ion in Complete Aqueous Medium. ACS Sustain. Chem. Eng. 2020, 8, 14301–14311. [Google Scholar] [CrossRef]
  59. Lima, D.R.S.; Bezerra, M.L.S.; Neves, E.B.; Moreira, F.R. Impact of ammunition and military explosives on human health and the environment. Rev. Environ. Health 2011, 26, 101–110. [Google Scholar] [CrossRef]
  60. Tian, R.; Ji, P.; Wang, L.; Zhang, H.; Sun, J. TNT sensor based on accumulation layer and effective distance of FRET mechanism with ultra-high sensitivity. Microchem. J. 2021, 160, 105706. [Google Scholar] [CrossRef]
  61. Liu, J.; Li, Y.; Chen, S.; Lin, Y.; Lai, H.; Chen, B.; Chen, T. Biomedical Application of Reactive Oxygen Species–Responsive Nanocarriers in Cancer, Inflammation, and Neurodegenerative Diseases. Front. Chem. 2020, 8, 838. [Google Scholar] [CrossRef] [PubMed]
  62. Shang, L.L.; Song, X.; Niu, C.B.; Lv, Q.Y.; Li, C.L.; Cui, H.F.; Zhang, S. Red fluorescent nanoprobe based on Ag@Au nanoparticles and graphene quantum dots for H2O2 determination and living cell imaging. Microchim. Acta 2021, 188, 291. [Google Scholar] [CrossRef] [PubMed]
  63. Hallworth, M. Therapeutic drug monitoring. Clin. Biochem. Metab. Clin. Asp. Third Ed. 2014, 767–786. [Google Scholar] [CrossRef]
  64. Wu, J.F.; Gao, X.; Ge, L.; Zhao, G.C.; Wang, G.F. A fluorescence sensing platform of theophylline based on the interaction of RNA aptamer with graphene oxide. RSC Adv. 2019, 9, 19813–19818. [Google Scholar] [CrossRef] [PubMed] [Green Version]
  65. Sharifi-Rad, M.; Anil Kumar, N.V.; Zucca, P.; Varoni, E.M.; Dini, L.; Panzarini, E.; Rajkovic, J.; Tsouh Fokou, P.V.; Azzini, E.; Peluso, I.; et al. Lifestyle, Oxidative Stress, and Antioxidants: Back and Forth in the Pathophysiology of Chronic Diseases. Front. Physiol. 2020, 11, 694. [Google Scholar] [CrossRef] [PubMed]
  66. Wang, Q.; Li, L.; Wang, X.; Dong, C.; Shuang, S. Graphene quantum dots wrapped square-plate-like MnO2 nanocomposite as a fluorescent turn-on sensor for glutathione. Talanta 2020, 219, 121180. [Google Scholar] [CrossRef] [PubMed]
  67. Zhu, S.; Yan, X.; Qiu, J.; Sun, J.; Zhao, X.E. Turn-on fluorescent assay for antioxidants based on their inhibiting polymerization of dopamine on graphene quantum dots. Spectrochim. Acta Part A Mol. Biomol. Spectrosc. 2020, 225, 117516. [Google Scholar] [CrossRef]
  68. Bharathi, G.; Lin, F.; Liu, L.; Ohulchanskyy, T.Y.; Hu, R.; Qu, J. An all-graphene quantum dot Förster resonance energy transfer (FRET) probe for ratiometric detection of HE4 ovarian cancer biomarker. Colloids Surfaces B Biointerfaces 2021, 198, 111458. [Google Scholar] [CrossRef]
  69. Youn, H.; Lee, K.; Her, J.; Jeon, J.; Mok, J.; So, J.-i.; Shin, S.; Ban, C. Aptasensor for multiplex detection of antibiotics based on FRET strategy combined with aptamer/graphene oxide complex. Sci. Rep. 2019, 9, 7659. [Google Scholar] [CrossRef] [Green Version]
  70. Dehghani, Z.; Mohammadnejad, J.; Hosseini, M.; bakhshi, B.; Rezayan, A.H. Whole cell FRET immunosensor based on graphene oxide and graphene dot for Campylobacter jejuni detection. Food Chem. 2020, 309, 125690. [Google Scholar] [CrossRef]
  71. Elmizadeh, H.; Faridbod, F.; Soleimani, M.; Ganjali, M.R.; Bardajee, G.R. Fluorescent apta-nanobiosensors for fast and sensitive detection of digoxin in biological fluids using rGQDs: Comparison of two approaches for immobilization of aptamer. Sensors Actuators B Chem. 2020, 302, 127133. [Google Scholar] [CrossRef]
  72. Kamal, Z.; Zarei Ghobadi, M.; Mohseni, S.M.; Ghourchian, H. High-performance porphyrin-like graphene quantum dots for immuno-sensing of Salmonella typhi. Biosens. Bioelectron. 2021, 188, 113334. [Google Scholar] [CrossRef] [PubMed]
  73. Zhao, Q.; Du, P.; Wang, X.; Huang, M.; Sun, L.D.; Wang, T.; Wang, Z. Upconversion Fluorescence Resonance Energy Transfer Aptasensors for H5N1 Influenza Virus Detection. ACS Omega 2021, 6, 15236–15245. [Google Scholar] [CrossRef] [PubMed]
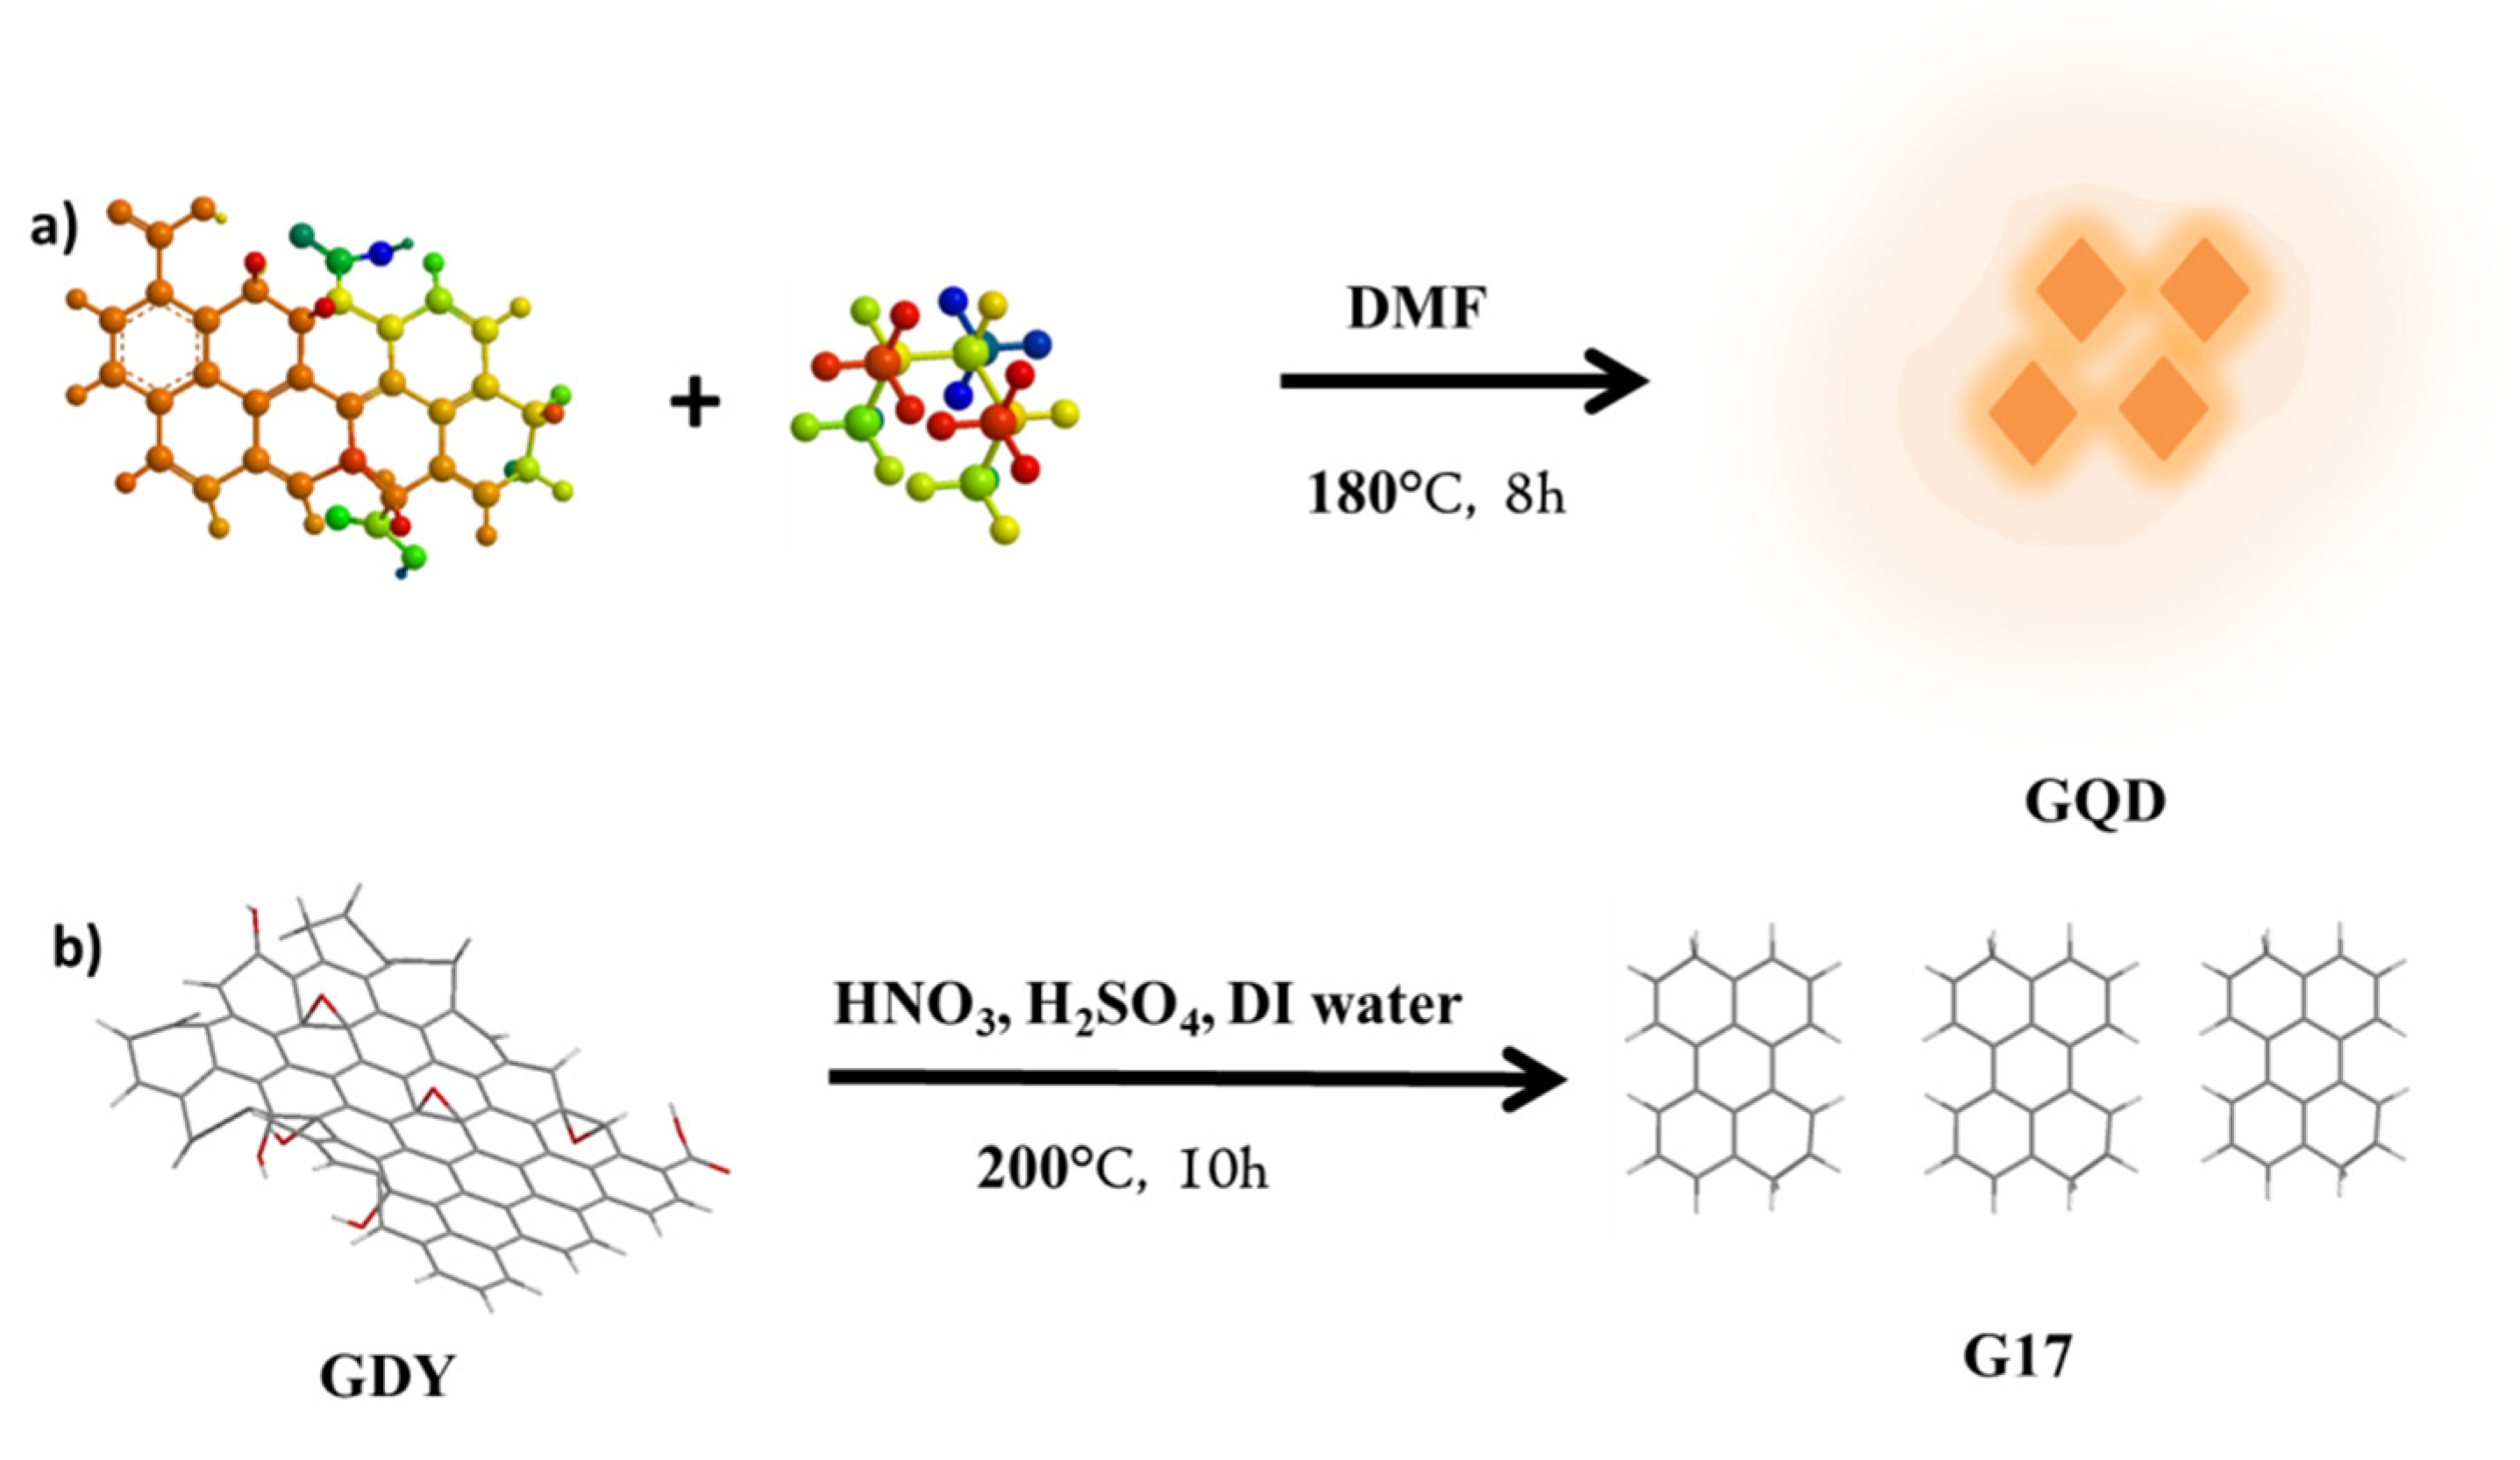
  74. Bahari, D.; Babamiri, B.; Salimi, A.; Rashidi, A. Graphdiyne/graphene quantum dots for development of FRET ratiometric fluorescent assay toward sensitive detection of miRNA in human serum and bioimaging of living cancer cells. J. Lumin. 2021, 239, 118371. [Google Scholar] [CrossRef]
  75. Balaji, A.; Yang, S.; Wang, J.; Zhang, J. Graphene Oxide-Based Nanostructured DNA Sensor. Biosensors 2019, 9, 74. [Google Scholar] [CrossRef] [Green Version]
  76. Ha, D.T.; Nguyen, V.-T.; Kim, M.-S. Graphene Oxide-Based Simple and Rapid Detection of Antibiotic Resistance Gene via Quantum Dot-Labeled Zinc Finger Proteins. Anal. Chem. 2021, 93, 8459–8466. [Google Scholar] [CrossRef]
  77. Hu, C.; Yang, Z.; Song, Z.; Xiao, L.; He, Y. A strategy for preparing non-fluorescent graphene oxide quantum dots as fluorescence quenchers in quantitative real-time PCR. RSC Adv. 2020, 10, 14944–14952. [Google Scholar] [CrossRef] [Green Version]
Figure 1. (a,b) Absorption and emission spectra of GO treated with KOH and HNO3 in water (λex. = 420 nm). Inset: energy level diagram for multiple electronic transitions. Reprinted from [32] with permission from Wiley.
Applsci 12 06844 g001
Figure 2. Schematic representation of the FRET process in the donor and acceptor containing system.
Applsci 12 06844 g002
Scheme 1. Graphical representation of the graphene-based nanomaterial design strategy and its sensing of various target analytes.
Applsci 12 06844 sch001
Figure 3. Schematic illustration of the preparation of G1 and its Pb2+ ion sensing. Reprinted from [54] with permission from Elsevier.
Applsci 12 06844 g003
Figure 4. Schematic diagrams of the preparation of G2 and its dual Hg2+ and Ag+ sensing approaches. Reprinted from [55] with permission from Elsevier.
Applsci 12 06844 g004
Figure 5. Graphical diagram of GQDs/NGQD modified with DNA (G3) for the sensing of Ag+. Reprinted from [56] with permission from IOP Publishing Ltd.
Applsci 12 06844 g005
Figure 6. Preparation of HRGO and graphical representation of Cd2+ ion sensing using GSH-AuNCs and HRGO (G4). Reprinted from [57] with permission from Elsevier.
Applsci 12 06844 g006
Figure 7. Proposed sensing mechanism of (G5) in the presence of Zr4+ via FRET process. Reprinted from [58] with permission from the American Chemical Society.
Applsci 12 06844 g007
Figure 8. The plausible sensing mechanism of GQDs-APTES (G6) with TNT via the FRET process. Reprinted from [60] with permission from Elsevier.
Applsci 12 06844 g008
Figure 9. Schematic representation of the fabrication of Ag@AuNPs-DNA/GQDs (G7) and the H2O2 sensing mechanism in living cells. Reprinted from [62] with permission from Springer.
Applsci 12 06844 g009
Figure 10. Schematic illustration of the fabrication of GO-ssRNA QDs (G8) and their sensing mechanism. Reprinted from [64] with the permission from the Royal Society of Chemistry.
Applsci 12 06844 g010
Figure 11. Schematic diagrams of the preparation of the GQDs-MnO2 nanocomposite (G9) and GSH responsiveness with the fluorescence off–on process. Reprinted from [66] with permission from Elsevier.
Applsci 12 06844 g011
Figure 12. Schematic diagrams for the detection of antioxidants using GQDs@PDA (G10). Reprinted from [67] with the permission from Elsevier.
Applsci 12 06844 g012
Figure 13. Schematic diagrams of the FRET sensing mechanism between gGQDs and rGQDs (G11) with the HE4 antibody. Reprinted from [68] with permission from Elsevier.
Applsci 12 06844 g013
Figure 14. Schematic representation of the GO-based aptasensor (G12) for antibiotics via CESA. Reprinted from [69] with permission from Nature Scientific reports.
Applsci 12 06844 g014
Figure 15. Schematic diagram of Campylobacter jejuni detection using the antibody GQDs/GO (G13). Reprinted from [70] with permission from Elsevier.
Applsci 12 06844 g015
Figure 16. Schematic representation of the rGQDs-aptamer (G14) preparation and DX sensing. Reprinted from [71] with permission from Elsevier.
Applsci 12 06844 g016
Figure 17. Plausible FRET mechanism for the Fe-N-GQDs/GO-composite (donor/acceptor) and its fluorescence responses. Reprinted from [72] with permission from Elsevier.
Applsci 12 06844 g017
Figure 18. Schematic representation of UCNPs (G16) and their sensing of HA of influenza via the FRET process. Reprinted from [73] with permission from the American Chemical Society.
Applsci 12 06844 g018
Figure 19. Schematic representation of the preparation of (a) GQD and (b) GDQD, Reprinted from [74] with permission from Elsevier.
Applsci 12 06844 g019
Figure 20. A plausible mechanism for the detection of DNA (G18) using the FRET quenching process. Reprinted from [75] with permission from MDPI.
Applsci 12 06844 g020
Figure 21. Schematic illustration of the ZFP-GO (G19) FRET system and its dsDNA sensing approach. Reprinted from [76] with permission from the American Chemical Society.
Applsci 12 06844 g021
Figure 22. Schematic representation of the GOQDs (G20) enhances the qRT-PCR specificity. Reprinted from [77] with permission from the Royal Society of Chemistry.
Applsci 12 06844 g022
Table 1. Comparison of properties based on different analytes.
S.NoSensorsAnalytesMechanismBinding Constant (M−1)LOD (M)Ref.
1GO aptasensorPb2+FRET0.07–20 nM.0.5 pM[54]
2GO aptasensorAg+ and Hg2+FRET0.05–50 nM1.33 pM[55]
3GQD (NGQD)Ag+FRET-0.05–0.02 nM[56]
4GSH-AuNCsCd2+FRET0.1–100 µM42.0 nM[57]
5GOZr4+FRET1.7 × 104 M−127 ng/mL[58]
6GQDsTNTFRET1–20 nM0.6 nM[60]
7Ag@AuNPsH2O2FRET-0.4 µM[62]
8GO-QDsTheophyllineFRET-4 nM[64]
9GQDs-MnO2GlutathioneFRET-48 nM[66]
10GQDsGlutathioneFRET0.01–0.1 µM
0.1–35 µM
2.4 nM[67]
FRET0.01–0.1 µM
0.1–25 µM
1.5 nM
FRET0.01–0.1 µM
0.1–30 µM
4.2 nM
FRET0.01–0.1 µM
0.1–30 µM
4.4 nM
11GQDsHE4 (Protein)FRET-4.8 pM–300 nM[68]
12GO/aptamerAntibioticsFRET-(i) 1.997 ng/mL
(ii) 2.664 ng/mL
(iii) 2.337 ng/mL
[69]
13GQDsCampylobacter jejuniFRET10–106 CFU10 CFU/mL[70]
14rGQDsDigoxinFRET(i) 9.95 ± 0.32 × 10⁻¹¹ mol L−1
(ii) 0.54 ± 0.02 × 10⁻⁹ mol L−1
(i) 29.87 ± 1.01 × 10⁻¹² mol L−1
(ii) 7.95 ± 0.22 × 10⁻¹² mol L−1
[71]
15GQDsVi antigenFRET-1 pg/mL[72]
16GO/HA aptamerH5N1 IAV hemagglutinin (HA)FRET0.1–15 ng mL−160.9 pg mL−1[73]
17GDQDsmiRNA-21FRET5 pM–200 nM0.5 pM[74]
18GODNA-t and DNA-cFRET-0.12 µM[75]
19QD/GODNA-tFRET-1 nM[76]
20GOQDsDNAFRET-104 –1010 µL[77]
Publisher’s Note: MDPI stays neutral with regard to jurisdictional claims in published maps and institutional affiliations.

