1. Introduction
Research of fluid dynamics in channels with sudden expansion and contraction is common due to its simple geometry and complex physics, including widely known phenomena such as Taylor–Görtler vortices, corner and longitudinal vortices, the complex transition from laminar to turbulent flow, complex heat exchange processes, etc. Moreover, these phenomena have practical application, such as in aeronautics, automobile aerodynamics, and other industrial applications.
It is generally agreed to classify channels with sudden expansion and contraction into three types: open-type cavity (
L/
h1 < 10), transitional-type cavity (10 <
L/
h1 < 13) and closed-type cavity (
L/
h1 > 13) [
1]. Numerical and experimental investigations of fluid dynamics in open-type cavities are frequent in fluid dynamics research; therefore, many studies have been performed to deepen the fundamental knowledge of separated flow dynamics. Cheng and Hung [
2] employed the lattice Boltzmann method to investigate vortex structure in a two-dimensional, lid-driven open-type cavity with a wide range of cavity length-to-depth ratios (
L/
h1) and Reynolds numbers (Re). The study focused on vortex structure, revealing that when
L/
h1 ≤ 1, vortex structure is strongly dependent on Re. When Re ≤ 100, the cavity is filled with a large vortex alongside a pair of bottom corner vortices. As Re increases further, the sizes of the bottom vortices start to differ. However, when
L/
h1 < 1, the number of vortices formed in the cavity increases with further
L/
h1 decrease and Re increase. Another study of flow visualization in an open-type cavity was performed by Faure et al. [
3]. The study was focused on flow visualization in the moderate Reynolds number range (1150–10,670) and varying cavity length-to-step-height ratio (
L/
h1 = 0.5–2) of the shear-layer driven cavity. Analysis revealed that shear-layer secondary instabilities do not cause 3D developments, and that a secondary vortex in the upstream part of the cavity is linked to instability of the main vortex when
L/
h1 = 2.
It is well known that studies of flow dynamics are inherent from heat transfer studies since heat exchange heavily relies on recirculation zone dynamics. Heat transfer has already been deeply analyzed in open-type cavities. Bilgen and Oztop [
3] investigated heat transfer in flow driven by natural convection with ambient fluid in open-type, partially closed cavities with length-to-depth ratio
L/
h1 = 1. The study showed that Nusselt number (Nu) depends on Rayleigh number (Ra), aspect ratio and aperture position. Additionally, the study showed that inclination angle had a nonlinear effect on heat transfer. A similar study was performed by Muftuoglu and Bilgen [
4], where natural convection heat transfer in open-type cavities with a discrete heat source was investigated. The authors determined the optimal position of a discrete heater and its dependence on Ra. Further, the influence of geometrical parameter changes was determined on Ra and Nu by investigating various aspect ratios of the channel. It was shown that Ra is a decreasing function of the cavity aspect ratio, and that Nu is an increasing function of Ra. Prakash et al. [
5] studied the effects of shape, wall temperature, cavity opening ratio and inclination on convective loss in open-type cavities. The study showed that the highest convective loss is observed in a hemispherical open-type cavity with opening ratios of 0.25 and 0.5. Additionally, the study showed that convective loss could be decreased by inclining the channel. The highest convective loss was observed at 0° inclination (horizontal channel) and the lowest at 90° (vertical channel). Laouira et al. [
6] investigated mixed convection in a trapezoidal open-type cavity with a heat source of different lengths fixed to the bottom wall. The study showed that the highest Nu corresponded to the longest heat source, and that enhancement of heat transfer led to velocity distribution change in the cavity.
Since flow structure and topology in open-type cavities have already been thoroughly investigated, recent studies have focused on the impact of minor geometrical features on flow. Das and Cohen [
4] numerically and experimentally investigated flow in an open-type cavity with
L/
h1 = 3.58 to reduce pressure oscillations and noise by changing the rear face geometry of the cavity. Experiments were performed alongside two-dimensional numerical simulations with a Mach number of 0.9. The study revealed that softening of flow impact on the rear face leads to smaller pressure variations between the cavity’s internal and external flow at the point of flow impact. A similar study was performed by Choi et al. [
5] in a channel with an inclined backwards-facing step (BFS) whose inclination varied from 10° to 90°. Numerical study showed that the recirculation zone length remained constant in the turbulent flow regime at Re above 15,000 when the step angle was increased above 30°. Mushyam and Bergada [
6] also studied laminar flow over an inclined step; numerical study showed that recirculation zone length strongly depends on Reynolds number. Yet no significant effect was noticed for step inclination at all angles. Decreased recirculation zone length was achieved by Bravo et al. [
6] in a study where the distributions of mean flow and turbulence over a single rounded step were explored. Numerical investigation showed a shorter recirculation zone than for a channel with 90° BFS. Wu et al. [
7] showed that the flow topology behind the BFS could also be impacted by increasing the roughness of the step’s surface. A thorough experimental investigation was performed by Wu et al. to study the impact of realistic roughness topographies on turbulence, changing the surface of the step from a rough wall to a smooth wall. The study showed that step roughness influences recirculation zone length; secondary vortices were smaller when the surface of the step wall was rough. Measured shear stress suggested that turbulence can be weakened by increasing roughness.
A brief literature survey showed that studies of flow topology in open-type cavities are saturated. However, it was noticed that the impact of small geometry changes on flow structure and topology receives more interest nowadays. There are a decent number of studies on the influence of flow over differently shaped steps. Most are performed in channels with BFS or turbulent flow. To the authors’ knowledge, there are no studies on flow topology in open-type cavities with rounded steps in laminar flow; therefore, this is a new fundamental interest and brings novelty to this research topic. The physical meaning of this study is to provide fundamental knowledge of the impact of geometry on recirculation zone dynamics, thus granting the necessary expertise for engineering solutions for various practical applications. The main goal of this study is to investigate the influence of rounded cavity corners on the topology and stability of laminar flow.
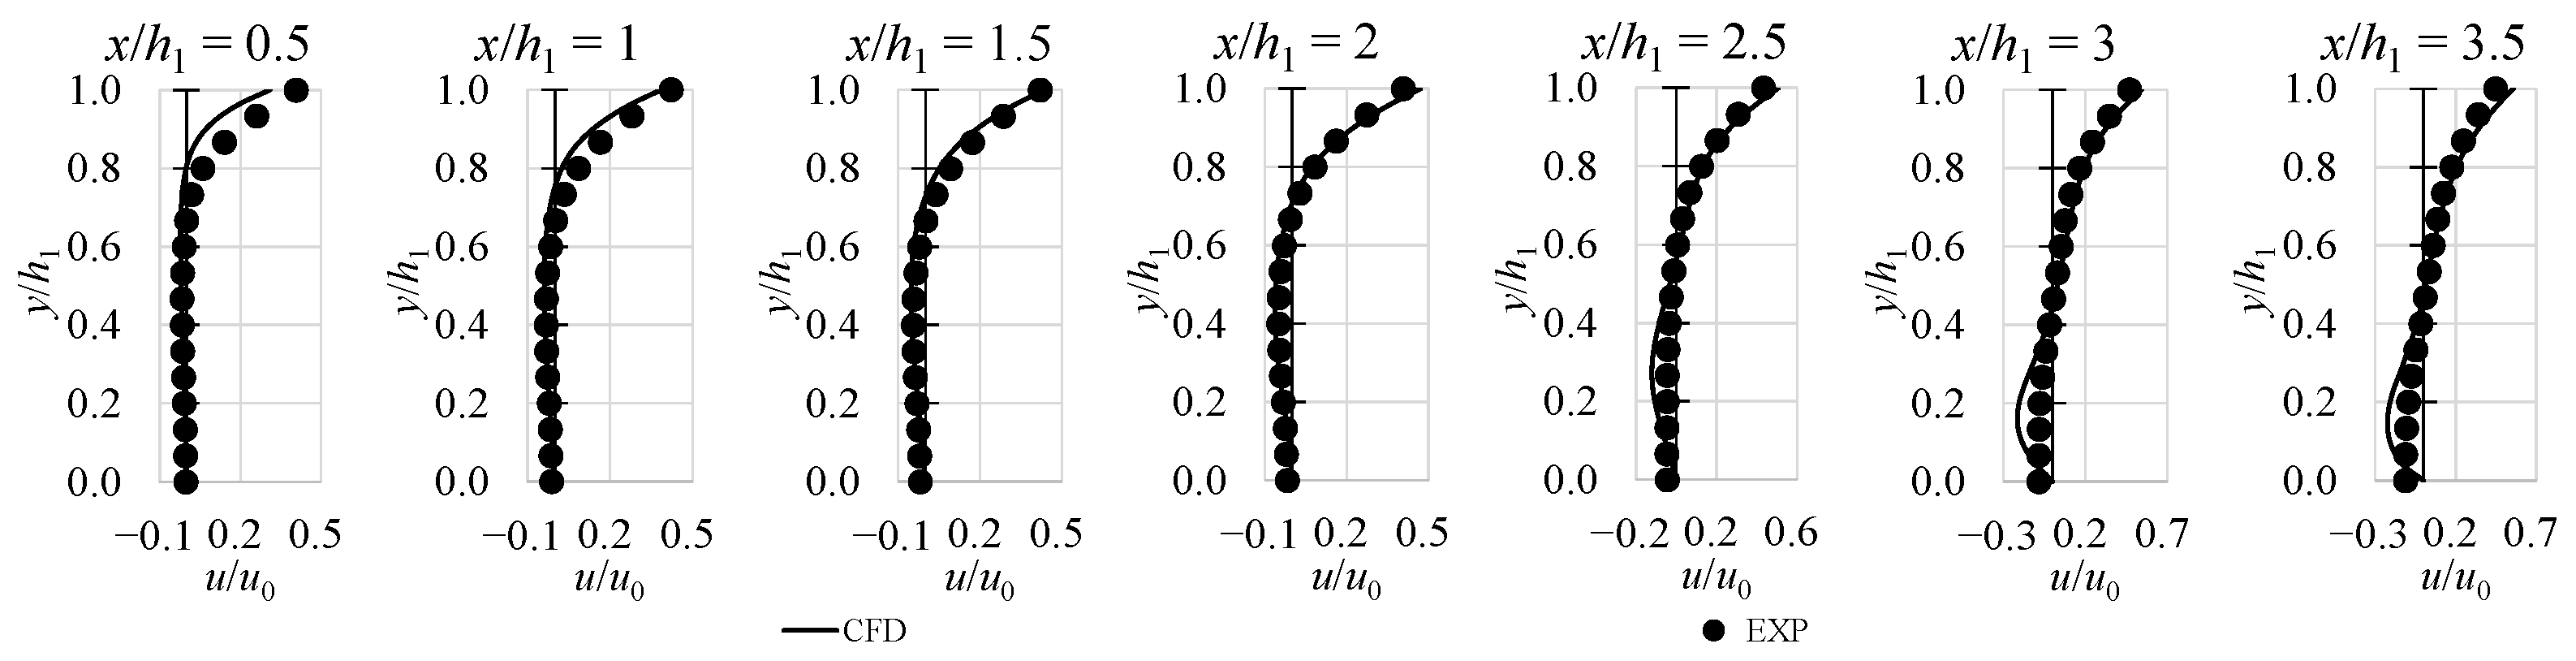
In this study, flow topology was numerically investigated by employing commercially available Ansys Fluent software. Results of numerical simulations were compared to experimental results to ensure the validity of simulations. Since the results agreed acceptably, further simulations were performed with four different geometries to determine the influence of rounded cavity corners on flow topology. For parametric analysis, pressure loss dependency on Re was obtained. Additionally, velocity profiles in x–y and x–z planes were obtained for all investigated channels. Finally, flow stability was investigated by analyzing Tu distribution in the cavities and Cf distribution on the bottom cavity wall.
3. Results and Discussion
3.1. Investigation of Flow Topology in the x–y Plane
Flow topology in the x–y plane is represented as static pressure contours with flow velocity streamlines in
Figure 6. Formation and dynamics of the recirculation zone depend on cavity geometry and Re.
In general, recirculation zone length increases as Re increases. Depending on cavity geometry, the recirculation zone at Re = 10 exists in all cases except Ch3. The recirculation zone is the longest in Ch1, decreases in Ch4 and Ch2, and is absent in Ch3. Rounding of cavity bottom corners causes a lower pressure gradient; therefore, a weaker recirculation zone forms compared to the sudden cross-section changes in Ch1. In Ch3, due to rounded upper cavity corners and smooth transition from the channel to the cavity, streamlines follow cavity geometry smoothly and enter the cavity without separation.
As Re increases (Re = 100), the recirculation zone becomes of comparable size and shape. Due to an increase of the main flow velocity, more kinetic energy is transferred to the recirculation zone, forcing it to grow. Yet in Ch3, the recirculation zone is still weakest. The pressure gradient is sufficient for the shear layer to separate; however, it is not sufficient for the recirculation zone to fill the entire cavity, thus reattachment is observed near the trailing wall. Because of the smaller recirculation zone, the main flow impingement occurs lower on the trailing wall compared to other cases. The impingement location matches the location of maximum pressure on the trailing cavity wall. Due to a shorter recirculation zone, maximum pressure values are distributed over a larger area on the trailing wall compared to other cases. As the cavity is filled with the recirculation zone, the separated shear layer bridges the cavity, and impingement occurs on the trailing wall edge.
Additionally, flow topology changes are observed at Re = 1000. In this case, recirculation zones have reached their final shape and no longer depend on Re. The main difference from Re = 100 cases is the shift of vortex centre position to the vicinity of the trailing wall. In such flow, force is balanced between the main flow in the channel and the recirculation flow in the cavity. Concerning heat transfer enhancement in investigated geometries, Ch3 seems to be most promising due to the longest-lasting shear layer reattachment and the most unstable recirculation zone, especially at higher Re.
Additionally, corner eddies (known as Moffat eddies) located between the leading cavity wall and the recirculation zone are formed in Ch1. The length of corner eddies is measured by the wall shear stress on the cavity bottom. The presence of corner eddies is due to an adverse pressure gradient behind the leading wall [
14]. The minimum wall shear stress values are associated with the beginning and the end of the eddy. The distribution of wall shear on the Ch1 bottom is given in
Figure 7a. Note that the lengths of corner eddies in all investigated Re cases are tiny; therefore, they are not visible in
Figure 6. In Ch1, the size of the corner eddy increases with increasing Re in similar manner to the main recirculation zone (
Figure 7b). It is well known that fluid flow through a corner that is greater than 73.5° creates Moffat eddies [
15]; therefore, corner eddies do not form for the rounded cavity corners (Ch2 and Ch4) (
Figure 6). Additionally, corner eddies in Ch3 are absent due to gradually rounded corners—the adverse pressure gradient is insufficient for flow separation, and streamlines follow the corner geometry without forming recirculation zones.
Flow velocity
u profiles in Ch1, Ch2 and Ch3 are given in
Figure 8 and
Figure 9. The profiles are measured along the cavity in the middle plane at equal distances of 0.5
h1. The velocity profiles of Ch4 are not presented since they are identical to Ch1. As can be seen, velocity profiles in Ch1 and Ch2 coincide in most cases. Slight differences are observed only at the beginning of the cavity and near the trailing wall due to different corner rounding radii. In Ch2 at Re = 100 (
Figure 8), the recirculation zone is affected by a gradually decreasing channel cross-section. Therefore, the interaction between the main flow and recirculation zone is strengthened, causing a stronger recirculation zone at 0.3 <
y/
h1 < 0.75. Higher
u velocities along the cavity in Ch3 at Re = 100 are determined by a shorter and weaker recirculation zone. As Re increases, velocity profiles coincide well because flow structure in the cavity is stable and small changes in cavity geometry have a diminishing influence on flow structure.
The most significant geometry impact is observed in Ch3 at Re = 100, where the recirculation zone is weaker and a thinner reverse flow layer is observed compared to other cases. The highest velocity values are observed when Re ≥ 100 due to the lowest pressure losses.
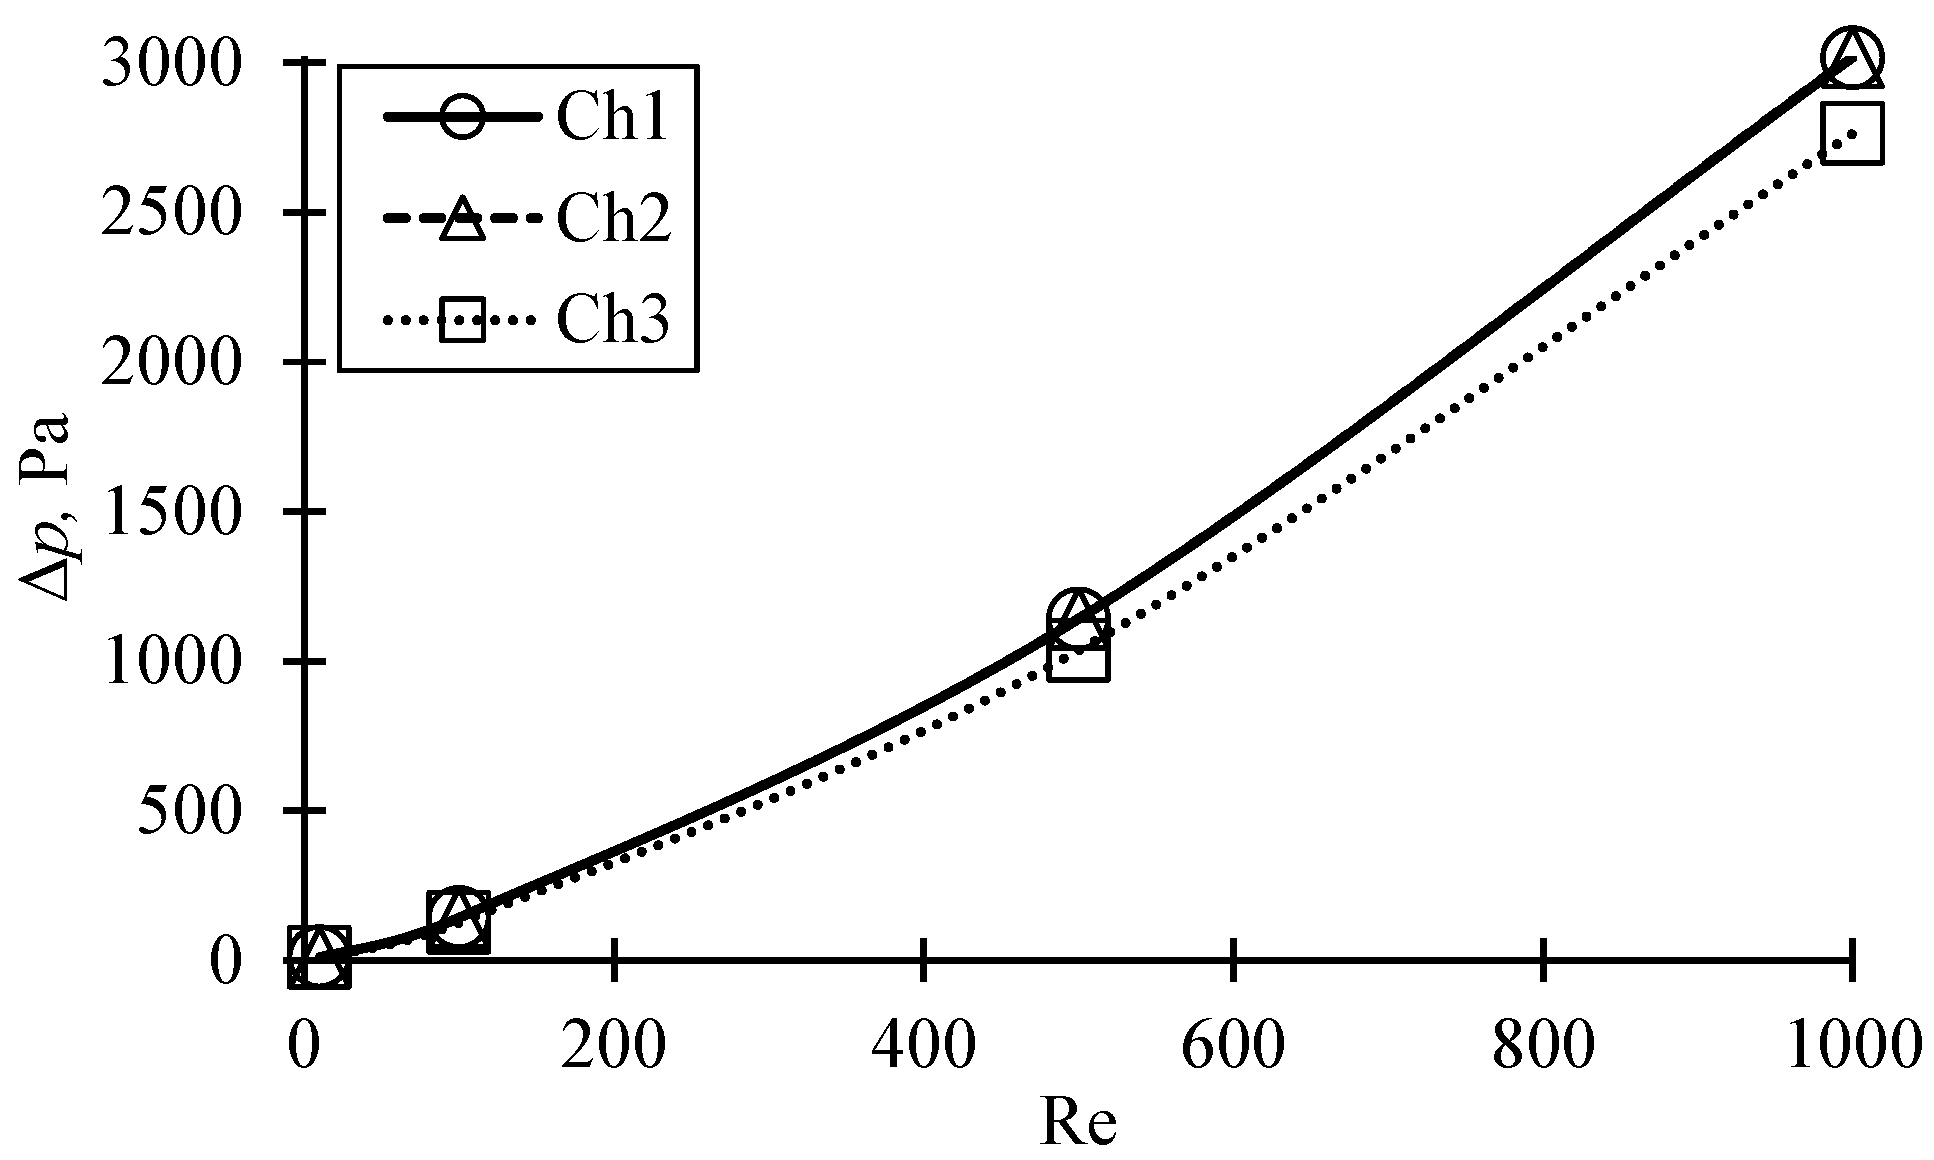
Figure 10 gives pressure loss dependency on Re. Pressure loss is calculated as the difference between inlet and outlet pressure. As can be seen, pressure losses in all cases are similar at low Re. As Re increases, pressure losses remain similar in Ch1 and Ch2; however, decreased pressure losses are observed in Ch3, as could have been foreseen from the velocity fields and profiles presented above. The reduction of pressure losses due to cavity corner rounding could serve as a roadmap in designing specific applications.
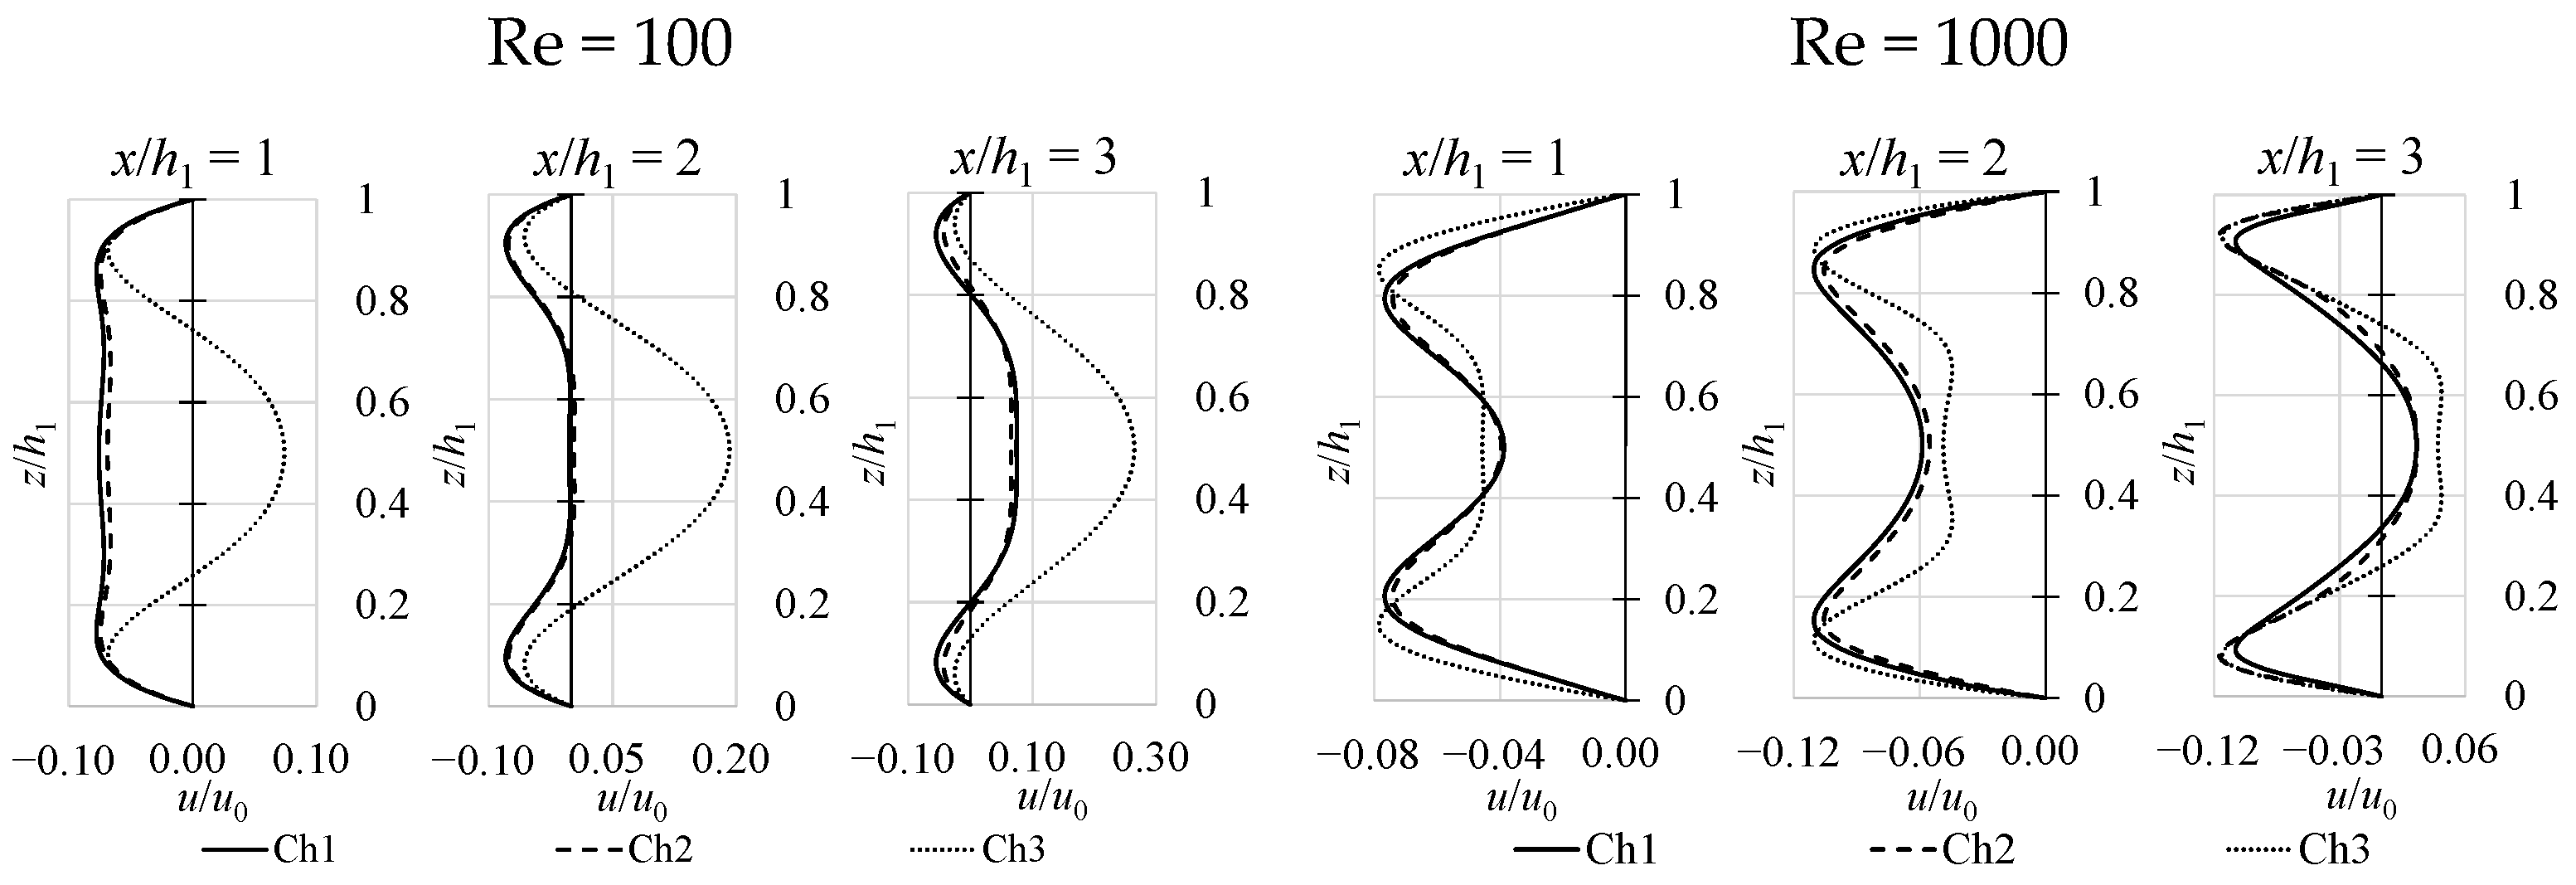
3.2. Investigation of Flow Topology in the x–z Plane
Flow streamlines and velocity
u profiles measured in the x–y plane are given at
y/
h1 = 0.5 (in
Figure 11 and
Figure 12). At Re = 100, lateral vortices are observed in all investigated cases. Note that longitudinal dimensions differ in every investigated channel due to geometry limitations. For example, the growth of lateral vortices in Ch3 is determined by increased velocity in the centre of the channel; therefore, more kinetic energy is transferred to lateral vortices, thus increasing their size. Further, since the recirculation zone in Ch3 is smaller than in other cases, the difference in reverse flow distribution between Ch3 and Ch1/Ch2 is evident, as can be observed from the x–z plane velocity
u profiles (
Figure 12). In Ch3, the separated shear layer reattaches to the cavity bottom (
Figure 6), and the recirculation zone is smaller than in other cases. Therefore, the effective flow cross-section increases in the cavity. Due to more space for flow development above the recirculation zone, the velocity at
y/
h1 = 0.5 is more than three times greater than in other cases at the middle part of the cavity.
When the flow approaches the trailing wall, the velocity differences between the investigated channels become lesser, yet are still notable. However, as the Re increases to Re = 1000, the impact of geometry on flow topology becomes less significant because recirculation zones become of comparable size. The lateral vortices formed near the leading wall are displaced towards sidewalls in Ch3 compared to Ch1/Ch2 because the trailing cavity wall is being bent inside the cavity, and from the resulting space restrictions the vortex centre is stretched across the cavity. A lesser effect is observed in Ch1. The opposite is observed in Ch2, where lateral vortices are close to each other and in the vicinity of the cavity mid-plane when the trailing wall is bent outside, and the vortex core is less restricted.
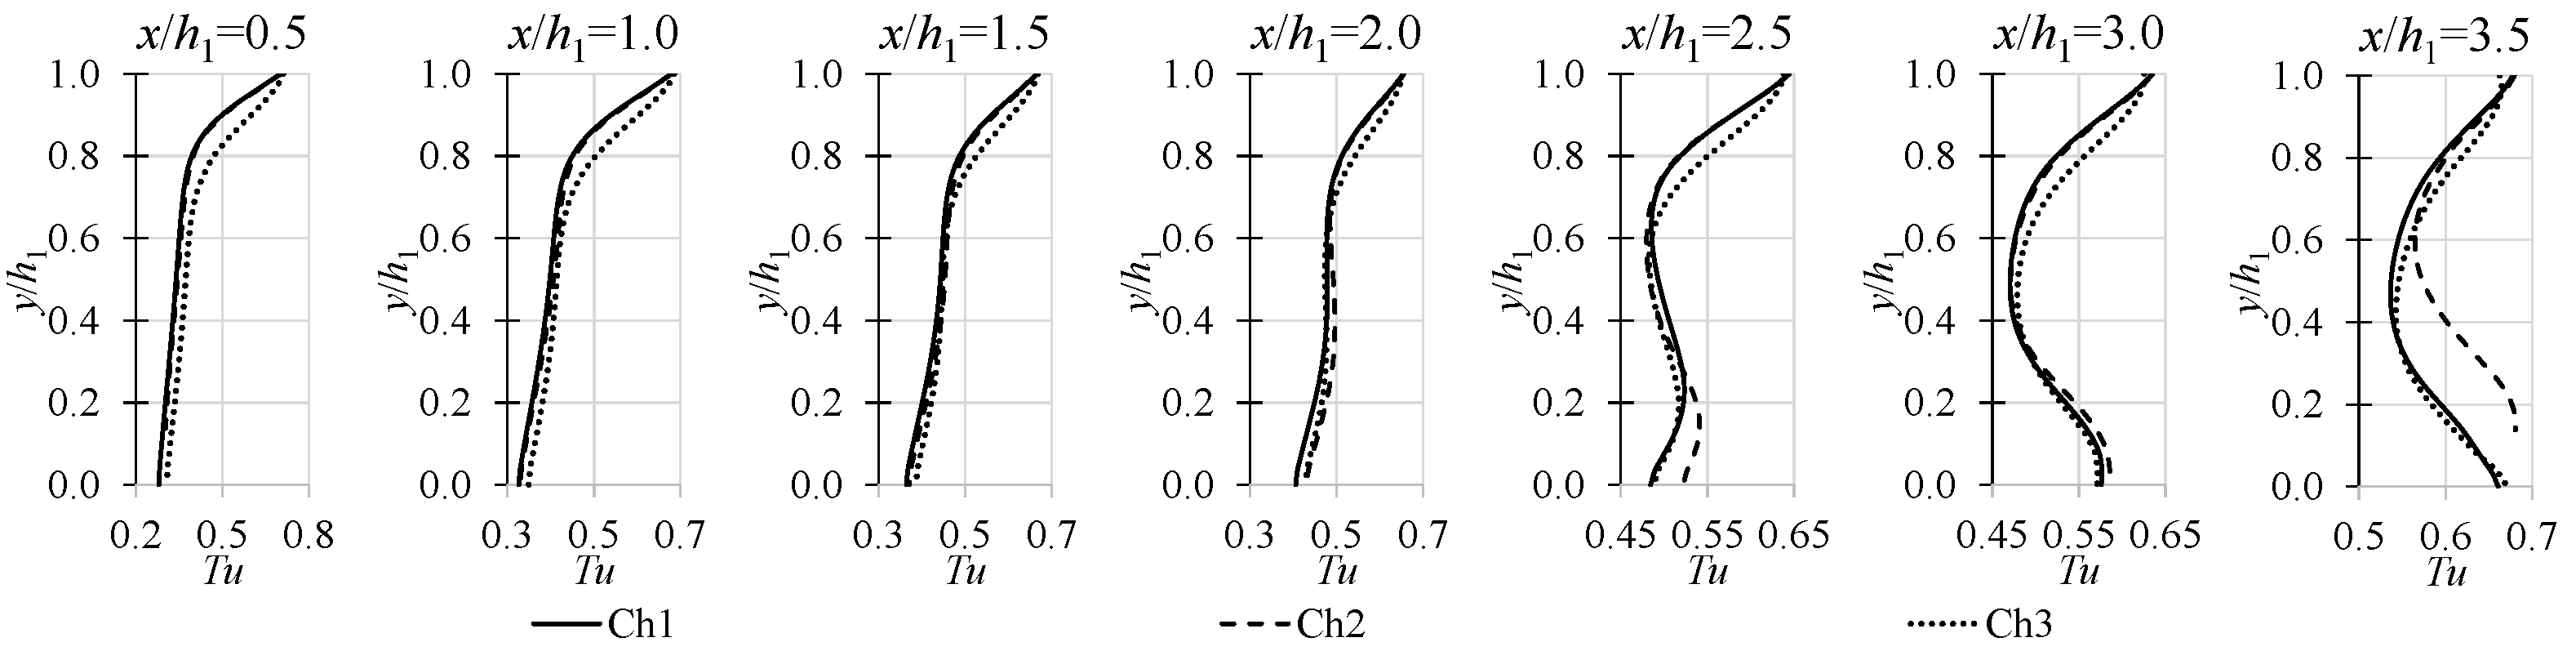
Turbulence intensity profiles at Re = 1000 are given in
Figure 13. Re = 1000 is presented due to the flow structure being considered fully developed in the cavity. It is known that increased
Tu values may cause flow instabilities and the presence of secondary flows [
16]; therefore, the distribution of
Tu is investigated to analyse flow stability.
Out of all investigated channels, the highest increase of
Tu is observed in Ch2. This implies that the fully curved cavity bottom corners cause the flow to become less stable, i.e., the flow tends to fluctuate. Gradually decreasing the cross-section (near FFS) strengthens interactions between the recirculation zone centre and the main flow. Thus, flow perturbations near the recirculation zone centre occur; therefore, peak
Tu is observed at
x/
h1 = 3.5. This applies to Re = 500 and Re = 1000; therefore, its magnitude does not depend on Re. Additionally, increased
Tu implies that the flow becomes less two-dimensional [
17]. Conversely, the opposite situation is seen in Ch3, where
Tu decreases in the recirculation zone, implying that the recirculation zone is more stable.
3.3. Investigation of Flow Parameters Corresponding to Flow Stability
Skin friction coefficient
Cf distribution on the cavity bottom wall is given in
Figure 14. Increased
Cf is associated with increased static pressure along the cavity. The minimum
Cf is observed behind the leading cavity wall, where small secondary vortices or smooth streamlines are present depending on corner geometry.
Cf abruptly increases with the beginning of the recirculation zone and reaches a plateau in Ch1 and Ch2 in the middle of the cavity at the recirculation zone centre. The Ch3 recirculation zone is not fully formed; therefore, Cf values are lower, and a plateau is not observed as the recirculation zone size decreases along the cavity, contrary to Ch1 and Ch2. A slight decrease in
Cf is observed at
x/L ~0.7 in Ch1 and Ch2 as the recirculation zone weakens along the cavity. In Ch3,
Cf reduction is more pronounced due to shear layer reattachment to the cavity bottom. As the trailing wall of the cavity approaches, the favourable pressure gradient rapidly increases, leading to increased C
f. In Ch1 and Ch2,
Cf distribution along the cavity is similar because of analogous recirculation zone dynamics. However, in Ch3, the adverse pressure gradient is lower at the inlet of the cavity; therefore, a weaker recirculation zone is formed, leading to lower flow resistance.
4. Conclusions
In this study, dynamics of laminar flow in open-type cavities with differently rounded corner geometries were numerically investigated.
Investigation of recirculation zone structure based on cavity corner shape showed that corner geometry determines the size and number of vortices in the cavity. The strongest recirculation zone is formed in the right-angled cavity (Ch1), and vortex size decreases in half-rounded (Ch4) and fully rounded (Ch2) bottom corners and rounded upper (Ch3) corners due to a reduced adverse pressure gradient behind the leading cavity wall. Rounded corner type and radius also affect the location and size of the transverse vortex centre with respect to the side and trailing walls of the cavity.
Parametric analysis revealed that pressure losses are notably lower with rounded upper cavity corners (Ch3) due to reduced recirculation zone size and an increased effective flow cross-section. Flow stability analysis showed that fully rounded cavity corners (Ch2) negatively impact flow stability by increasing Tu near the trailing cavity wall. The gradually decreasing channel cross-section near the trailing wall strengthens the interactions between the recirculation zone and the main flow, causing flow perturbations to appear.
Broader analysis of flow structure on flow regime and investigation of heat transfer processes dependent on small changes to cavity geometry will be presented and discussed in forthcoming papers.


