Article

Wetting Front Expansion Model for Non-Ponding Rainfall Infiltration in Soils with Uniform and Non-Uniform Initial Moisture Content

1
Key Laboratory for Urban Underground Engineering of Ministry of Education, Beijing Jiaotong University, Beijing 100044, China
2
School of Civil Engineering, Beijing Jiaotong University, Beijing 100044, China
3
Anhui Transport Consulting & Design Institute Co., Ltd., Hefei 230088, China
4
Hebei Key Laboratory of Geotechnical Engineering Safety and Deformation Control, Hebei University of Water Resources and Electric Engineering, Cangzhou 061001, China
*
Author to whom correspondence should be addressed.
Appl. Sci. 2022, 12(12), 6185; https://doi.org/10.3390/app12126185
Submission received: 30 April 2022 / Revised: 7 June 2022 / Accepted: 15 June 2022 / Published: 17 June 2022

Abstract

:
The rainfall infiltration model plays a key role in the fields of seepage theory and geological hazard evaluation. To reflect the change in the moisture content in soil during rainfall infiltration, the infiltration process was segmented into stages, and an improved unsaturated wetting front extension model was proposed by introducing unsaturated soil parameters on the basis of the traditional infiltration model. The variation rules of surface moisture content and wetting front depth were revealed under the condition of uniform or non-uniform moisture content distribution in soil. The results indicate that the surface moisture content and wetting front depth increase nonlinearly with time during the infiltration process, and the proposed model is in good agreement with the numerical simulation results, the maximum error is less than 5%, while the growth rate under two hypotheses shows obvious differences for different rainfall intensities. Moreover, due to the variation in the moisture content with time, the proposed model calculates a lower moisture content than that of the traditional model under the same conditions, but the expansion depth of the wetting front is higher and the range of influence on soil is greater.

1. Introduction

The saturation of unsaturated soil is less than 100% but greater than 0, which widely exists in nature. They all have a basic character-matrix suction, which is an important factor to maintain the stability of the soil slope. However, soil saturation changes during rainfall, affecting the permeability coefficient in soil, and at the same time, the suction gradually decreases or even disappears, causing engineering geological disasters such as landslides, which usually occur under heavy rainfall conditions. However, for weak soils such as loess, landslides often occur under light rain due to their weak resistance to running water, and it is easy to cause great security risks to human living activities. Therefore, it is particularly necessary to study the law of non-ponding infiltration. Many scholars [1,2,3,4,5] carried out theoretical studies on the infiltration process in soil to reveal the mechanism of slope instability and predict landslide.
At present, the Mein-Larson model [6], based on the Green-Ampt hypothesis, Philip model [7] and Trigs model [8], are common methods for rainfall infiltration calculation. Among them, the Mein-Larson model is widely applied for its simple hypothesis and convenient calculation. However, it assumes that the zone above the wetting front is completely saturated, and the saturated permeability coefficient is used to solve the problem overall. Nevertheless, it is difficult for soil to reach a saturated moisture content under the condition of non-ponding infiltration, and the calculation based on the saturated permeability coefficient may result in a great error. Therefore, many scholars have improved the model.
In the past, most studies used the hypothesis of the horizontal wetting front in the Mein-Larson model. For example, Li et al. [9] established a non-ponding infiltration model based on the hypothesis of the horizontal wetting front by introducing the unsaturated permeability coefficient of soil, but the effect of matric suction was ignored. Yu et al. [10] considered the influence of matric suction on this basis, reflecting the change in soil moisture content with time, but their method is mainly suitable for soils with strong matric suction. Tang et al. [11] studied the rainfall infiltration process when the initial soil moisture content was in linear distribution, but its scope of application is small. The hypotheses above are too simplified, limit the calculation accuracy and are inconsistent with the actual conditions. Some scholars [12,13] found that the wetting front is not horizontal through experiments and field tests, so some hypotheses of other shapes were proposed. Wang et al. [14] believed that the shape of the transition layer is an ellipse, and its thickness is about half of the wetting depth, but the changing process of the transition layer was not considered. Xu et al. [15] also adopted the ellipse shape hypothesis and segmented the rainfall process, taking into account the role of the soil moisture profile in the model, but the application of unsaturated soil parameters was imprecise. He et al. [16] adopted the equivalent unsaturated soil permeability coefficient on this basis, which achieved good results, but mainly aimed at soil with a uniform initial moisture content.
In view of the problem above, this study segmented the infiltration process, introduced unsaturated parameters, and put forward an improved unsaturated wetting front expansion model under different initial moisture content hypotheses, meaning that it reflects the non-ponding infiltration process more realistically and provides theoretical support for engineering disaster prevention.

2. The Improved Model for Non-Ponding Infiltration

2.1. The Infiltration Model with the Hypothesis of Uniform Initial Moisture Content

For non-ponding infiltration, that is, when the rainfall intensity is less than the saturated permeability coefficient of soil, which means an unsaturated infiltration process, all rainwater will seep into soil and will not accumulate on the ground. The whole process can be divided into the following two stages: the transitional stage and stable stage.
During the initial transition stage, the moist area formed in soil expands continuously, and the surface moisture content and moisture depth increase simultaneously, while the soil moisture content decreases along the depth direction. Based on the experimental results, some scholars assumed that the moisture content profile in the unsaturated zone is a 1/4 elliptic curve, and achieved a good result [14]. Therefore, this paper also adopted the same hypothesis and considered the profile of soil moisture content in the transitional stage as elliptical, supposing the surface moisture content of soil is θ i , the initial moisture content is θ 0 , as shown in Figure 1.
If the the rainfall intensity is q, the infiltration rate is i, then for a one-dimensional infiltration situation perpendicular to the ground, the infiltration process can be expressed using the Green-Ampt model:
i = K ( θ ) ( S ( θ 0 ) S ( θ i ) z f + 1 )
where K(θ) is the unsaturated permeability coefficient corresponding to moisture content θ , z f is the wetting front depth and S ( θ i ) and S ( θ 0 ) are the matric suction at the soil surface and wetting front, respectively.
It should be noted that Mein-Larson et al. [3] believed that even without ponding on the ground, the moisture content still reaches saturation, and proposed the following formula to calculate the wetting front depth:
z f = q T θ s θ 0
where θ s is saturated moisture content, T is the rainfall time.
However, some scholars [9] found that the soil moisture content could not reach saturation during unsaturated infiltration, so it could not be directly applied to the infiltration calculation. Meanwhile, the unsaturated permeability coefficient K(θ) in Equation (1) generally corresponds to the state of a stable and uniform moisture content. However, the moisture content is not uniform at the initial stage, so it cannot be expressed by the conventional permeability coefficient. Xu et al. [15] tried to use the permeability coefficient that corresponds to the average moisture content in the moist zone to represent it, but the result was not accurate. Therefore, the equivalent permeability coefficient in the moist zone was adopted to represent the permeability coefficient [17], which can be expressed as
K - = K ( θ i ) K ( θ 0 ) ln K ( θ i ) ln K ( θ 0 )
Meanwhile, the Van Genuchten model [18] was introduced to represent the soil matrix potential and unsaturated permeability coefficient corresponding to moisture content, as shown in Equations (4) and (5).
K ( θ ) = K s ( θ θ r θ s θ r ) 1 / 2 { 1 [ 1 ( θ θ r θ s θ r ) n n 1 ] n 1 n } 2
S ( θ ) = 1 α [ ( θ θ r θ s θ r ) n 1 n 1 ] 1 n
where α and n are constants and θ r is the residual moisture content.
Is the rainwater is fully infiltrated, the infiltration rate i equals the rainfall intensity q. By substituting Equation (3) into Equation (1), it can be rewritten as:
q = K - ( θ ) ( S ( θ 0 ) S ( θ i ) z f + 1 ) = K ( θ i ) K ( θ 0 ) ln K ( θ i ) ln K ( θ 0 ) [ S ( θ 0 ) S ( θ i ) z f + 1 ]
According to the law of water conservation, Equation (7) can be obtained:
q T = π 4 ( θ i θ 0 ) z f
Substitute Equation (7) into Equation (6), to get
q = i = K ( θ i ) K ( θ 0 ) ln K ( θ i ) ln K ( θ 0 ) { [ S ( θ 0 ) S ( θ i ) ] π ( θ i θ 0 ) 4 q T + 1 }
Equation (8) is the governing equation of soil infiltration in the initial transition stage, which describes the relationship between T and θ i .
Zeng et al. [12] found that for constant rainfall intensity, the soil surface moisture content gradually increases to a certain value and then remains unchanged, specifically the critical moisture content θ w . At this time, the rainfall intensity is equal to the soil permeability coefficient. By setting θ = θ w , the critical moisture content can be calculated using Equation (9), which is derived from Equation (4):
q = K ( θ ) = K s ( θ w θ r θ s θ r ) 1 / 2 { 1 [ 1 ( θ w θ r θ s θ r ) n n 1 ] n 1 n } 2
When the surface moisture content reaches its critical value, the infiltration process will enter the stable stage, during which the soil moisture profile is stratified as the transition zone and stable zone. The moisture content above the transition zone is the critical moisture content θ w , as shown in Figure 2. In addition, some scholars [17] demonstrated that for infiltration with constant rainfall intensity, the thickness of the transition zone will gradually stabilize. Therefore, it can be assumed that the shape of the elliptical transition zone formed after reaching the critical moisture content remains unchanged.
The infiltration in the stability zone can be expressed as:
q ( T T c ) = ( θ w θ 0 ) ( z f z f c )
where Tc is critical time, meaning the time taken to increase the initial moisture content of the soil surface to the critical value and z f c is the depth of transition zone, which can be obtained from Equations (7)–(9).
Based on the deduction above, the cumulative infiltration amount I can be calculated using the following expression:
I = q T = { π 4 ( θ i θ 0 ) z f ( 0 T < T c ) ( θ w θ 0 ) ( z f z f c ) + π 4 ( θ w θ 0 ) z f c ( T T c   )  
In summary, the dynamic evolutionary relationship among T, z f and θ i can be obtained by Equations (8)–(11).

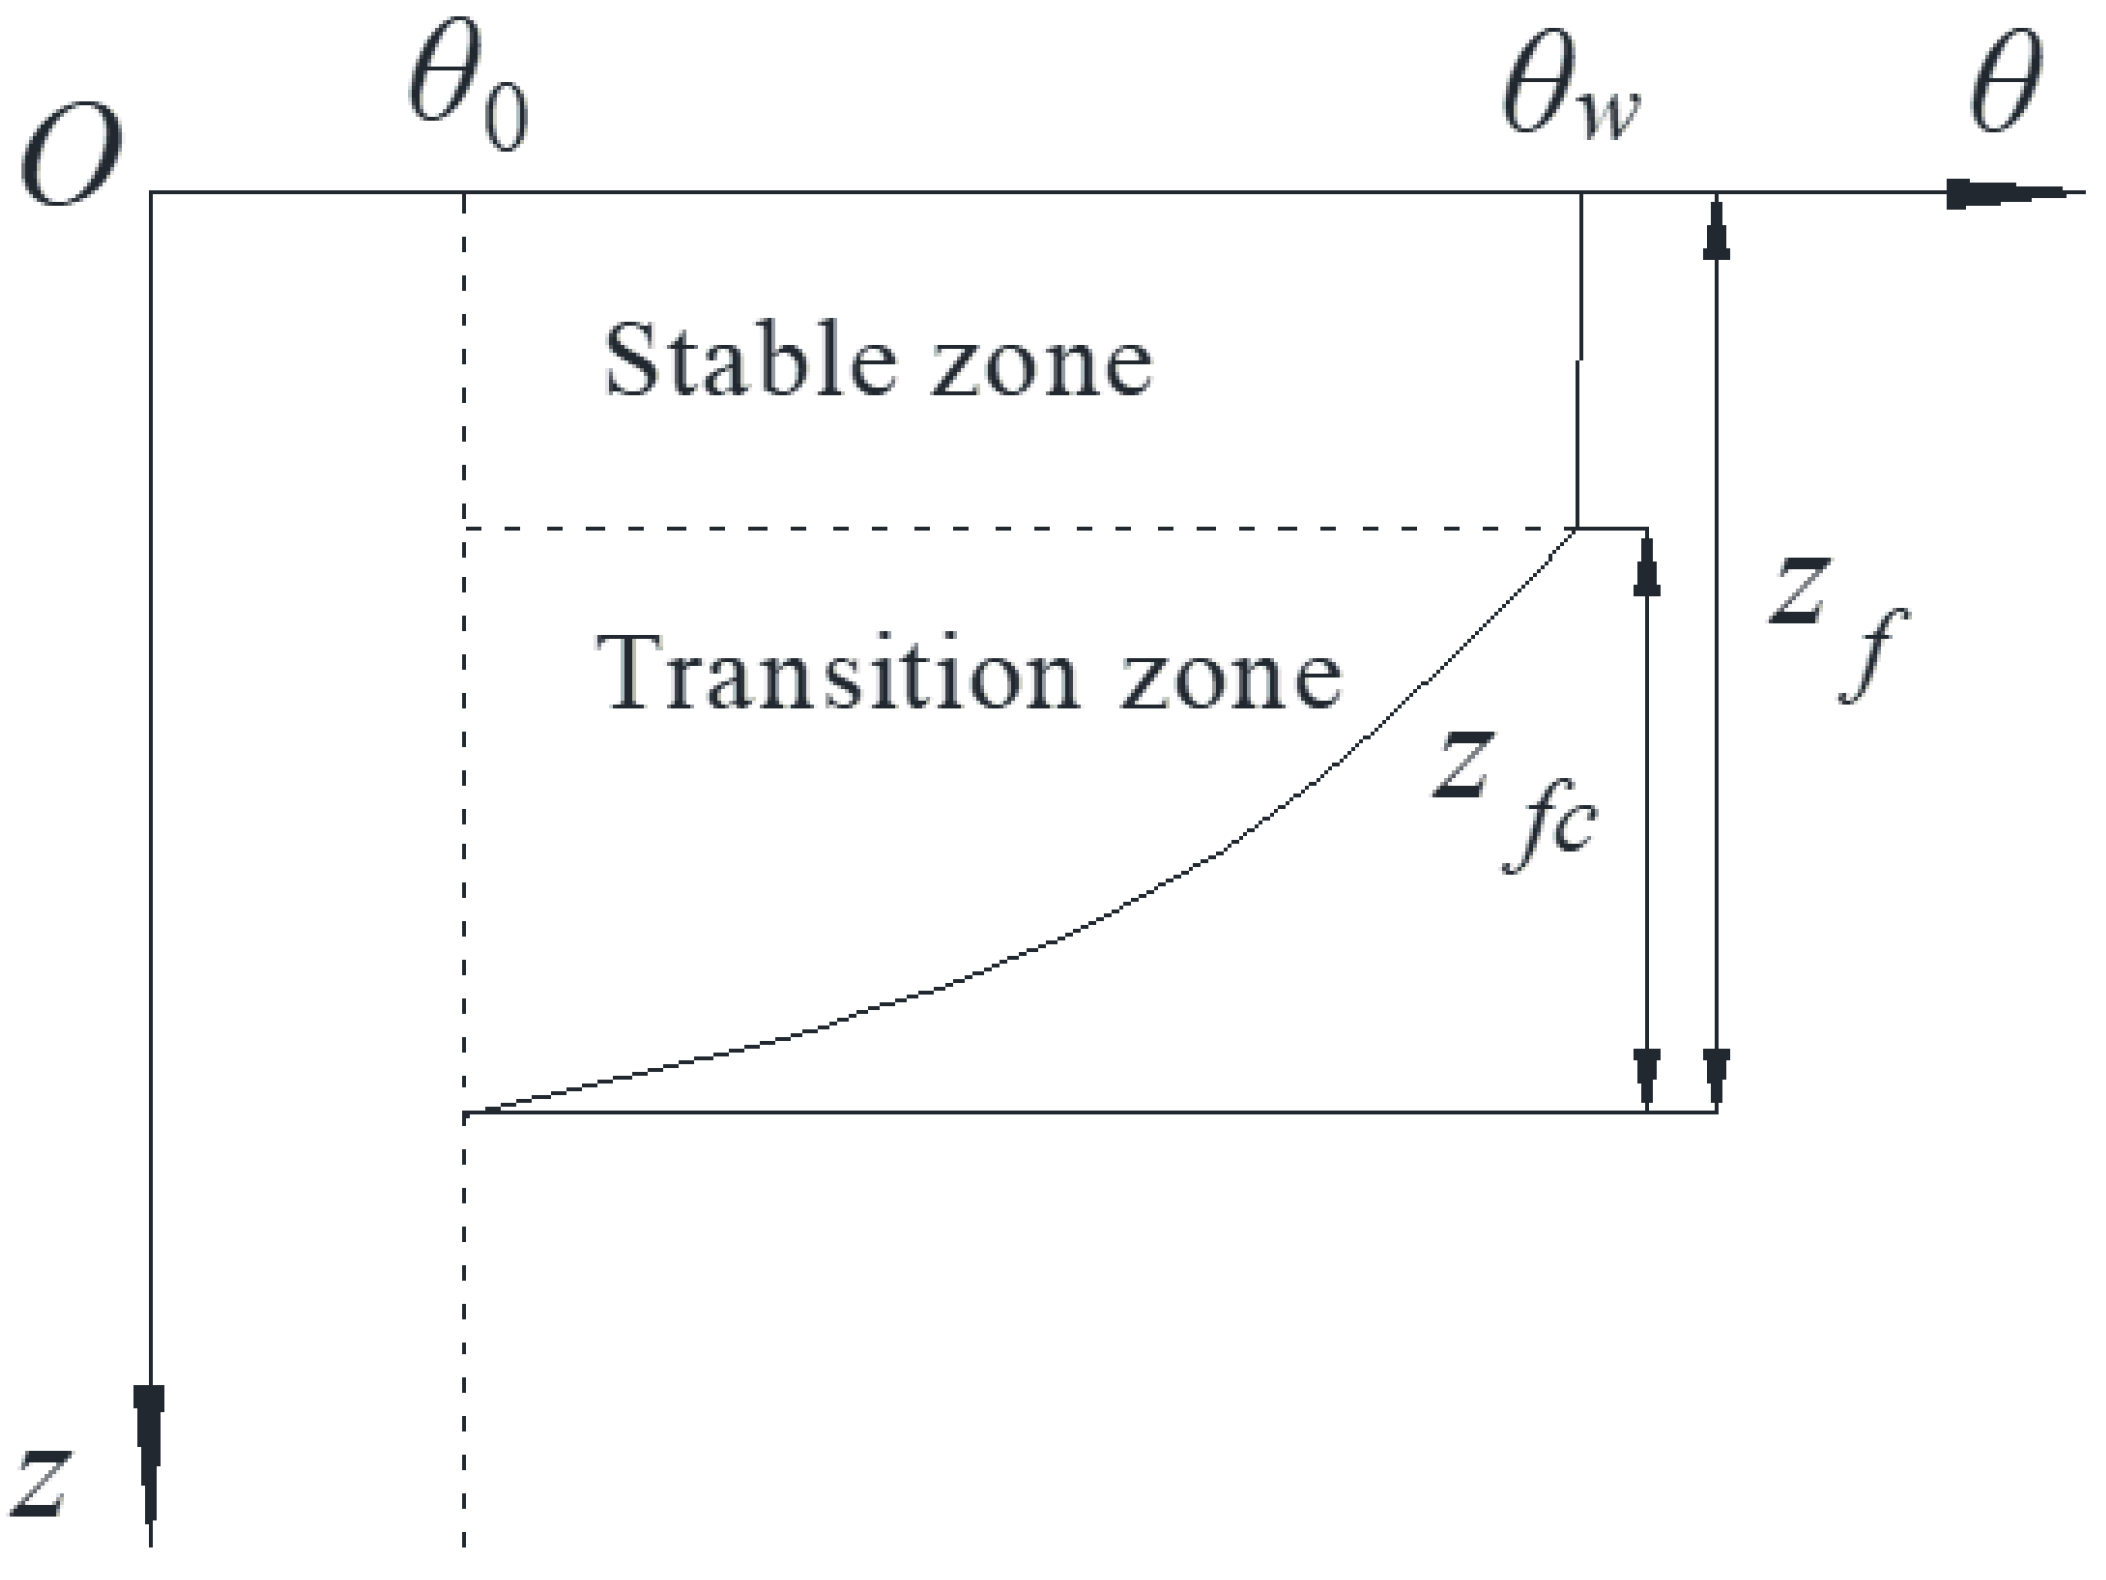
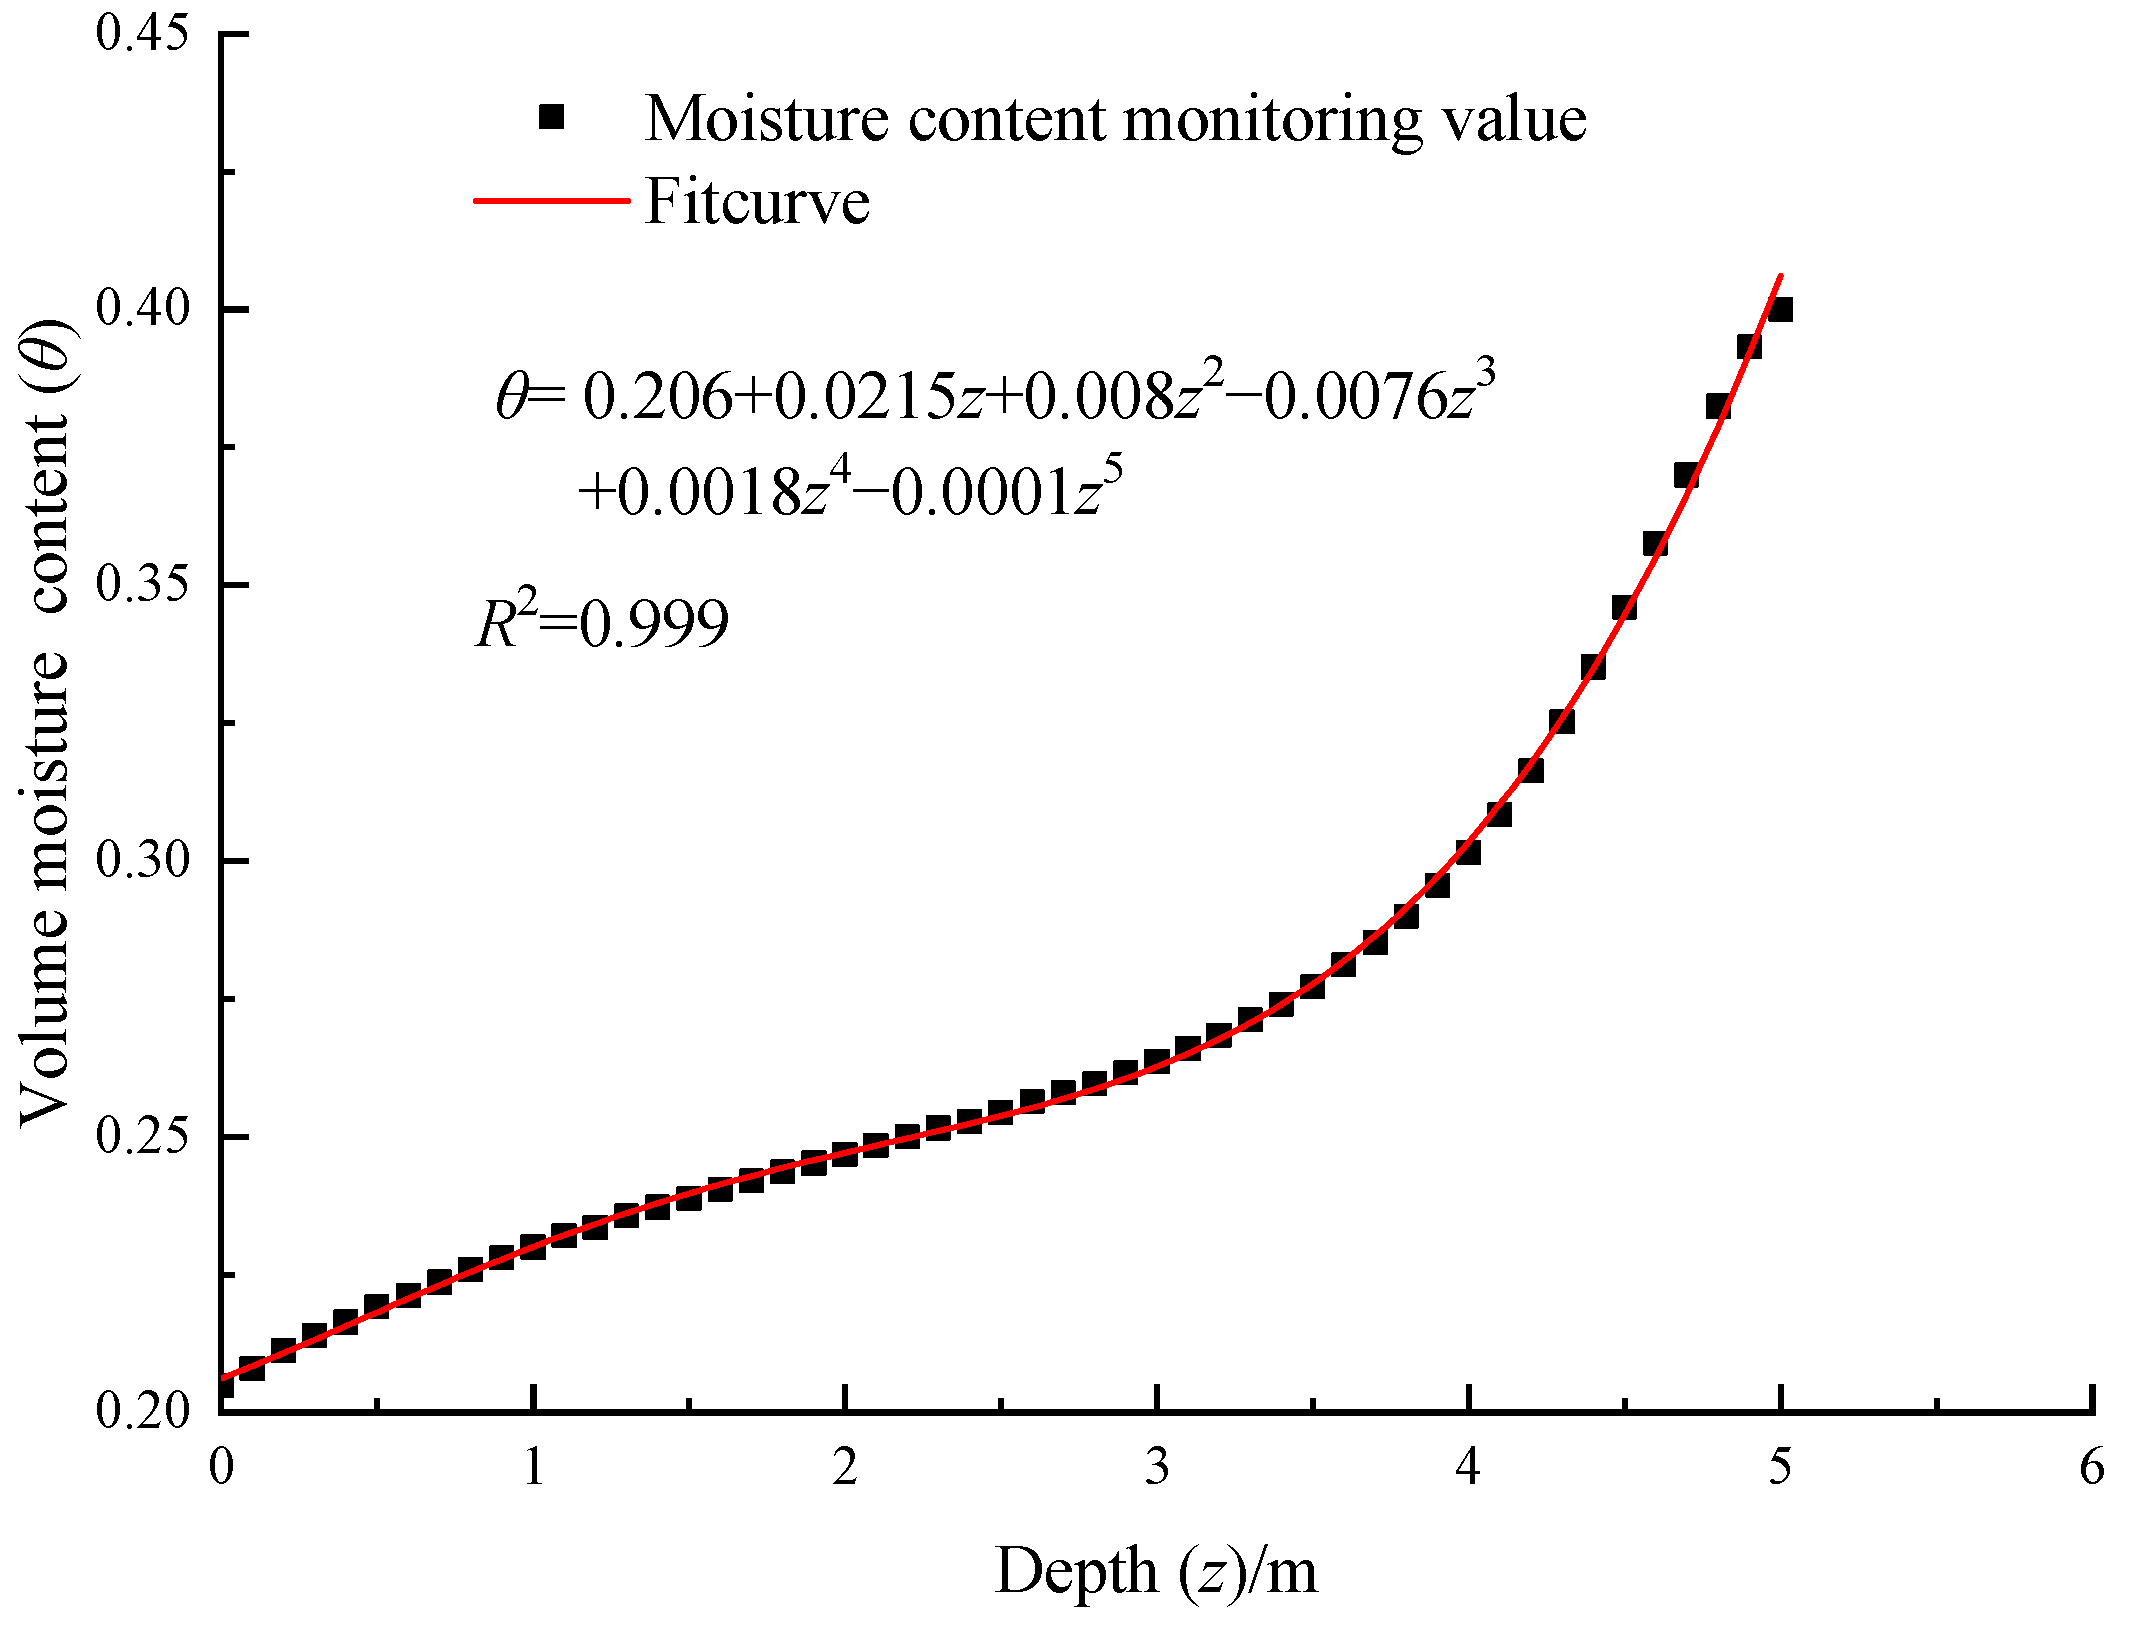
2.2. The Infiltration Model with Initial Moisture Content Varying with Depth

In actual engineering, the moisture content in soil is not uniformly distributed, but varies with depth. Therefore, the hypothesis of the invariable initial moisture content in the Mein-Larson model cannot be applied accurately. According to Wang et al. [19], the initial moisture content is a function of depth, which can be described using the polynomial function as Equation (12):
θ ( z ) = i n A i z i
where θ ( z ) is the probability distribution function of the soil moisture content, which is perpendicular to the surface, and Ai (i = 0–n, n is an integer) is the fitting parameter.
The infiltration process can be divided into two stages. In the transition stage, the moisture content profile is also assumed to be 1/4 ellipse. The vertical semi-axis takes the depth of the unsaturated zone as z f j when the surface moisture content is uniform (corresponding to θ = θ ( z = 0 ) ), as shown in Figure 3.
The moisture content profile equation in the transition zone is expressed as Equation (13):
( θ - θ ( z = 0 ) ) 2 ( θ i - θ ( z = 0 ) ) 2 + z 2 z f j 2 = 1
where z f j is the wetting front depth when the surface moisture content ( θ ( z = 0 ) ) is uniform, which can be obtained by Equations (7) and (8).
The corresponding rainfall amount can be expressed as:
q T = ( θ i θ ( z = 0 ) ) z f 0 z f ( θ ( z ) θ ( z = 0 ) ) d z 0 z f [ θ i θ ( z = 0 ) ( θ i θ ( z = 0 ) ) 1 z 2 z f j 2 ] d z
which can be simplified as
q T = ( θ i θ ( z = 0 ) ) [ z f j 2 arcsin z f z f j + z f 2 1 ( z f z f j ) 2 ] 0 z f ( θ ( z ) θ ( z = 0 ) ) d z
According to Equations (12), (13) and (15), the relationship among z f , T and θ i in the transition stage can be obtained.
When the surface moisture content reaches its critical value θ w , it enters the stable stage. It is also assumed that the shape of the elliptical moist region will not change (corresponding to the situation of uniform surface moisture content θ ( z = 0 ) ), as shown in Figure 4.
The elliptic equation can be described as Equation (16):
( θ - θ ( z = 0 ) ) 2 ( θ i - θ ( z = 0 ) ) 2 + [ z ( z f j z f c ) ] 2 z f c 2 = 1
where z f j and z f c can be obtained by Equations (7), (8) and (11).
The cumulative infiltration amount can be found using Equation (17):
q T = ( θ w θ ( z = 0 ) ) z f 0 z f ( θ ( z ) θ ( z = 0 ) ) d z z f j z f c z f { ( θ w θ ( z = 0 ) ) [ 1 1 [ z ( z f j z f c ) ] 2 z f c 2 ] } d z
By solving Equations (13), (16) and (17) simultaneously, the relationship between T and z f in the stable stage can be obtained.

3. Result Analysis and Verification

In this section, MATLAB software was used to calculate the infiltration process under different rainfall intensities, which has efficient numerical calculation and symbolic calculation functions, and can quickly carry out complicated mathematical operations and analysis. The main operation is to convert the improved model function proposed above into symbolic formulas, input them into the editing window, and then substitute relevant parameters for the solution, and the soil parameters involved are shown in Table 1.
Meanwhile, in order to compare this with the theoretical calculation, the FLAC2D software was used to simulate one-dimensional infiltration, which can effectively simulate the flow of two immiscible fluids (water and air, but the effect of air is not considered in this paper) in porous media. The fluid transport is described by Darcy’s law:
q i w = k i j w k r w x j ( P w ρ w g k x k )
where k i j is the saturated mobility coefficient (which is a tensor), k r is the relative permeability for the fluid (which is a function of saturation), P is the pore pressure, ρ is the fluid density and g is gravity.
The relationship between relative permeability and saturation is usually empirically determined [18], and can be expressed as
k r w = S e b [ 1 ( 1 S e 1 / a ) a ] 2
where a and b are constants and a = 1 − 1/n, Se is the effective saturation.
The effective saturation is defined as:
S e = S w S r 1 S r
where Sr is the residual saturation.
Combining the fluid balance laws with the fluid constitutive laws for water provides the following expressions:
n [ S w K w P w t + S w t ] = [ q i w x i + S w ε t ]
where ε is the volumetric strain, n is porosity, K is the fluid bulk modulus, and t is time.

3.1. Comparison under the Hypothesis of Uniform Moisture Content

The situation for the uniform moisture content distribution along the depth direction is first considered. A soil column model was established using the soil parameters in Table 1 to analyze the infiltration process, as shown in Figure 5, by setting the middle part as a monitoring section to observe the distribution of the moisture content. Meanwhile, the flow boundary was specified on the top surface (AB) to represent different rainfall intensities, and the others (AC, CD, BD) were assumed to be airtight.
The comparative calculation under five rainfall intensities were carried out (1 × 10⁻⁷ m/s, 5 × 10⁻⁷ m/s, 1 × 10⁻⁶ m/s, 2 × 10⁻⁶ m/s, 4 × 10⁻⁶ m/s), and it should be noted that the selected rainfall intensity was numerically smaller than the saturated permeability coefficient because it is an unsaturated infiltration process.
After theoretical calculation and numerical simulation, the distribution of the soil moisture profile at different times is shown in Figure 6, taking two rainfall intensities (q = 1 × 10⁻⁶ m/s and q = 1 × 10⁻⁷ m/s) as examples. It can be seen that with the increase in time, the scope of the soil wetting zone continued to expand, while the surface moisture content was higher, and gradually decreased towards the interior. In addition, the stratification of the soil moisture content profile can be clearly observed, that is, after the moisture content reaches the critical value, it will not change, but gradually and stably increase from top to bottom within the limit of critical moisture content. At the same time, the results between the proposed model and simulation are in good agreement, and the maximum error is no more than 5%, as shown in Table 2. Compared with the horizontal wetting front hypothesis of the traditional model, the result of the proposed model is more in line with the actual wetting front shape.
The variation trend of the soil surface moisture content with time under different rainfall intensities can be obtained using Equation (8), following numerical simulation calculation and comparison, for which the results obtained are shown in Figure 7. It can be seen that the surface moisture content obtained by the improved model and simulation results have the same trend, and the maximum error is no more than 5%, as shown in Table 3, which proves the validity of model. Moreover, in the early stage, the surface soil moisture content increases nonlinearly, and it will gradually tend to a certain value after a while, that is, the critical moisture content. The rainfall intensity has a great impact on the increase rate, and the greater the rainfall intensity, the faster the increase in the moisture content, and the shorter the time required to reach the critical moisture content.
Figure 8 shows the variation law of the wetting front depth with time for the improved model. It can be seen that the wetting front depth increases nonlinearly with time at first, and the lower the rainfall intensity, the longer the nonlinear duration, which corresponds to the transition stage. After a while, the wetting front depth increases linearly with time, and the greater the rainfall intensity, the greater its growth rate, which corresponds to the stable stage.

3.2. Comparison under the Hypothesis of Non-Uniform Moisture Content

IN the previous section, we discussed the problem of unsaturated infiltration under uniform moisture content, while in actual engineering, the initial moisture content in soil is not uniformly distributed, but changes with depth. Therefore, the column model in Section 3.1 was used to obtain a moisture content distribution law that is close to the actual situation, where the initial saturation was set as 1, and the bottom (CD) was set as the drainage boundary, allowing it to drain freely for a sufficient time.
After stabilizing, the results of the moisture content in the monitored section were extracted and substituted into Equation (12) for nonlinear fitting, as shown in Figure 9, and the fitting effect obtained is good.
By inputting the results into the proposed model, the variation trend of the soil surface moisture content with time under different rainfall intensities can be obtained, as shown in Figure 10. Since the initial moisture content of shallow soil changes only slightly with depth, the calculated variation trend of surface moisture content is similar to the hypothesis of the uniform moisture content. At the same time, it can be seen that the model proposed in this paper is in good agreement with the simulation results, and the maximum error is no more than 5%, as shown in Table 4.
Figure 11a shows the variation trend of the surface moisture content with time under different hypotheses. It can be seen that the variation trend under two hypotheses is basically the same, and both increase nonlinearly with time. However, the calculated value under the non-uniform initial moisture content is larger than that under the uniform hypotheses, and the specific difference is shown in Figure 11b. Figure 11b shows the relationship between the surface moisture content and time differences under two hypotheses. It can be seen that when the rainfall intensity is small, the time difference increases more obviously, and it decreases accordingly with the increase in rainfall intensity. That is, before the critical moisture content is reached, to achieve the same surface moisture content, when the rainfall intensity is smaller, a longer amount of time is required under the uniform moisture content hypothesis compared to that under the non-uniform condition. When the rainfall intensity increases to a certain extent, the change in time difference is not obvious. The reason is that when the initial moisture content of shallow soil only slightly changes with depth, the rainfall intensity is greater, the surface moisture content increases faster, and most of the rainwater is used for the increase in the surface moisture content, which has little impact on the bottom.
The variation law of the wetting front depth is shown in Figure 12 under different rainfall intensities. Figure 12a presents the results between the improved model (under uniform and non-uniform moisture content hypotheses) and the traditional model, whereas Figure 12b shows the FLAC simulation results. The analysis results between theoretical model and numerical simulation are shown in Table 5, where it can be seen that the simulation is in good agreement with the improved model, but not with the traditional model, indicating the accuracy of the improved model.
Meanwhile, it can be seen from Figure 12, for the same rainfall intensity, due to the moisture content of the wetting front, it gradually increases and is unsaturated during the rainfall process, and the wetting front depth of the improved model in this paper is higher than the calculation results of the traditional model.
Moreover, due to the condition that the initial moisture content increases uniformly with depth, the internal matrix suction is smaller than the hypothesis of the uniform moisture content. Under the same surface moisture content, the matrix suction gradient of the former is significantly greater than the latter.
According to Equation (1), the larger the suction gradient, the faster the seepage velocity in soil. Therefore, the expansion speed of the wetting front under the non-uniform moisture content condition is greater than the latter. At the same time, it can be found that when the rainfall intensity is low, there is little difference in the wetting front depth, and with the increase in rainfall intensity, the difference gradually increases.

4. Discussion

It should be noted that when the rainfall intensity is extremely small, the corresponding critical moisture content is less than the initial moisture content of soil. The model mentioned above is not suitable for this situation and needs to be discussed separately. At this time, due to the supply speed of rainwater being less than the dissipation speed, and the water in soil transferring downward because of gravity, the moisture content at the bottom reaches saturation after a long time, while the moisture content at the surface does not increase but decrease. When the moisture content decreases to the critical value, it will not change, and rainwater begins to work, making the groundwater level rise slowly, for which the seepage mode is shown in Figure 13. In this case, even if the rainfall intensity is small and the strength property of the surface soil is not reduced, the long-term rainfall may also affect the stability of the slope.

5. Conclusions

(1)
In the analysis of non-ponding rainfall infiltration, the model proposed in this paper is more in line with the distribution of moisture content in the actual infiltration process than the traditional model, and better able to reveal the variation trend of soil surface moisture content and wetting front depth with rainfall time.
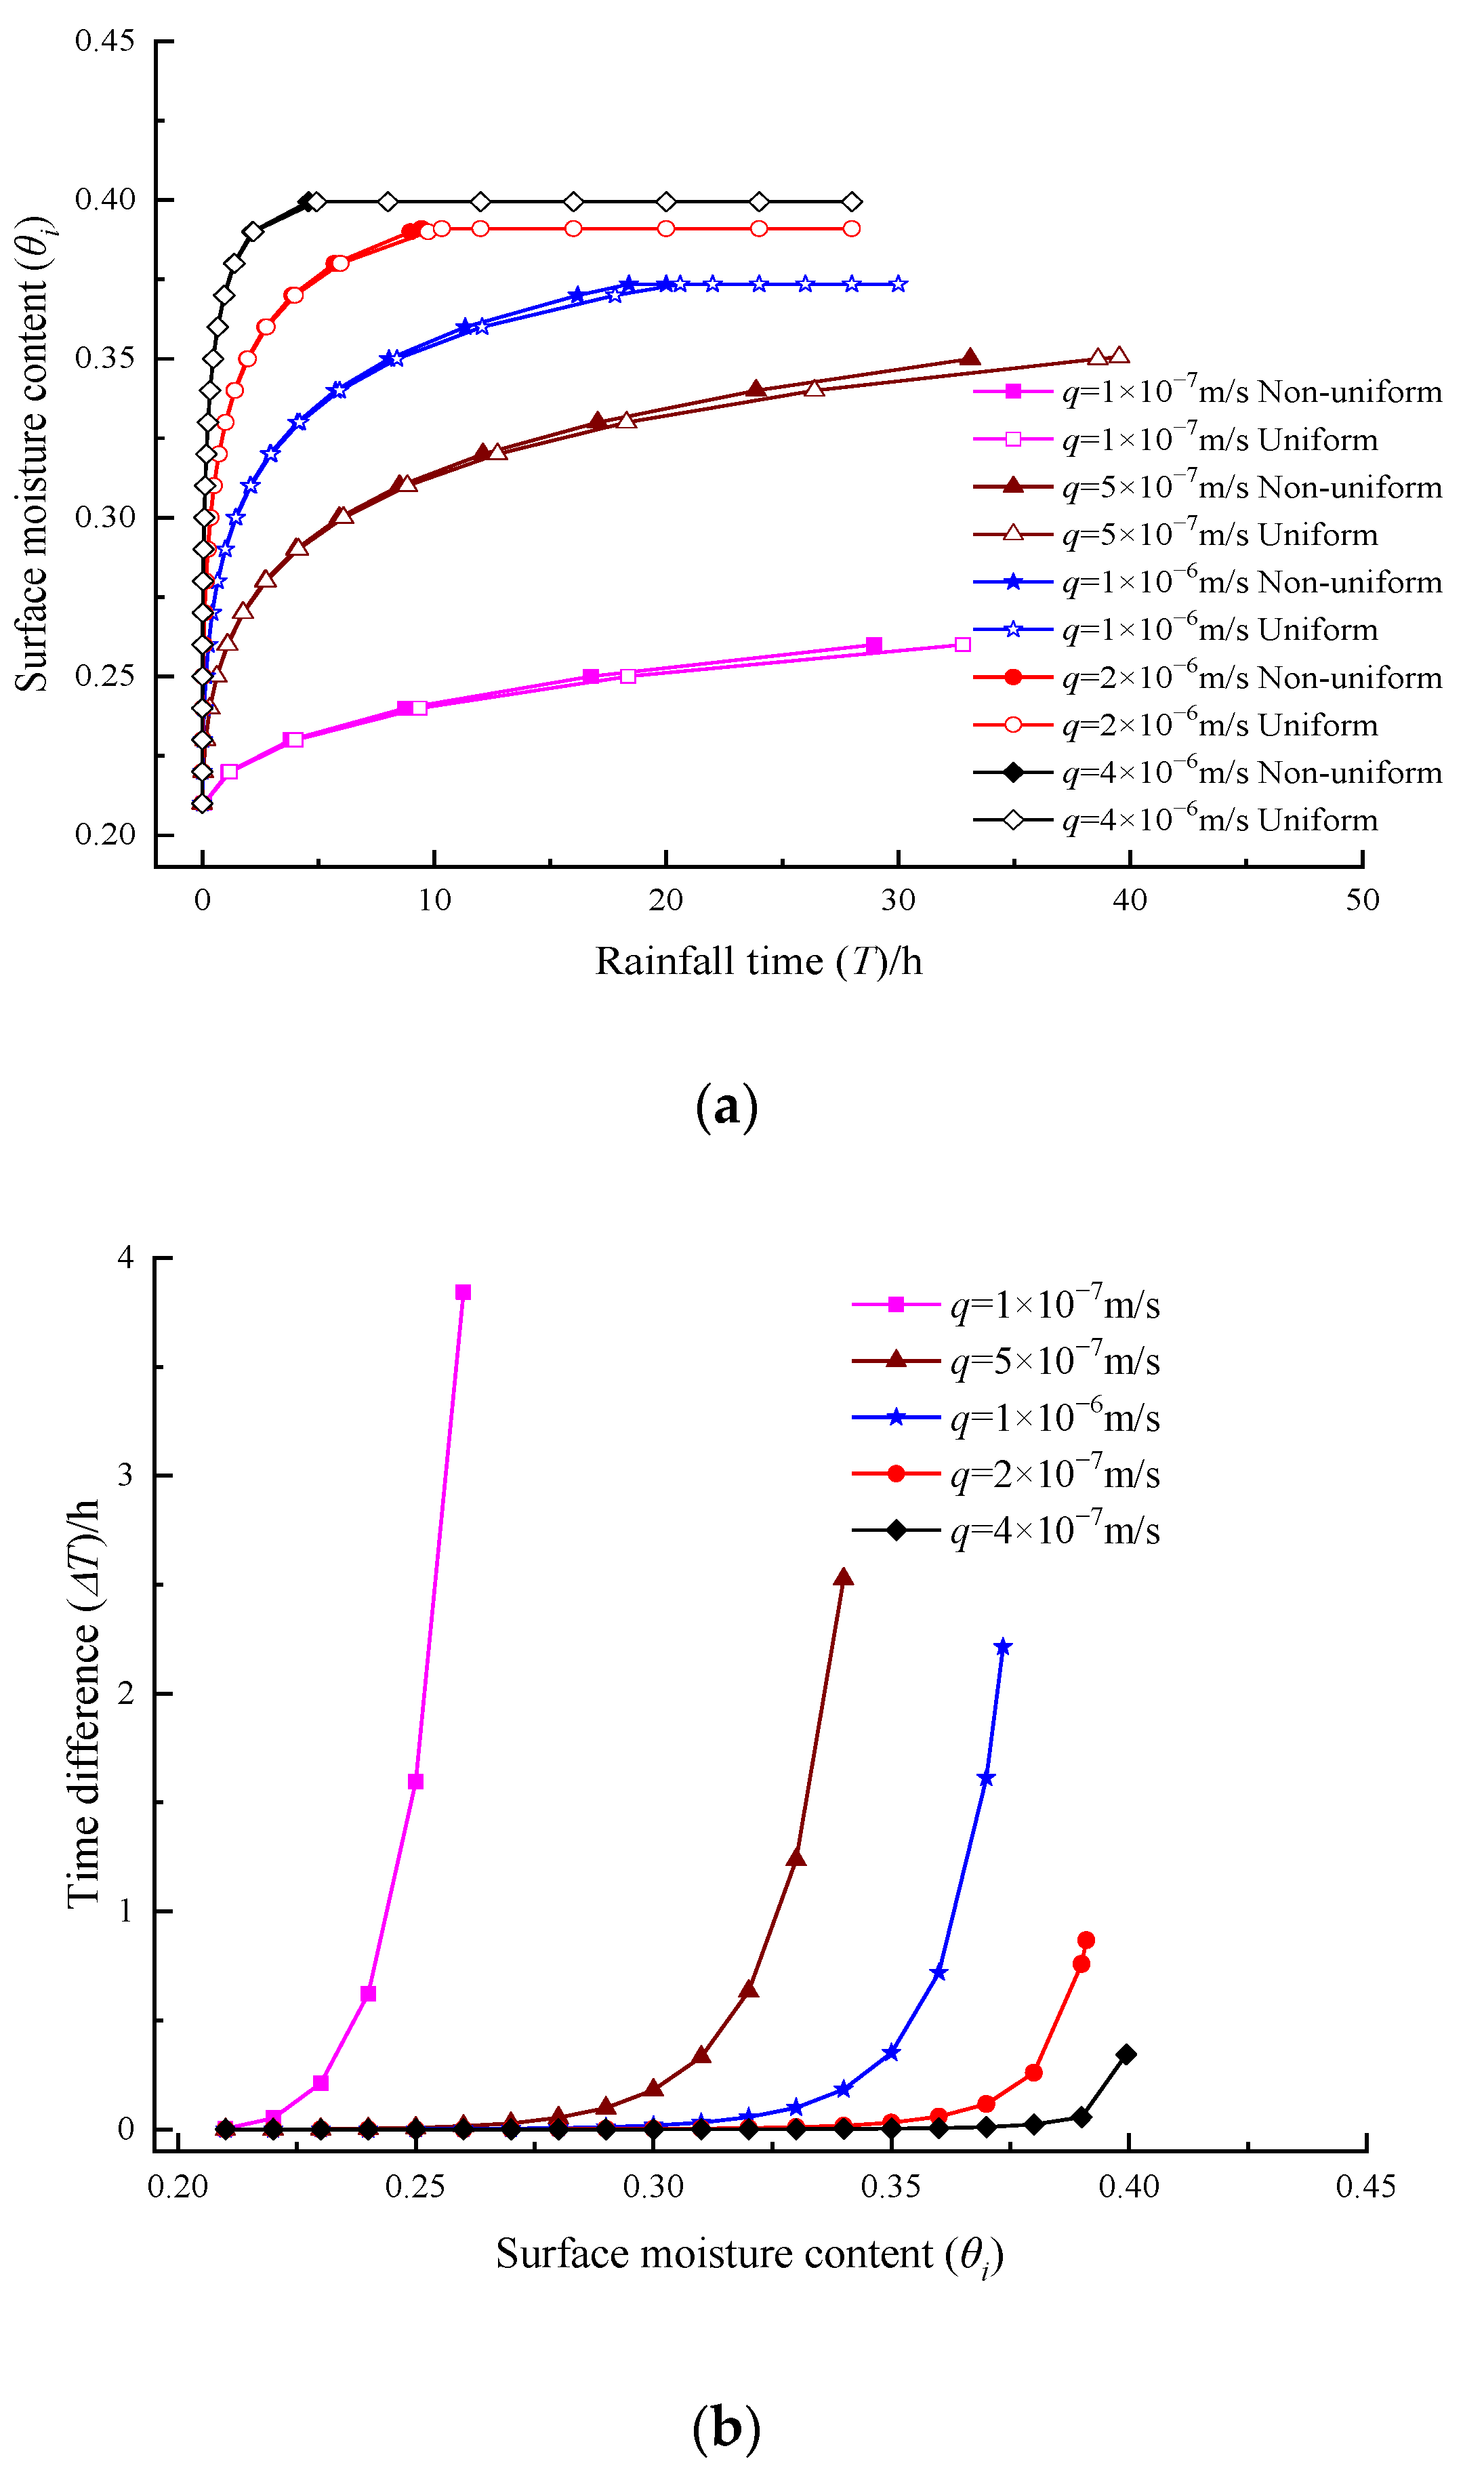
(2)
Under the two hypotheses of uniform moisture content and non-uniform moisture content, before the critical moisture content, to reach the same surface moisture content, the time required for the former is longer than the latter if the rainfall intensity is small. When the rainfall intensity increases to a certain extent, the time difference does not change significantly.
(3)
Due to the variation in moisture content over time, the moisture content calculated by the proposed model is lower than that of the traditional Mein-Larson model under the same rain intensity and duration, but the wetting front depth is significantly higher than the latter, which has a wider scope of influence on soil moisture content, indicating that long-term unsaturated infiltration can affect the moisture content of deeper soil, thus causing slope instability.

Author Contributions

Conceptualization, M.Y. and T.C.; software, M.Y. and X.W.; validation, M.Y. and X.W.; investigation, W.T.; data curation, X.W. and R.F.; writing—original draft preparation, M.Y.; writing—review and editing, M.Y. and T.C.; visualization, W.T. and X.W.; supervision, J.L.; project administration, R.F. and J.L. All authors have read and agreed to the published version of the manuscript.

Funding

This research was funded by “Science and Technology Research and Development Major Program of China Railway Corporation, grant number K2019G042” and “The Fundamental Research Funds for the Central Universities, grant number 2021YJS114”.

Institutional Review Board Statement

Not applicable.

Informed Consent Statement

Not applicable.

Data Availability Statement

Data sharing not applicable.

Acknowledgments

The author would like to thank all the anonymous reviewers for their meticulous comments and helpful suggestions.

Conflicts of Interest

The authors declare no conflict of interest.

References

  1. Gavin, K.; Xue, J. A simple method to analyze infiltration into unsaturated soil slopes. Comput. Geotech. 2008, 35, 223–230. [Google Scholar] [CrossRef]
  2. García-Serrana, M.; Gulliver, J.S.; Nieber, J.L. Calculator to Estimate Annual Infiltration Performance of Roadside Swales. J. Hydrol. Eng. 2018, 23, 04018017. [Google Scholar] [CrossRef]
  3. Lewellyn, C.; Lyons, C.E.; Traver, R.G.; Wadzuk, B.M. Evaluation of Seasonal and Large Storm Runoff Volume Capture of an Infiltration Green Infrastructure System. J. Hydrol. Eng. 2016, 21, 04015047. [Google Scholar] [CrossRef]
  4. Sun, D.-M.; Li, X.-M.; Feng, P.; Zang, Y.-G. Stability analysis of unsaturated soil slope during rainfall infiltration using coupled liquid-gas-solid three-phase model. Water Sci. Eng. 2016, 9, 183–194. [Google Scholar] [CrossRef]
  5. Herbst, M.; Gottschalk, S.; Reißel, M.; Hardelauf, H.; Kasteel, R.; Javaux, M.; Vanderborght, J.; Vereecken, H. On preconditioning for a parallel solution of the Richards equation. Comput. Geosci. 2008, 34, 1958–1963. [Google Scholar] [CrossRef]
  6. Mein, R.G.; Larson, C.L. Modeling infiltration during a steady rain. Water Resour. Res. 1973, 9, 384–394. [Google Scholar] [CrossRef] [Green Version]
  7. Philip, J.R. The Theory of Infiltration: 1. The Infiltration Equation and Its Solution. Soil Sci. 2006, 171, S34–S46. [Google Scholar] [CrossRef]
  8. Iverson, R.M. Landslide triggering by rain infiltration. Water Resour. Res. 2000, 36, 1897–1910. [Google Scholar] [CrossRef] [Green Version]
  9. Li, N.; Xu, J.-C.; Qin, Y.-Z. Research on calculation model for stability evaluation of rainfall-induced shallow landslides. Rock Soil Mech. 2012, 33, 1485–1490. [Google Scholar] [CrossRef]
  10. Yu, N.Y.; Fan, W.; Wei, T.T. Unsaturated sharp wetting front model based on Mein-Larson saturated infiltration model. Chin. J. Geotech. Eng. 2018, 40, 1668–1675. [Google Scholar] [CrossRef]
  11. Tang, Y.; Yin, K.L.; Wang, Y.; Chen, L.; Liu, J. The Landslide Rain Infiltration Based on the Improved Mein-Larson Model. Earth Sci. 2017, 42, 634–640. [Google Scholar] [CrossRef]
  12. Bodman, G.B.; Coleman, E.A. Moisture and energy conditions during downward entry of water into soils. Soil Sci. Soc. Am. J. 1944, 8, 116–122. [Google Scholar] [CrossRef]
  13. Zeng, L.; Li, G.-Y.; Shi, Z.-N.; Liu, D.-S.; Liu, J.; Li, D.-K. Experiment on seepage characteristics of unsaturated soil under rainfall infiltration. China J. Highw. Transp. 2018, 31, 191–199. [Google Scholar] [CrossRef]
  14. Wang, W.Y.; Wang, Z.R.; Wang, Q.J.; Zhang, J.F. Improvement and evaluation of the Green-Ampt model in loess soil. J. Hydraul. Eng. 2003, 34, 30–34. [Google Scholar] [CrossRef]
  15. Xu, X.; Xi, Y.; Yao, W.J. Unsaturated wetting front model based on the whole process of rainfall infiltration. J. Hydraul. Eng. 2019, 50, 1095–1102. [Google Scholar] [CrossRef]
  16. He, Z.M.; Zhong, W.; Liu, Z.F.; Li, Q.; Shu, Q.H. Stability analysis of carbonaceous mudstone coarse-grained soil embankment slope based on improved Green-Ampt infiltration model. J. Cent. South Univ. (Sci. Technol.) 2021, 52, 2179–2187. [Google Scholar] [CrossRef]
  17. Peng, Z.Y.; Huang, J.S.; Wu, J.W.; Gu, H. Modification of Green-Ampt model based on the stratification hypothesis. Adv. Water Sci. 2012, 23, 59–66. [Google Scholar]
  18. van Genuchten, M.T. A Closed-form Equation for Predicting the Hydraulic Conductivity of Unsaturated Soils. Soil Sci. Soc. Am. J. 1980, 44, 892–898. [Google Scholar] [CrossRef] [Green Version]
  19. Wang, Q. A New Approach to Predict Wetting Front. Trans. Chin. Soc. Agric. Eng. 1993, 9, 24–29. [Google Scholar]
Figure 1. Moisture content profile in transitional stage with uniform initial moisture content.
Applsci 12 06185 g001
Figure 2. Moisture content profile in stable stage with uniform initial moisture content.
Applsci 12 06185 g002
Figure 3. Moisture content profile in transitional stage with non-uniform initial moisture content.
Applsci 12 06185 g003
Figure 4. Moisture content profile in stable stage with non-uniform initial moisture content.
Applsci 12 06185 g004
Figure 5. Schematic diagram of model.
Applsci 12 06185 g005
Figure 6. Distribution map of soil moisture content profile at different moments under different rainfall intensities.
Applsci 12 06185 g006
Figure 7. Variation trend of soil surface moisture content with time under the hypothesis of uniform moisture content.
Applsci 12 06185 g007
Figure 8. Variation of wetting front depth with time.
Applsci 12 06185 g008
Figure 9. Variation trend of volume moisture content with depth.
Applsci 12 06185 g009
Figure 10. Variation trend of soil surface moisture content with time under the hypothesis of non-uniform moisture content.
Applsci 12 06185 g010
Figure 11. Variation law of surface moisture content under different hypotheses: (a) Variation trend of surface moisture content with time; (b) Relationship between time difference and moisture content.
Applsci 12 06185 g011
Figure 12. Variation of wetting front depth with time in different models. (a) The infiltration model results. (b) The FLAC simulation results.
Applsci 12 06185 g012
Figure 13. Seepage mode when the critical moisture content is less than the initial moisture content: (a) Uniform moisture content; (b) Non-uniform moisture content.
Applsci 12 06185 g013
Table 1. Model calculation parameters.
ParametersKs/(m/s) θ s θ r θ 0 α/m−1n
Value5.8 × 10−60.40.0150.21.51.5
Table 2. Analysis of results for soil moisture content profile.
Rainfall Intensity (m/s)Maximum Error (%)
1 × 10−63.6
2 × 10−64.5
Table 3. Analysis of results for the uniform moisture content model.
Rainfall Intensity (m/s)Maximum Error (%)
1 × 10−71.16
5 × 10−73.45
1 × 10−63.93
2 × 10−63.94
4 × 10−63.24
Table 4. Analysis of results for the non-uniform moisture content model.
Rainfall Intensity (m/s)Maximum Error (%)
1 × 10−72.08
5 × 10−73.84
1 × 10−64.21
2 × 10−63.89
4 × 10−63.51
Table 5. Analysis of results between the proposed model and simulation results.
Rainfall Intensity (m/s)Maximum Error (%)-(Non-Uniform)Maximum Error (%)-(Uniform)Maximum Error (%)-(Traditional)
1 × 10−71.51.839.1
5 × 10−72.83.242.2
1 × 10−62.64.122.1
2 × 10−64.14.220.2
4 × 10−64.85.19.8
Publisher’s Note: MDPI stays neutral with regard to jurisdictional claims in published maps and institutional affiliations.

