Review

Selected Applications of Terahertz Pulses in Medicine and Industry

1
TeraView Limited, 1 Enterprise, Cambridge Research Park, Cambridge CB25 9PD, UK
2
Department of Electronic and Electrical Engineering, University College London, London WC1E 7JE, UK
*
Author to whom correspondence should be addressed.
Appl. Sci. 2022, 12(12), 6169; https://doi.org/10.3390/app12126169
Submission received: 30 March 2022 / Revised: 26 May 2022 / Accepted: 1 June 2022 / Published: 17 June 2022
(This article belongs to the Special Issue Terahertz Applications for Nondestructive Testing)

Abstract

:
This article contains a brief summary of areas where terahertz technology is making an impact in research and industrial applications. We cover some of its uses in the pharmaceutical setting, where both imaging and spectroscopy play important roles. Medical applications are also being pursued in many research laboratories, primarily for imaging purposes and following on from the first results just over 20 years ago. The three-dimensional imaging capability of pulsed terahertz allows for the observation of tumours below the surface of tissue, such as basal cell carcinoma of skin. The recent use of the technology in studies of cultural heritage has shown to increase our understanding of the past. The power of terahertz is exemplified by the discussion on its importance in different industries, such as semiconductor circuit manufacturing and automotive assembly.

1. Introduction

At the turn of the century, most terahertz experiments were carried out using an optical table with a collection of lenses and components driven by a laser, either pulsed or continuous wave (CW). Today, a variety of systems are commercially available, and the technology is making an impact in a wide range of industrial and research applications. Initially, an educational element was required, as customers and users had rarely heard of terahertz technology, much less what it could accomplish. By and large, this has been successfully addressed, and now customers approach manufacturers for information on products. It was frequently said that the laser in its very early days was “a solution looking for a problem”, and so it was with terahertz. However, it now appears that terahertz is the solution for many problems. Often, it is not clear that problems exist in certain sectors until terahertz technology is brought in and applied. The remarkable property of imaging at terahertz frequencies is its ability to show reflections from changes in optical properties without being scattered. This allows information to be obtained on topics such as coatings and paint layers and the internal structure of pharmaceutical tablets. Identification can be obtained by spectroscopy, which unlike infra-red is not subject to numerous intra-molecular absorption lines and is determined by the relative movement of large molecules (inter-molecular) or units, as well as phonons in crystalline materials. A diverse range of applications follows from the use of spectroscopy, such as the detection of polymorphism in drug compounds and identification of the type of inks in heritage studies. In terms of technology platforms, although CW terahertz systems are more compact and less expensive than those that use pulsed femtosecond lasers, the differentials have closed in recent years. CW techniques are limited in their range of applications. Gauge (layer thickness) and imaging applications can be related to measurements of time and distance, which are then reconstructed to determine thickness or imaging and detection of small changes in materials properties. This is more straightforward and accurate to accomplish with pulsed systems using time-of-flight data.
The paper is broken down into sections in a historical prospective in areas where TeraView has led the field in applying terahertz technology. Initially, in Section 2, we review the application in medical imaging where TeraView was the first to demonstrate the application in cancer imaging and was the first to report in vivo human basal cell carcinoma (BCC). In Section 3 and Section 4, we report on the pioneering work in pharmaceutical applications; this has opened a whole new area of research for other groups to follow and companies to exploit. As terahertz technology has become smaller and lighter, the area has been of interest to the cultural heritage community where TeraView was involved in the understanding of inks. This is reviewed in Section 5, together with the current work of a number of groups around the world. The understanding of paints and paint layer structure is reviewed in Section 7, where TeraView is making advances in the implementation of terahertz sensors in the factory environment, taking the technology out of the laboratory and into the real world. Finally, in Section 8, we review the world leading technology application of electro optical terahertz pulse reflectometry (EOTPR) into semiconductor packaging, where TeraView is the leading supplier of instruments to major manufacturers in this sector.

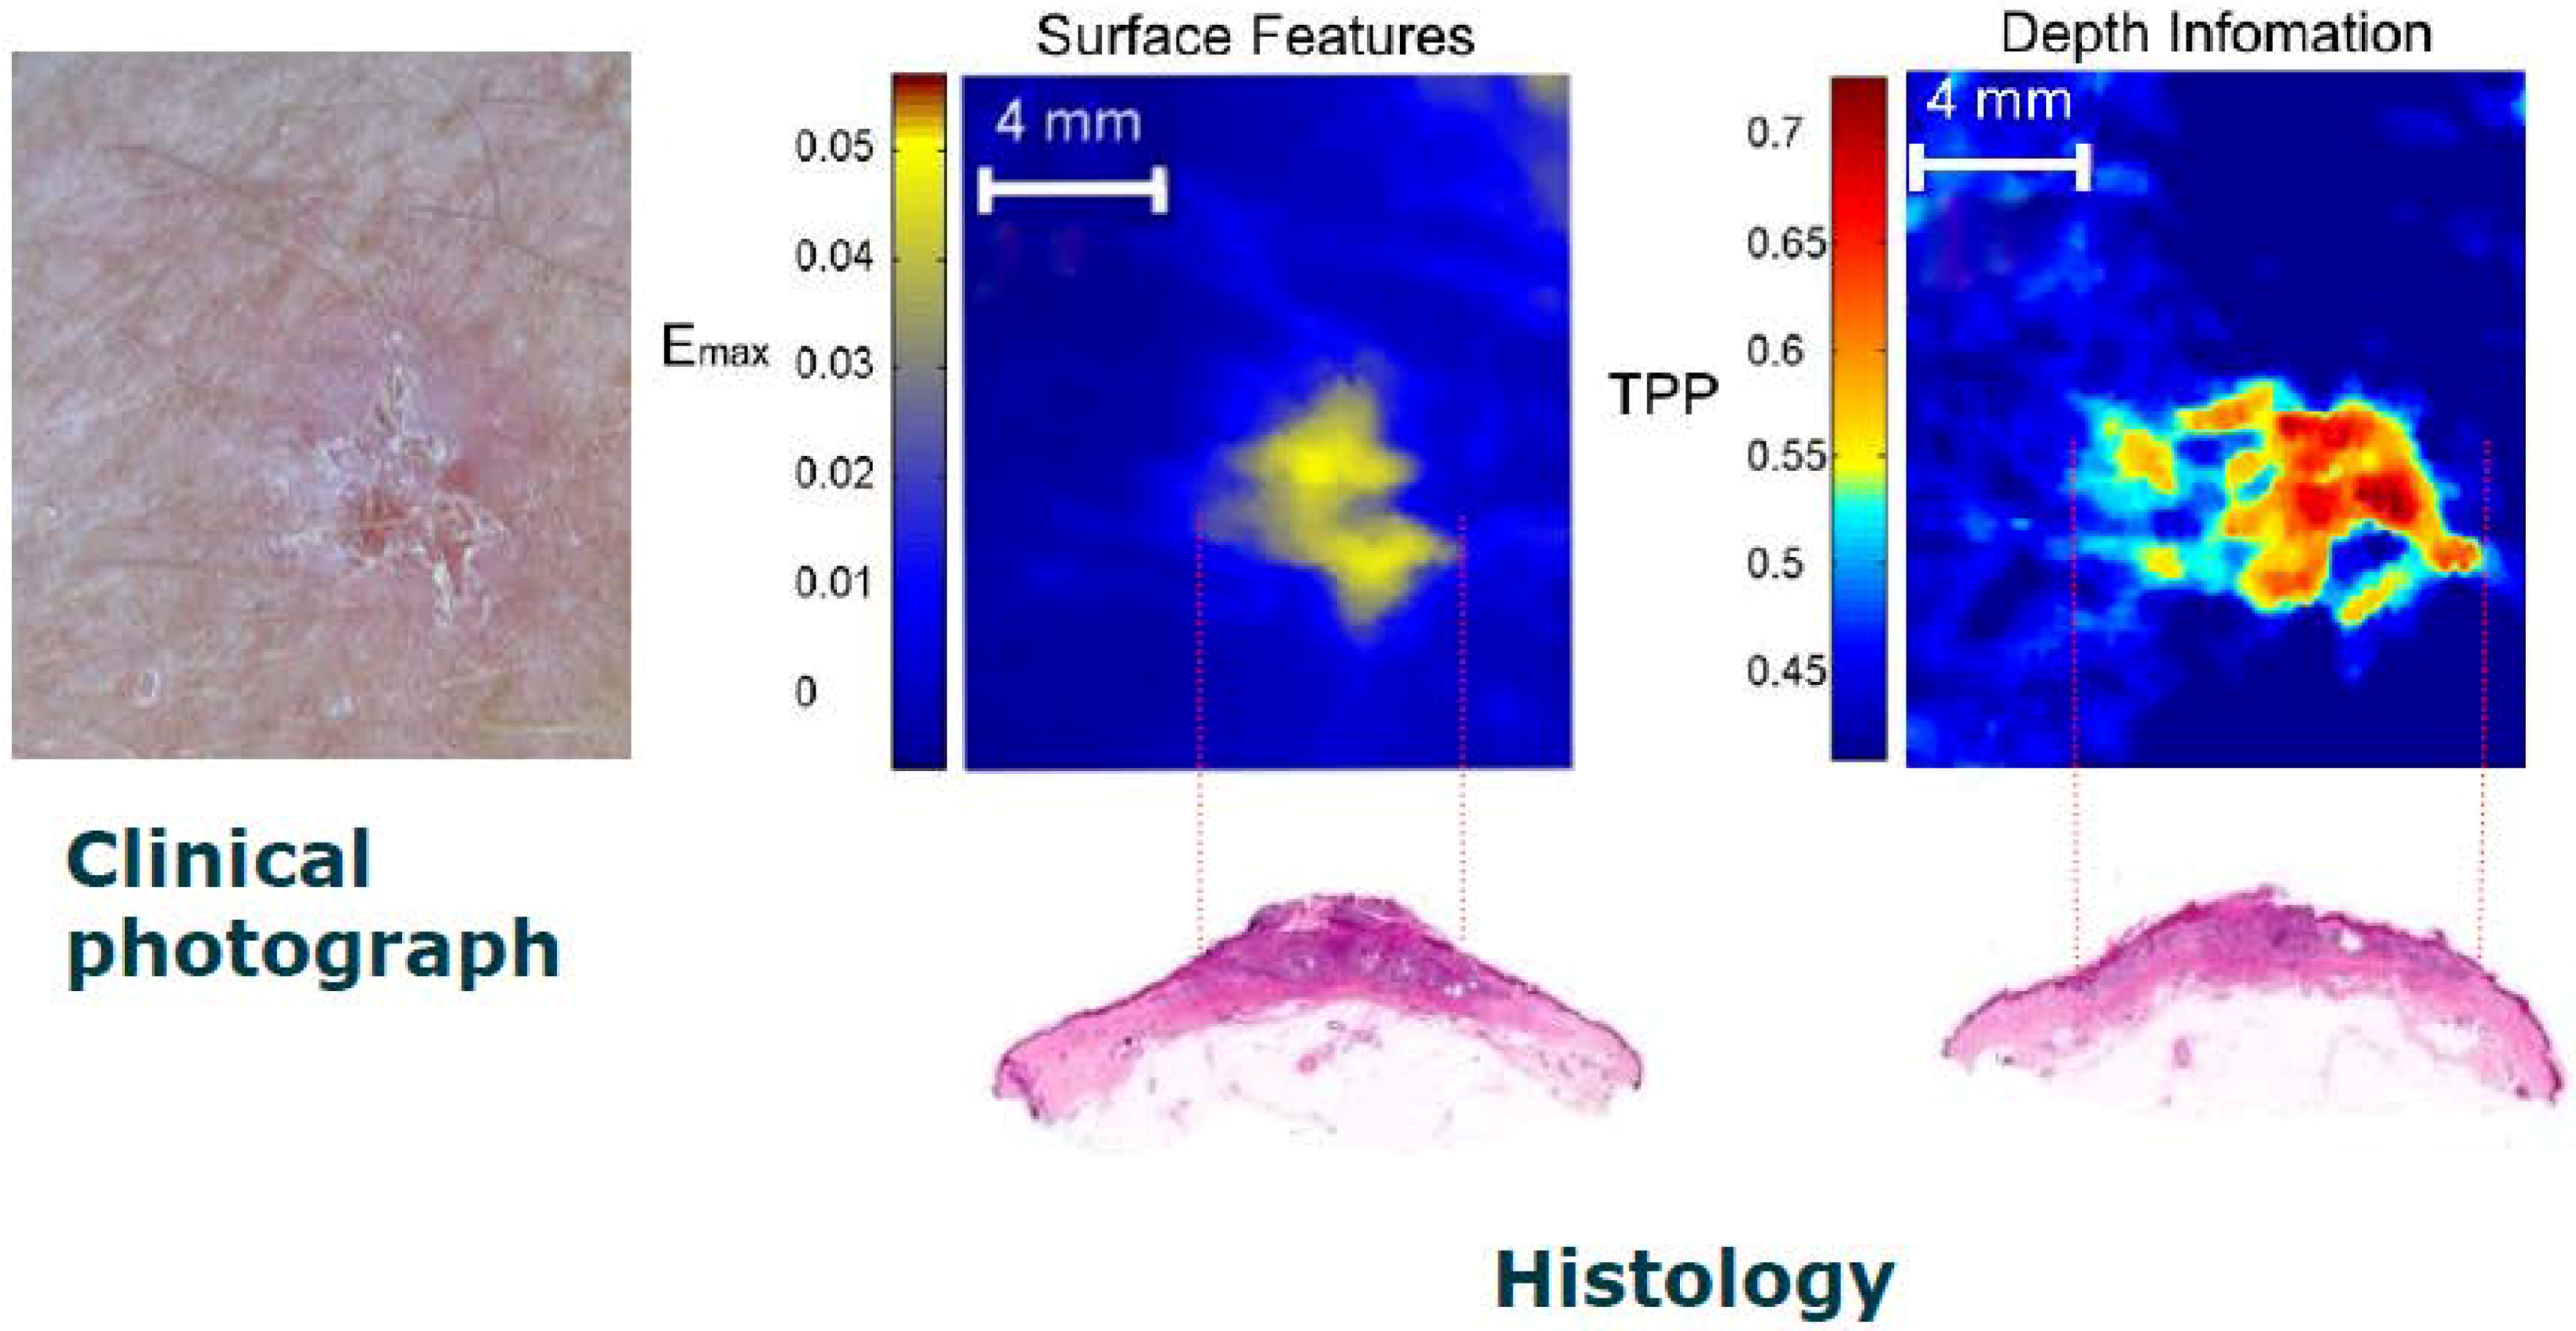
2. Terahertz Imaging and Spectroscopy in Medicine and Biology

There is considerable interest in applying terahertz imaging and spectroscopy in medicine and biological sciences. The subject has advanced considerably in the approximate 20-year period since the earliest results of Woodward and co-workers, showing that cancerous and healthy tissues differed in their terahertz response [1,2,3,4,5,6,7,8,9,10,11,12,13,14,15] and the first human organ, a tooth, was imaged. This image, which is on the BBC News website, (http://news.bbc.co.uk/1/hi/sci/tech/368558.stm (accessed on 20 February 2022)), is important as the images showed that erosion of the surface enamel had occurred in specific locations, allowing bacteria to enter and cause decay. The traditional method of X-ray imaging is not as sensitive to the presence of enamel, as the change in contrast is not significant [16]. Churchley et al. [17,18] from GlaxoSmithKline were able to correlate the strength of terahertz reflection from the tooth surface and the mineral changes within the tooth, thus monitoring the remineralisation of teeth.
Interest in medical applications of terahertz has also been generated because the low energy of terahertz radiation results in an absence of ionisation damage to molecules. The imaging is non-invasive and the sensitivity of coherent detection allows the observation of small changes in the tissue properties, which create a reflection interface. There have been suggestions that a molecular resonance may occur in the terahertz region but its presence is not clear. The terahertz spectroscopy of human basal cell carcinoma (BCC) was reported by Wallace et al. [4] The authors were able to observe clear differences in both the absorption coefficient and the refractive index of diseased and healthy tissue over the range 0.1 to 2 THz.
Most terahertz work has focused on imaging, as spectroscopic studies of proteins [19] and large molecules, such as DNA, do not in general produce sharp resonant structure but rather a broadband absorption [20]. For proteins, this can be affected by conformational changes, and insight is gained by the terahertz absorption of an aqueous solution, as the presence of protein displaces the water and reduces absorption [21,22,23]. Similarly, bonding between proteins and the hydrated surrounding layer results in a frequency shift of the water absorption in contrast to normal water absorption.
Cellular studies have been performed, as the hydration state of the cell alters terahertz sensitivity due to the various vibrational modes of water molecules. There are reports that methylated malignant DNA [24,25,26] has a resonant structure at approximately 1.65 THz, which could serve as an indicator of the subsequent formation of a tumour. Markers that preferentially attach to tumours have been important for enhancing other imaging modalities, such as MRI, and in the terahertz regime, gold nanorods designed for attachment to tumour growth factor receptors have enhanced absorption [27,28]. Tryptophan has been used as a marker for skin cancer as it has well defined absorption peaks.
Advances in instrumentation have resulted in the development of hand-held devices for both medical diagnostics and security applications. Endoscopic systems have been demonstrated to work well for excised tissue, but moisture would be a problem in clinical use, for example with gastroscopy [29]. An otoscope for investigations of the ear has already been demonstrated [30]. The penetration depth of terahertz pulses in excised tissues is limited by the strong water absorption. Freezing the samples has resulted in a marked increase in range, due to the suppression of the water modes of vibration.
Although the earliest investigations of cancerous tissue showed strong absorption compared with healthy tissue, these experiments were performed with excised basal cell carcinoma samples. Following this proof of principle, in vivo measurements were performed on hospital patients, which clearly showed how the carcinoma increased in extent with increasing distance below the surface of the skin and reflecting the principal location of the basal cells. The advantage of terahertz imaging is shown in Figure 1, which is an example of basal cell carcinoma. A photograph of the skin is on the left and the corresponding terahertz image of the surface is in the centre. By contrast, the image on the right was taken at a depth corresponding to the stratum corneum–epidermis interface. The enhanced spreading of the cancer below the surface is clearly evident. The “gold standard” histo-pathology result is shown below the images, which is in agreement with the terahertz image. The field of view is approximately 8 mm square. A further guide to future uses of terahertz imaging is indicated, as the time dependent shape of the terahertz pulse has a positive contrast for basal cell carcinoma compared with normal tissue, where it is negative for inflammation and scar tissue.
Many forms of cancer have been investigated by terahertz, such as colonic [9] and oral. Due to its prevalence, breast cancer has received the most attention, where the limited penetration of terahertz prevents use in mammographic screening. However, it has considerable success in the investigation of excised tissue, particularly the margins between healthy and cancerous regions. In this respect, it has an advantage over the “gold standard” of histology where analysis can take over a day in marked contrast to terahertz, where determination of tissue type and margins can be performed in real time in an operating theatre.
This in-theatre use of terahertz has both economic and psychological benefits. Economic benefits stem from the fact that at present, around 20% of patients are recalled for surgery, reflecting the surgeon’s desire to conserve as much healthy tissue as possible and resulting in cancerous tissue remaining near the margins. There is a psychological benefit because the recall process for additional procedures, results in patient anxiety and distress and complete removal of the diseased tissue in a single operation has beneficial effects to them.
Significantly, the enhanced sensitivity of terahertz imaging [5] was apparent by an image showing the existence of an early case of ductal carcinoma in situ, DCIS, which in the first stages is very difficult to directly observe with X-rays.
First, measurements on excised cancerous tissue were sufficiently encouraging to stimulate comprehensive investigations. A detailed investigation of many excised samples of tissue containing breast cancer using a handheld terahertz imager, developed by TeraView, is discussed in references [32,33]. Different statistical techniques were used, and the results showed good values of sensitivity, specificity and accuracy, SSA; however, the major cause of false positives was the presence of fibrous tissue, which reflected in a similar way to cancerous tissue. When the fibrous samples were excluded, the SSA values rose to over 90%, which was comparable with other diagnostic techniques. Reflections from adipose tissue were quite different from cancer reflections and did not present any particular problems.
Pulsed terahertz is used in order to obtain a 3D image. However, CW investigations have revealed a strong frequency dependence of absorption, which has not been investigated in detail. Initially, it was thought that the enhanced absorption by cancer was due to the enhanced blood content and water absorption; however, as described earlier, more recent work has suggested that methylation of DNA, specifically methylated cytidine, which occurs in the early stages of cancer development, produces a molecular resonance fingerprint in the terahertz region.
At present, medical/biological applications are at an early stage and considerable progress is expected in analysis and signal processing. Markers and contrast agents can be developed, which enhance the detection and reduce false positive occurrence in the analysis. For example, Fe3O4 and Gd2O3 nanoparticles have been used in the detection of early-stage gastric cancer. Given the high level of interest in terahertz imaging technology, it is also possible that the best course will be to combine this with another imaging modality, such as near-infrared or optical computed tomography (OCT).
Terahertz pulsed imaging still has some challenges, namely the depth of penetration of skin, which may be limited by water absorption and may not be sufficient. This may be overcome with the use of nanoparticles and markers. The technique requires relativity flat surfaces, and this can be overcome using surgical robots, which can follow the surface of the skin. However, for investigating interfaces, it can resolve features that cannot be observed by X-rays, such as ductal carcinoma in situ, which is a manifestation of breast cancer.

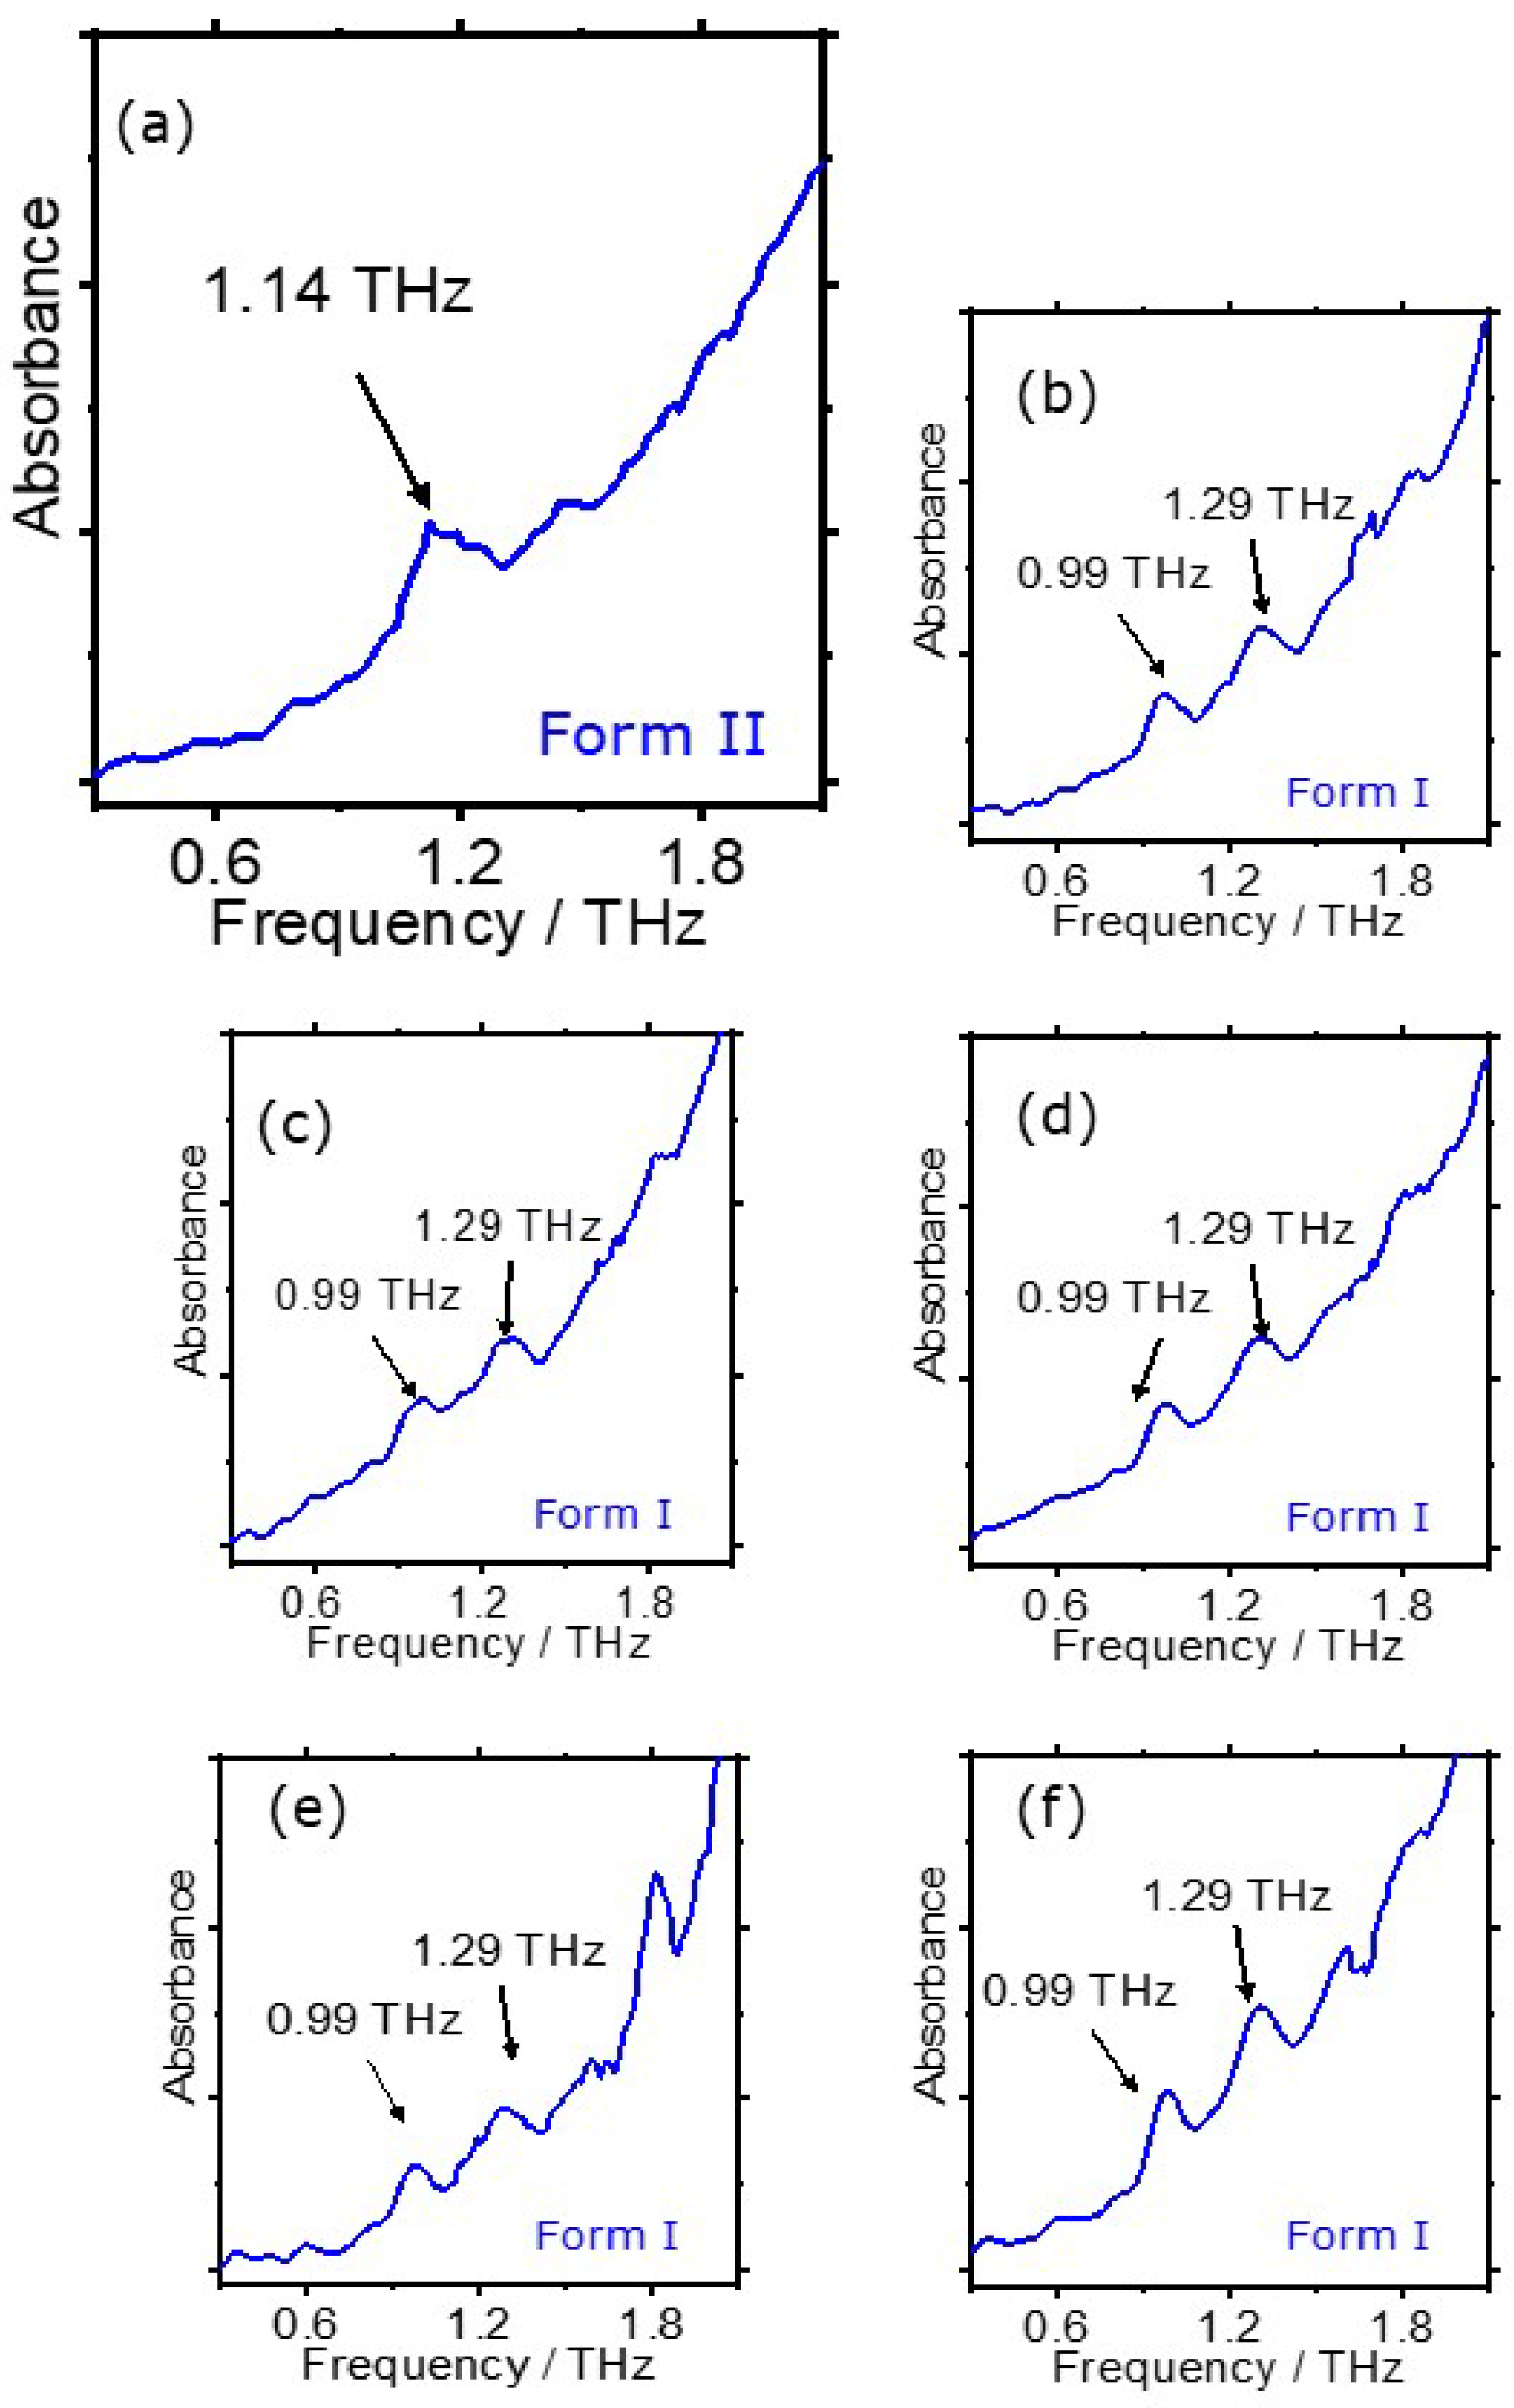
3. Terahertz Spectroscopy in a Pharmaceuticals

The terahertz region of the electromagnetic spectrum probes low frequency modes of the solid-state materials. It is unlike mid infrared spectroscopy, where the observed transitions can easily be assigned to chemical functional groups of molecules. These vibrations are governed by intra-molecular vibrations, i.e., atomic bond strengths and mass of the atoms within the molecule. A terahertz spectrum is influenced by weak forces within the crystalline state. This leads the to the observed bands to be determined not so much by the functional groups within the molecule but by the packing density or geometry within the crystalline state, i.e., inter-molecular modes. Because of this sensitivity, terahertz spectroscopy has become a tool to distinguish between polymorphs of chemical substances. Polymorphs are the same chemical substance but have different crystalline forms and, therefore, packing density within the solid state. Understanding the polymorphism of chemical substances is extremely important to the pharmaceutical industry, as these polymorphs may have different dissolution rates, solubility, stability or even biological performance. From an economic perspective, each polymorph represents a unique crystalline state; therefore, it is important to patent each of these states. An example of this is ranitidine hydrochloride developed by Glaxo [34] for the treatment of ulcers. The original patent was based on form I. However, during scale up (from laboratory to manufacturing), as it sometimes happens, a new polymorph was discovered and Glaxo patented this later [35,36]. Form II was formulated into Glaxo’s product Zantac with sales over $3.5 billion in 1991. The original patent [34] expired in 1995, followed by a rush to bring to the market from generic drug companies tablets based on form I. Glaxo took a number of these generic companies to court in breach of their patent claiming that the generic companies were manufacturing tablets with a mixture of form I and II and not just pure form I. The generic company had to, therefore, prove that there was no form II in their tablets or form I. At this time, this was achieved by using X-ray powder diffraction. Glaxo lost the case.
Aspirin was the first molecule of pharmaceutical importance to be studied using terahertz spectroscopy in 2001 [37]. In 2003, Taday et al. [38] demonstrated that terahertz pulses could be used to distinguish between polymorphs of ranitidine hydrochloride. Figure 2 shows the terahertz spectra of six different suppliers tablets containing ranitidine hydrochloride as its active ingredient. Figure 2a presents the spectrum of a tablet from the innovator company (Glaxo), showing a single terahertz peak at about 1.14 THz. Glaxo uses form II of the drug, as discussed elsewhere in this paper. The spectra shown in Figure 2b–f are from the tablets obtained from generic companies that use form I. The terahertz spectra of form I is characterised by two peaks at about 0.99 THz and 1.29 THz.
Since this original paper, other polymorphs of drug substances have been studied that use terahertz pulsed spectroscopy and these are summarised in Table 1. To demonstrate that terahertz pulse could be used to quantify substances with mixtures, Strachan et al. [39] used forms I and III of the drug molecule carbamazepine. The authors mixed the two polymorphs in tablets of polyethylene and were able to obtain a limit-of-detection of 0.44% and a limit-of-quantification of 1.34% between the two substances.
The understanding of the modes in the terahertz region has increased over the recent years, with work undertaken by the Korner group at the University of Syracuse [45,62] and more recently, the Ruggiero group at the University of Vermont [63]. These groups have shown that isolated molecule theory in the crystalline state is not valid. These groups have shown that is possible to assign transitions in solids in the terahertz region but the process requires an understanding of long-range forces within a substance.
Drug substances are not only found in the crystalline state. It is becoming more common for pharmaceutical companies to manufacture amorphous materials, due to the poor water solubility of new chemical substances of interest. In the terahertz region, the absorption spectrum of amorphous materials is dominated by the vibrational density of states (VDOS) [64], yielding broad featureless absorption spectrum [65]. Strachan et al. [39] showed that the terahertz spectrum of amorphous indomethacin is broad and does not contain any well-defined features. Zeitler et al. [43,44] explored the relaxation processes in amorphous carbamazepine. In these papers an amorphous sample was heated while being monitored by a terahertz spectrometer. The authors reported a three stage dynamic process in which some of the material sublimed during heating process. They were able to estimate from the kinetics the amount of material in the gas phase during the process. This work was later extended to supercooled glass in substances such as paracetamol [66]. The ability to predict the stability of amorphous material in the pharmaceutical industry is important, as it can set a limit to the storage conditions or the lifetime of the product. Insights into the molecule mobility using terahertz pulses was provided by Sibik and Zeilter [66], who used the mobility to predict the stability of amorphous materials [67,68,69] for a number of molecules, including paracetamol, indomethacin, flufenamic acid, and simvastatin. The Cambridge group suggest that the β-relaxation could be as a parameter that could predict the stability of amorphous drugs. The group from the University of Copenhagen were able to provide evidence for this using the orthogonal technique of X-ray powder diffraction [70].

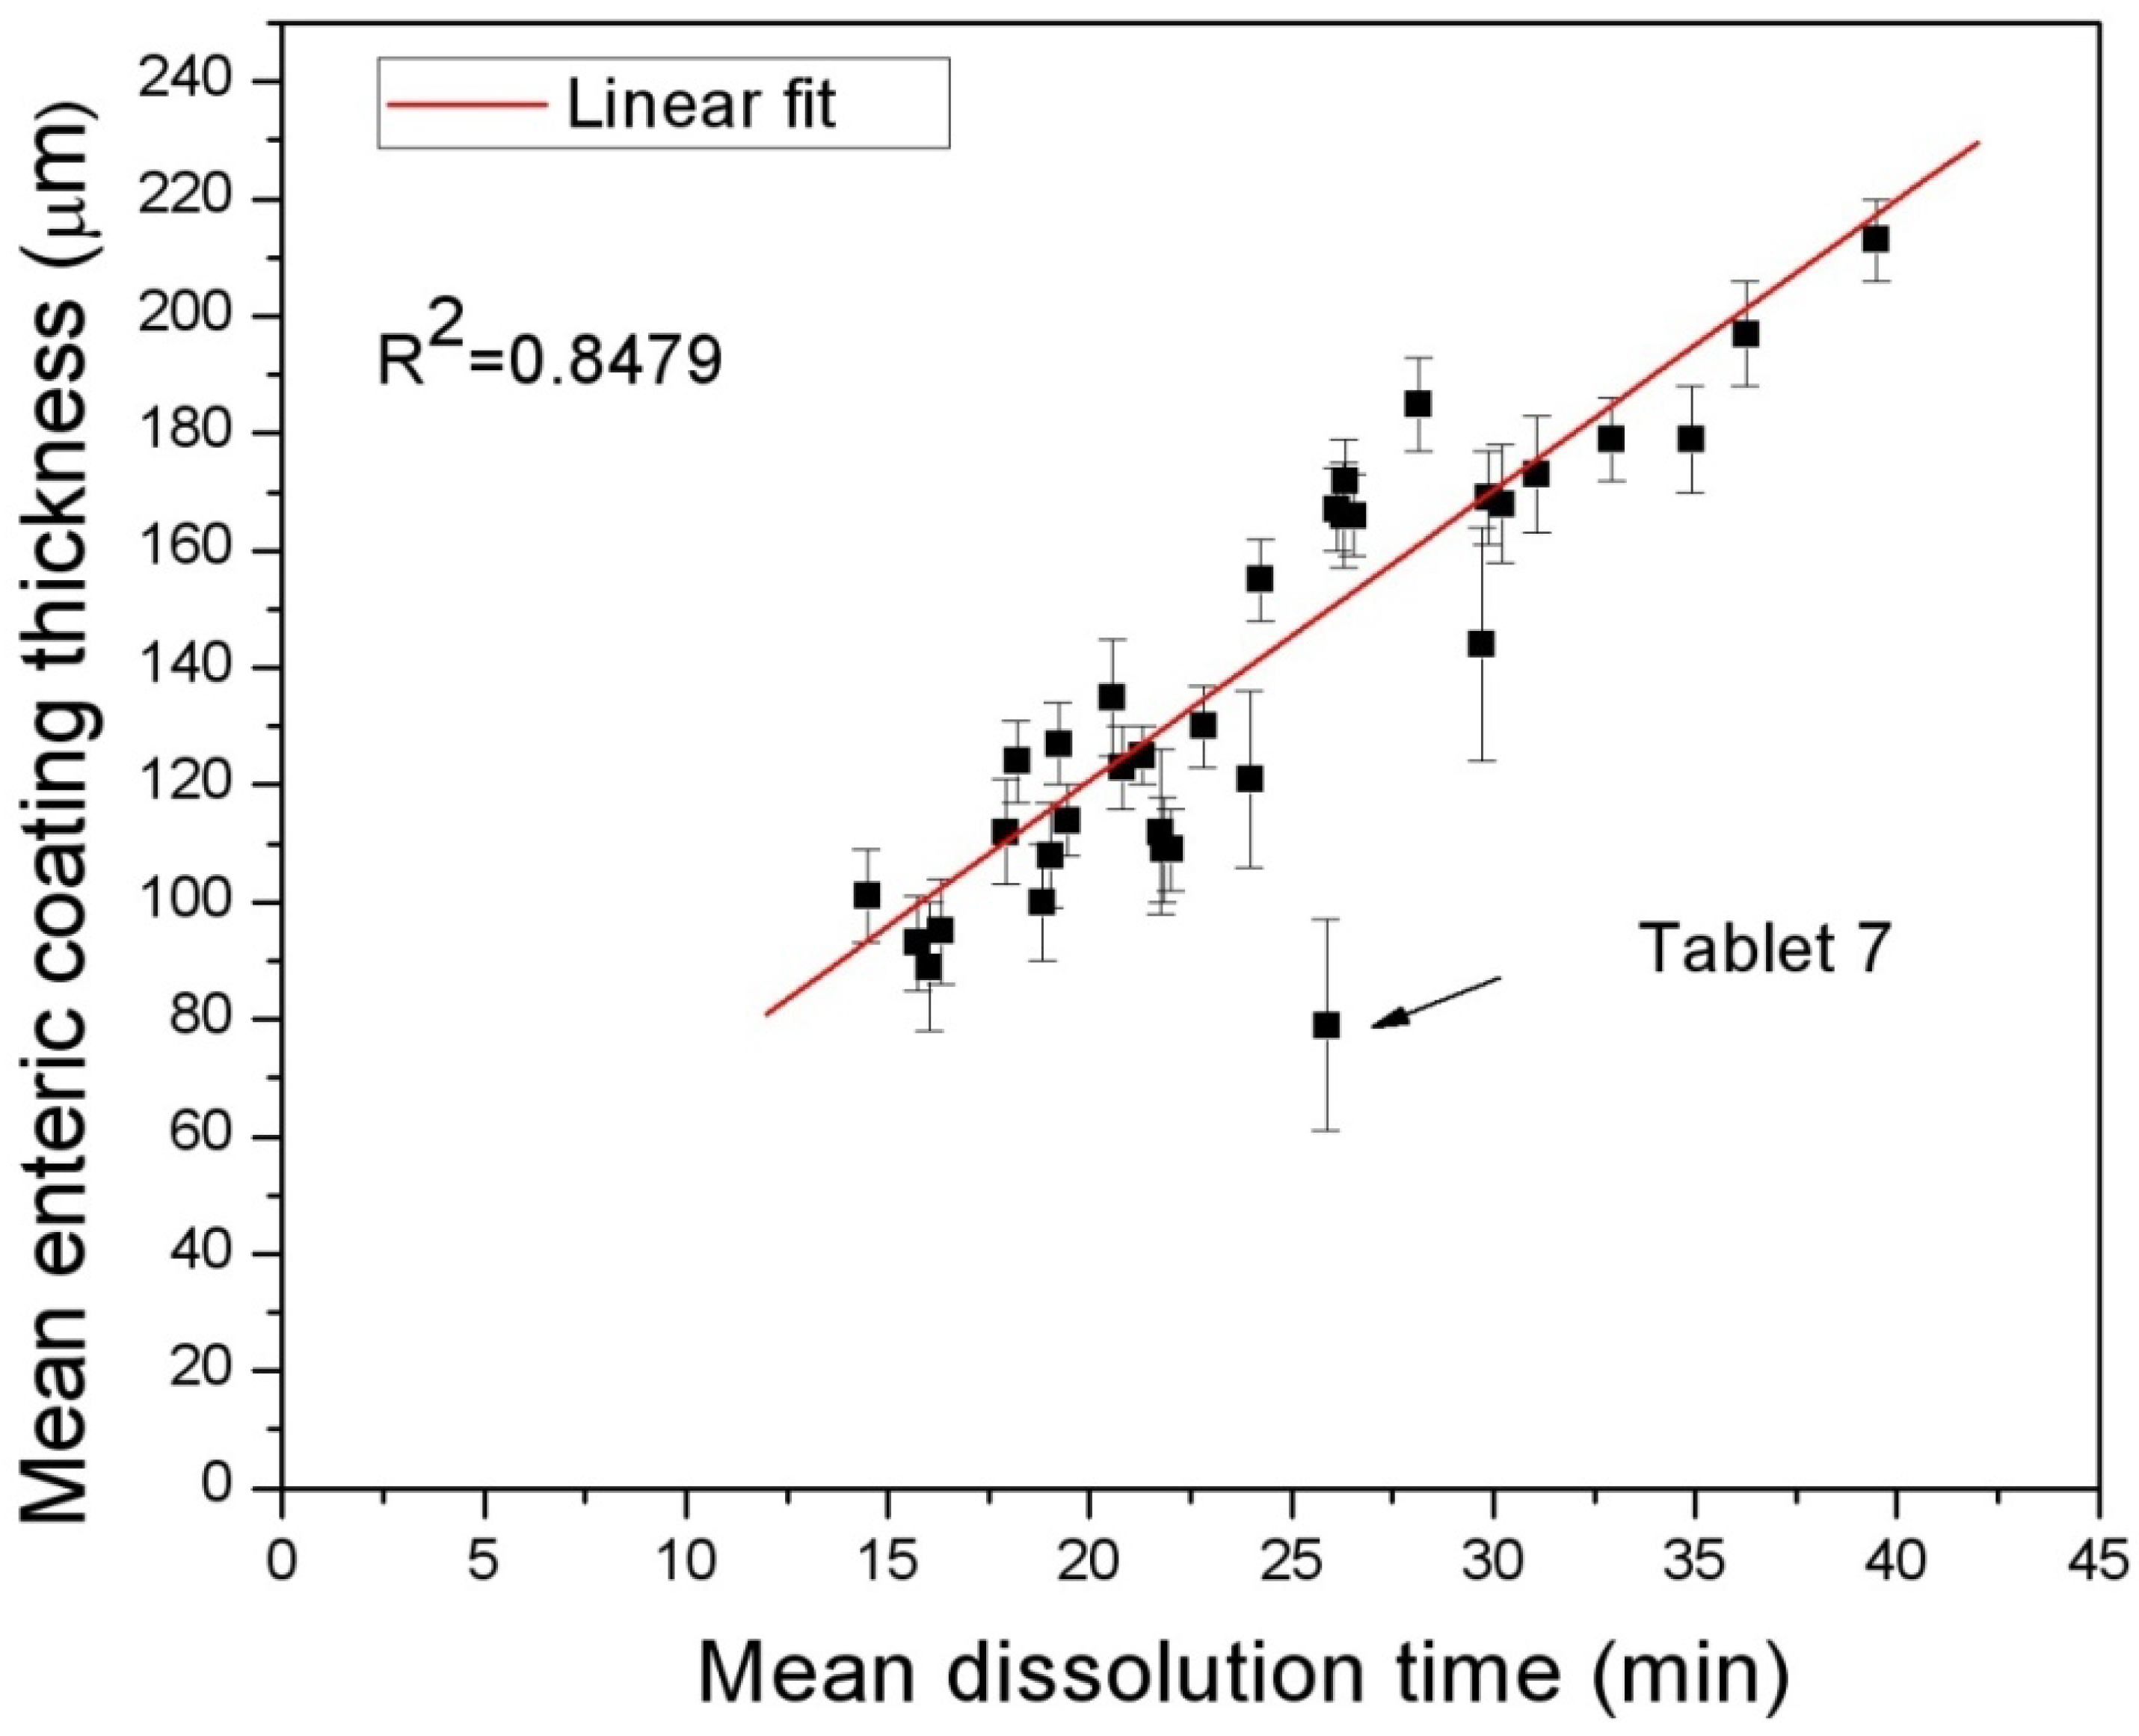
4. Terahertz Imaging in a Pharmaceutical Context

As most dielectric materials are semi-transparent in the terahertz region of the spectrum, it was soon realized that the terahertz pulses could be used in the analysis of the coating thickness on solid dosage forms [71,72]. Unlike traditional microscopy measurements, the terahertz method provides the advantage of the non-destructive assessment of coating thickness and other properties, preserving the tablet for subsequent dissolution testing. The first study was undertaken by the FDA (Spencer et al. [73]), who measured the coating thickness on mesalamine tablets using terahertz pulsed imaging (TPI), and was then able to correlate this to tablet dissolution. Lo et al. [74,75,76] showed in a series of papers that it was possible to correlate not only the coating thickness but also the density of the coating. In later work, Lo et al. also used the raw terahertz pulse and chemometrics to predict the dissolution of sustained release pharmaceutical product [77]. An example of correlation between the thickness on an enteric coated tablet and the dissolution is shown.
Tablet 7 is an outlier of the data set in Figure 3. The error bars shown in Figure 3 are the variation in the coating thickness across the whole tablet. The technique measures in the region of 2000 data points and the thickness can be derived at each point. The outlier, labelled tablet 7, from the straight line is due to imperfections in the tablet coating.
In a recent paper by May et al. [78], the authors showed a good correlation between the refractive index measured by terahertz pulsed imaging and the crushing force measured in compression tests. The crushing force was found using a set of tablets that were compacted at various compression forces and this was found to be related to tablet hardness. The same group used a terahertz sensor inside a coating pan to follow the build-up of a pharmaceutical coating on a tablet [79,80].
The terahertz refractive index of the solid dosage form is not only dependent on the chemistry of the material but also on its porosity. In measuring the refractive index of a tablet, the porosity contributes to the effective index of the material; for example, the greater the porosity of the sample, the lower the effective refractive index of the material. Therefore, by measuring the effective refractive index of the material, an indication of the porosity is obtained [81,82]. In the past, this was achieved by using high pressure mercury. Recent publications have demonstrated this technique, and the resultant development of high throughput instrumentation to be used within the pharmaceutical environment [83,84,85] is shown in Figure 4.

5. Terahertz Imaging and Spectroscopy in Cultural Heritage

An area for the fruitful application of terahertz technology is the scientific study of cultural heritage. Here, the unique properties of terahertz radiation provide both three-dimensional imaging and the materials’ identification, which have had considerable impact. In particular, the non-invasive nature of the technology allows for the investigation of object d’art that is not provided by other technologies. Infra-red, Raman and X-ray fluorescence have been used, but each have their limitations. For example, the non-invasive nature of terahertz does not affect thermoluminescence dating, and the penetration is greater than infra-red, which is scattered.

5.1. Terahertz Imaging

The two principal methods of imaging using coherent terahertz radiation are CW and pulsed, and both have been considered in art restoration and other studies. The advantages of CW are lower costs and simplicity, due to the absence of the femtosecond pulsed laser; however, the image obtained is two-dimensional (2D). Frequency dependent generation is typically obtained via beating two infrared laser diodes mixed in a semiconductor emitter. By scanning the output frequency of one of the laser diodes, the frequency of the CW terahertz can be altered up to about 3 THz. Imaging at a fixed frequency with higher power can also be obtained by terahertz quantum cascade lasers, resonant tunnelling diodes or cascaded Gunn devices. However, the image obtained is 2D, whereas the pulsed technique enables a 3D image to be obtained in which the time dependence of reflection is converted to a 3D spatial dependence of features. Although the depth resolution can be of the order of microns for larger objects, the use of CW tomographic techniques, such as imaging at a range of incident angles, can yield meaningful data. Recur, Younis and colleagues [86] found that image reconstruction methods produced CW images of nested Russian dolls, (Matryoshkas). Three-dimensional reconstruction has also been based on Gunn oscillators as CW sources and projection techniques were utilised, in which a lens focuses the terahertz beam at a fixed point that varies in depth as the sample is rotated [87]. However, the resolution of distance is just below a millimetre, as compared to microns for a pulsed technique. Frequency modulated continuous wave, FMCW, has also been used with similar poor resolution. As discussed below, experimental work has shown that inks vary in their reflective (refractive index) properties and when reflections are weak, 3D imaging is very difficult [88] and requires high sensitivity that is not present in most CW systems to date. It may be possible to use a high intensity CW source, such as a quantum cascade laser or Gunn diode, tuned to the resonant absorption of the ink for imaging, but this is yet to be demonstrated in art restoration applications.
In addition to depth information, surface topological features can also be investigated, which are very relevant to the cleaning and restoration of art. In recent times, authenticity, determined by 3D imaging, has grown in importance with the increase in fraud and the need to identify stolen art. Such features include cracks that can be visually observed, but whose depth can be ascertained with terahertz pulses. Uneven surfaces have also been found in an investigation of Neolithic wall paintings [89].
A demonstration of the importance of terahertz imaging was provided by an investigation of a painting of renowned artistic beauty “Sacrifice to Vesta” painted by the Spanish artist Goya in 1771. The investigators established a deterioration in the canvas that was not visibly apparent, and also found the artist’s signature, which could not be observed visually or with X-rays. It was thought that originally, the painting was covered with a protective layer of varnish that had darkened with time, and thus rendering the signature unobservable, but the signature was clear with terahertz [90]. In general, terahertz imaging can reveal drawings under the painting or earlier versions, which were then hidden during repainting.
Early work that showed that writing on folded paper could be observed through an envelope stimulated imaging studies of documents [91]. Bardon et al. [92] produced a table showing that the reflectivity and refractive indices of various inks can vary considerably. When the refractive indices of the ink and paper/parchment are similar, imaging is of poor or negligible quality. Sepia ink gives poor quality, whereas lamp black, carbon black and graphite give good contrast. Reflection studies would be appropriate for the latter inks, whereas with sepia transmission would be most appropriate. Because of the delicate nature of the object, the number of layers and format of archival documents is not often known, thereby complicating analysis.

5.2. Terahertz Spectroscopy

In a similar manner to other spectroscopic studies, such as pharmaceutical products, by investigating inter-molecular forces, terahertz offers additional, and often simpler to interpret, results compared with the intra-molecular determinations of infra-red. This can render spectral identification less ambiguous, particularly in reflection mode. Two main areas of research are studies of paints/inks and parchments, including canvas and skins. These can be complicated by the failure of some inks to produce a terahertz signature, such as Prussian blue and sepia compared to carbon black and graphite, which do have a signature. Many pigments are based on powders and granulated materials where the granular size is comparable to terahertz wavelengths, causing the radiation to scatter. Both Mie and Rayleigh scattering mechanisms are active and interfere strongly, obscuring the actual spectra. As has been shown, the summation of frequency dependent absorption, or reflection, plots taken across a sample area, which are of order of a wavelength apart, results in the integrated random structure becoming insignificant, allowing the spectra to be observed clearly [93]. By utilising the dependence of scattering on particle size [94], studies of Japanese paintings have exploited the change in brightness by the variation in the particle size of the pigments. Many of the pigments found in heritage studies have polymorphs, and so overlaps of spectroscopic structures can impede identification, although the spectral distribution of the structure remains more favourable than that found with infra-red. Pigments in general have much narrower absorption lines than dyes and binders, which allows considerable data to be assembled. For example, it has been shown that cobalt based pigments have two principal components, cobalt blue and cobalt yellow, (aureolin), as obtained from the sharp resonant absorption lines. Similarly, different forms of calcium carbonate have multiple uses and the different polymorphs can be distinguished from their spectra. Thickness variations present a problem in extracting spectroscopic data and are particularly prevalent in the examination of paintings with the different manner of the brush strokes.
Far-infrared (THz) Fourier transform systems have been useful in the study of semiconductors and associated phonon spectra, as well as studies of pigment and binder components of inks. Although subject to the disadvantage of using incoherent radiation, these systems can be used for higher frequencies than the coherent time domain spectroscopy, which is best below 5 THz. However, the bulk of spectral features are found below this frequency. There are exceptions, for example lead white, which shows structures up to 7.5 THz. The identification of binders helps determine age, and many pigments have been identified in works of art, such as cinnabar, (HgS) and orpiment (As2S3). Some do not have a characteristic signature but rather a broad absorption, which renders identification difficult. Pigments, such as sinopia, have no terahertz structure and a more difficult analysis based on chemometric techniques and principal component analysis has to be employed [95]. Often, these are based on the differential of the broadband absorption as a function of frequency, particularly applicable to those binders and organic dyes that lack absorption features.
Much sampling is performed in reflection when samples are too thick for transmission to occur. Murals have been investigated with terahertz imaging and the strength of reflection from the paint surfaces has been found to differ between different pigments. This allows for spectroscopic identification to occur even if different pigments appear to be the same colour to our eyes in the visible spectrum [96].
The inks that were used for documents prior to the invention of the fountain pen make use of iron gall, which contains iron sulfate and is well-known for its possible corrosive action on documents. Studies of the hydration state have shown that there are many interchangeable hydration states of FeSO4, two of which involve either four or seven molecules of water with terahertz spectra, which differ only by one absorption peak. Oxidation of these hydrates can occur, and the result is an even more highly corrosive compound. Consequently, detection is important to ensure document preservation [97,98]. This type of ink produces a strong reflection in the terahertz region, whereas other types of ink, such as sepia ink, do not produce a significant reflection. Herewith inks such as sepia, transmission studies would be most appropriate if the sample permits it, although 3D imaging will be more problematic in transmission than in reflection. Terahertz spectra are still being accumulated from materials relevant to art restoration and studies, and given the relatively short time of the applications of the technology, knowledge lags behind infra-red. However, a terahertz data base has been assembled by NICT and RIKEN and is found at http://www.thzdb.org (20 February 2022).

6. Application of Terahertz Pulses to Automotive Paints

One of the areas receiving considerable interest in the application terahertz pulses is the monitoring of car paint. There is the opportunity of placing a terahertz sensor on the end of a robot arm in order to measure the thickness of multi-layer paint coatings, both near and on the production line. The competing technologies eddy current gauges and ultrasonics transducers prove challenging in this environment as they are both contact techniques. Ultrasonic gauges require the addition of coupling liquid, which can leave marks on the finished products. Both suffer from accuracy issues, with eddy current gauges only capable of measuring total layer thickness, and are not able to measure individual layers in multi-layer stacks. Terahertz sensors are non-contact and can be used on both plastic and metallic substrate. The paints on cars are complex structures of different layers comprising of the electrocoat, primer, basecoat, and clearcoat. The thickness of these coatings can vary across the vehicle as they are functional; for example, a clear coat may be thicker near the wheel arches to protect the underlying paint layer. Other issues lie in the fact that manufacturing plants are subject to dust, humidity and temperature changes, as well as vibrations. In unpublished work, TeraView explored multilayer paints working with Ford Motors in 2005/2006 on flat panels in proof-of-concept measurements. Yassui et al. reported results on car paint in 2005 [99]. They investigated some relatively thick paint layers over 100 μm with their large table top system. In 2007, Yasuda et al. [100] used multiple-regression techniques on the time-domain pulses to reduce the resolution down to 20 μm; however, this was on single layers. The first multiple layer paint structure was reported by Kawase et al. [101] in 2010, who showed that terahertz pulses could resolve the differing layers in a paint sample. The first real attempts to understand this application were reported by Su, Shen and Zeitler [102,103,104] in Cambridge working with TeraView and compared the results obtained from terahertz pulses with mechanical stylus profilometry, and X-ray microcomputed tomography. The paper not only reported on single layer samples but also multi-layered samples and compared the results from the different techniques and validating that terahertz pulses could achieve accurate results. Su, Shen and Zeitler’s work was still based on the fitting the terahertz time-domain waveforms. A model-based system was first reported by van Mechelen, Kuzmenko, and Merbold [105], which in this paper was based on the quality control of coated paper but was extended to car paints by Krimi et al. [106].
The area has rapidly progressed, with a number of major car manufacturers now adopting terahertz sensor as their technique to valid the thickness of paint on their products. In 2022, TeraView reported with Ford the development [107] of a terahertz sensor that can be mounted on the end of an automotive grade robot, as shown in Figure 5. The terahertz sensor was optimised at each sample position by an angular adjustment of the head. The results of this study again validated the results against ultrasound, and optical microscopy. The terahertz measurements results provided greater accuracy than the ultrasound measurements, with the added advantage that the terahertz sensor is a non-contact technique. TeraView equipment has developed anti-vibration techniques within the software and the control electronics and laser is contained within its own air-conditioned cabinet.

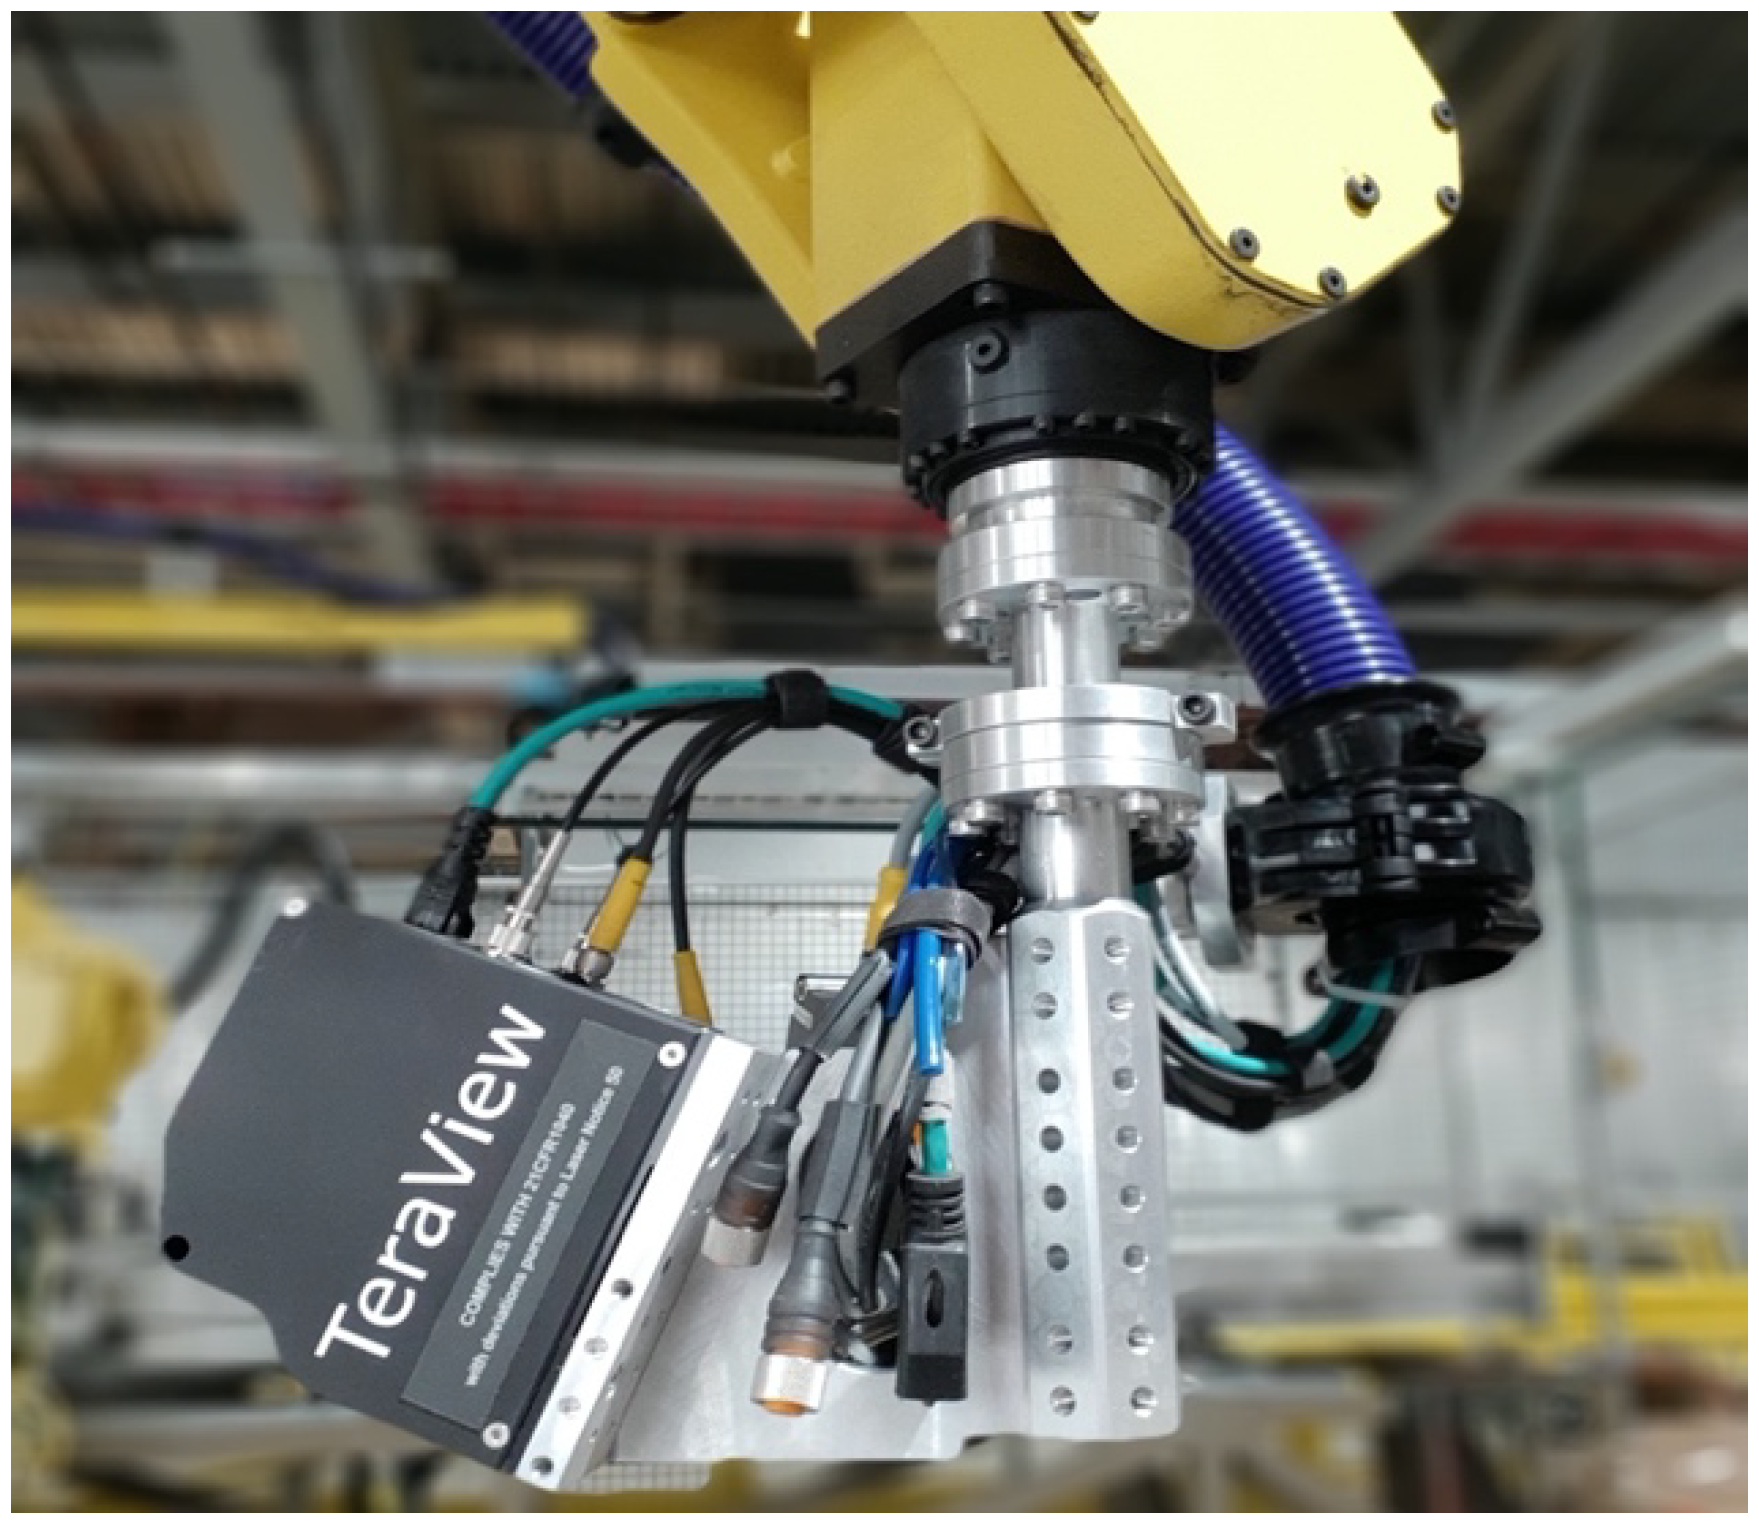
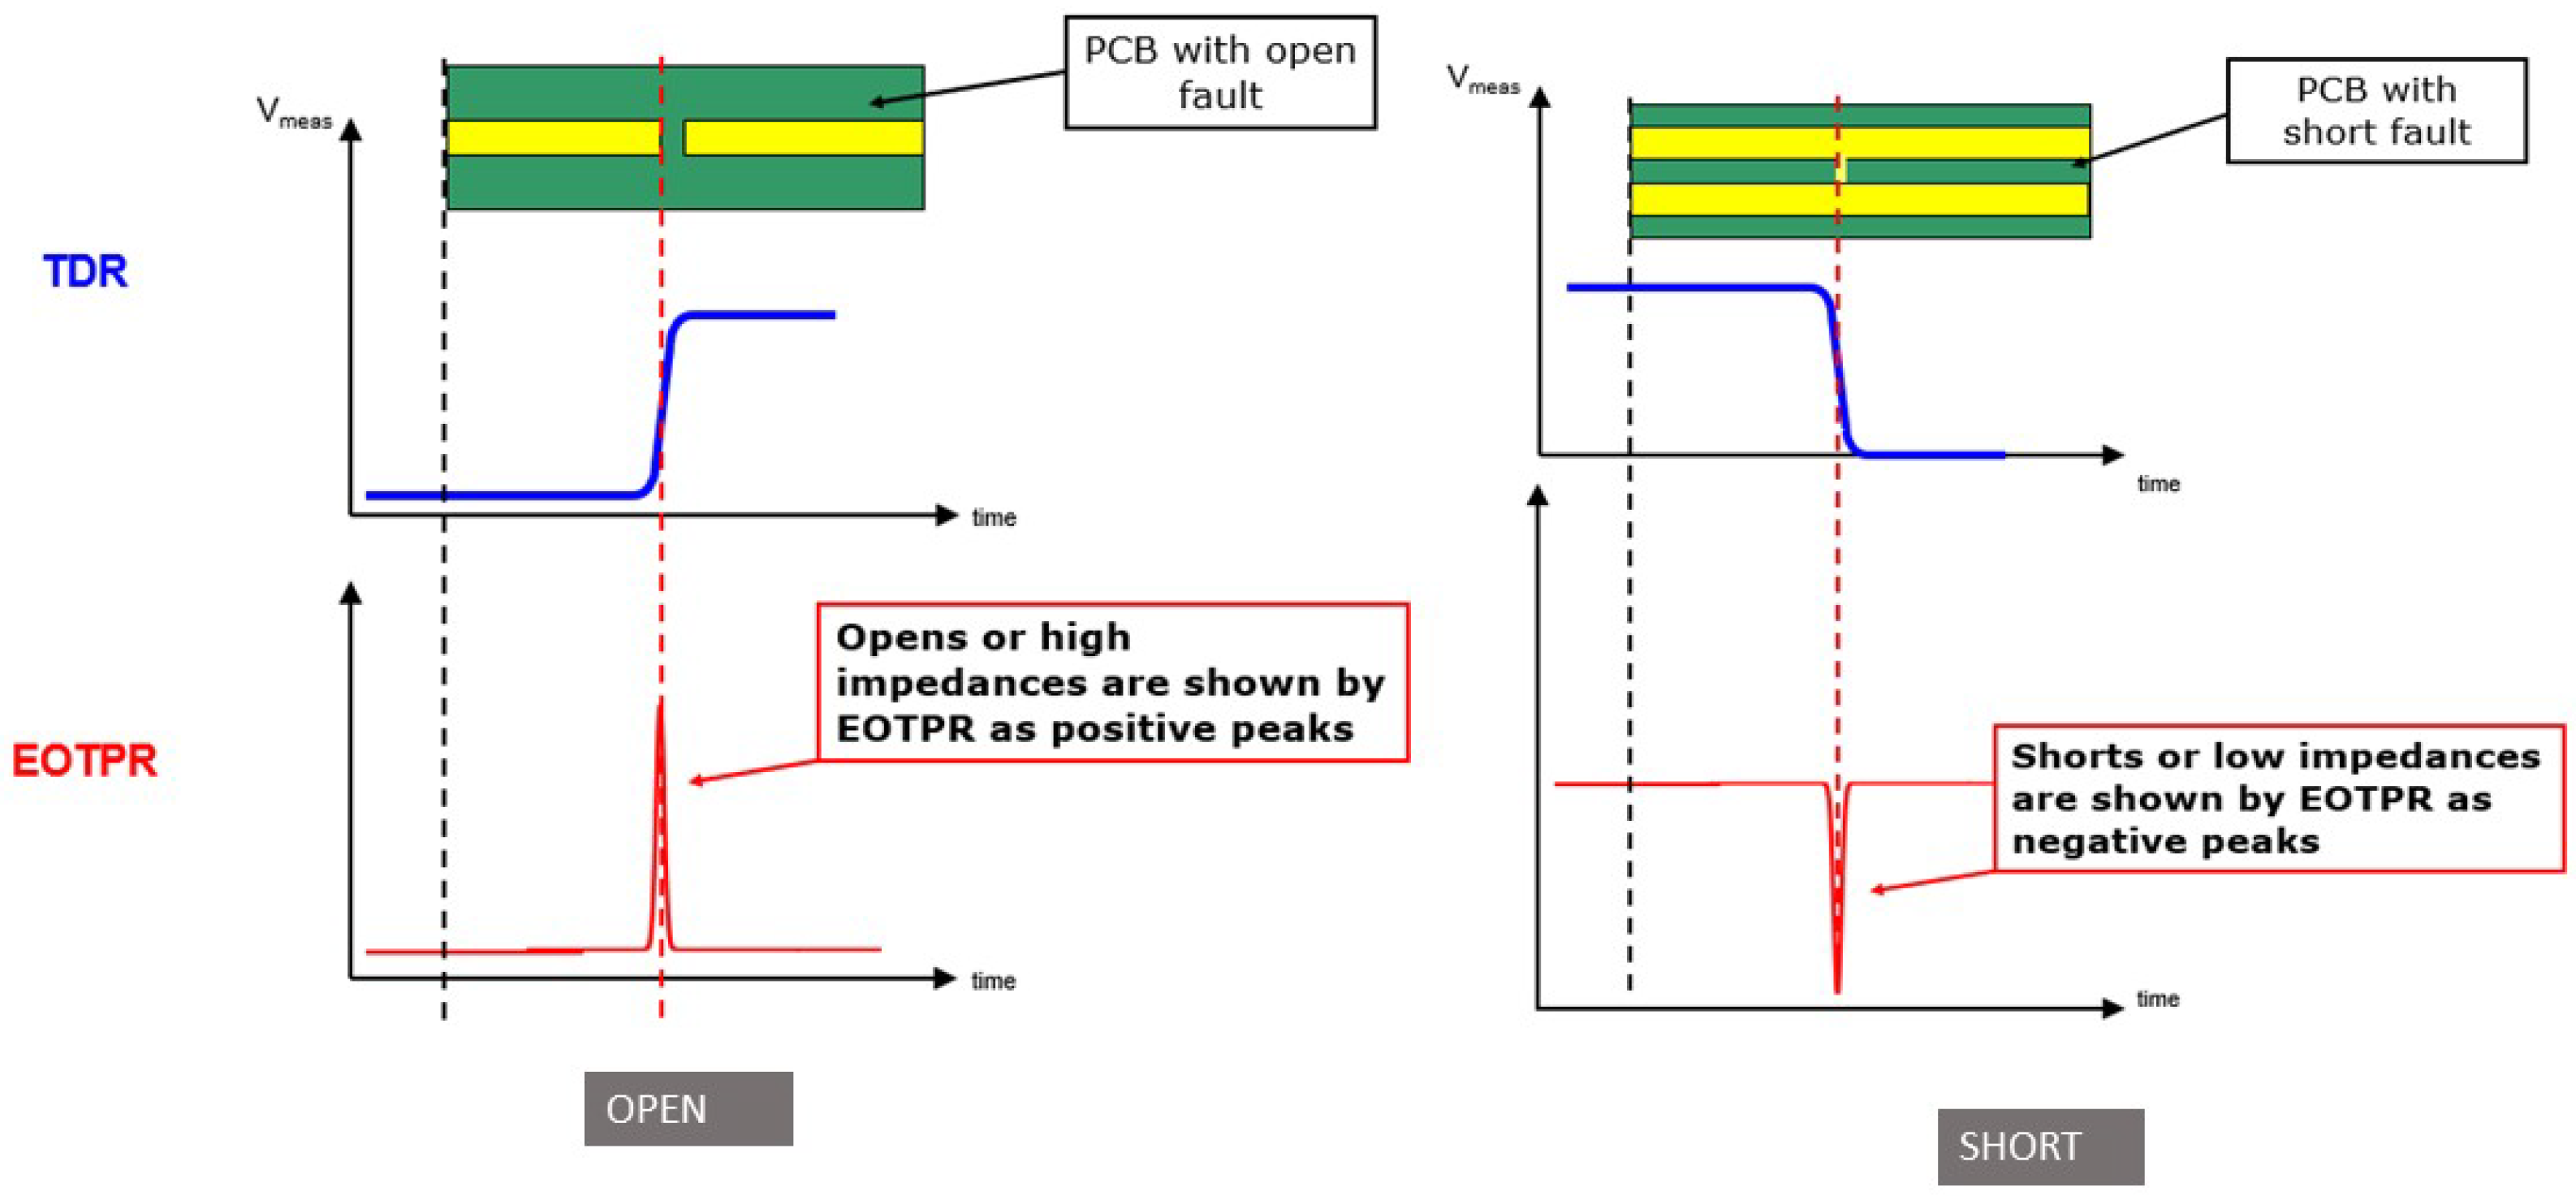
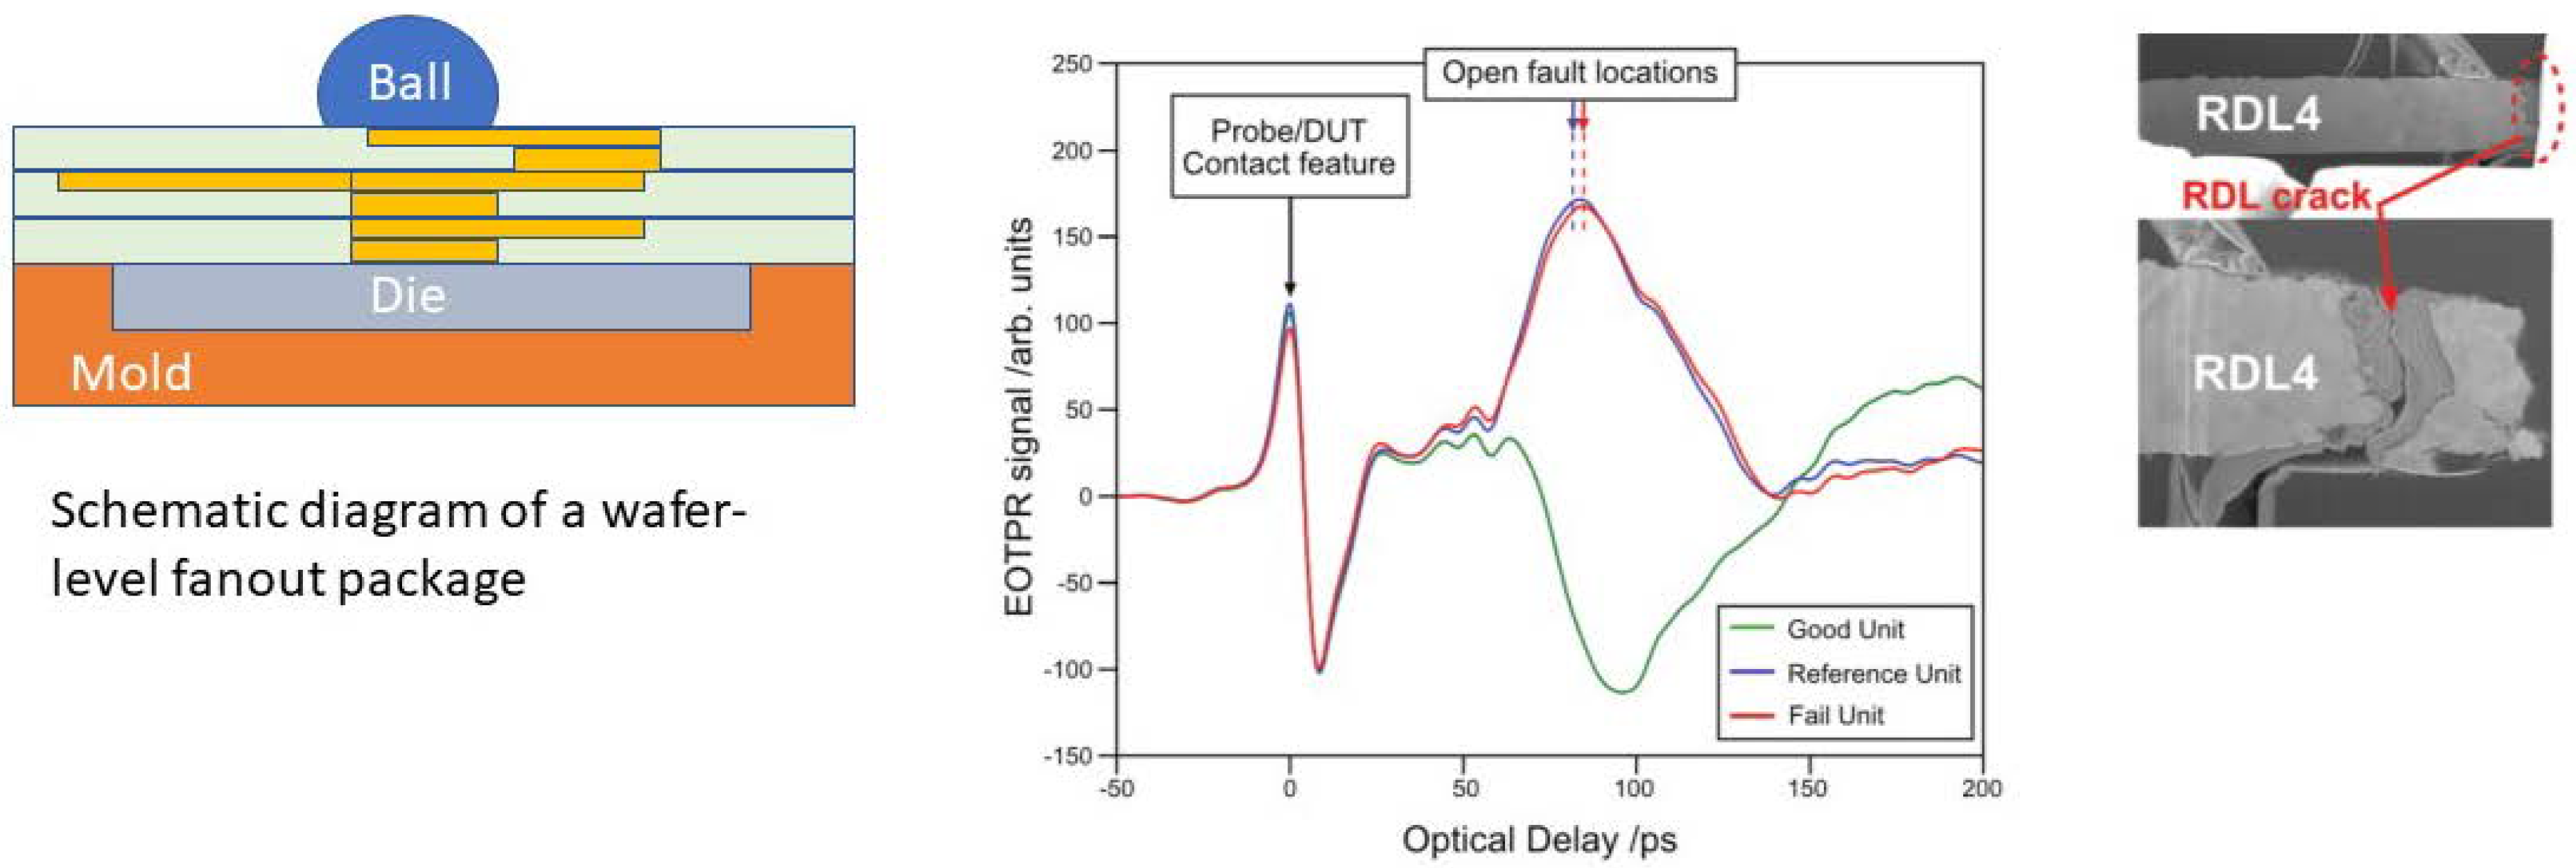
7. Applications of Terahertz Pulses to Failure Analysis within the Semiconductor Packaging Sector

One of the first successful industrial markets for terahertz technology has been the area of failure analysis (FA) and fault isolation for advanced integrated circuits in the semiconductor industry. This success is largely due to drivers from the semiconductor industry itself to develop terahertz pulses as a FA tool. Over the past two decades, semiconductor packaging technologies have increased their complexity and importance [108]. When combined with advances in lithography applied to silicon, this has resulted in complex devices, with an ever-growing need for more rapid and accurate FA capabilities. To fulfil these requirements and to enable 2.5-D and 3-D product solutions in which traditional processor and memory devices are combined, chip-scale packages (CSP) and similar structures are increasingly being used. More complex packaging architectures, such as through-silicon vias (TSVs), micropillars, and stacked-dice devices, are becoming standard, leading to a more compact design and higher functionality density. An example of some of the structures encountered in advanced packaging that require new FA techniques include solder ball cracking and partial delamination, cracking in redistribution layers in doped regions of semiconductors, and defects in through-silicon-vias, which are increasingly used to interconnect devices.
The traditional approach to FA workflow involves a variety of techniques. DC electrical testers, combined with X-ray or in some cases acoustic imaging, are one approach. However, all have sensitivity limitations in some applications, and it can be difficult to rapidly isolate the position of a fault. Physical failure analysis is frequently used to underpin these techniques but is destructive in that it involves cutting and exposing faults inside a chip and identifying these faults with microscopy. Until around 2010, the main alternative was microwave TDR (time domain reflectometry), which uses microwave wavelengths (e.g., circa 20–70 GHz) in the form of a step function voltage injected into the bond pads on integrated circuits via high frequency probes. Measuring the time gated response (reflection) arising at changes in impedance in the circuit (such as those arising in the presence of an open or short circuit) allowed the position of a fault in the integrated circuit to be identified from the time-of-flight data, as shown in Figure 6. However, because of the long wavelengths used in microwave TDR as well as the step nature of the voltage, the accuracy is limited to 100–500 μm, depending upon the system used and the device under test.
Electro optical terahertz pulse reflectometry (EOTPR) was developed by TeraView to address the limitations cited above. EOTPR is now a well-established, non-destructive fault isolation tool for advanced integrated circuit devices [108]. As can be observed in Figure 7, EOTPR is an implementation of the TDR technique at terahertz frequencies, proven to enhance fault isolation accuracy to better than 10 μm [109]. The fault detection accuracy of EOTPR is a function of the rise time of the incident pulse, the wavelengths of radiation used, the time-based jitter, and signal-to-noise ratio (SNR). The EOTPR instrument generates a terahertz pulse using an ultrafast laser and a pair of photoconductive switches for signal generation and detection, resulting in a system with (i) high measurement bandwidth, (ii) low time-base jitter, and (iii) a high time-base resolution [108]. Compared to conventional TDR, EOTPR generates signals with faster rise time, has greater SNR, and much-reduced time base jitter-system properties that offer the potential for significantly increased distance-to-defect accuracy.
An example is given in Figure 7, where EOTPR has been used to detect the position of faults in a device under test and where microwave TDR proved to be less accurate.
EOTPR is currently being used by all of the major semiconductor manufacturers, as well as their suppliers.

8. Conclusions

It is now clear that terahertz technology offers a unique method of investigating different aspects of industrial process control, such as paint layers on cars, connecting silicon chips on single devices as part of chip scale packaging and internal interfaces and porosity in controlled release pharmaceutical tablets. Although the adoption of the technology requires a lengthy assessment period, it has, nevertheless, occurred and is becoming an integral part of manufacturing processes. The impact in biology and medicine is slower and there are other technologies that, whilst not directly competing with terahertz, offer some additional features. It is entirely possible that a multimode approach in which terahertz is combined with another modality may find a use in clinical practice. In summary, there is no doubt that terahertz has emerged from the laboratory and is becoming an accepted part of different industries. New applications will continue to emerge, as confidence in the technology in current applications continues to grow, and as advances in core technology progress. Of course, there are challenges to be faced. There is still a long adoption time for the technology. There needs to be more training of terahertz engineers in the application of terahertz pulses so that companies can rapidly adopt new methods. There is progress in the establishment of an international measurement standard, which will give confidence to our industrial customers that the use of terahertz pulses is evolving.

Funding

This research received no external funding.

Institutional Review Board Statement

The local research ethics committee approved the study; appropriate informed consent was obtained from all patients, and all material was anonymized.

Informed Consent Statement

Informed consent was obtained from all subjects involved in the study.

Conflicts of Interest

The authors declare no conflict of interest.

References

  1. Woodward, R.M.; Cole, B.; Wallace, V.P.; Arnone, D.D.; Pye, R.; Linfield, E.H.; Pepper, M.; Davies, A.G. Terahertz pulse imaging of in vitro basal cell carcinoma samples. In Proceedings of the Conference on Lasers and Electro-Optics TOPS 56, Baltimore, MD, USA, 11 May 2001; pp. 329–330. [Google Scholar]
  2. Woodward, R.M.; Cole, B.E.; Wallace, V.P.; Pye, R.J.; Arnone, D.D.; Linfield, E.H.; Pepper, M. Terahertz pulse imaging in reflection geometry of human skin cancer and skin tissue. Phys. Med. Biol. 2002, 47, 3853–3863. [Google Scholar] [CrossRef]
  3. Woodward, R.M.; Wallace, V.P.; Cole, B.E.; Pye, R.J.; Arnone, D.D.; Linfield, E.H.; Pepper, M. Terahertz pulse imaging in reflection geometry of skin tissue using time domain analysis techniques. Proc. SPIE 2002, 4625, 160–169. [Google Scholar]
  4. Wallace, V.P.; Fitzgerald, A.J.; Pickwell, E.; Pye, R.J.; Taday, P.F.; Flanagan, N.; Ha, T. Terahertz Pulsed Spectroscopy of Human Basal Cell Carcinoma. Appl. Spectrosc. 2006, 60, 1127. [Google Scholar] [CrossRef]
  5. Fitzgerald, A.J.; Wallace, V.P.; Jimenez-Linan, M.; Bobrow, L.; Pye, R.J.; Purushotham, A.D.; Arnone, D.D. Terahertz pulsed imaging of human breast tumors. Radiology 2006, 239, 533–540. [Google Scholar] [CrossRef]
  6. Pickwell, E.; Wallace, V.P. Biomedical applications of Terahertz technology. J. Phys. D Appl. Phys. 2006, 39, R301–R310. [Google Scholar] [CrossRef]
  7. Pickwell, E.; Cole, B.E.; Fitzgerald, A.J.; Wallace, V.P.; Pepper, M. Simulation of Terahertz pulse propagation in biological systems. Appl. Phys. Lett. 2004, 84, 2190. [Google Scholar] [CrossRef]
  8. Pickwell, E.; Cole, B.E.; Fitzgerald, A.J.; Pepper, M.; Wallace, V.P. In vivo study of human skin using pulsed Terahertz radiation. Phys. Med. Biol. 2004, 49, 1595–1607. [Google Scholar] [CrossRef]
  9. Reid, C.B.; Fitzgerald, A.; Reese, G.; Goldin, R.; Tekkis, P.; O’Kelly, P.S.; Pickwell-MacPherson, E.; Gibson, A.P.; Wallace, V.P. Terahertz pulsed imaging of freshly excised human colonic tissues. Phys. Med. Biol. 2011, 56, 4333–4353. [Google Scholar] [CrossRef] [Green Version]
  10. Ashworth, P.C.; Pickwell-MacPherson, E.; Provenzano, E.; Pinder, S.E.; Purushotham, A.D.; Pepper, M.; Wallace, V.P. Terahertz pulsed spectroscopy of freshly excised human breast cancer. Opt. Express 2009, 17, 12444. [Google Scholar] [CrossRef]
  11. Fan, S.; He, Y.; Ung, B.S.; Pickwell-MacPherson, E. The growth of biomedical Terahertz research. J. Phys. D Appl. Phys. 2014, 47, 374009. [Google Scholar] [CrossRef]
  12. Pickwell, E.; Fitzgerald, A.J.; Cole, B.E.; Taday, P.F.; Pye, R.J.; Ha, T.; Pepper, M. Simulating the response of Terahertz radiation to basal cell carcinoma using ex vivo spectroscopy measurements. J. Biomed. Opt. 2005, 10, 064021. [Google Scholar] [CrossRef] [PubMed]
  13. Fitzgerald, A.J.; Pickwell-MacPherson, E.; Wallace, V.P. Use of finite difference time domain simulations and Debye theory for modelling the Terahertz rellection response of normal and tumour breast tissue. PLoS ONE 2014, 9, 99291. [Google Scholar] [CrossRef] [PubMed]
  14. Yang, X.; Zhao, X.; Yang, K.; Liu, Y.; Liu, Y.; Fu, W.; Luo, Y. Biomedical Applications of Terahertz Spectroscopy and Imaging. Trends Biotechnol. 2016, 34, 810–824. [Google Scholar] [CrossRef]
  15. Yu, C.; Fan, S.; Sun, Y.; Pickwell-MacPherson, E. The potential of Terahertz imaging for cancer diagnosis: A review of investigations to date. Quant. Imaging Med. Surg. 2012, 2, 33–45. [Google Scholar]
  16. Pickwell, E.; Wallace, V.P.; Cole, B.E.; Ali, S.; Longbottom, C.; Lynch, R.J.; Pepper, M. A comparison of terahertz pulsed imaging with transmission microradiography for depth measurement of enamel demineralisation in vitro. Caries Res. 2007, 41, 49–55. [Google Scholar] [CrossRef]
  17. Churchley, D.; Lippert, F.; Lynch, R.; Alton, J.; Gonzalez-Cabezas, C.; Eder, J. A comparison of terahertz-pulsed imaging with transverse microradiography and microhardness to measure mineral changes in enamel after treatment with fluoride dentifrices. In Proceedings of the Lasers in Dentistry XV, SPIE BIOS, San Jose, CA, USA, 24–29 January 2009; Volume 7162, pp. 9–17. [Google Scholar]
  18. Churchley, D.R.; Lynch, R.J.; Lippert, F.; Eder, J.S.B.; Alton, J.; Gonzalez-Cabezas, C. Terahertz pulsed imaging study to assess remineralization of artificial caries lesions. J. Biomed. Opt. 2011, 16, 026001. [Google Scholar] [CrossRef]
  19. Xie, L.; Yao, Y.; Ying, Y. The Application of Terahertz Spectroscopy to Protein Detection: A Review. Appl. Spectrosc. Rev. 2014, 49, 448. [Google Scholar] [CrossRef]
  20. Markelz, A.G.; Roitberg, A.E.; Heilweil, E.J. Pulsed terahertz spectroscopy of DNA, bovine serum albumin and collagen between 0.1 and 2.0 THz. Chem. Phys. Lett. 2000, 320, 42–48. [Google Scholar] [CrossRef]
  21. Havenith, M. Watching the dance of water in the hydration shell of ions and biomolecules in the THz frequency range. In Proceedings of the Keynote Lecture, 86th American Chemical Society’s Colloid & Surface Science Symposium, Johns-Hopkins University, Baltimore, MD, USA, 10–13 June 2012; Volume 11. [Google Scholar]
  22. Born, B.; Havenith, M. Terahertz dance of proteins and sugars with water. J. Infrared Millim. Terahertz Waves 2009, 30, 1245–1254. [Google Scholar] [CrossRef]
  23. Bye, J.W.; Meliga, S.; Ferachou, D.; Cinque, G.; Zeitler, J.A.; Falconer, R.J. Analysis of the hydration water around bovine serum albumin using terahertz coherent synchrotron radiation. J. Phys. Chem. A 2014, 118, 83–88. [Google Scholar] [CrossRef] [Green Version]
  24. Cheon, H.; Yang, H.J.; Lee, S.H.; Kim, Y.A.; Son, J.H. Terahertz molecular resonance of cancer DNA. Sci. Rep. 2016, 6, 37103. [Google Scholar] [CrossRef] [PubMed] [Green Version]
  25. Cheon, H.; Yang, H.J.; Choi, M.; Son, J.H. Effective demethylation of melanoma cells using terahertz radiation. Biomed. Opt. Express 2019, 10, 4931–4941. [Google Scholar] [CrossRef] [PubMed]
  26. Tao, Y.H.; Hodgetts, S.I.; Harvey, A.R.; Wallace, V.P. Reproducibility of terahertz peaks in a frozen aqueous solution of 5-methylcytidine. J. Infrared Millim. Terahertz Waves 2021, 42, 588–606. [Google Scholar] [CrossRef]
  27. Oh, S.J.; Kang, J.; Maeng, I.; Suh, J.S.; Huh, Y.M.; Haam, S.; Son, J.H. Nanoparticle-enabled terahertz imaging for cancer diagnosis. Opt. Express 2009, 17, 3469–3475. [Google Scholar] [CrossRef] [PubMed]
  28. Oh, S.J.; Huh, Y.M.; Suh, J.S.; Choi, J.; Haam, S.; Son, J.H. Cancer diagnosis by terahertz molecular imaging technique. J. Infrared Millim. Terahertz Waves 2012, 33, 74–81. [Google Scholar] [CrossRef]
  29. Doradla, P.; Alavi, K.; Joseph, C.S.; Giles, R.H. Single-Channel prototype Terahertz endoscopic system. J. Biomed. Opt. 2014, 19, 080501. [Google Scholar] [CrossRef] [Green Version]
  30. Ji, Y.B.; Moon, I.S.; Bark, H.S.; Kim, S.H.; Park, D.W.; Noh, S.K.; Huh, Y.-M.; Suh, J.-S.; Oh, S.J.; Jeon, T.-I. Terahertz otoscope and potential for diagnosing otitis media. Biomed. Opt. Express 2016, 7, 1201–1209. [Google Scholar] [CrossRef] [Green Version]
  31. Wallace, V.P.; Fitzgerald, A.J.; Shankar, S.; Flanagan, N.; Pye, R.; Cluff, J.; Arnone, D.D. Terahertz pulsed imaging of basal cell carcinoma ex vivo and in vivo. Br. J. Dermatol. 2004, 151, 424. [Google Scholar] [CrossRef]
  32. Grootendorst, M.R.; Fitzgerald, A.J.; De Koning, S.G.B.; Santaolalla, A.; Portieri, A.; Van Hemelrijck, M.; Young, M.R.; Owen, J.; Cariati, M.; Pepper, M.; et al. Use of a handheld Terahertz pulsed imaging device to differentiate benign and malignant breast tissue. Biomed. Opt. Express 2017, 8, 2932–2945. [Google Scholar] [CrossRef] [Green Version]
  33. Portieri, A.; Grootendorst, M.; Fitzgerald, T. Intra-operative Terahertz probe for detection of breast cancer. In Proceedings of the 2015 8th UK, Europe, China Millimeter Waves and THz Technology Workshop (UCMMT), Cardiff, UK, 14–15 September 2015. [Google Scholar]
  34. Price, B.J.; Clitherow, J.W.; Bradshaw, J. Aminoalkyl Furan Derivatives. U.S. Patent 4,128,658, 5 December 1978. [Google Scholar]
  35. Crookes, D.L. Aminoalkyl Furan Derivative. U.S. Patent 4,521,431, 4 June 1985. [Google Scholar]
  36. Crookes, D.L. Process for Forming form 2 Ranitidine Hydrochloride. U.S. Patent 4,672,133, 9 June 1987. [Google Scholar]
  37. Walther, M.; Plochocka, P.; Fischer, B.; Helm, H.; Uhd Jepsen, P. Collective vibrational modes in biological molecules investigated by terahertz time-domain spectroscopy. Biopolym. Orig. Res. Biomol. 2002, 67, 310–313. [Google Scholar] [CrossRef]
  38. Taday, P.F.; Bradley, I.V.; Arnone, D.D.; Pepper, M. Using Terahertz pulse spectroscopy to study the crystalline structure of a drug: A case study of the polymorphs of ranitidine hydrochloride. J. Pharm. Sci. 2003, 92, 831–838. [Google Scholar] [CrossRef] [PubMed]
  39. Strachan, C.J.; Taday, P.F.; Newnham, D.A.; Gordon, K.C.; Zeitler, J.A.; Pepper, M.; Rades, T. Using terahertz pulsed spectroscopy to quantify pharmaceutical polymorphism and crystallinity. J. Pharm. Sci. 2005, 94, 837–846. [Google Scholar] [CrossRef] [PubMed]
  40. Delaney, S.P.; Witko, E.M.; Smith, T.M.; Korter, T.M. Investigating tautomeric polymorphism in crystalline anthranilic acid using terahertz spectroscopy and solid-state density functional theory. J. Phys. Chem. A 2012, 116, 8051–8057. [Google Scholar] [CrossRef]
  41. Zeitler, J.A.; Kogermann, K.; Rantanen, J.; Rades, T.; Taday, P.F.; Pepper, M.; Aaltonen, J.; Strachan, C.J. Drug hydrate systems and dehydration processes studied by terahertz pulsed spectroscopy. Int. J. Pharm. 2007, 334, 78–84. [Google Scholar] [CrossRef] [PubMed]
  42. Day, G.M.; Zeitler, J.A.; Jones, W.; Rades, T.; Taday, P.F. Understanding the influence of polymorphism on phonon spectra: Lattice dynamics calculations and terahertz spectroscopy of carbamazepine. J. Phys. Chem. B 2006, 110, 447–456. [Google Scholar] [CrossRef] [PubMed]
  43. Zeitler, J.A.; Taday, P.F.; Gordon, K.C.; Pepper, M.; Rades, T. Solid-state transition mechanism in carbamazepine polymorphs by time-resolved terahertz spectroscopy. Chem. Phys. Chem. 2007, 8, 1924–1927. [Google Scholar] [CrossRef]
  44. Zeitler, J.A.; Taday, P.F.; Pepper, M.; Rades, T. Relaxation and crystallization of amorphous carbamazepine studied by terahertz pulsed spectroscopy. J. Pharm. Sci. 2007, 96, 2703–2709. [Google Scholar] [CrossRef]
  45. King, M.D.; Buchanan, W.D.; Korter, T.M. Identification and quantification of polymorphism in the pharmaceutical compound diclofenac acid by terahertz spectroscopy and solid-state density functional theory. Anal. Chem. 2011, 83, 3786–3792. [Google Scholar] [CrossRef] [PubMed]
  46. Zhang, F.; Wang, H.-W.; Tominaga, K.; Hayashi, M. Characteristics of low-frequency molecular phonon modes studied by THz spectroscopy and solid-state Ab initio theory: Polymorphs I and III of diflunisal. J. Phys. Chem. B 2016, 120, 1698–1710. [Google Scholar] [CrossRef]
  47. Ajito, K.; Ueno, Y.; Song, H.J.; Tamechika, E.; Kukutsu, N. Terahertz spectroscopic imaging of polymorphic forms in pharmaceutical crystals. Mol. Cryst. Liq. Cryst. 2011, 538, 33–38. [Google Scholar] [CrossRef]
  48. Delaney, S.P.; Smith, T.M.; Korter, T.M. Conformational origins of polymorphism in two forms of flufenamic acid. J. Mol. Struct. 2014, 1078, 83–89. [Google Scholar] [CrossRef]
  49. Ge, M.; Liu, G.F.; Ma, S.H.; Wang, W.F. Polymorphic forms of furosemide characterized by THz time domain spectroscopy. Bull. Kor. Chem. Soc. 2009, 30, 2265–2268. [Google Scholar]
  50. Ruggiero, M.T.; Sibik, J.; Zeitler, J.A.; Korter, T.M. Examination of L-glutamic acid polymorphs by solid-state density functional theory and terahertz spectroscopy. J. Phys. Chem. A 2016, 120, 7490–7495. [Google Scholar] [CrossRef] [PubMed]
  51. Ruggiero, M.T.; Sutton, J.J.; Fraser-Miller, S.J.; Zaczek, A.J.; Korter, T.M.; Gordon, K.C.; Zeitler, J.A. Revisiting the thermodynamic stability of indomethacin polymorphs with low-frequency vibrational spectroscopy and quantum mechanical simulations. Cryst. Growth Des. 2018, 18, 6513–6520. [Google Scholar] [CrossRef] [Green Version]
  52. Delaney, S.P.; Pan, D.; Galella, M.; Yin, S.X.; Korter, T.M. Understanding the origins of conformational disorder in the crystalline polymorphs of irbesartan. Cryst. Growth Des. 2012, 12, 5017–5024. [Google Scholar] [CrossRef]
  53. Da Silva, V.H.; Vieira, F.S.; Rohwedder, J.J.; Pasquini, C.; Pereira, C.F. Multivariate quantification of mebendazole polymorphs by terahertz time domain spectroscopy (THZ-TDS). Analyst 2017, 142, 1519–1524. [Google Scholar] [CrossRef] [PubMed]
  54. Otsuka, M.; Nishizawa, J.I.; Shibata, J.; Ito, M. Quantitative evaluation of mefenamic acid polymorphs by terahertz-chemometrics. J. Pharm. Sci. 2010, 99, 4048–4053. [Google Scholar] [CrossRef] [PubMed]
  55. Rexrode, N.R.; Orien, J.; King, M.D. Effects of solvent stabilization on pharmaceutical crystallization: Investigating conformational polymorphism of probucol using combined solid-state density functional theory, molecular dynamics, and terahertz spectroscopy. J. Phys. Chem. A 2019, 123, 6937–6947. [Google Scholar] [CrossRef] [PubMed]
  56. Wallace, V.P.; Taday, P.F.; Fitzgerald, A.J.; Woodward, R.M.; Cluff, J.; Pye, R.J.; Arnone, D.D. Terahertz pulsed imaging and spectroscopy for biomedical and pharmaceutical applications. Faraday Discuss. 2004, 126, 255–263. [Google Scholar] [CrossRef] [PubMed]
  57. Tan, N.Y.; Zeitler, J.A. Probing phase transitions in simvastatin with terahertz time-domain spectroscopy. Mol. Pharm. 2015, 12, 810–815. [Google Scholar] [CrossRef]
  58. Zeitler, J.A.; Newnham, D.A.; Taday, P.F.; Threlfall, T.L.; Lancaster, R.W.; Berg, R.W.; Strachan, C.J.; Pepper, M.; Gordon, K.C.; Rades, T. Characterization of temperature-induced phase transitions in five polymorphic forms of sulfathiazole by terahertz pulsed spectroscopy and differential scanning calorimetry. J. Pharm. Sci. 2006, 95, 2486–2498. [Google Scholar] [CrossRef] [Green Version]
  59. Upadhya, P.C.; Nguyen, K.L.; Shen, Y.C.; Obradovic, J.; Fukushige, K.; Griffiths, R.; Gladden, L.F.; Davies, A.G.; Linfield, E.H. Characterization of Crystalline Phase-Transformations in Theophylline by Time-Domain Terahertz Spectroscopy. Spectrosc. Lett. 2006, 39, 215–224. [Google Scholar] [CrossRef]
  60. Hisazumi, J.; Suzuki, T.; Nakagami, H.; Terada, K. Quantification of pharmaceutical polymorphs and prediction of dissolution rate using theophylline tablet by terahertz spectroscopy. Chem. Pharm. Bull. 2011, 59, 442–446. [Google Scholar] [CrossRef] [PubMed] [Green Version]
  61. Ikeda, Y.; Ishihara, Y.; Moriwaki, T.; Kato, E.; Terada, K. A novel analytical method for pharmaceutical polymorphs by terahertz spectroscopy and the optimization of crystal form at the discovery stage. Chem. Pharm. Bull. 2010, 58, 76–81. [Google Scholar] [CrossRef] [PubMed] [Green Version]
  62. Delaney, S.P.; Pan, D.; Yin, S.X.; Smith, T.M.; Korter, T.M. Evaluating the roles of conformational strain and cohesive binding in crystalline polymorphs of aripiprazole. Cryst. Growth Des. 2013, 13, 2943–2952. [Google Scholar] [CrossRef]
  63. Ruggiero, M.T. Invited Review: Modern Methods for Accurately Simulating the Terahertz Spectra of Solids. J. Infrared Millim. Terahertz Waves 2020, 41, 491–528. [Google Scholar] [CrossRef] [Green Version]
  64. Chantry, G.W.; Gebbie, H.A. Sub-millimetre wave spectra of polar liquids. Nature 1965, 208, 378. [Google Scholar] [CrossRef]
  65. Walther, M.; Fischer, B.M.; Jepsen, P.U. Noncovalent intermolecular forces in polycrystalline and amorphous saccharides in the far infrared. Chem. Phys. 2003, 288, 261–268. [Google Scholar] [CrossRef]
  66. Sibik, J.; Zeitler, J.A. Direct measurement of molecular mobility and crystallisation of amorphous pharmaceuticals using terahertz spectroscopy. Adv. Drug Deliv. Rev. 2016, 100, 147–157. [Google Scholar] [CrossRef] [Green Version]
  67. Sibik, J.; Sargent, M.J.; Franklin, M.; Zeitler, J.A. Crystallization and phase changes in paracetamol from the amorphous solid to the liquid phase. Mol. Pharm. 2014, 11, 1326–1334. [Google Scholar] [CrossRef] [PubMed]
  68. Sibik, J.; Löbmann, K.; Rades, T.; Zeitler, J.A. Predicting crystallization of amorphous drugs with terahertz spectroscopy. Mol. Pharm. 2015, 12, 3062–3068. [Google Scholar] [CrossRef] [PubMed]
  69. Sibik, J.; Zeitler, J.A. Terahertz response of organic amorphous systems: Experimental concerns and perspectives. Philos. Mag. 2016, 96, 842–853. [Google Scholar] [CrossRef] [Green Version]
  70. Kissi, E.O.; Grohganz, H.; Löbmann, K.; Ruggiero, M.T.; Zeitler, J.A.; Rades, T. Glass-transition temperature of the β-relaxation as the major predictive parameter for recrystallization of neat amorphous drugs. J. Phys. Chem. B 2018, 122, 2803–2808. [Google Scholar] [CrossRef] [PubMed]
  71. Fitzgerald, A.J.; Cole, B.E.; Taday, P.F. Nondestructive analysis of tablet coating thicknesses using terahertz pulsed imaging. J. Pharm. Sci. 2005, 94, 177–183. [Google Scholar] [CrossRef] [PubMed]
  72. Zeitler, J.A.; Shen, Y.; Baker, C.; Taday, P.F.; Pepper, M.; Rades, T. Analysis of coating structures and interfaces in solid oral dosage forms by three dimensional terahertz pulsed imaging. J. Pharm. Sci. 2007, 96, 330–340. [Google Scholar] [CrossRef] [PubMed] [Green Version]
  73. Spencer, J.A.; Gao, Z.; Moore, T.; Buhse, L.F.; Taday, P.F.; Newnham, D.A.; Shen, Y.; Portieri, A.; Husain, A. Delayed Release Tablet Dissolution Related to Coating Thickness by Terahertz Pulsed Image Mapping. J. Pharm. Sci. 2008, 97, 1543–1550. [Google Scholar] [CrossRef]
  74. Ho, L.; Müller, R.; Römer, M.; Gordon, K.C.; Heinämäki, J.; Kleinebudde, P.; Pepper, M.; Rades, T.; Shen, Y.C.; Strachan, C.J.; et al. Analysis of sustained-release tablet film coats using terahertz pulsed imaging. J. Control. Release 2007, 119, 253–261. [Google Scholar] [CrossRef]
  75. Ho, L.; Müller, R.; Gordon, K.C.; Kleinebudde, P.; Pepper, M.; Rades, T.; Shen, Y.; Taday, P.F.; Zeitler, J.A. Terahertz pulsed imaging as an analytical tool for sustained-release tablet film coating. Eur. J. Pharm. Biopharm. 2009, 71, 117–123. [Google Scholar] [CrossRef]
  76. Ho, L.; Müller, R.; Gordon, K.C.; Kleinebudde, P.; Pepper, M.; Rades, T.; Shen, Y.; Taday, P.F.; Zeitler, J.A. Monitoring the film coating unit operation and predicting drug dissolution using terahertz pulsed imaging. J. Pharm. Sci. 2009, 98, 4866–4876. [Google Scholar] [CrossRef]
  77. Ho, L.; Müller, R.; Gordon, K.C.; Kleinebudde, P.; Pepper, M.; Rades, T.; Shen, Y.; Taday, P.F.; Zeitler, J.A. Applications of terahertz pulsed imaging to sustained-release tablet film coating quality assessment and dissolution performance. J. Control. Release 2008, 127, 79–87. [Google Scholar] [CrossRef]
  78. May, R.K.; Su, K.E.; Han, L.; Zhong, S.; Elliott, J.A.; Gladden, L.F.; Evans, M.; Shen, Y.; Zeitler, J.A. Hardness and Density Distributions of Pharmaceutical Tablets Measured by Terahertz Pulsed Imaging. J. Pharm. Sci. 2013, 102, 2179–2186. [Google Scholar] [CrossRef] [PubMed]
  79. May, R.K.; Evans, M.J.; Zhong, S.; Warr, I.; Gladden, L.F.; Shen, Y.; Zeitler, J.A. Terahertz in-line sensor for direct coating thickness measurement of individual tablets during film coating in real-time. J. Pharm. Sci. 2011, 100, 1535–1544. [Google Scholar] [CrossRef]
  80. Pei, C.; Lin, H.; Markl, D.; Shen, Y.C.; Zeitler, J.A.; Elliott, J.A. A quantitative comparison of in-line coating thickness distributions obtained from a pharmaceutical tablet mixing process using discrete element method and terahertz pulsed imaging. Chem. Eng. Sci. 2018, 192, 34–45. [Google Scholar] [CrossRef] [Green Version]
  81. Markl, D.; Sauerwein, J.; Goodwin, D.J.; van den Ban, S.; Zeitler, J.A. Non-destructive determination of disintegration time and dissolution in immediate release tablets by terahertz transmission measurements. Pharm. Res. 2017, 34, 1012–1022. [Google Scholar] [CrossRef] [PubMed] [Green Version]
  82. Markl, D.; Bawuah, P.; Ridgway, C.; van den Ban, S.; Goodwin, D.J.; Ketolainen, J.; Gane, P.; Peiponen, K.E.; Zeitler, J.A. Fast and non-destructive pore structure analysis using terahertz time-domain spectroscopy. Int. J. Pharm. 2018, 537, 102–110. [Google Scholar] [CrossRef] [Green Version]
  83. Bawuah, P.; Markl, D.; Farrell, D.; Evans, M.; Portieri, A.; Anderson, A.; Goodwin, D.; Lucas, R.; Zeitler, J.A. Terahertz-based porosity measurement of pharmaceutical tablets: A tutorial. J. Infrared Millim. Terahertz Waves 2020, 41, 450–469. [Google Scholar] [CrossRef] [Green Version]
  84. Skelbæk-Pedersen, A.L.; Anuschek, M.; Vilhelmsen, T.K.; Rantanen, J.; Zeitler, J.A. Non-destructive quantification of fragmentation within tablets after compression from scattering analysis of terahertz transmission measurements. Int. J. Pharm. 2020, 588, 119769. [Google Scholar] [CrossRef]
  85. Bawuah, P.; Markl, D.; Turner, A.; Evans, M.; Portieri, A.; Farrell, D.; Lucas, R.; Anderson, A.; Goodwin, D.J.; Zeitler, J.A. A fast and non-destructive terahertz dissolution assay for immediate release tablets. J. Pharm. Sci. 2021, 110, 2083–2092. [Google Scholar] [CrossRef]
  86. Recur, B.; Younus, A.; Salort, S.; Mounaix, P.; Chassagne, B.; Desbarats, P.; Caumes, J.P.; Abraham, E. Investigation on reconstruction methods applied to 3D terahertz computed tomography. Opt. Express 2011, 19, 5105–5117. [Google Scholar] [CrossRef] [Green Version]
  87. Jackson, J.B.; Bowen, J.; Walker, G.; Labaune, J.; Mourou, G.; Menu, M.; Fukunaga, K. A Survey of Terahertz Applications in Cultural Heritage Conservation Science. IEEE Trans. Terahertz Sci. Technol. 2011, 1, 220–231. [Google Scholar] [CrossRef]
  88. Cosentino, A. Terahertz and Cultural Heritage Science: Examination of Art and Archaeology. Technologies 2016, 4, 6. [Google Scholar] [CrossRef]
  89. Walker, G.C.; Bowen, J.W.; Matthews, W.; Roychowdhury, S.; Labaune, J.; Mourou, G.; Menu, M.; Hodder, I.; Jackson, J.B. Sub-surface terahertz imaging through uneven surfaces: Visualizing Neolithic wall paintings in Çatalhöyük. Opt. Express 2013, 21, 8126–8134. [Google Scholar] [CrossRef] [PubMed]
  90. Seco-Martorell, C.; López-Domínguez, V.; Arauz-Garofalo, G.; Redo-Sanchez, A.; Palacios, J.; Tejada, J. Goya’s Artwork Imaging with Terahertz Waves. Opt. Express 2013, 21, 17800–17805. [Google Scholar] [CrossRef] [PubMed] [Green Version]
  91. Wallace, V.P.; Macpherson, E.; Zeitler, J.A.; Reid, C. Three-dimensional imaging of optically opaque materials using nonionizing terahertz radiation. J. Opt. Soc. Am. A 2008, 25, 3120–3133. [Google Scholar] [CrossRef] [Green Version]
  92. Bardon, T.; May, R.K.; Jackson, J.B.; Beentjes, G.; de Bruin, G.; Taday, P.F.; Strlič, M. Contrast in Terahertz Images of Archival Documents—Part I: Influence of the Optical Parameters from the Ink and Support. J. Infrared Millim. Terahertz Waves 2017, 38, 443–466. [Google Scholar] [CrossRef] [Green Version]
  93. Shen, Y.C.; Taday, P.F.; Pepper, M. Elimination of scattering effects in spectral measurement of granulated materials using terahertz pulsed spectroscopy. Appl. Phys. Lett. 2008, 92, 051103. [Google Scholar] [CrossRef] [Green Version]
  94. Bardon, T.; May, R.K.; Taday, P.F.; Strlic, M. Influence of Particle Size on Optical Constants from Pellets Measured with Terahertz Pulsed Spectroscopy. IEEE Trans. Terahertz Sci. Technol. 2016, 6, 408–413. [Google Scholar] [CrossRef] [Green Version]
  95. Bardon, T.; May, R.K.; Taday, P.F.; Strlic, M. Material characterization of historical parchment using terahertz time-domain spectroscopy. In Proceedings of the International Conference on Infrared, Millimeter, and Terahertz Waves, IRMMW-THz, Tucson, AZ, USA, 14–19 September 2014. [Google Scholar]
  96. Bardon, T.; May, R.K.; Taday, P.F.; Strlič, M. Contrast in Terahertz Images of Archival Documents—Part II: Influence of Topographic Features. J. Infrared Millim. Terahertz Waves 2017, 38, 467–482. [Google Scholar] [CrossRef] [Green Version]
  97. Ruggiero, M.T.; Bardon, T.; Strlič, M.; Taday, P.F.; Korter, T.M. Assignment of the terahertz spectra of crystalline copper sulfate and its hydrates via solid-state density functional theory. J. Phys. Chem. A 2014, 118, 10101–10108. [Google Scholar] [CrossRef]
  98. Ruggiero, M.T.; Bardon, T.; Strlic, M.; Taday, P.F.; Korter, T.M. The role of terahertz polariton absorption in the characterization of crystalline iron sulfate hydrates. Phys. Chem. Chem. Phys. 2015, 17, 9326–9334. [Google Scholar] [CrossRef]
  99. Yasui, T.; Yasuda, T.; Sawanaka, K.I.; Araki, T. Terahertz paintmeter for noncontact monitoring of thickness and drying progress in paint film. Appl. Opt. 2005, 44, 6849–6856. [Google Scholar] [CrossRef] [PubMed] [Green Version]
  100. Yasuda, T.; Iwata, T.; Araki, T.; Yasui, T. Improvement of minimum paint film thickness for THz paint meters by multiple-regression analysis. Appl. Opt. 2007, 46, 7518–7526. [Google Scholar] [CrossRef] [PubMed]
  101. Kawase, K.; Shibuya, T.; Suizu, K.; Hayashi, S.I. Terahertz-wave generation for industrial applications. In Terahertz Physics, Devices, and Systems IV: Advanced Applications in Industry and Defense; Mehdi, A., Nibir, K.D., Thomas, W.C., Eds.; SPIE: Bellingham, WA, USA, 2010. [Google Scholar]
  102. Su, K.; May, R.K.; Gregory, I.S.; Taday, P.F.; Shen, Y.C.; Zeitler, J.A. Terahertz sensor for non-contact thickness measurement of car paints. In Proceedings of the 2013 38th International Conference on Infrared, Millimeter, and Terahertz Waves (IRMMW-THz), Mainz, Germany, 1–6 September 2013; pp. 1–2. [Google Scholar]
  103. Dong, Y.; Zhang, J.; Shen, Y.C.; Su, K.; Zeitler, J.A. Non-destructive characterization of automobile car paints using terahertz pulsed imaging and infrared optical coherence tomography. In Proceedings of the 2015 40th International Conference on Infrared, Millimeter, and Terahertz Waves (IRMMW-THz), Hong Kong, China, 23–28 August 2015; pp. 1–2. [Google Scholar]
  104. Su, K.; Shen, Y.C.; Zeitler, J.A. Terahertz sensor for non-contact thickness and quality measurement of automobile paints of varying complexity. IEEE Trans. Terahertz Sci. Technol. 2014, 4, 432–439. [Google Scholar] [CrossRef]
  105. van Mechelen, J.L.M.; Kuzmenko, A.B.; Merbold, H. Stratified dispersive model for material characterization using terahertz time-domain spectroscopy. Opt. Lett. 2014, 39, 3853–3856. [Google Scholar] [CrossRef] [Green Version]
  106. Krimi, S.; Klier, J.; Jonuscheit, J.; von Freymann, G.; Urbansky, R.; Beigang, R. Highly accurate thickness measurement of multi-layered automotive paints using terahertz technology. Appl. Phys. Lett. 2016, 109, 021105. [Google Scholar] [CrossRef]
  107. Misovski, T.; Geogory, I.; Nichols, M. Use of terahertz-based sensing to quantify layer thickness in automotive paint system. In Proceedings of the SAE Conference, Detroit, MI, USA, 5–7 April 2022. [Google Scholar]
  108. Schmidt, C.; Alton, J.; Igarashi, M.; Chan, L.; Principe, E. Emerging techniques for 2-d/2.5-d/3-d package failure analysis: EOTPR, 3-d x-ray, and plasma fib. Electron. Device Fail. Anal. 2016, 4, 30–40. [Google Scholar]
  109. Alton, J.; Igarashi, M. Non-destructive fault localization in advanced IC packages using electro optical terahertz pulse reflectometry. In Proceedings of the 2013 European Microelectronics Packaging Conference (EMPC), Grenoble, France, 9–12 September 2013; pp. 1–4. [Google Scholar]
Figure 1. The above figure, (courtesy of TeraView), illustrates how basal cell carcinoma extends below the surface of skin in a patient. The left shows a photograph of the surface of the skin, a terahertz image of the surface is in the centre and the terahertz image of the stratum corneum–epidermis interface (not visible to the naked eye) shows that the cancer is widespread. See also reference [31].
Applsci 12 06169 g001
Figure 2. The terahertz spectra of different tablets containing ranitidine hydrochloride (a) Zantac from Glaxo, (b) Norton (Ranbaxy Laboratories), (c) Eastern Pharmaceuticals Ltd. (Middlesex, UK), (d) Apotex Inc. (Toronto, ON, Canada), (e) Tilmed, and (f) Generics UK Limited.
Applsci 12 06169 g002
Figure 3. The mean dissolution time in minutes against the thickness of the enteric coating as measured with terahertz pulsed imaging. The error bars are the variation in the enteric coating thickness as measured across the whole tablet.
Applsci 12 06169 g003
Figure 4. High throughput sampling system for measuring porosity of tablets.
Applsci 12 06169 g004
Figure 5. TeraView’s TeraCota sensor at the end of automotive grade robot installed at a production plant in the United States of America.
Applsci 12 06169 g005
Figure 6. Terahertz EOTPR compared to microwave TDR for fault isolation.
Applsci 12 06169 g006
Figure 7. Detection of failure with EOTPR (green = good device, red = failed unit), including the ability of EOTPR to determine the exact position of faults around contacts, confirmed by physical fault analysis (photo).
Applsci 12 06169 g007
Table 1. List of published papers of substances with different polymorphs investigated with terahertz pulses.
SubstanceFormReference
Anthranilic acidI, II and III[40]
CarbamazepineI, II, and III
Dehydrate
[39,41,42,43,44]
Diclofenac AcidI, and II[45]
DiflunisalI, and III[46]
Enalapril maleateI, and II[39]
FamotidineA, and B[47]
Flufenamic acidI, and III[48]
FurosemideI, II, III, IV, and V[49]
l-Glutamic Acidα and β[50]
Indomethacinα and γ[51]
IrbesartanA, and B[52]
MebendazoleA, B, and C[53]
Mefenamic acidI, and II[54]
ProbucolI, and II[55]
Ranitidine HClI, and II[38,56]
SimvastatinI, II, and III[57]
SulfathiazoleI, II, III, IV, and V[58]
TheophyllineI, and II
Monohydrate
[41,59,60]
TolbutamideI, II, and III[61]
Publisher’s Note: MDPI stays neutral with regard to jurisdictional claims in published maps and institutional affiliations.

