
Smart Piezoelectric-Based Wearable System for Calorie Intake Estimation Using Machine Learning

 , ,
, ,  and
and
Abstract
:1. Introduction
2. Literature Review
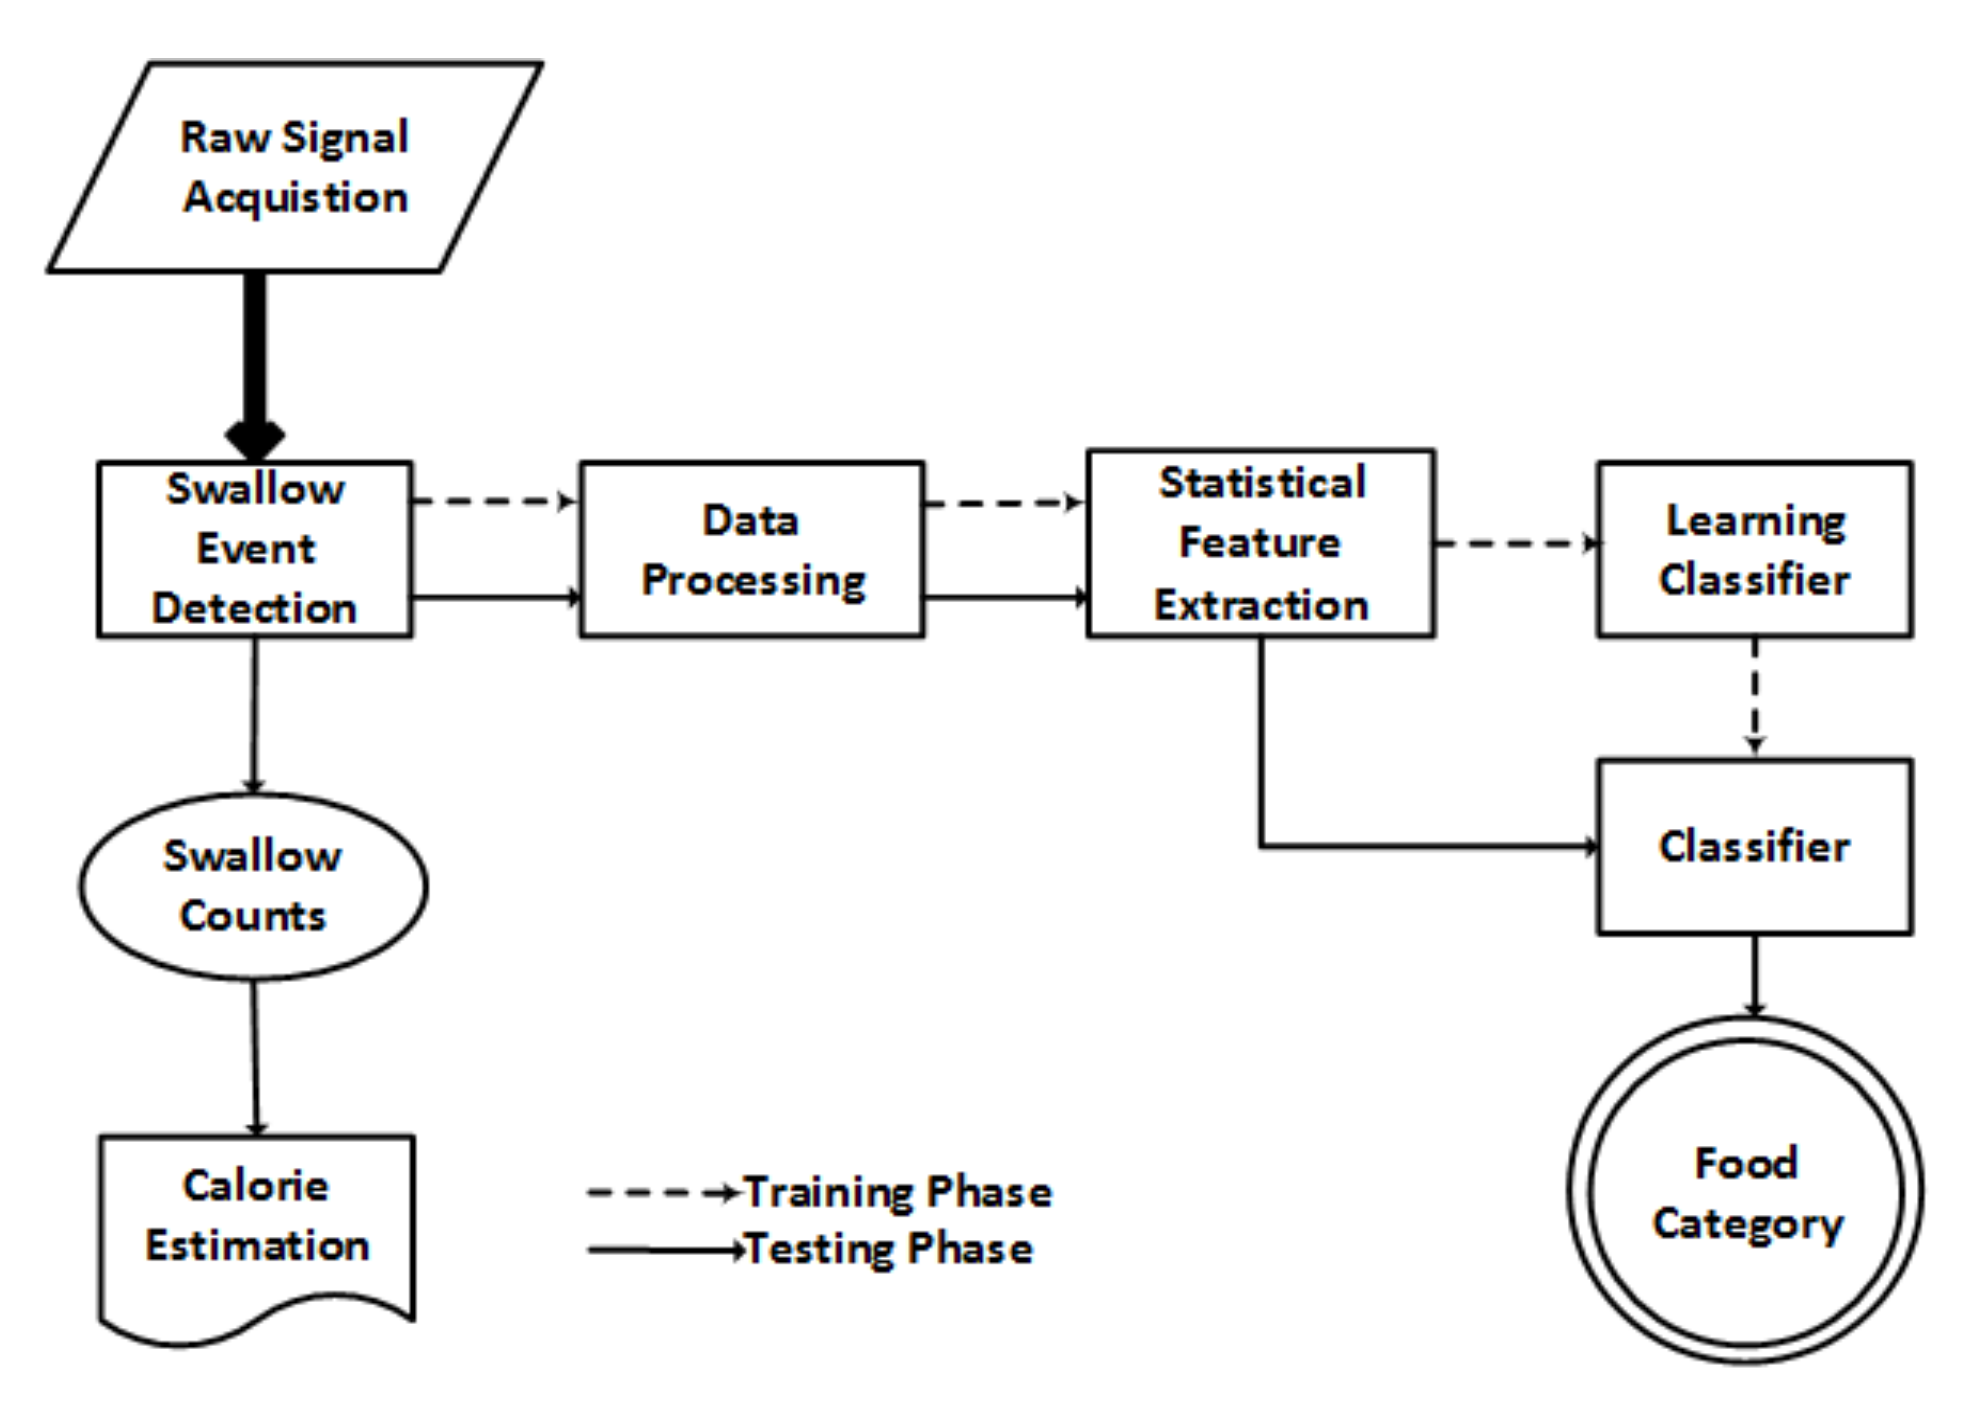
3. Acquisition of Raw Data
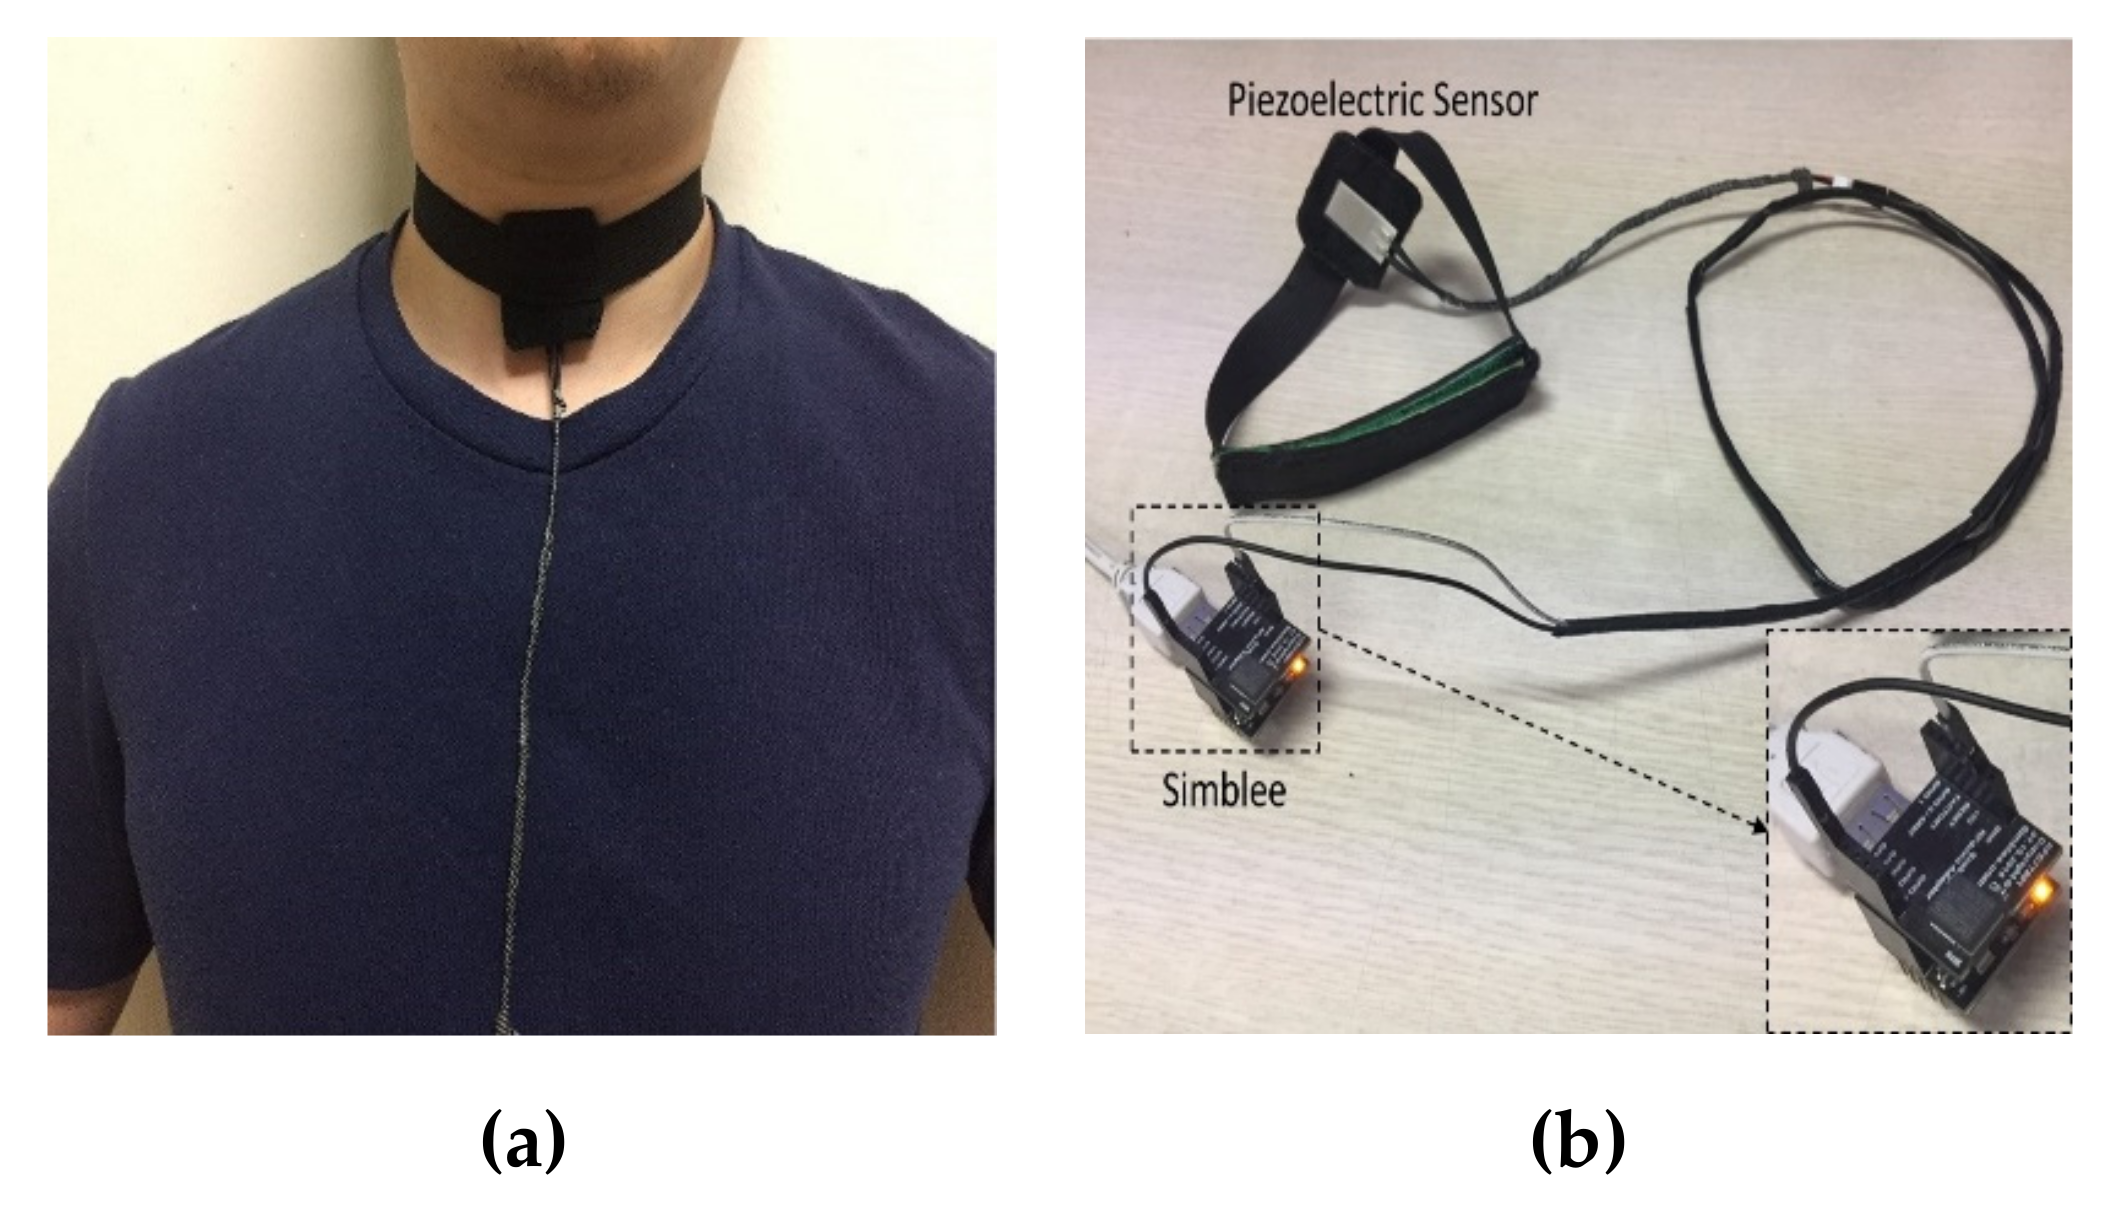
3.1. A Piezoelectric-Sensor Embedded Necklace
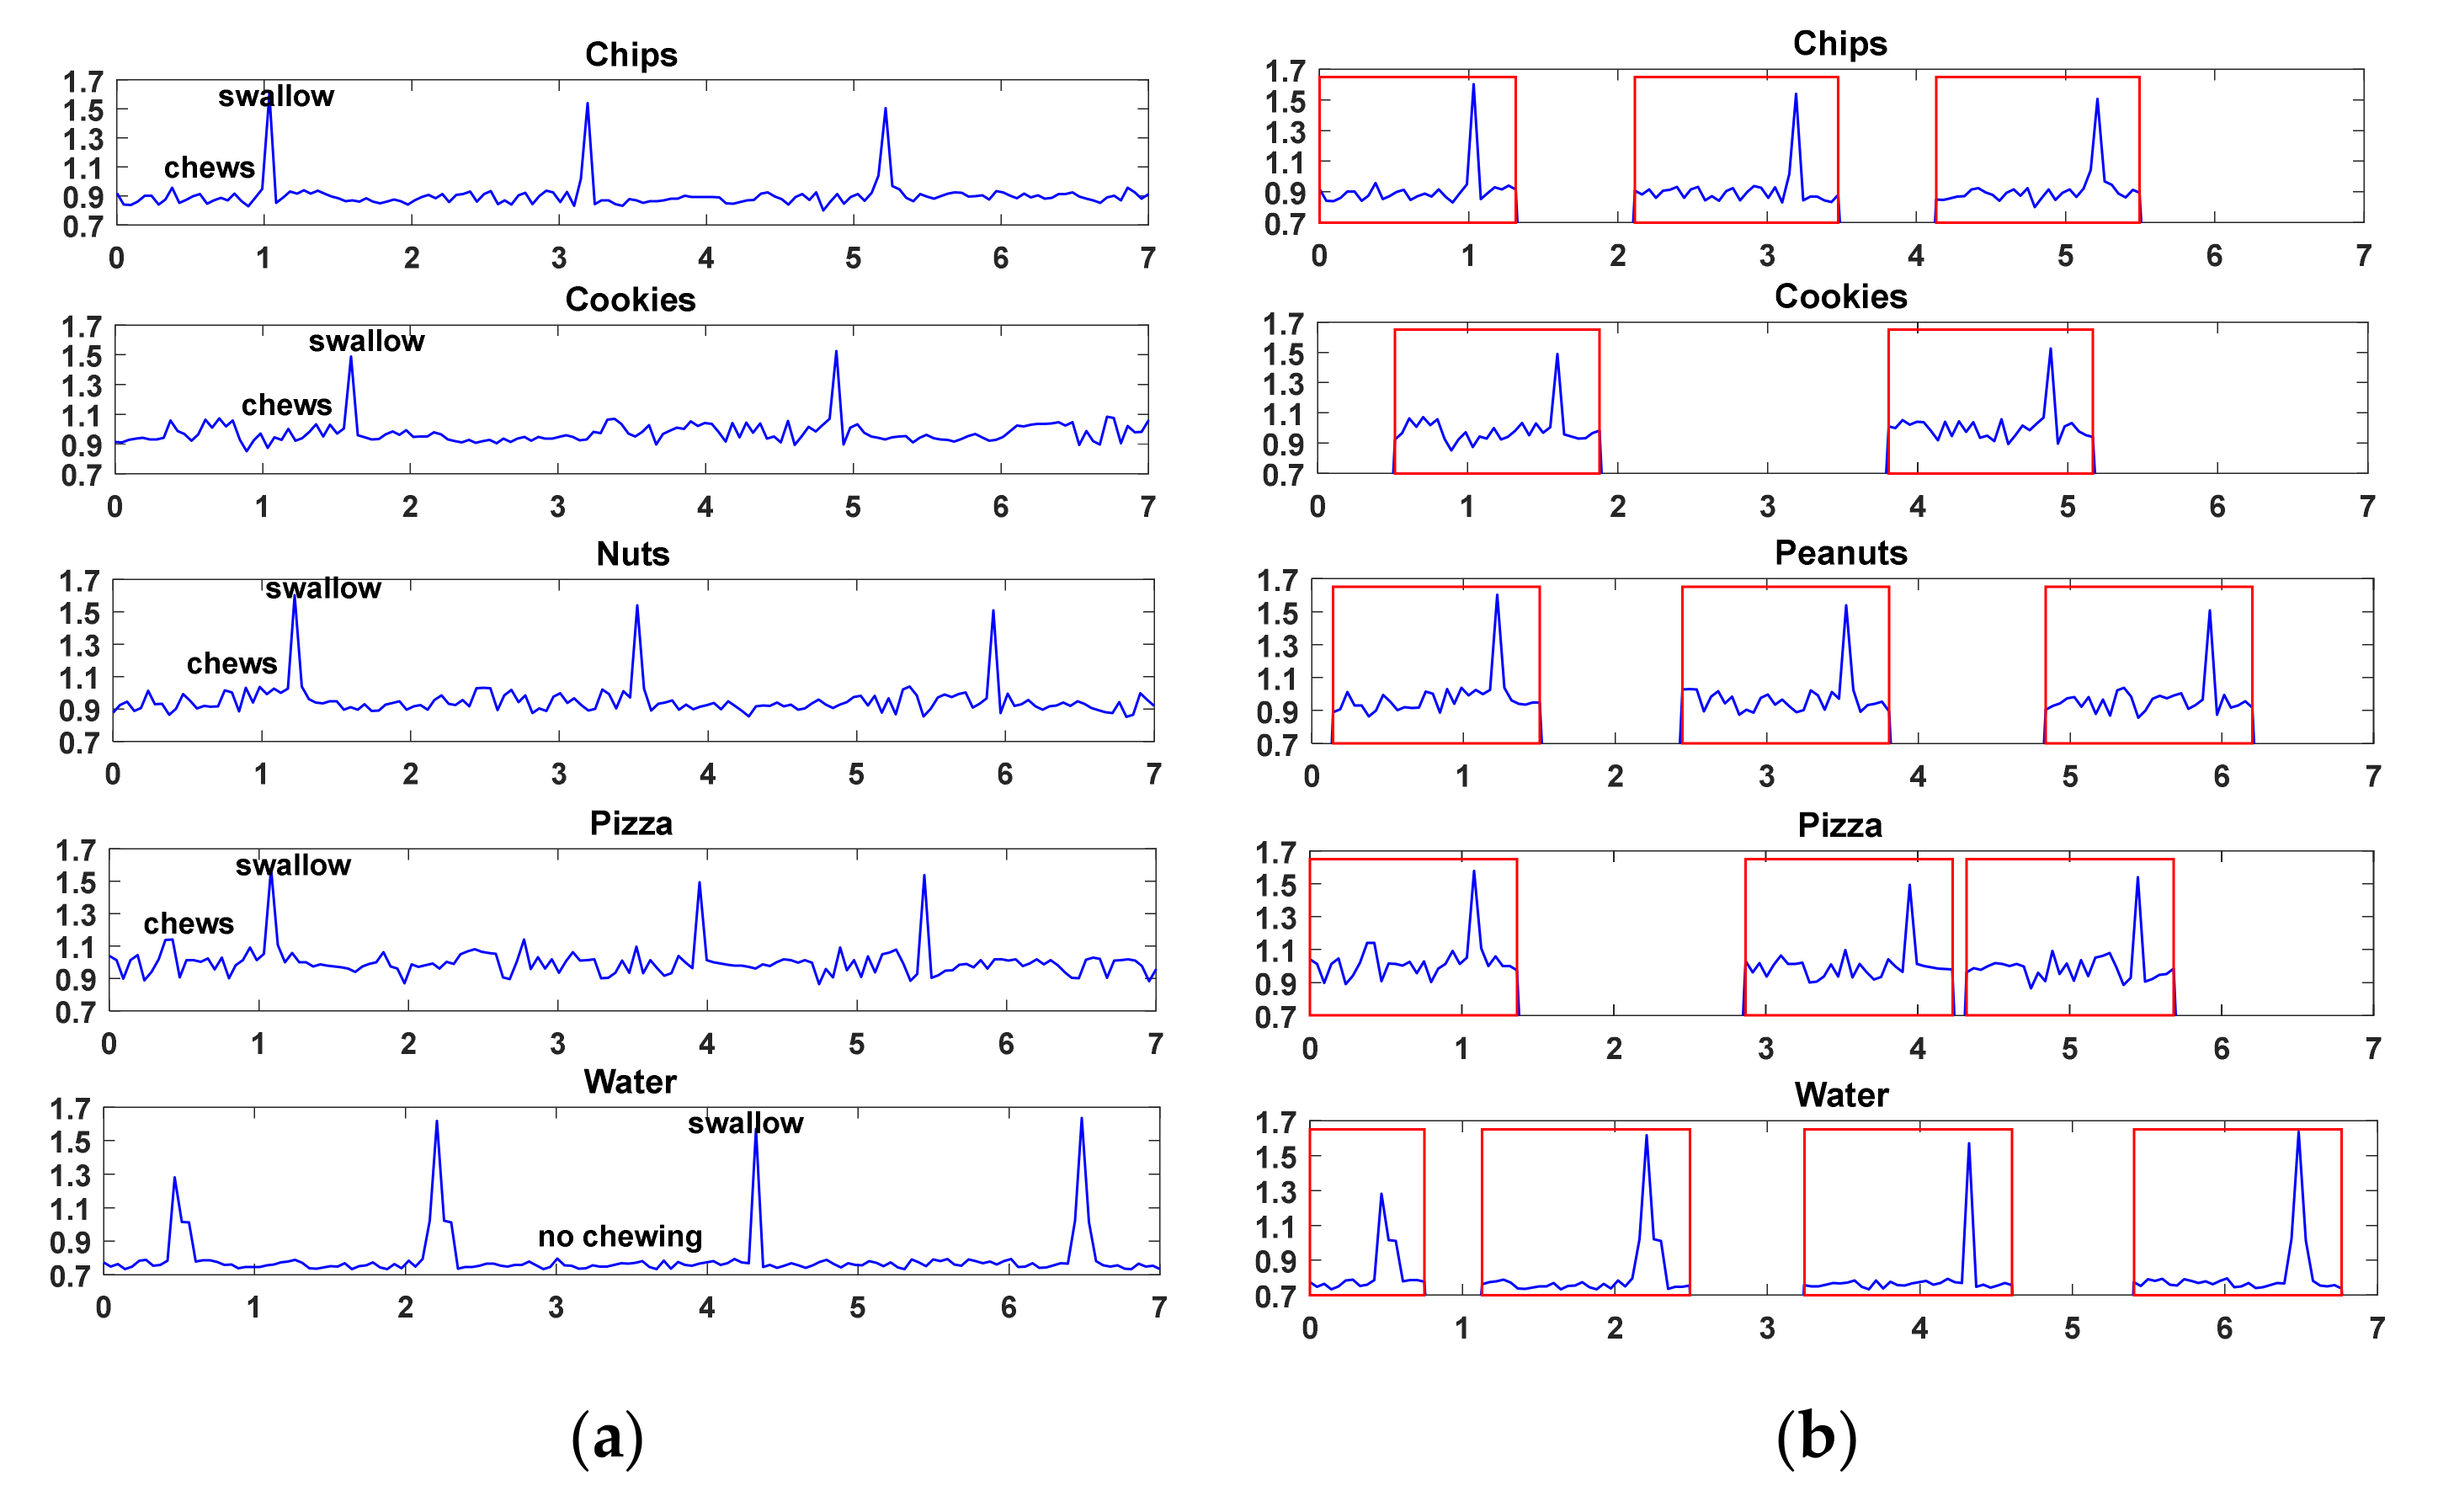
3.2. Data Processing
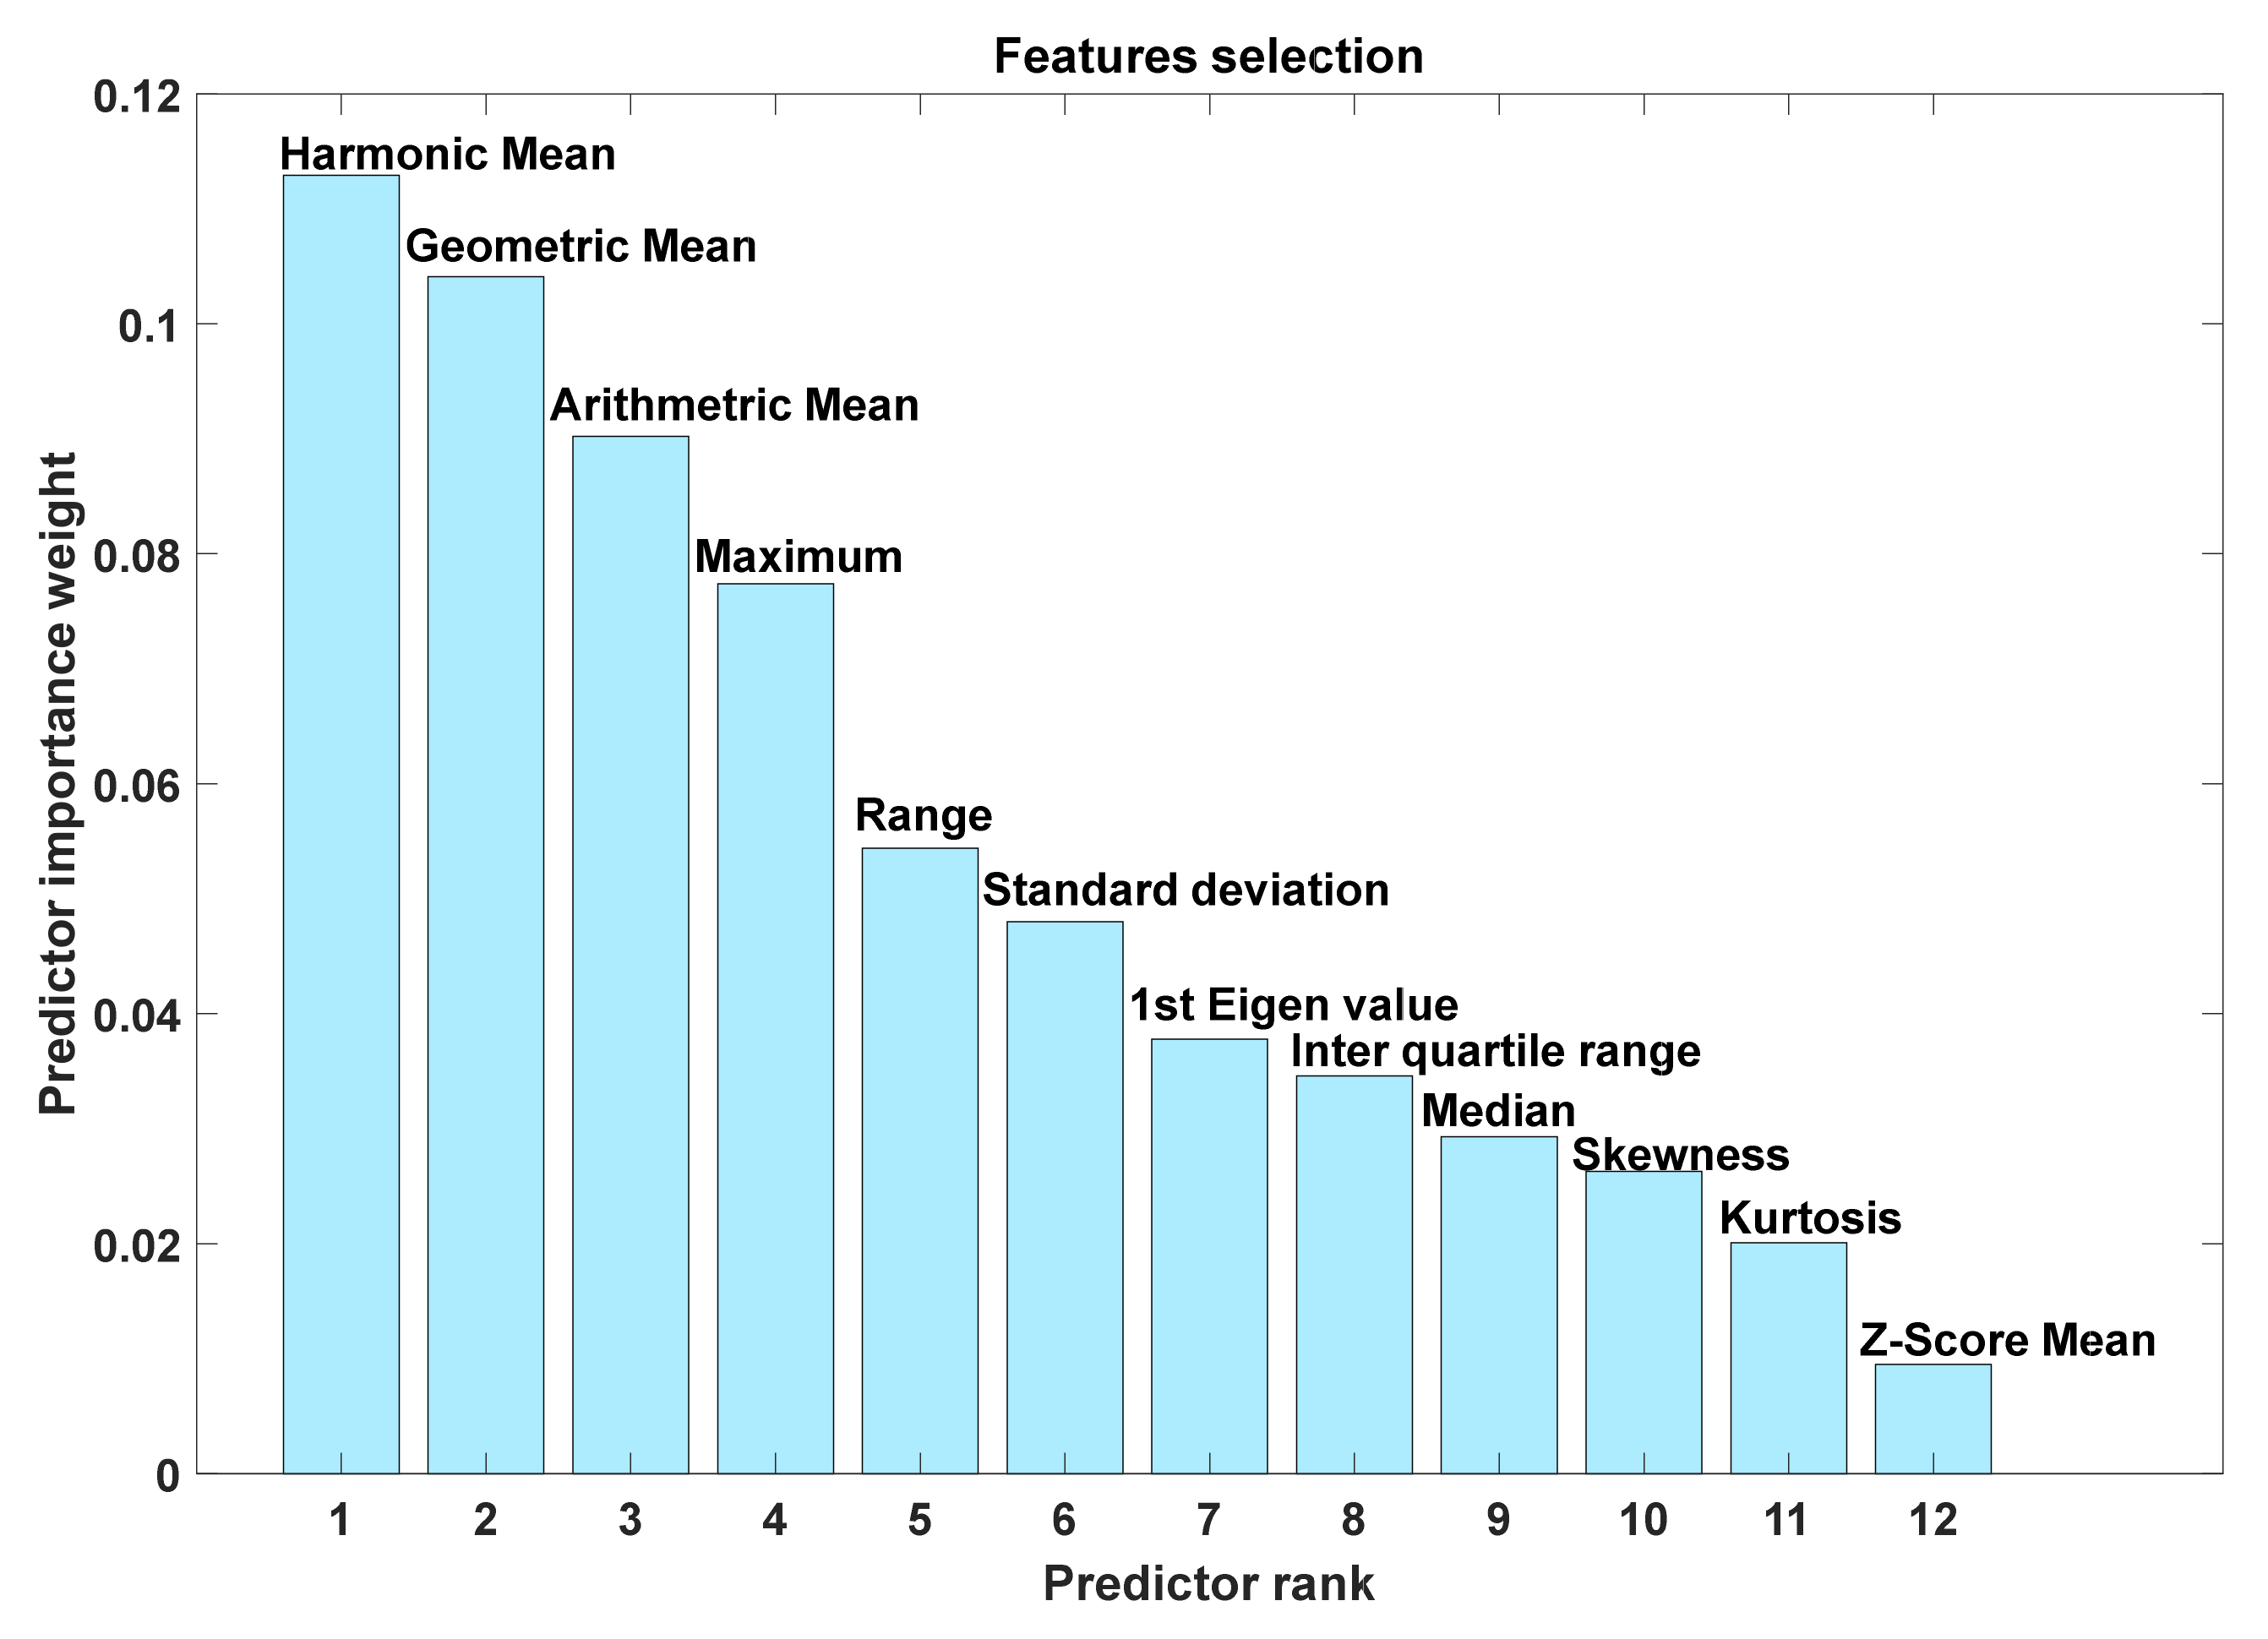
4. Feature Selection and Food Classification
RELIEFF
| Algorithm 1 The feature selecting RELIEF algorithm |
| 1: Set all weights W [A] =0.0 2: for i: =1: n (number of random instances) do 3: begin 4: Randomly select an instance R 5: Find nearest hit H (same class) & nearest miss M (different class). 6: for A: =1: all attributes do 7: 8: end for 9: end for |
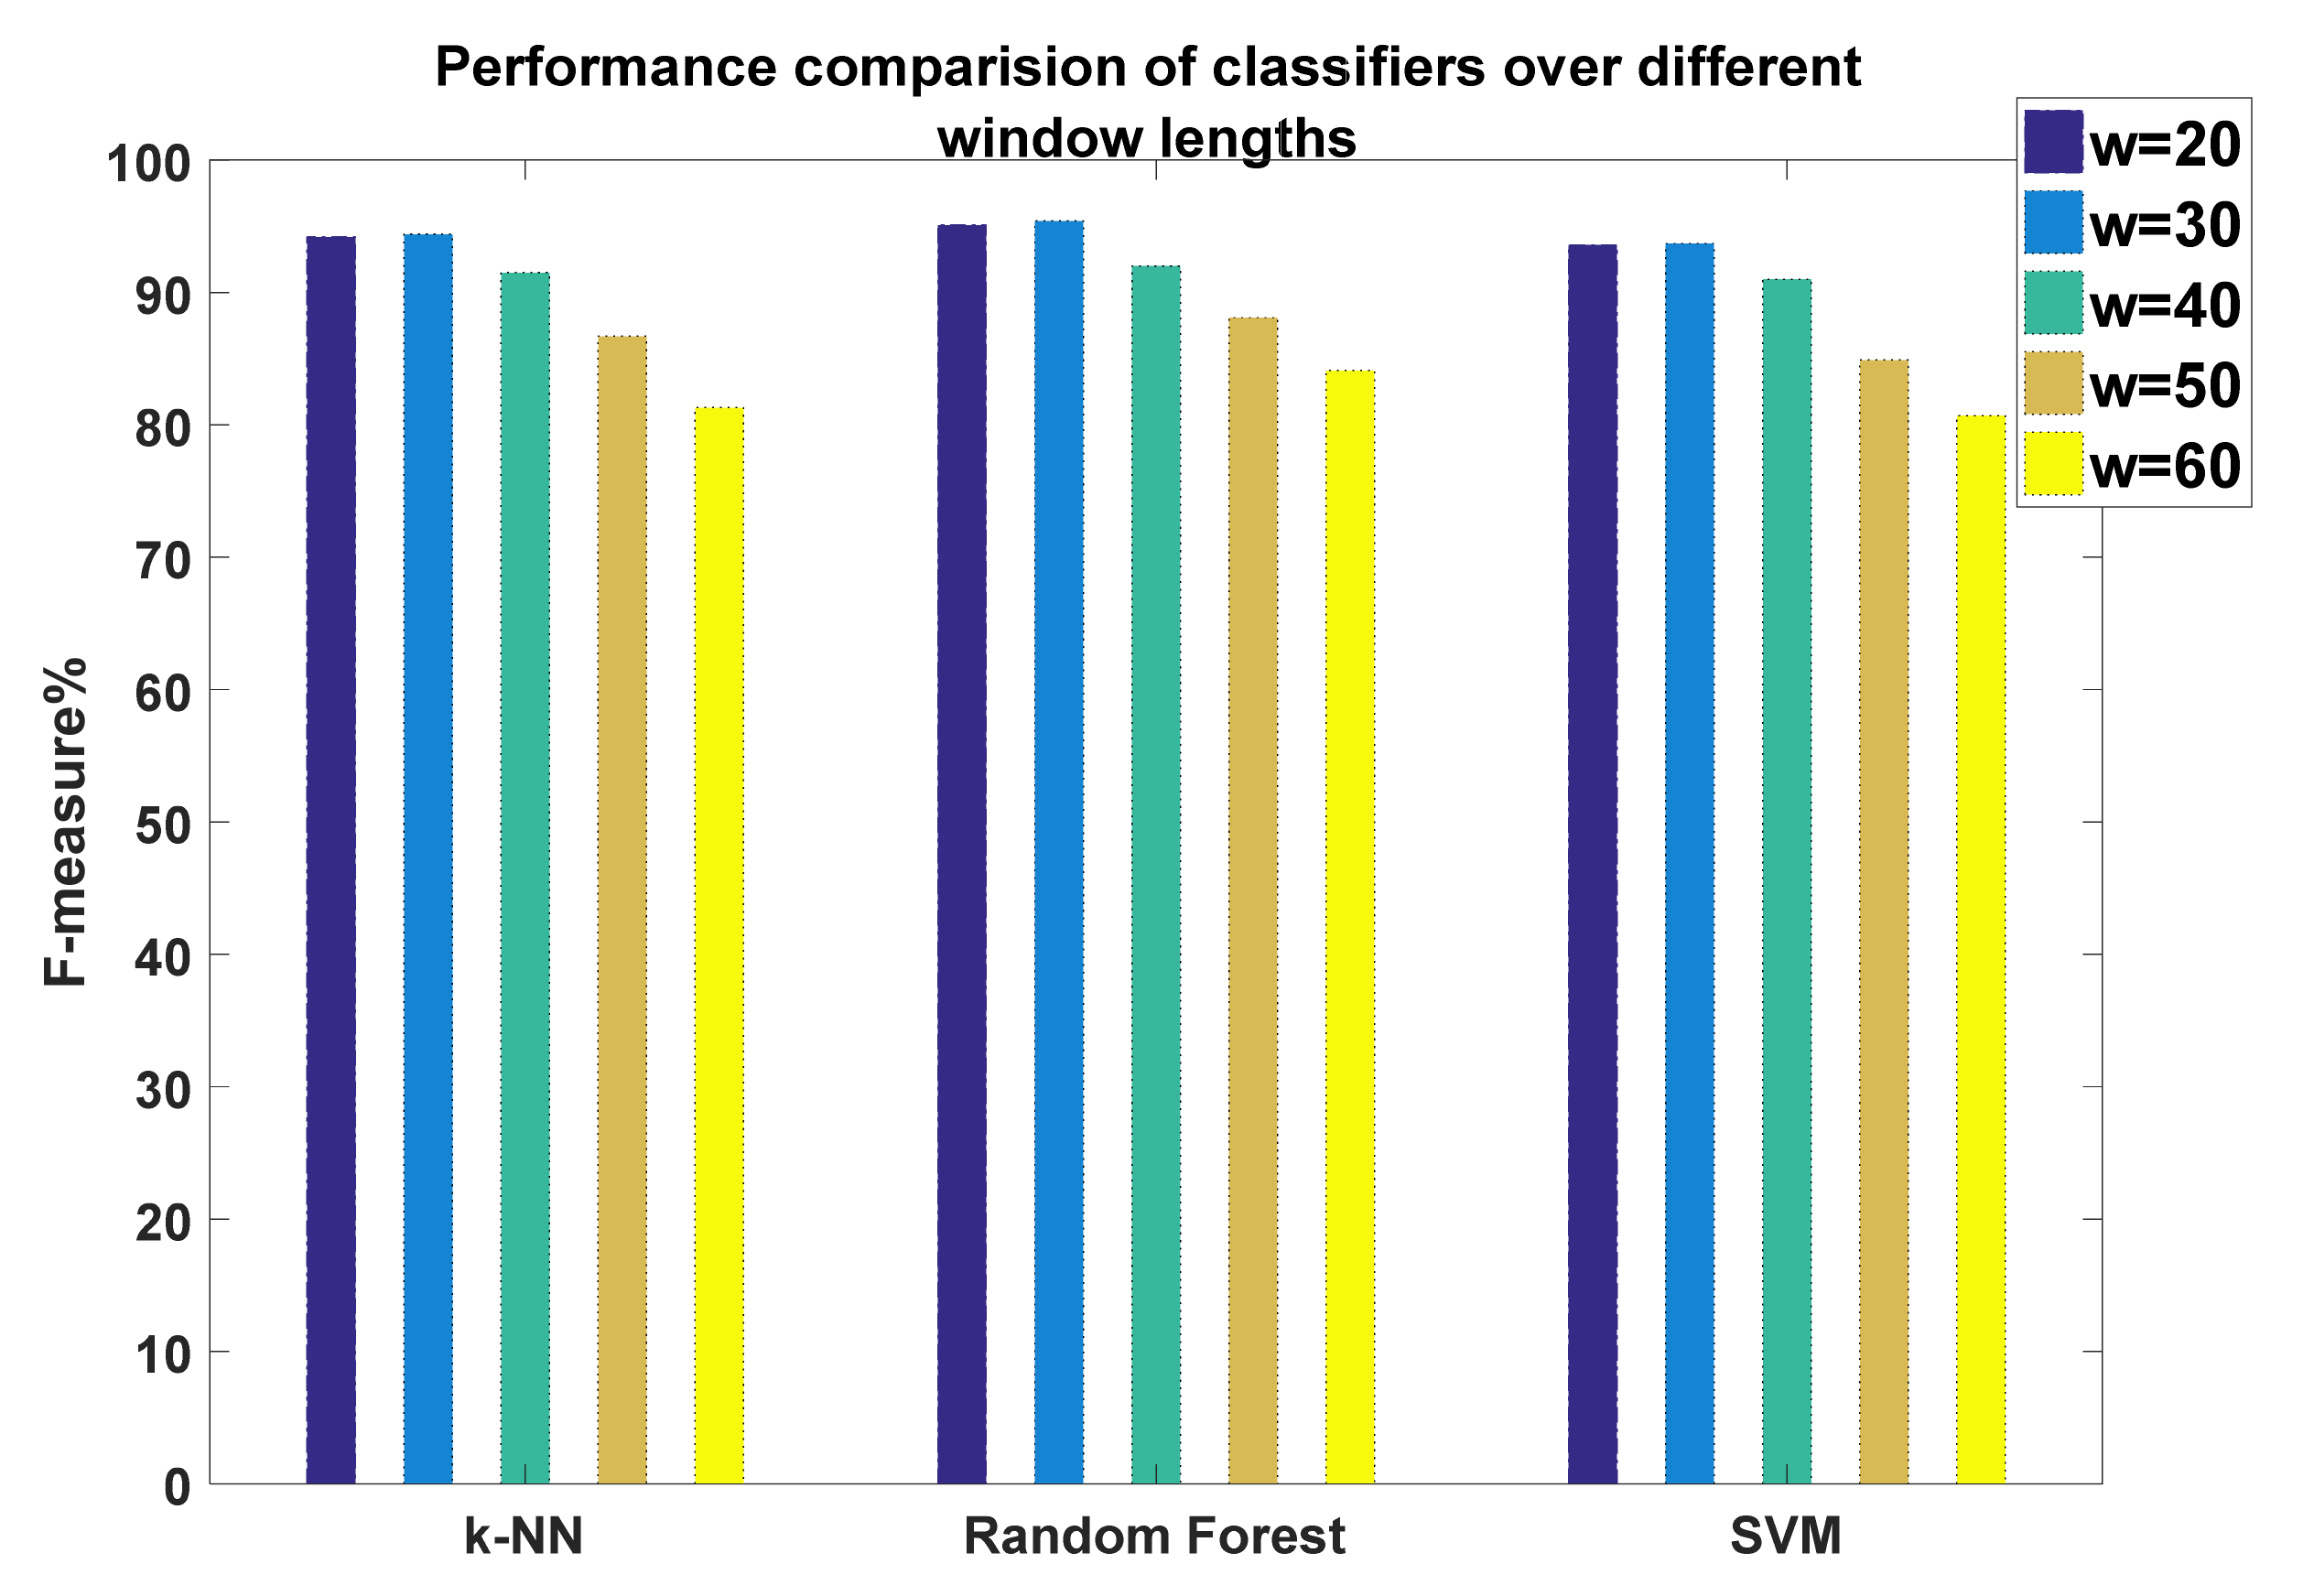
5. Experiment
6. Result and Discussion
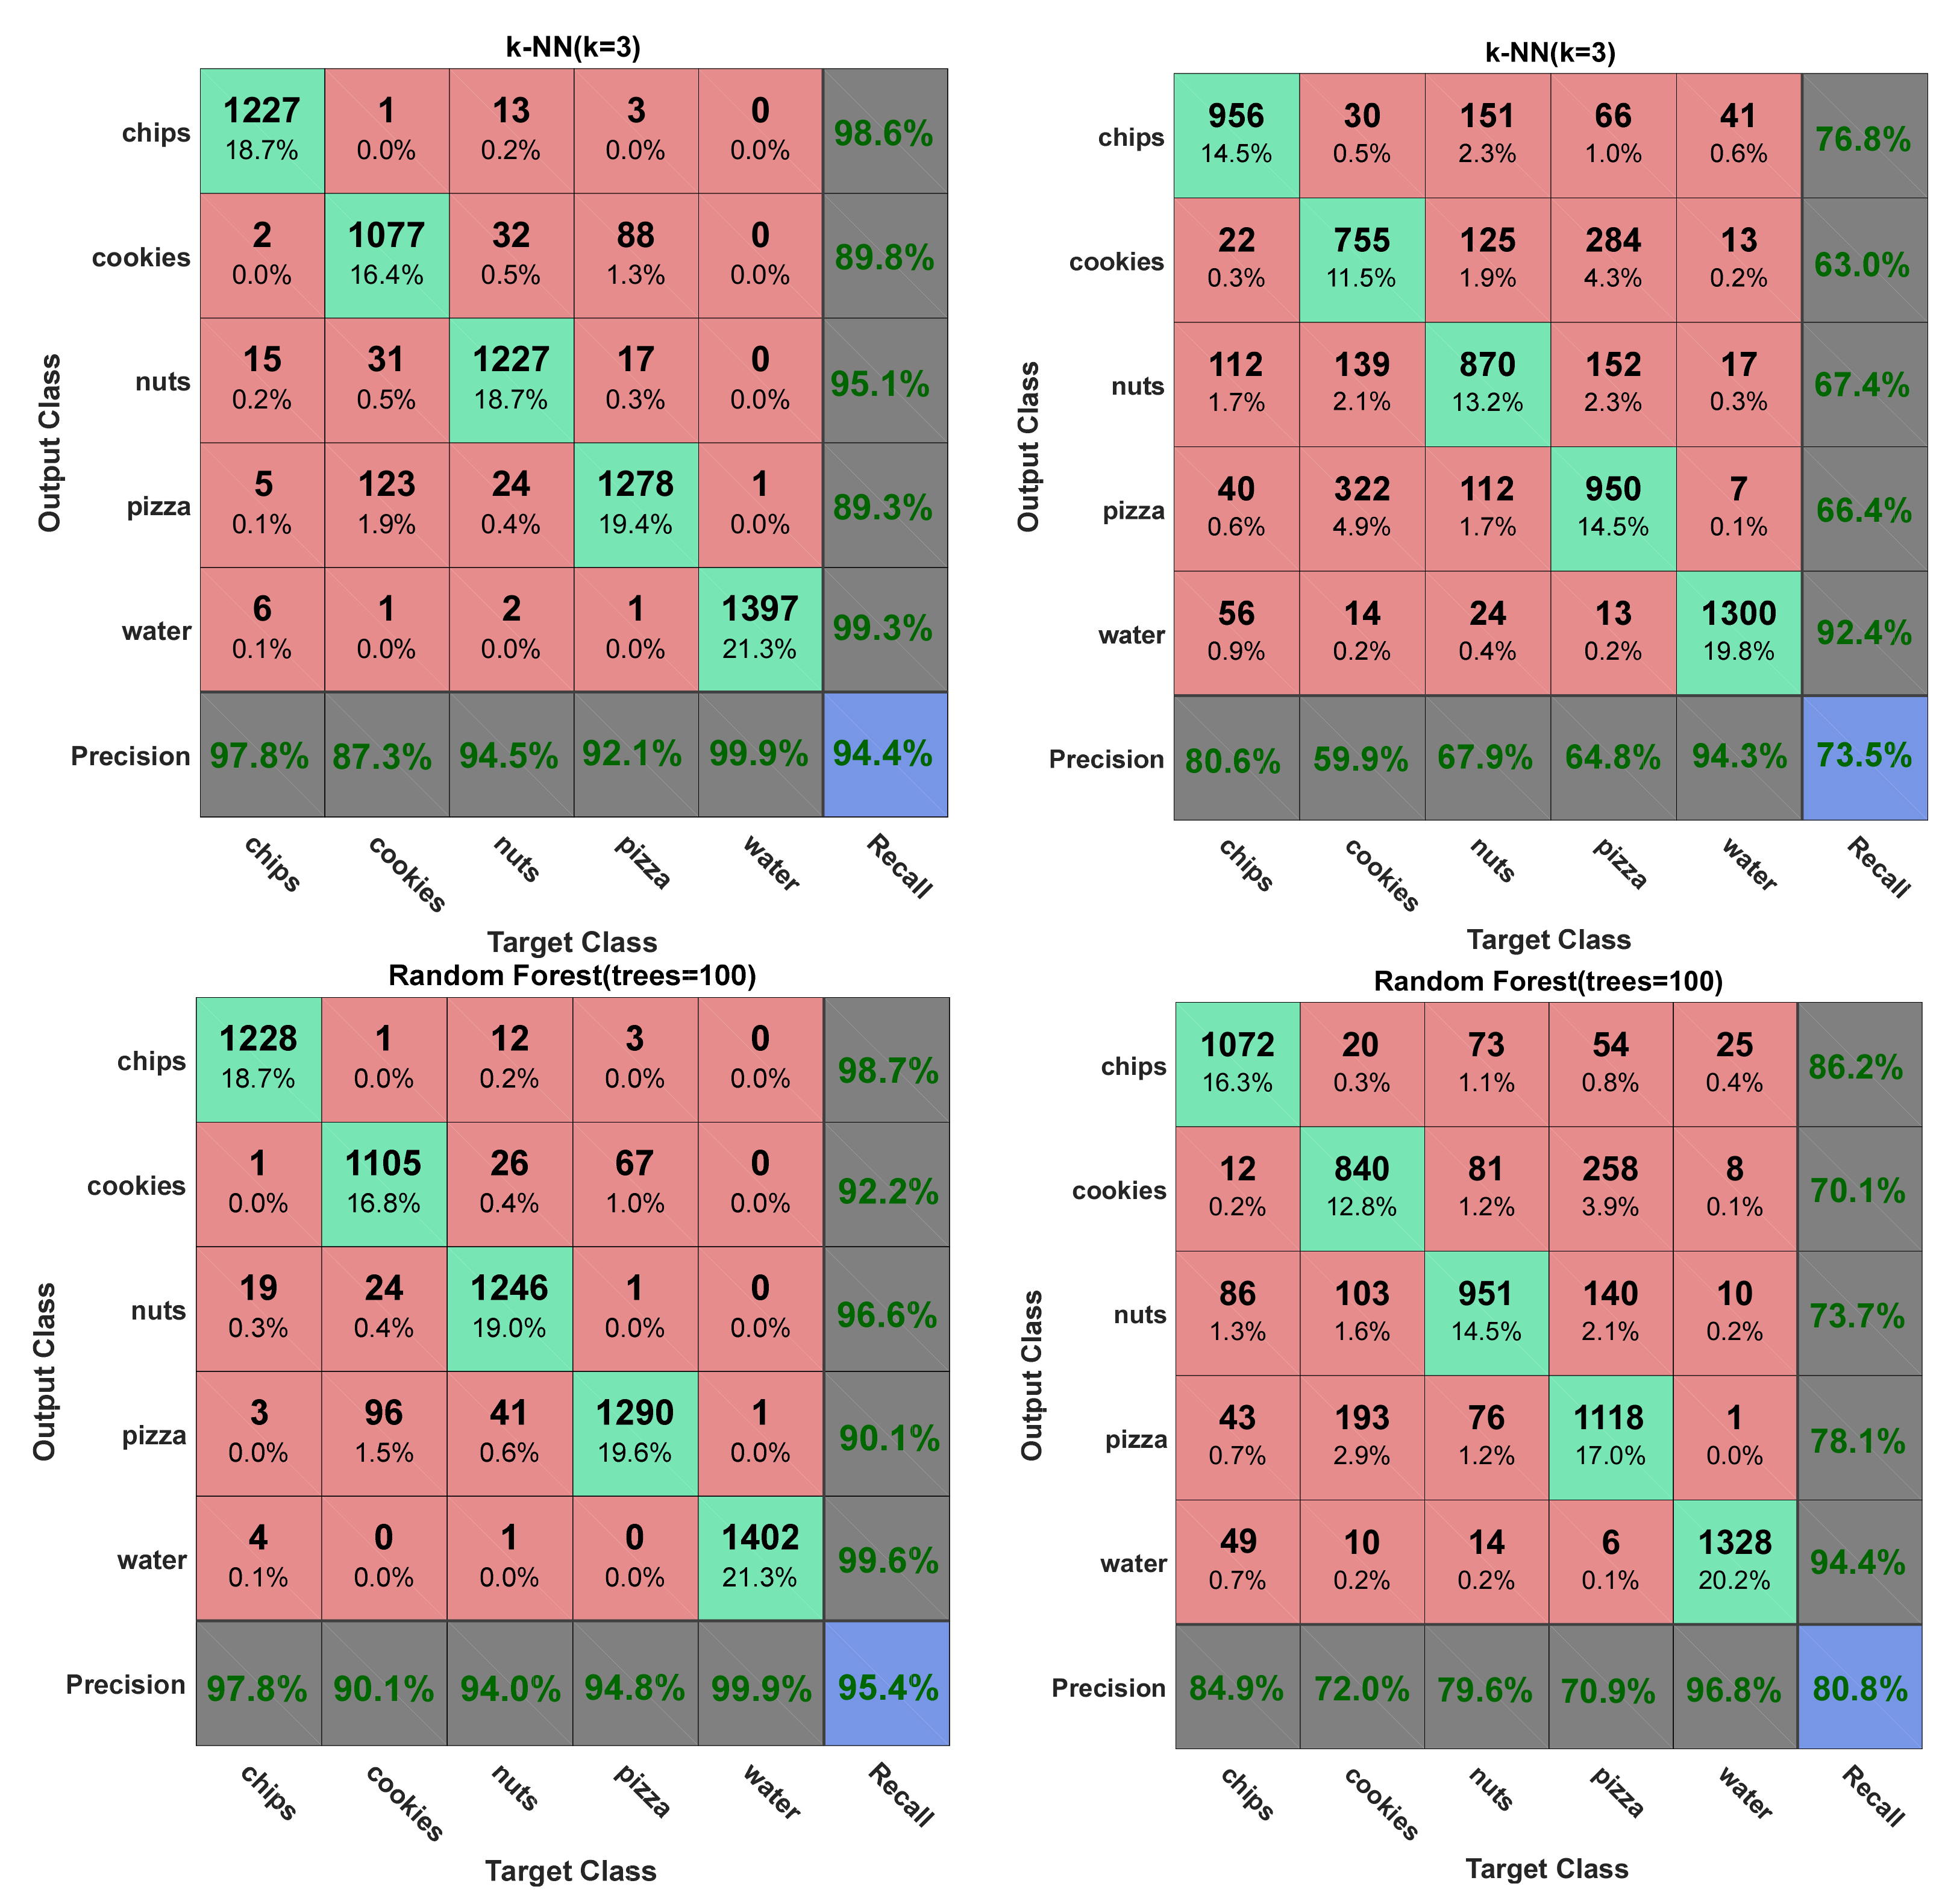
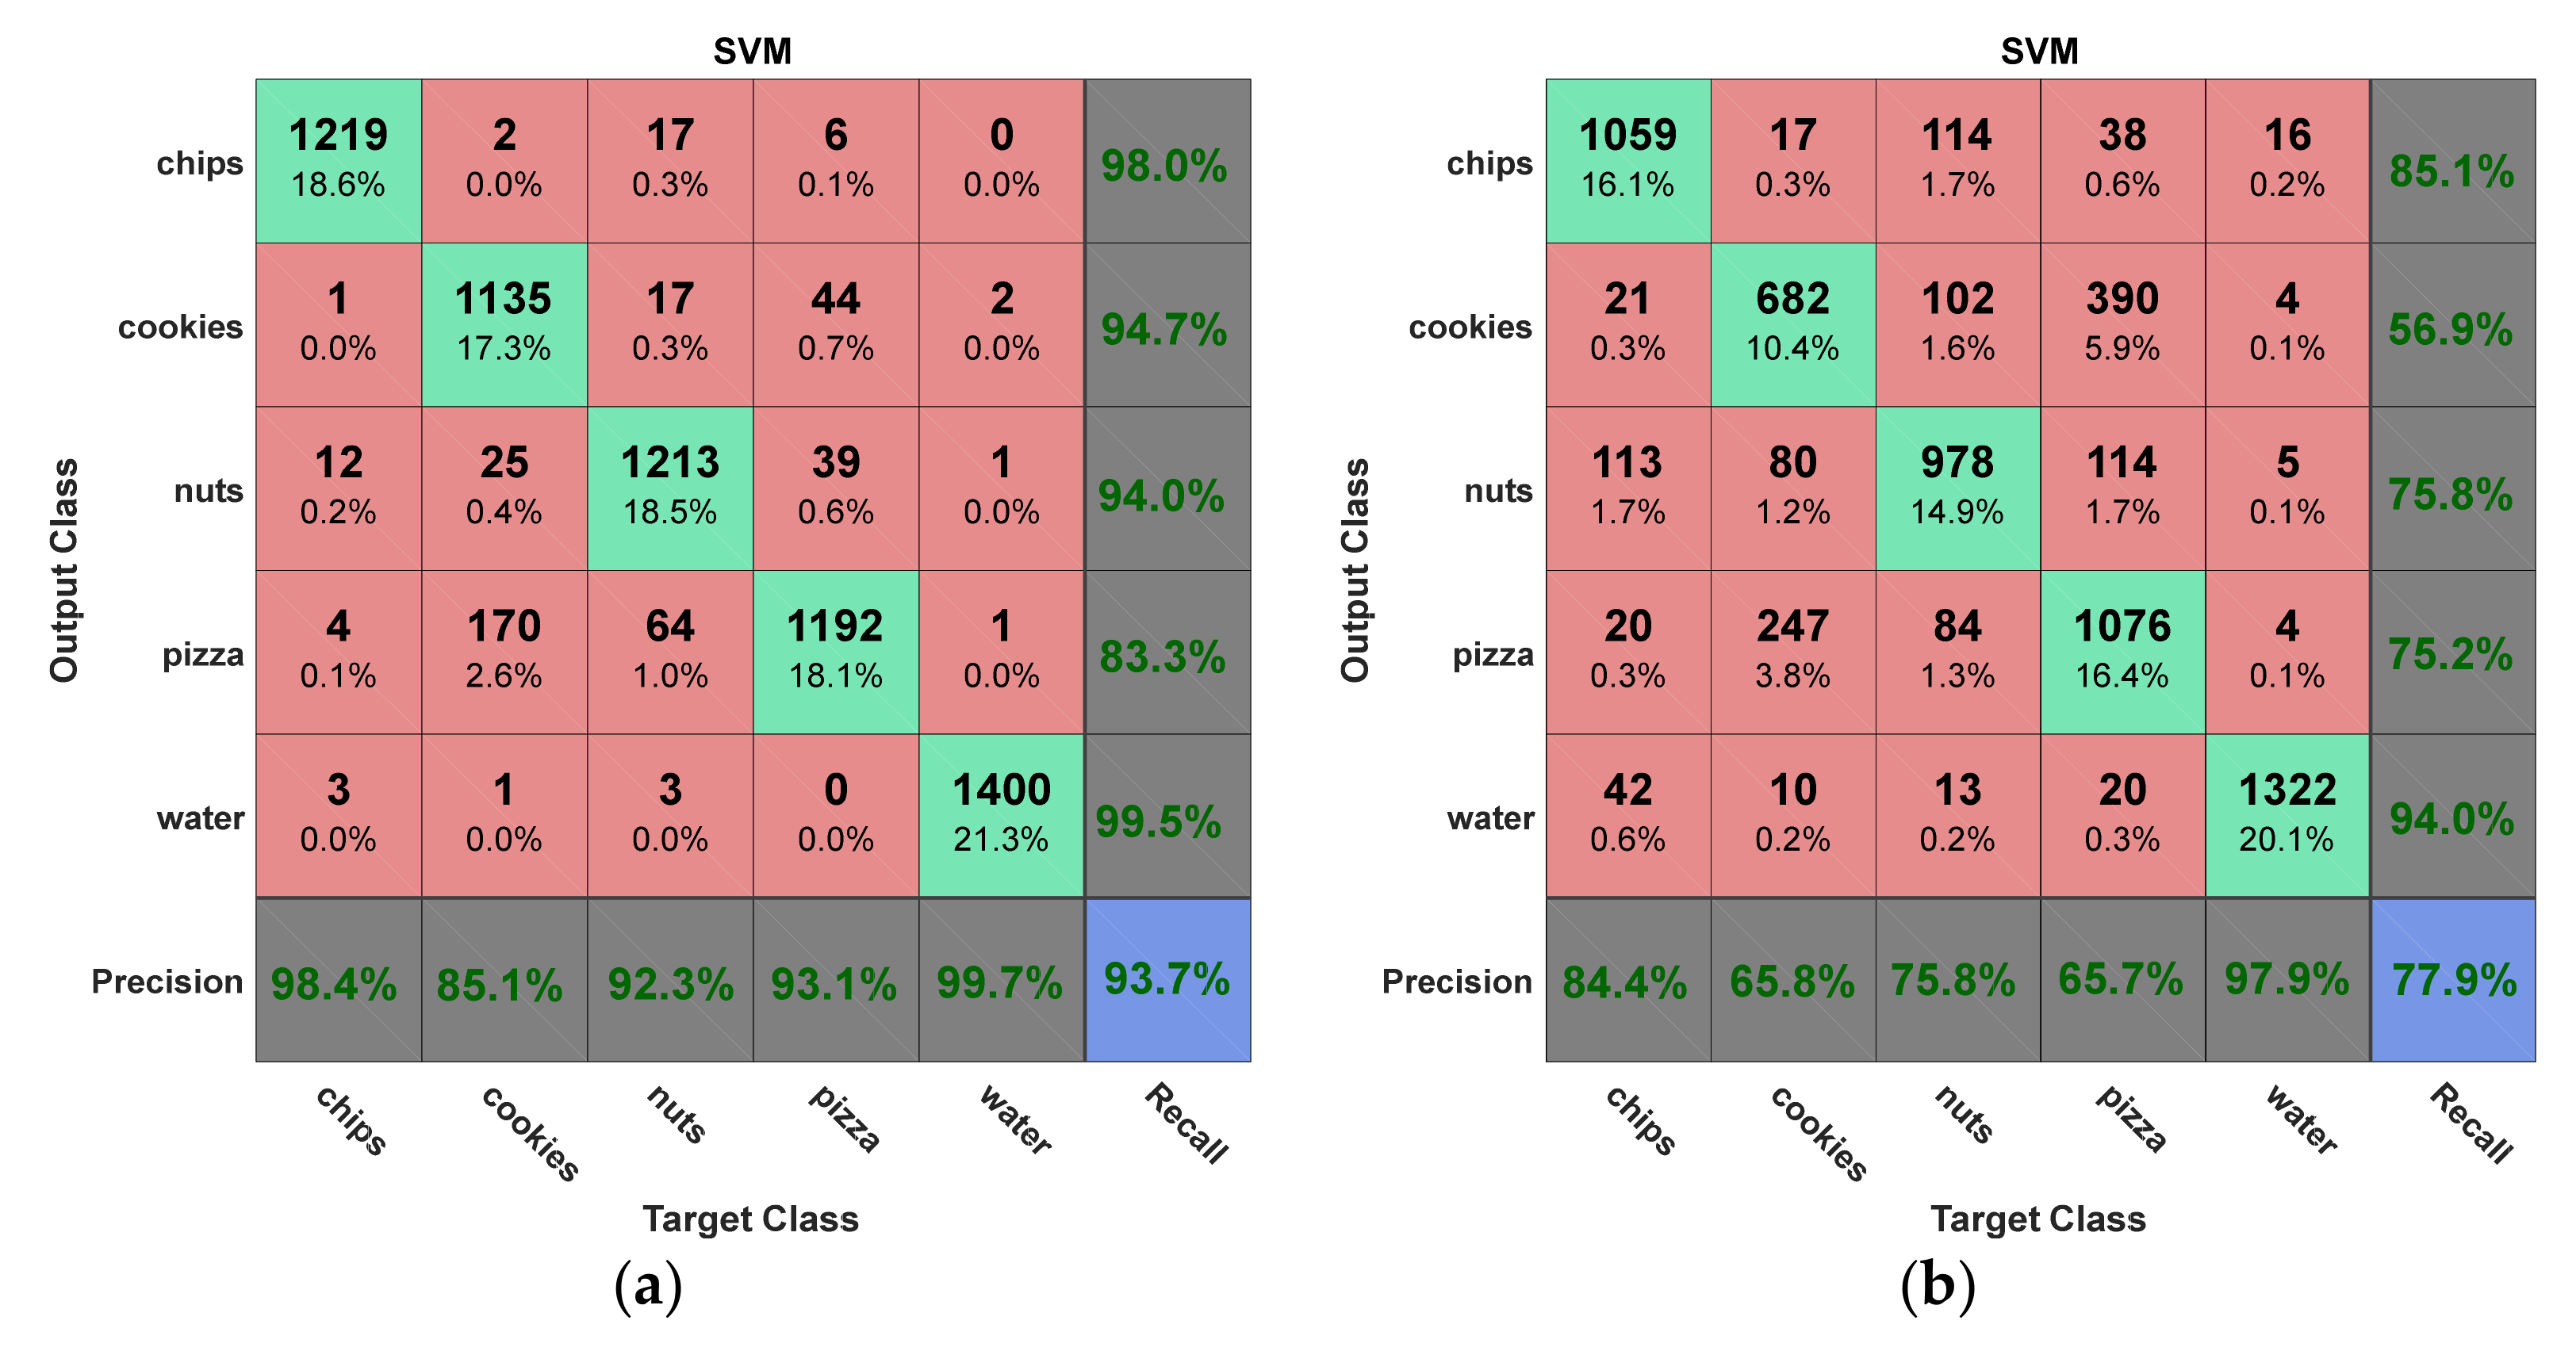
6.1. Food Classification
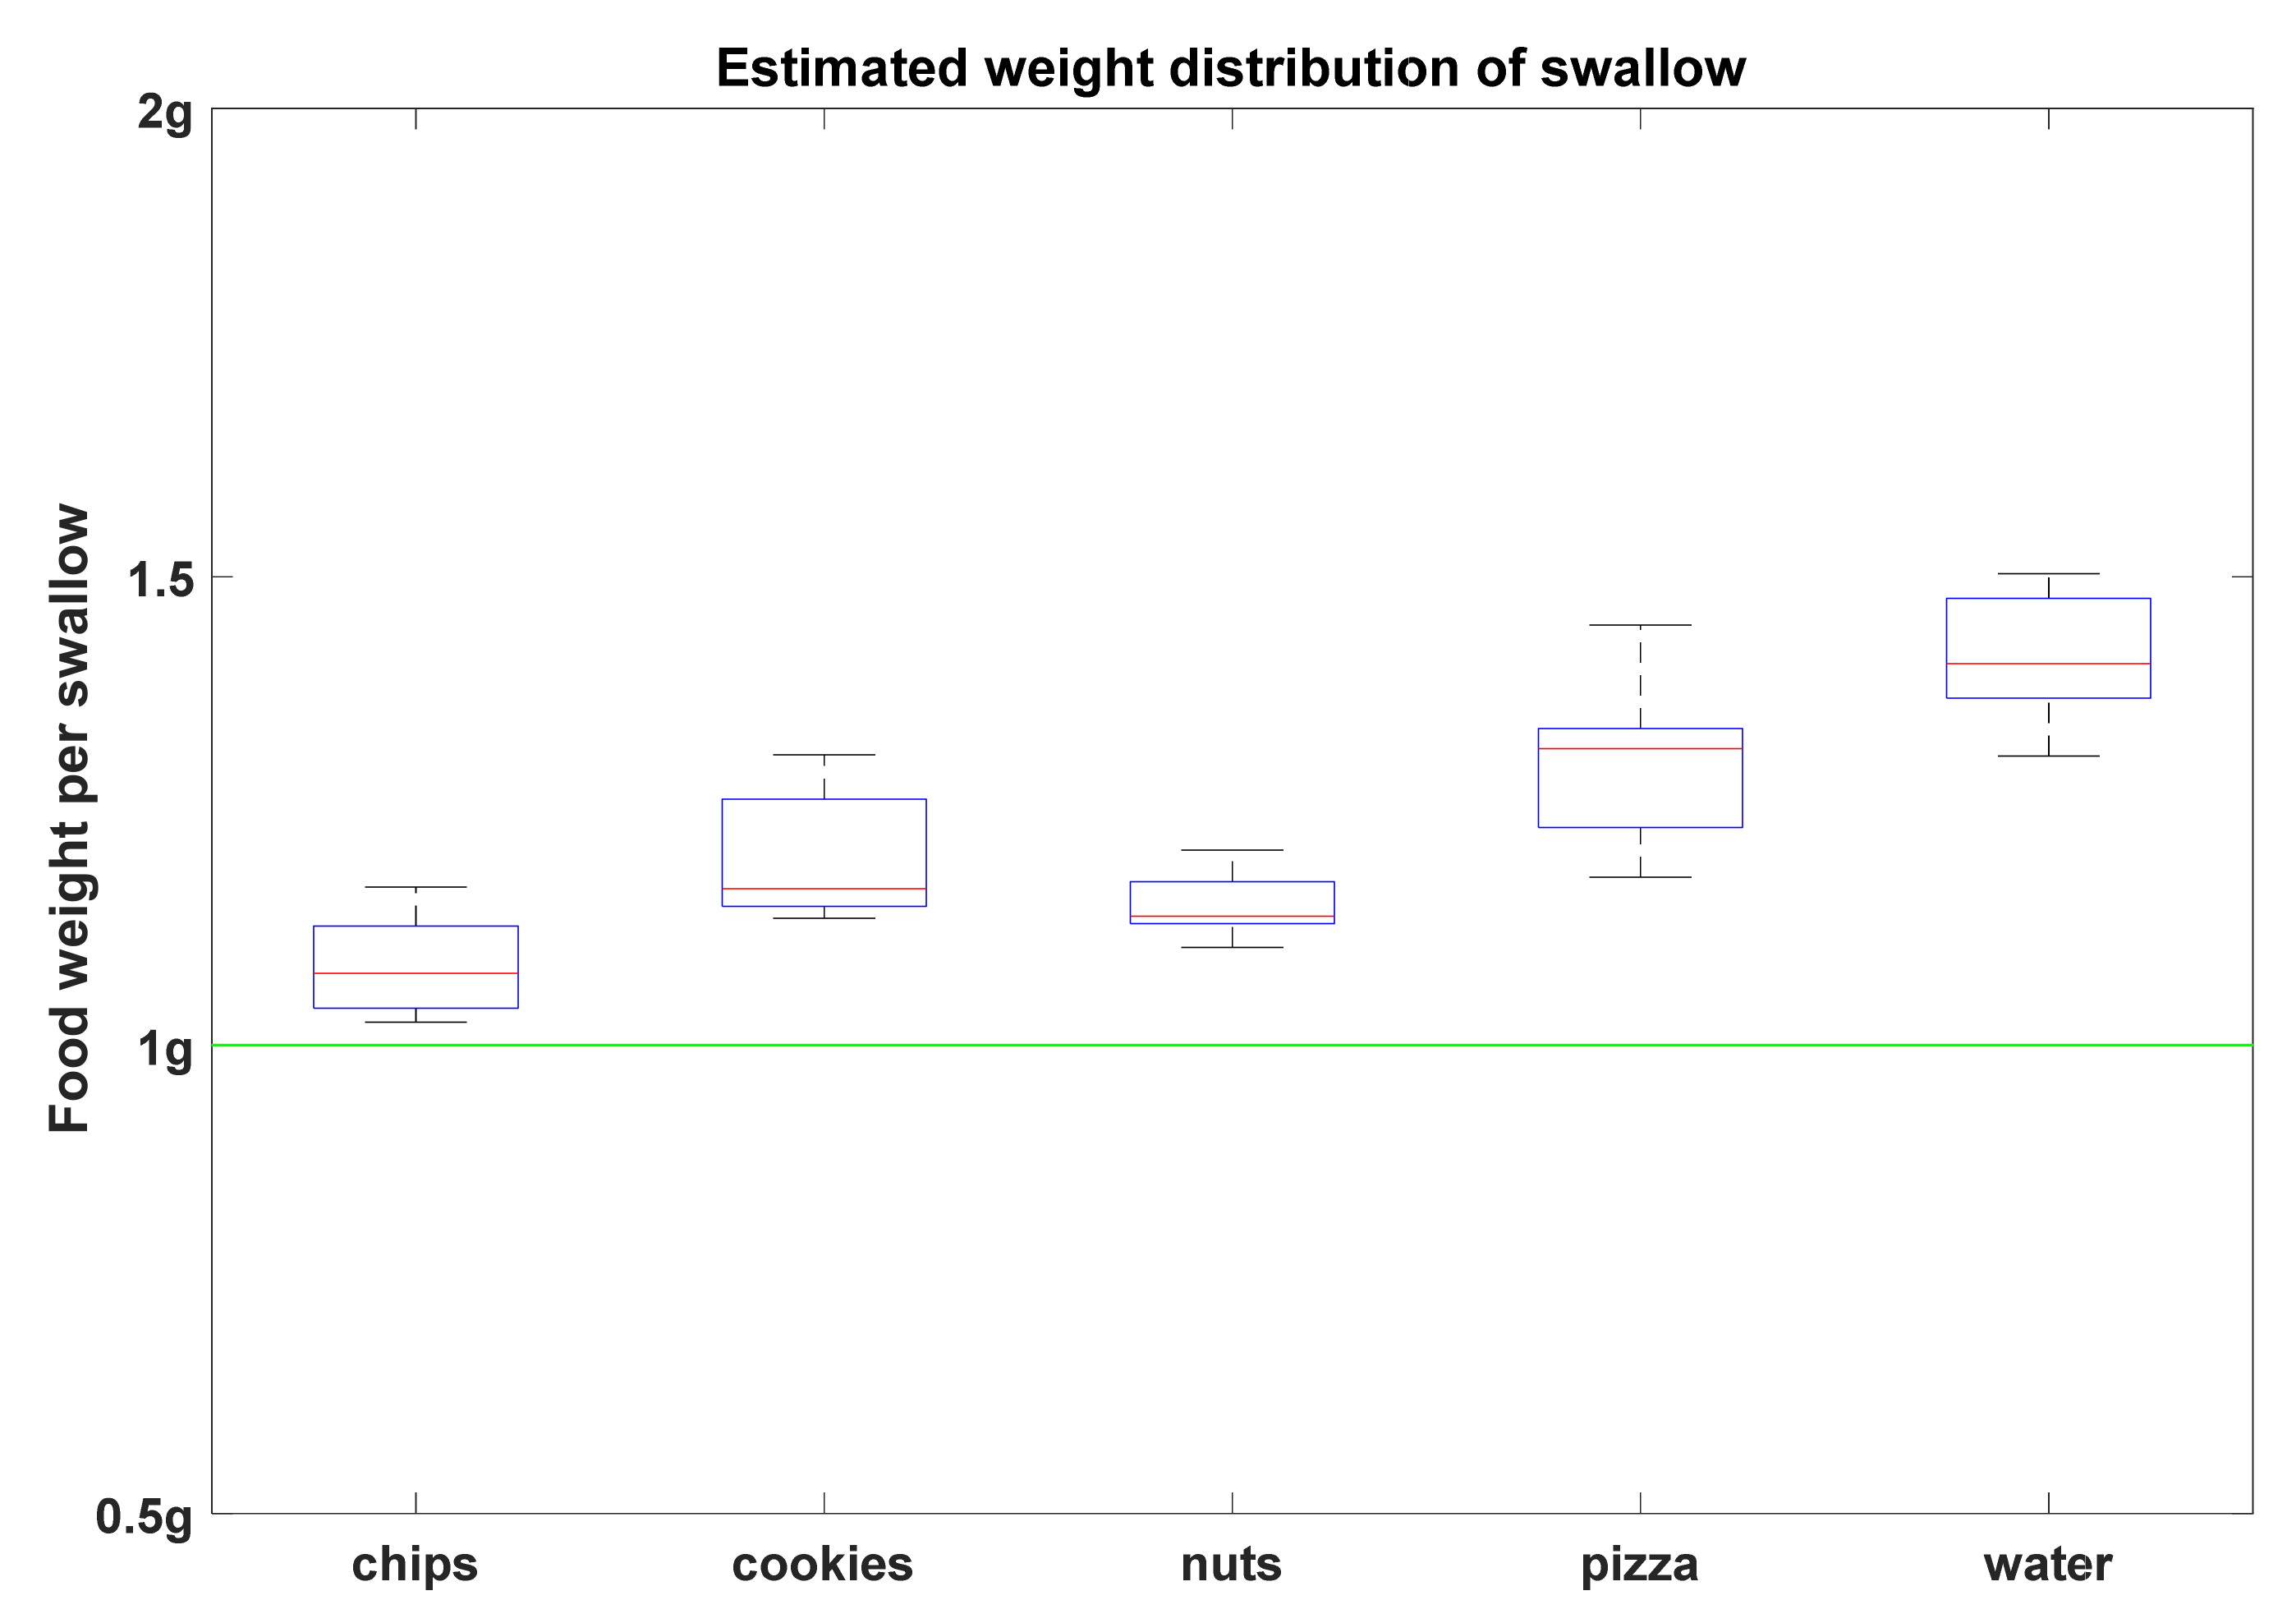
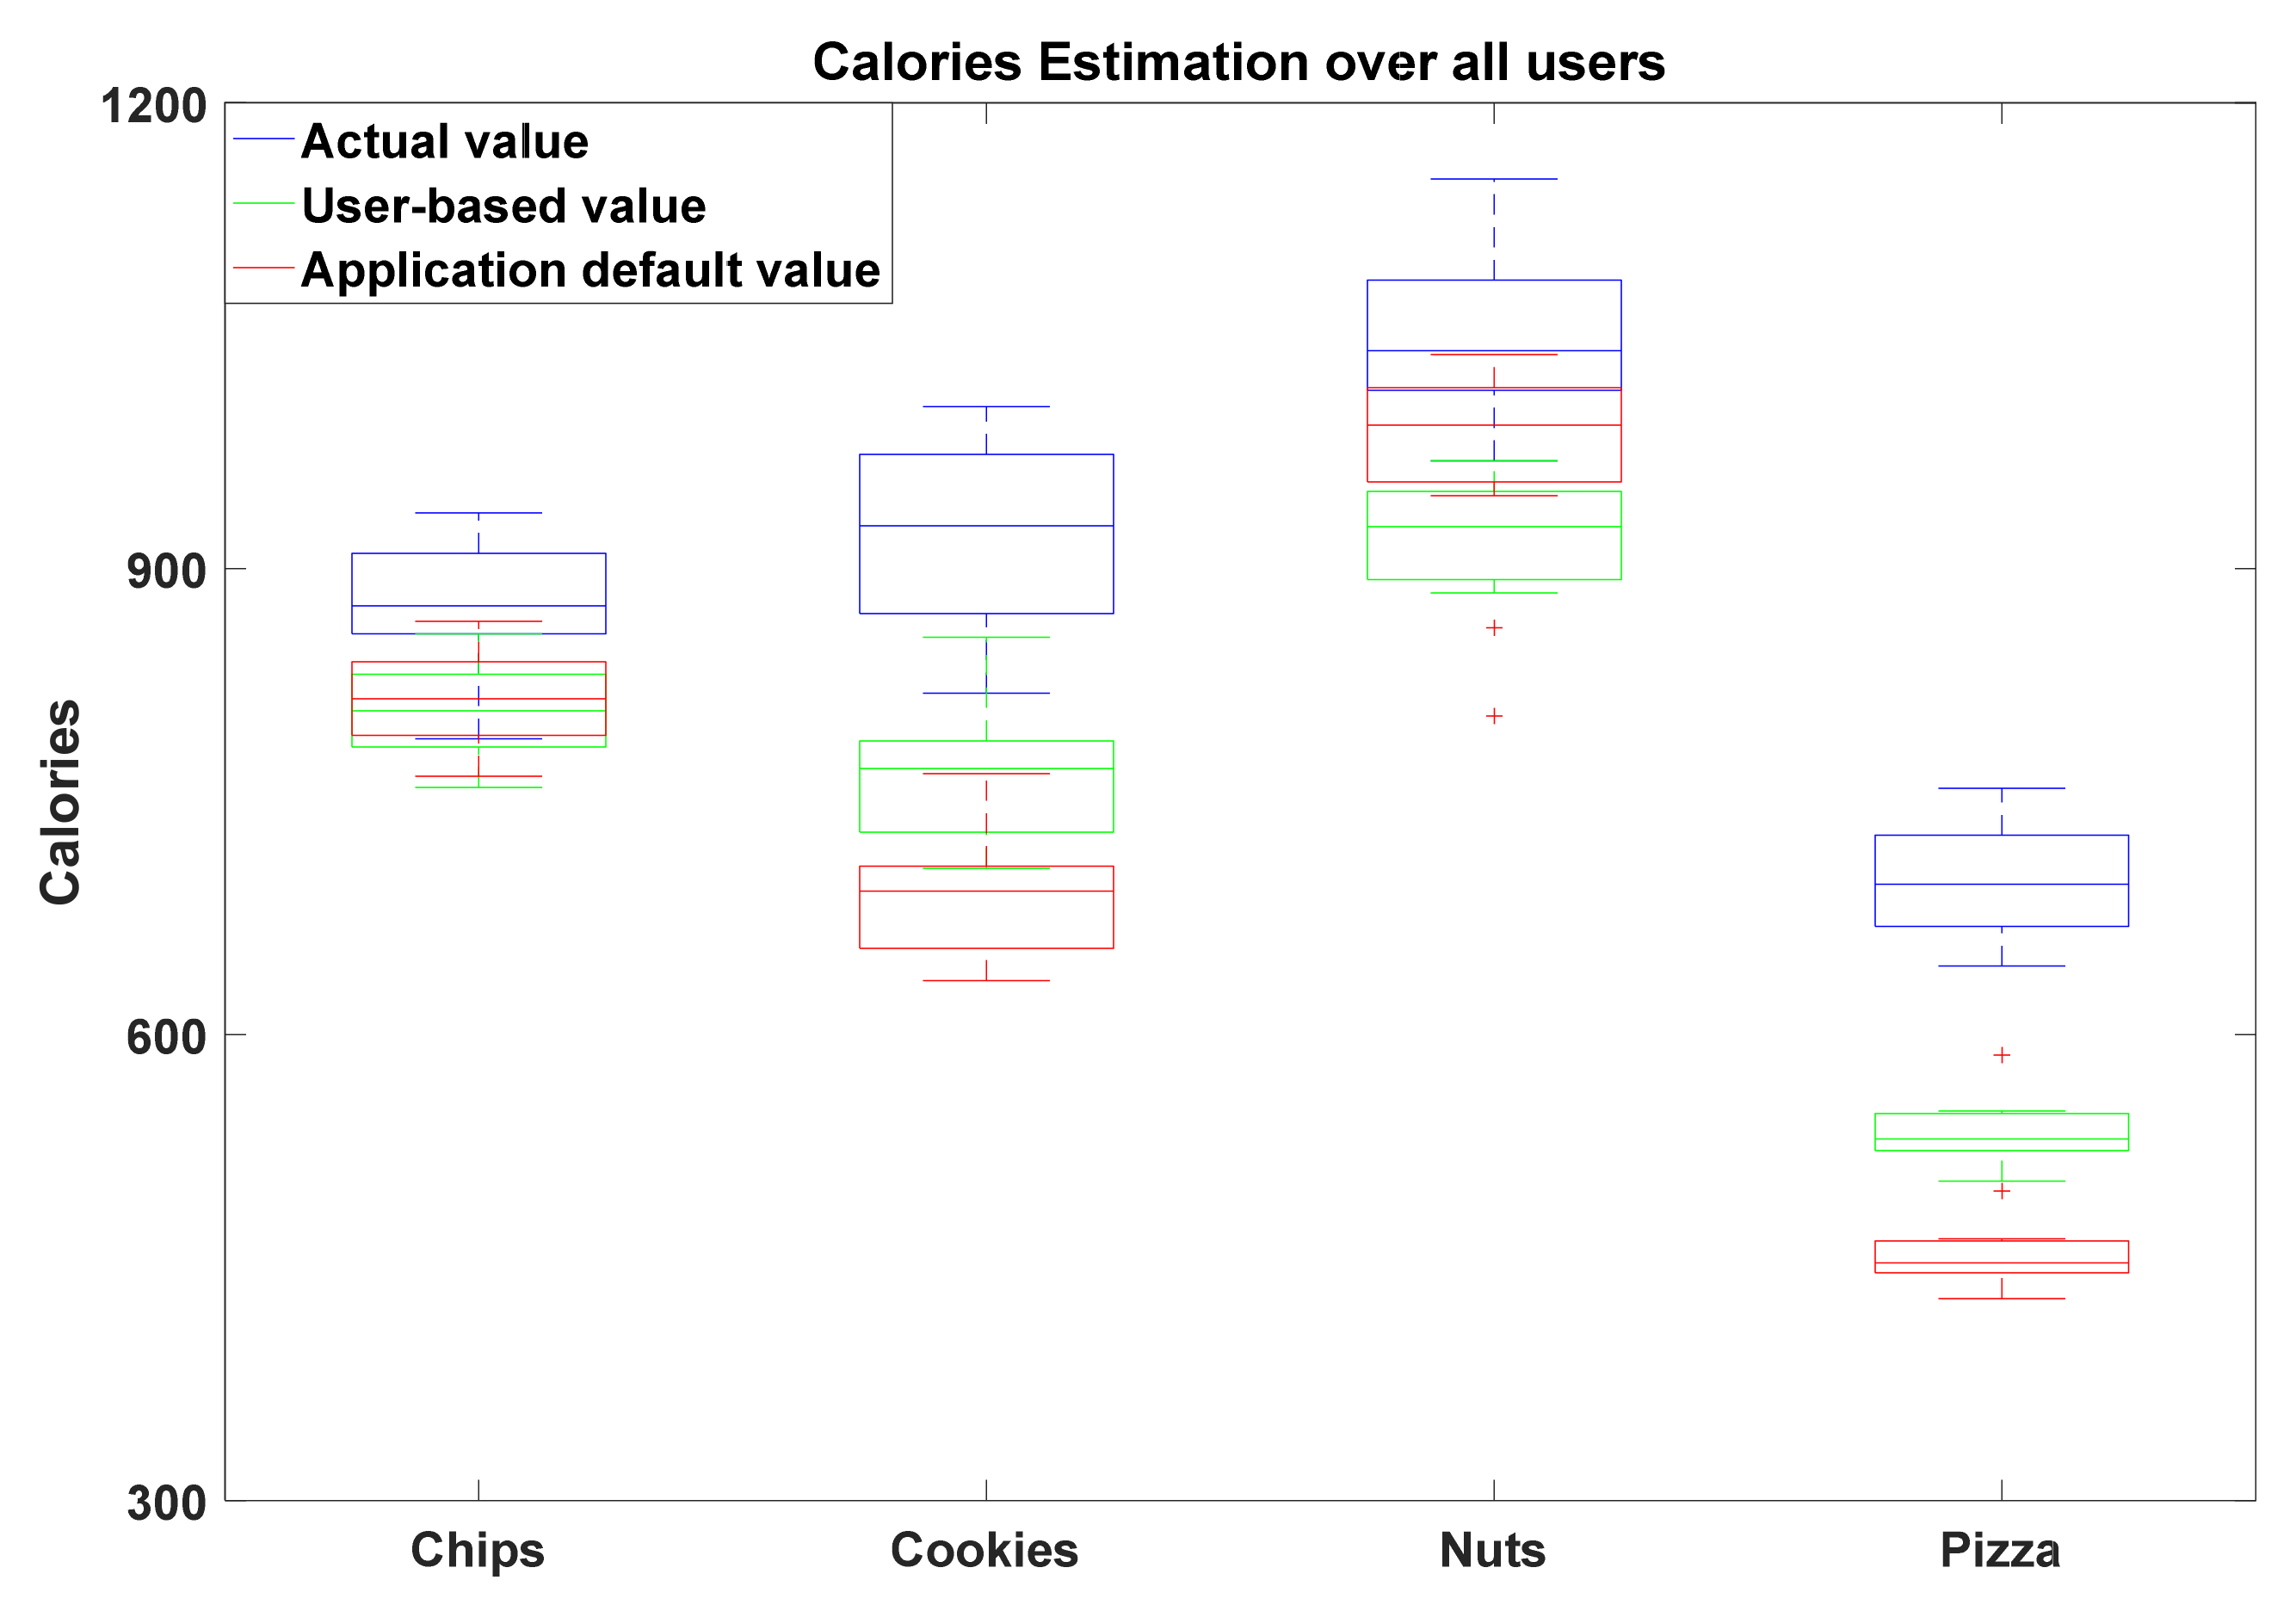
6.2. Estimation of Food Weight and Caloric Intake
7. Conclusions
Author Contributions
Funding
Informed Consent Statement
Acknowledgments
Conflicts of Interest
References
- McGuire, S. US Department of Agriculture and US Department of Health and Human Services, Dietary Guidelines for Americans, 2010. Washington, DC: US Government Printing Office, January 2011. Adv. Nutr. Int. Rev. J. 2011, 2, 293–294. [Google Scholar] [CrossRef] [Green Version]
- Bi, Y.; Lv, M.; Song, C.; Xu, W.; Guan, N.; Yi, W. AutoDietary: A wearable acoustic sensor system for food intake recognition in daily life. IEEE Sens. J. 2016, 16, 806–816. [Google Scholar] [CrossRef]
- Kalantarian, H.; Mortazavi, B.; Alshurafa, N.; Sideris, C.; Le, T.; Sarrafzadeh, M. A comparison of piezoelectric-based inertial sensing and audio-based detection of swallows. Obes. Med. 2016, 1, 6–14. [Google Scholar] [CrossRef] [Green Version]
- Kalantarian, H.; Sarrafzadeh, M. Audio-based detection and evaluation of eating behavior using the smartwatch platform. Comput. Biol. Med. 2015, 65, 1–9. [Google Scholar] [CrossRef] [PubMed] [Green Version]
- Masahiro, N.; Suzuki, K. A neck mounted interface for sensing the swallowing activity based on swallowing sound. In Proceedings of the 2011 Annual International Conference of the IEEE Engineering in Medicine and Biology Society (EMBC), Boston, MA, USA, 30 August 2011; pp. 5224–5227. [Google Scholar]
- Sazonov, E.S.; Makeyev, O.; Schuckers, S.; Lopez-Meyer, P.; Melanson, E.L.; Neuman, M.R. Automatic detection of swallowing events by acoustical means for applications of monitoring of ingestive behavior. IEEE Trans. Biomed. Eng. 2010, 57, 626–633. [Google Scholar] [CrossRef] [Green Version]
- Päßler, S.; Wolff, M.; Fischer, W.-J. Food intake monitoring: An acoustical approach to automated food intake activity detection and classification of consumed food. Physiol. Meas. 2012, 33, 1073. [Google Scholar] [CrossRef]
- Amft, O.; Kusserow, M.; Tröster, G. Bite weight prediction from acoustic recognition of chewing. IEEE Trans. Biomed. Eng. 2009, 56, 1663–1672. [Google Scholar] [CrossRef] [Green Version]
- Amft, O.; Troster, G. Methods for detection and classification of normal swallowing from muscle activation and sound. In Proceedings of the Pervasive Health Conference and Workshops, Innsbruck, Austria, 29 November–1 December 2006; pp. 1–10. [Google Scholar]
- Alshurafa, N.; Kalantarian, H.; Pourhomayoun, M.; Sarin, S.; Liu, J.J.; Sarrafzadeh, M. Non-invasive monitoring of eating behavior using spectrogram analysis in a wearable necklace. In Proceedings of the 2014 IEEE Healthcare Innovation Conference (HIC), Seattle, WA, USA, 8–10 October 2014; pp. 71–74. [Google Scholar]
- Alshurafa, N.; Kalantarian, H.; Pourhomayoun, M.; Liu, J.J.; Sarin, S.; Shahbazi, B.; Sarrafzadeh, M. Recognition of nutrition intake using time-frequency decomposition in a wearable necklace using a piezoelectric sensor. IEEE Sens. J. 2015, 15, 3909–3916. [Google Scholar] [CrossRef]
- Dong, Y.; Scisco, J.; Wilson, M.; Muth, E.; Hoover, A. Detecting periods of eating during free-living by tracking wrist motion. IEEE J. Biomed. Health Inform. 2014, 18, 1253–1260. [Google Scholar] [CrossRef]
- Kalantarian, H.; Alshurafa, N.; Le, T.; Sarrafzadeh, M. Monitoring eating habits using a piezoelectric sensor-based necklace. Comput. Biol. Med. 2015, 58, 46–55. [Google Scholar] [CrossRef]
- Dong, B.; Biswas, S. Meal-time and duration monitoring using wearable sensors. Biomed. Signal Process. Control 2017, 32, 97–109. [Google Scholar] [CrossRef]
- Dong, Y.; Hoover, A.; Muth, E. A device for detecting and counting bites of food taken by a person during eating. In Proceedings of the IEEE International Conference Bioinformatics and Biomedicine BIBM’09), Washington, DC, USA, 1–4 November 2009; pp. 265–268. [Google Scholar]
- Amft, O.; Junker, H.; Troster, G. Detection of eating and drinking arm gestures using inertial body-worn sensors. In Proceedings of the Ninth IEEE International Symposium on Wearable Computers (ISWC’05), Osaka, Japan, 18–21 October 2005; pp. 160–163. [Google Scholar]
- Amft, O.; Tröster, G. Recognition of dietary activity events using on-body sensors. Artif. Intell. Med. 2008, 42, 121–136. [Google Scholar] [CrossRef] [Green Version]
- Yao, N.; Sclabassi, R.J.; Liu, Q.; Sun, M. A video-based algorithm for food intake estimation in the study of obesity. In Proceedings of the IEEE 33rd Annual Northeast Bioengineering Conference (NEBC’07), Long Island, NY, USA, 10–11 March 2007; pp. 298–299. [Google Scholar]
- Kalantarian, H.; Alshurafa, N.; Sarrafzadeh, M. A wearable nutrition monitoring system. In Proceedings of the 2014 11th International Conference Wearable and Implantable Body Sensor Networks (BSN), Zurich, Switzerland, 16–19 July 2014; pp. 75–80. [Google Scholar]
- Shen, Y.; Salley, J.; Muth, E.; Hoover, A. Assessing the Accuracy of a Wrist Motion Tracking Method for Counting Bites Across Demographic and Food Variables. IEEE J. Biomed. Health Inform. 2017, 21, 599–606. [Google Scholar] [CrossRef] [Green Version]
- Salley, J.N.; Hoover, A.W.; Wilson, M.L.; Muth, E.R. Comparison between human and bite-based methods of estimating caloric intake. J. Acad. Nutr. Diet. 2016, 116, 1568–1577. [Google Scholar] [CrossRef] [Green Version]
- Jasper, P.W.; James, M.T.; Hoover, A.W.; Muth, E.R. Effects of Bite Count Feedback from a Wearable Device and Goal Setting on Consumption in Young Adults. J. Acad. Nutr. Diet. 2016, 116, 1785–1793. [Google Scholar] [CrossRef] [Green Version]
- Dong, Y.; Hoover, A.; Scisco, J.; Muth, E. A new method for measuring meal intake in humans via automated wrist motion tracking. Appl. Psychophysiol. Biofeedback 2012, 37, 205–215. [Google Scholar] [CrossRef]
- Scisco, J.L.; Muth, E.R.; Hoover, A.W. Examining the Utility of a Bite-Count–Based Measure of Eating Activity in Free-Living Human Beings. J. Acad. Nutr. Diet. 2014, 114, 464–469. [Google Scholar] [CrossRef]
- Ramos-Garcia, R.I.; Muth, E.R.; Gowdy, J.N.; Hoover, A.W. Improving the recognition of eating gestures using intergesture sequential dependencies. IEEE J. Biomed. Health Inform. 2015, 19, 825–831. [Google Scholar] [CrossRef]
- Mattfeld, R.S.; Muth, E.R.; Hoover, A. Measuring the consumption of individual solid and liquid bites using a table embedded scale during unrestricted eating. IEEE J. Biomed. Health Inform. 2017, 21, 1711–1718. [Google Scholar] [CrossRef]
- Zhou, B.; Cheng, J.; Sundholm, M.; Reiss, A.; Huang, W.; Amft, O.; Lukowicz, P. Smart table surface: A novel approach to pervasive dining monitoring. In Proceedings of the 2015 IEEE International Conference Pervasive Computing and Communications (PerCom), St. Louis, MO, USA, 23–27 March 2015; pp. 155–162. [Google Scholar]
- Stellar, E.; Shrager, E.E. Chews and swallows and the microstructure of eating. Am. J. Clin. Nutr. 1985, 42, 973–982. [Google Scholar] [CrossRef]
- Scisco, J.L.; Muth, E.R.; Dong, Y.; Hoover, A.W. Slowing bite-rate reduces energy intake: An application of the bite counter device. J. Am. Diet. Assoc. 2011, 111, 1231–1235. [Google Scholar] [CrossRef]
- Simblee Microcontroller. 2017. Available online: https://cdn.sparkfun.com/datasheets/IoT/Simblee/RFD77101/Datasheetv1.0.pdf (accessed on 7 March 2022).
- LDT with Crimps Vibration Sensor/Switch. 2017. Available online: http://cdn.sparkfun.com/datasheets/Sensors/ForceFlex/LDT_Series.pdf (accessed on 7 March 2022).
- Amft, O. A wearable earpad sensor for chewing monitoring. In Proceedings of the IEEE Sensors Conference, Waikoloa, HI, USA, 1–4 November 2010; pp. 222–227. [Google Scholar]
- Matsuo, K.; Palmer, J.B. Coordination of mastication, swallowing and breathing. Jpn. Dent. Sci. Rev. 2009, 45, 31–40. [Google Scholar] [CrossRef] [Green Version]
- Kononenko, I.; Šimec, E.; Robnik-Šikonja, M. Overcoming the myopia of inductive learning algorithms with RELIEFF. Appl. Intell. 1997, 7, 39–55. [Google Scholar] [CrossRef]
- Zhang, R.; Xu, L.; Yu, Z.; Shi, Y.; Mu, C.; Xu, M. Deep-irtarget: An automatic target detector in infrared imagery using dual-domain feature extraction and allocation. IEEE Trans. Multimed. 2021, 24, 1735–1749. [Google Scholar] [CrossRef]
- Zhang, R.; Yang, S.; Zhang, Q.; Xu, L.; He, Y.; Zhang, F. Graph-based few-shot learning with transformed feature propagation and optimal class allocation. Neurocomputing 2022, 470, 247–256. [Google Scholar] [CrossRef]


| Sensor Type | Description | Sensor Form | Food Classes (Number of Subjects) | Accuracy (%) |
|---|---|---|---|---|
| Piezoelectric | Refs. [10,11] presented a unique wearable system to detect neck skin movement caused by ingestion. | Necklace. | Water, hot tea, patty, chocolate, and nuts (20). | 87% [10] and 90% [11] for solid and liquid. 90% for hot and cold. 80% for solids. |
| A smartphone application-based nutrition-intake monitoring system [19] consisting of a necklace similar to [10,11] estimated meal volumes. | Necklace. | Water, sandwich, and chips (10). | 85.3% for chips, 84.5% for sandwich and 81.4% for water. | |
| Piezoelectric and Accelerometers | The wearable system of [10,11,19] was improved by the addition of an accelerometer in [13] to decrease detection of false positive swallows. | Necklace. | Sandwich, chips, and water (30). | 85.3% for chips, 84.5% for sandwich and 81.4% for water. |
| Piezoelectric or Microphones | The performance of microphone and piezoelectric for swallow detection were compared in [3], when used separately. | Necklace and throat microphone. | Chips, sandwich, and water (10). Mixed nuts, patty, and two small chocolates (20). | 91.3% and 88.5% (microphone). 75.3% and 79.4% (necklace). |
| Classification | k-NN (k = 3) | Random Forest Classifier | SVM | |
|---|---|---|---|---|
| Method Data Collection | ||||
| 20 samples (1 s) with different swallow positions | 1/4 | 92.5 | 93.2 | 92.3 |
| 2/4 | 93.7 | 93.1 | 92.0 | |
| 3/4 | 94.2 | 95.1 | 93.7 | |
| 30 samples (1.5 s) with different swallow positions | 1/5 | 93.7 | 93.8 | 92.9 |
| 2/5 | 94.1 | 94.3 | 93.0 | |
| 3/5 | 94.2 | 94.6 | 93.3 | |
| 4/5 | 94.4 | 95.4 | 93.7 |
| Description | Performance | Limitation |
|---|---|---|
| A wearable system presented in [10,11] to detect neck skin movement caused by ingestion. | Their method achieved maximum accuracy of 90% for a small number of categories. | Binary classification |
| Nutrition intake monitoring system [19] consisting of a necklace similar to [10,11] estimated meal volumes. | The system attained average accuracy of 83%. | Low food categories |
| The authors improved wearable system of [10,11], and [19] by the addition of an accelerometer to decrease detection of false positive swallows [13]. | The system attained average accuracy of 83%. | Low food categories |
| The authors compared the performance of a microphone and piezoelectric sensor for swallow detection [3], when used separately. | The microphone-based system exhibited about 10% higher performance than necklace-based system. | Low recognition accuracy for fair count of food classes. |
| Our proposed method based on piezoelectric sensor recognized suitable count of food classes by exploiting an accurate flexible sensor with better data processing technique | Our method achieved average recognition performance of 94% for five food classes | Low food classes |
Publisher’s Note: MDPI stays neutral with regard to jurisdictional claims in published maps and institutional affiliations. |
© 2022 by the authors. Licensee MDPI, Basel, Switzerland. This article is an open access article distributed under the terms and conditions of the Creative Commons Attribution (CC BY) license (https://creativecommons.org/licenses/by/4.0/).
Share and Cite
Hussain, G.; Ali Saleh Al-rimy, B.; Hussain, S.; Albarrak, A.M.; Qasem, S.N.; Ali, Z. Smart Piezoelectric-Based Wearable System for Calorie Intake Estimation Using Machine Learning. Appl. Sci. 2022, 12, 6135. https://doi.org/10.3390/app12126135
Hussain G, Ali Saleh Al-rimy B, Hussain S, Albarrak AM, Qasem SN, Ali Z. Smart Piezoelectric-Based Wearable System for Calorie Intake Estimation Using Machine Learning. Applied Sciences. 2022; 12(12):6135. https://doi.org/10.3390/app12126135
Chicago/Turabian StyleHussain, Ghulam, Bander Ali Saleh Al-rimy, Saddam Hussain, Abdullah M. Albarrak, Sultan Noman Qasem, and Zeeshan Ali. 2022. "Smart Piezoelectric-Based Wearable System for Calorie Intake Estimation Using Machine Learning" Applied Sciences 12, no. 12: 6135. https://doi.org/10.3390/app12126135