Article

Study of the Healing Effect of Concrete with Supplementary Cementitious Materials after Early-Age Damage by Acoustic Emission Technique

1
School of Landscape Architecture, Zhejiang Agriculture and Forestry University, Hangzhou 311300, China
2
College of Civil Engineering and Architecture, Zhejiang University of Technology, Hangzhou 310034, China
3
College of Civil Engineering and Architecture, Zhejiang University, Hangzhou 310058, China
*
Author to whom correspondence should be addressed.
Appl. Sci. 2022, 12(12), 5871; https://doi.org/10.3390/app12125871
Submission received: 2 May 2022 / Revised: 3 June 2022 / Accepted: 3 June 2022 / Published: 9 June 2022

Abstract

:
The study on the influence of early age damage of concrete on its long-term strength development is of great importance. In this work, 102 concrete cubes with and without supplementary cementitious materials (SCMs) were prepared. The pre-loading with loading degrees of 20%, 50%, and 80% of the corresponding compressive strength at 3-, 7-, 14-, and 28 d age was applied to the concrete samples. Then, concrete samples were further cured to 270 d, and the compressive strength was tested by the uniaxial compression test. The acoustic emission signals during the compressive strength test were collected. It is found that the pozzolanic reaction healed the damage caused by the early age damage, and the compressive strength of concrete with the incorporation of SCMs at 270 d age after pre-loading was higher than that of ordinary concrete without SCMs. The peak frequency of the uniaxial compression acoustic emission of concrete can be divided into four frequency intervals to correspond to different damage mechanisms of concrete, namely: interval I (12 ± 5 kHz), interval II (38 ± 5 kHz), interval III (171 ± 5 kHz), interval IV (259 ± 5 kHz).

1. Introduction

The progress of modern construction methods and technology requires shortening project construction time as much as possible to ensure construction quality, which requires that the concrete can bear a certain external load in the early stage. Thus, some micropores and microcracks are often produced at early age load-bearing process [1,2]. The incorporation of supplementary cementitious materials (SCMs) has been widely used in the concrete community to improve performance durability [3,4]. Thus, the study on the influence of early age damage of concrete on its long-term strength development with the incorporation of SCMs is of great importance in durability prediction.
The acoustic emission (AE) method has been widely used to study the internal damage to concrete structures and materials [5,6]. The characteristic of real-time monitoring of acoustic emission technique can evaluate the material performance or structural integrity by analyzing the elastic wave signals. Thus, compared to other non-destructive testing (NDT) methods, such as digital imaging technology [7], ultrasound method [8], electrical resistivity [9,10,11], and computed tomography scanning method [12], the acoustic emission method is more convenient in data collection and analysis. In recent years, the acoustic emission method has developed considerably. Prosser [13] introduced a promising acoustic emission model with good noise control performance. Suzuki and Shimamoto [14] studied the acoustic emission signals on core drilling samples. They found that AE monitoring in the core tests is to be a useful method for the damage estimation of concrete. Gu et al. [15] studied the acoustic emission signals during the uniaxial compression tests on mortars with different mixtures. It was found that the damage constitutive model under uniaxial compression tests accurately reflected the strength and deformation of mortar under different loading rates. Holan et al. [16] studied the uniaxial compressive strength of air-entrained concrete after high-temperature exposure by acoustic emission method. The results indicated that the characteristics of AE event counts during the deformation and failure of concrete samples are basically the same as those of the AE energy.
The influence of early age damage on the long-term compressive strength of concrete structures has not been fully understood. On the one hand, the initiation and propagation of microcracks in concrete in the early age pre-loading process might be resolved in the following curing process [17,18,19]. Thus, the long-term strength might not be influenced. However, if the early age damage exceeds the damage threshold, the microcracks might not be effectively cured. As a result, the long-term compressive strength might be lower than expected. The addition of supplementary cementitious materials (SCMs) to concrete is an effective method of addressing the early age damage issue since the pozzolanic reaction between SCMs and the hydration products can generate calcium silicate hydrate (C-S-H) products which can heal the microcracks. Sahmaran et al. [20] studied the healing capacity of cementitious composites with different SCMs. The results showed that incorporating SCMs, the microscale pore structures, and the macroscale durability performances of concrete composites showed the same properties as the concrete without early age pre-loading. Zhang et al. [21] studied the mechanical properties and self-healing behavior of micro-cracked engineered cementitious composite (ECC) with different dosages of SCMs. It was found that increasing fly ash content results in a higher ECC ductility. Besides, the crack width of ECC with more fly ash content is reduced, which can be attributed to the self-healing effect.
In this work, the curing effect of concrete with SCMs after early age damage was studied by acoustic emission technique. Concrete samples with and without SCMs were pre-loaded at different ages up to 28 d with different damage degrees. Then the samples were further cured to 270 d, and the compressive strength was tested by the uniaxial compression method. The acoustic emission signals during the uniaxial compression tests were collected and analyzed to interpret the healing effect of concrete after pre-loading.

2. Methodology

2.1. Materials and Mixtures

Two mixtures with a water-to-binder ratio (w/b) of 0.47 are prepared. The details of mixture compositions are shown in Table 1. The mixtures are given by the field projects that sponsored this work as appreciated in acknowledgment. Ordinary Portland cement is the only binder for mixture A. Class C fly ash and slag are used to replace part of the cement for mixture B. The replacements of fly ash and slag are 15% and 20%, respectively. Gravels of 4.75–31.5 mm are used as coarse aggregate, and natural river sands with a fine modulus of 2.3–2.6 are used as fine aggregate.

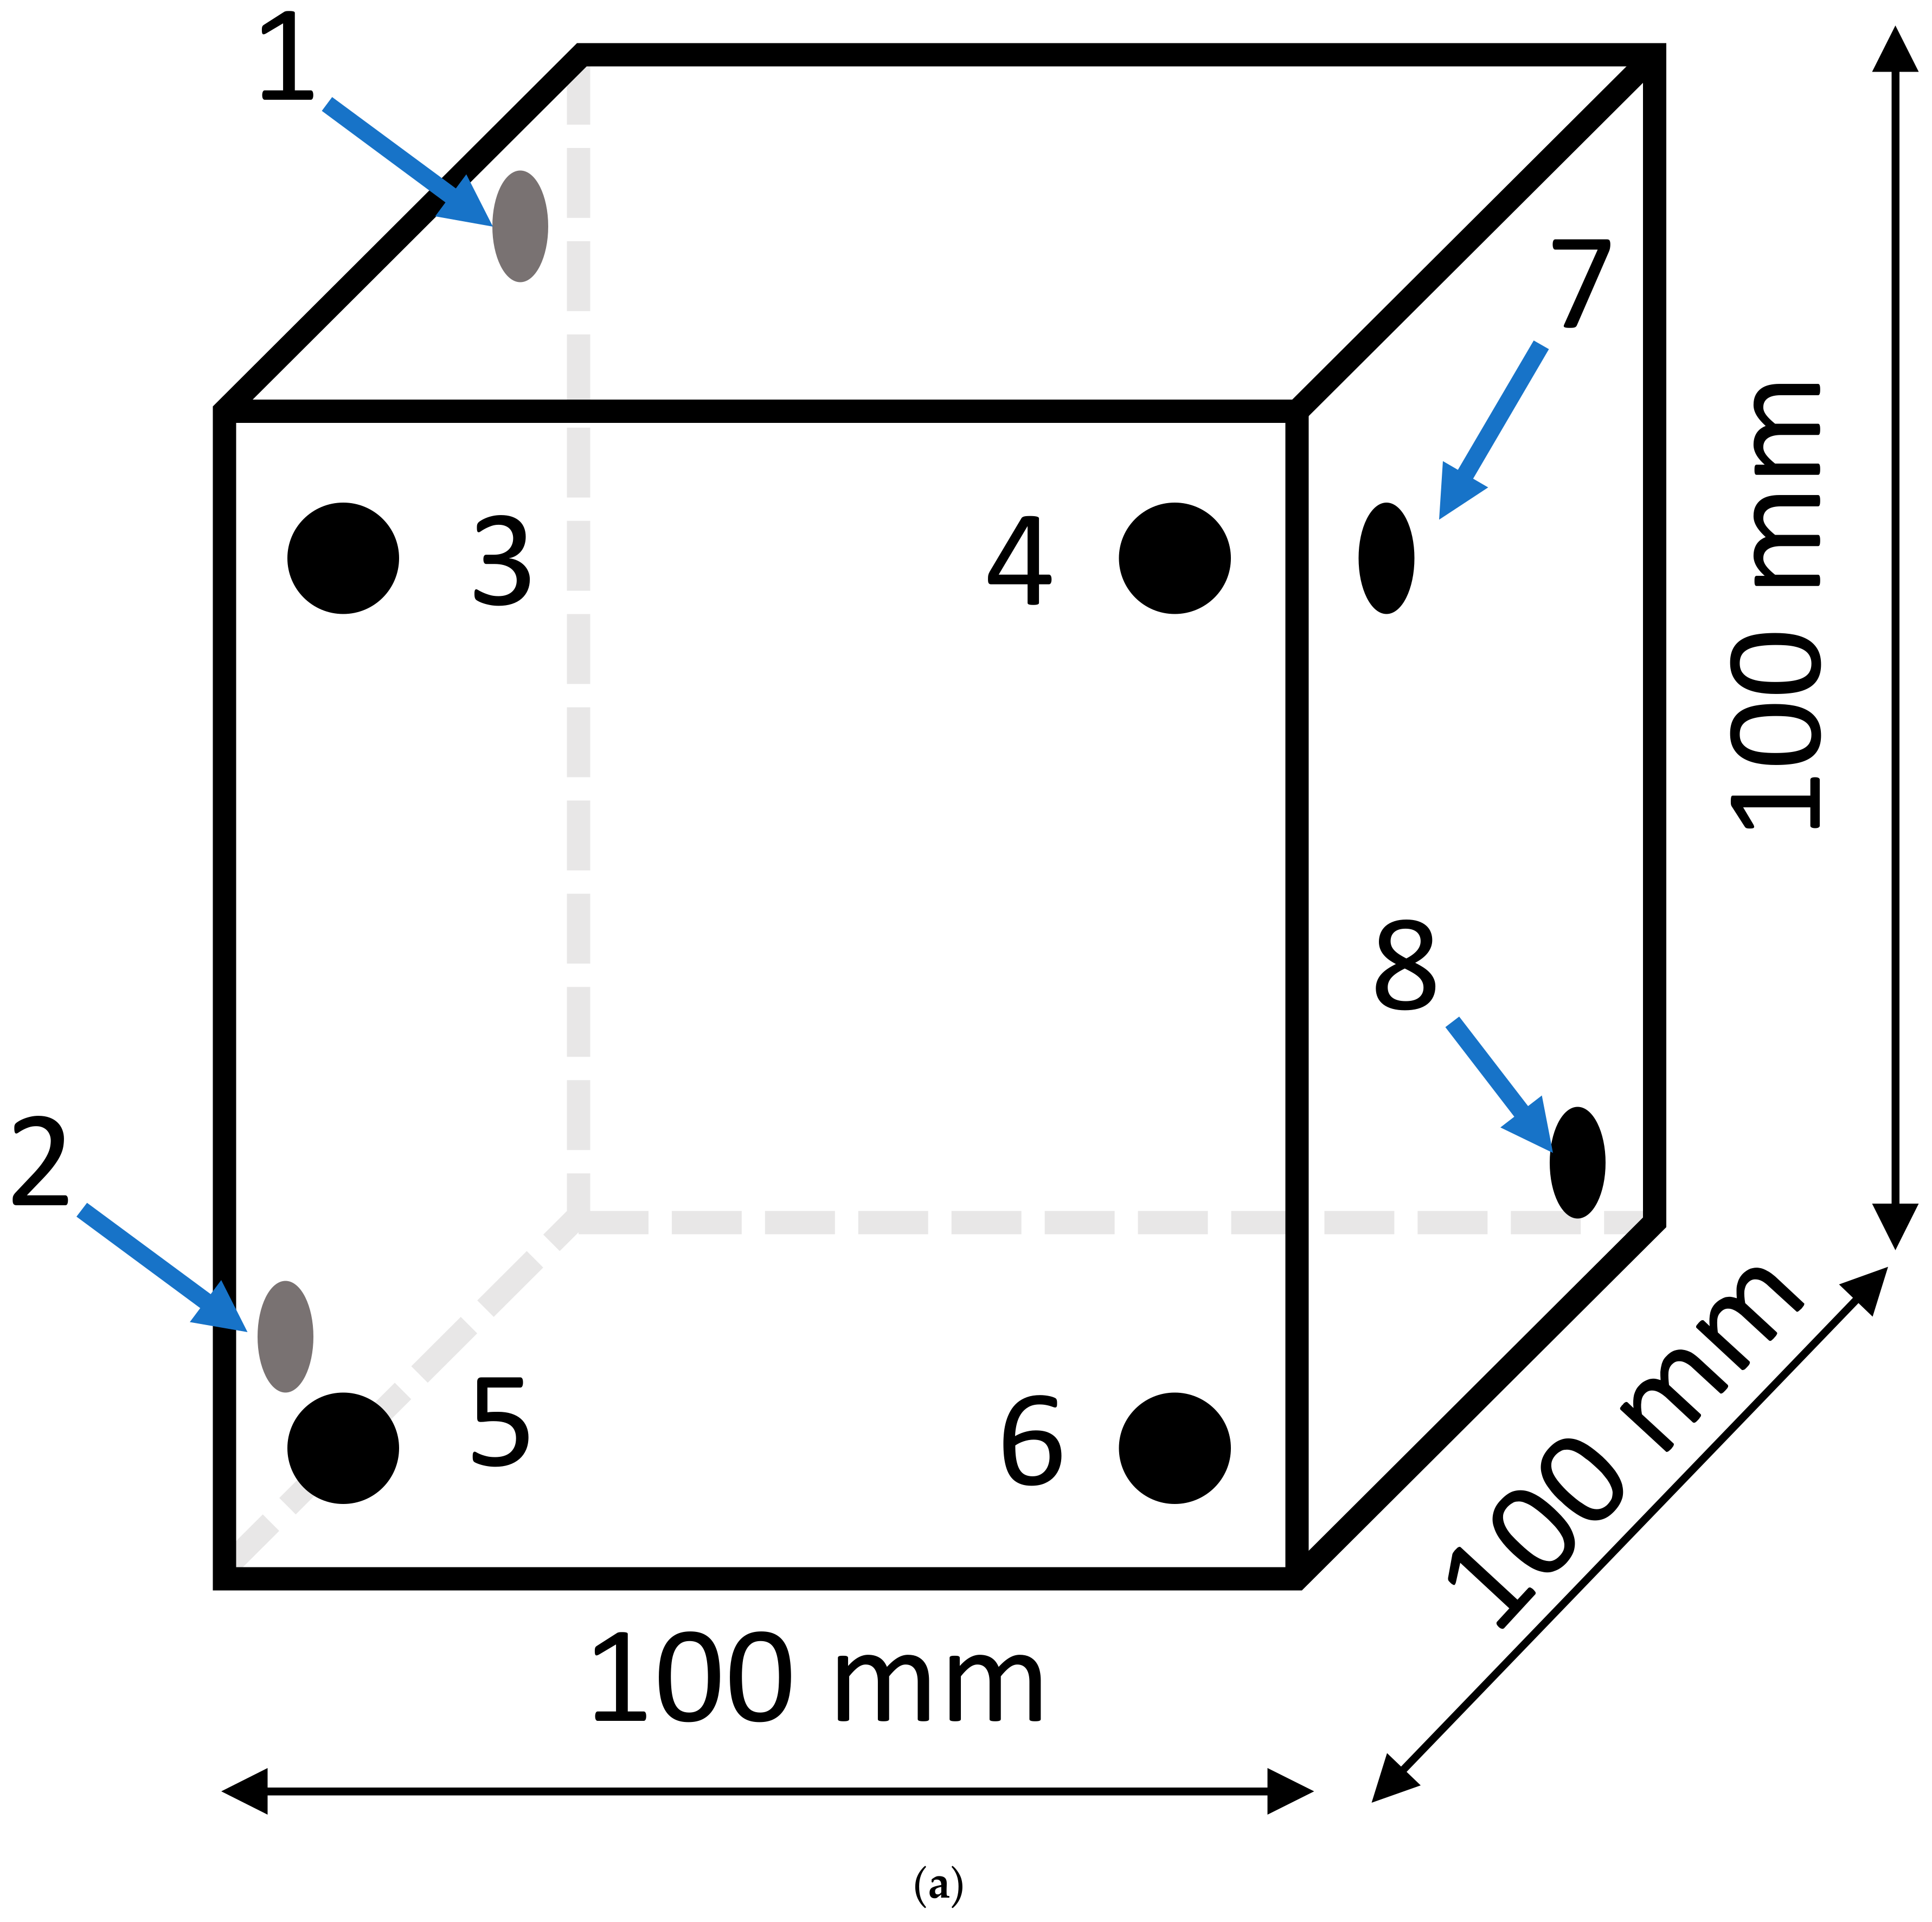
2.2. Sample Preparation

After casting, samples were cast in cubic molds with the dimensions of 100 mm × 100 mm × 100 mm. Each mixture was prepared with 51 duplicates. Then, samples were moist cured in a curing room with a temperature of 20 ± 3 °C and relative humidity (RH) of 95%. Samples were de-molded at 1 d age and then cured in a curing room.
The compressive strength values of cubic samples were determined at 3-, 7-, 14-, 28-, and 270 d. Each mixture was tested with 3 samples, and the average value was reported. Moreover, at the designated loading stage (i.e., 3-, 7-, 14-, and 28 d), 9 samples of each mixture were selected and divided into 3 groups. Each group was pre-loaded to 20%, 50%, and 80% of the corresponding compressive strength. When the pre-loading reached the required value, the load was released. Then, the pre-loaded samples were further stored in the curing room for 270 d for acoustic emission measurement. For the convenience of documenting, samples were labeled as X-Y-Z%, in which X denotes the mixture group (i.e., A and B), Y represents the pre-loading age (i.e., 3-, 7-, 14-, and 28 d age), and Z is the pre-loading degree (i.e., 20%, 50%, and 80%). For example, the nomenclature of A-3-20% represents that at 3 d age, the group A sample was pre-loaded to 20% of its current compressive strength. The loading speed of all tests was 0.5 MPa/s.

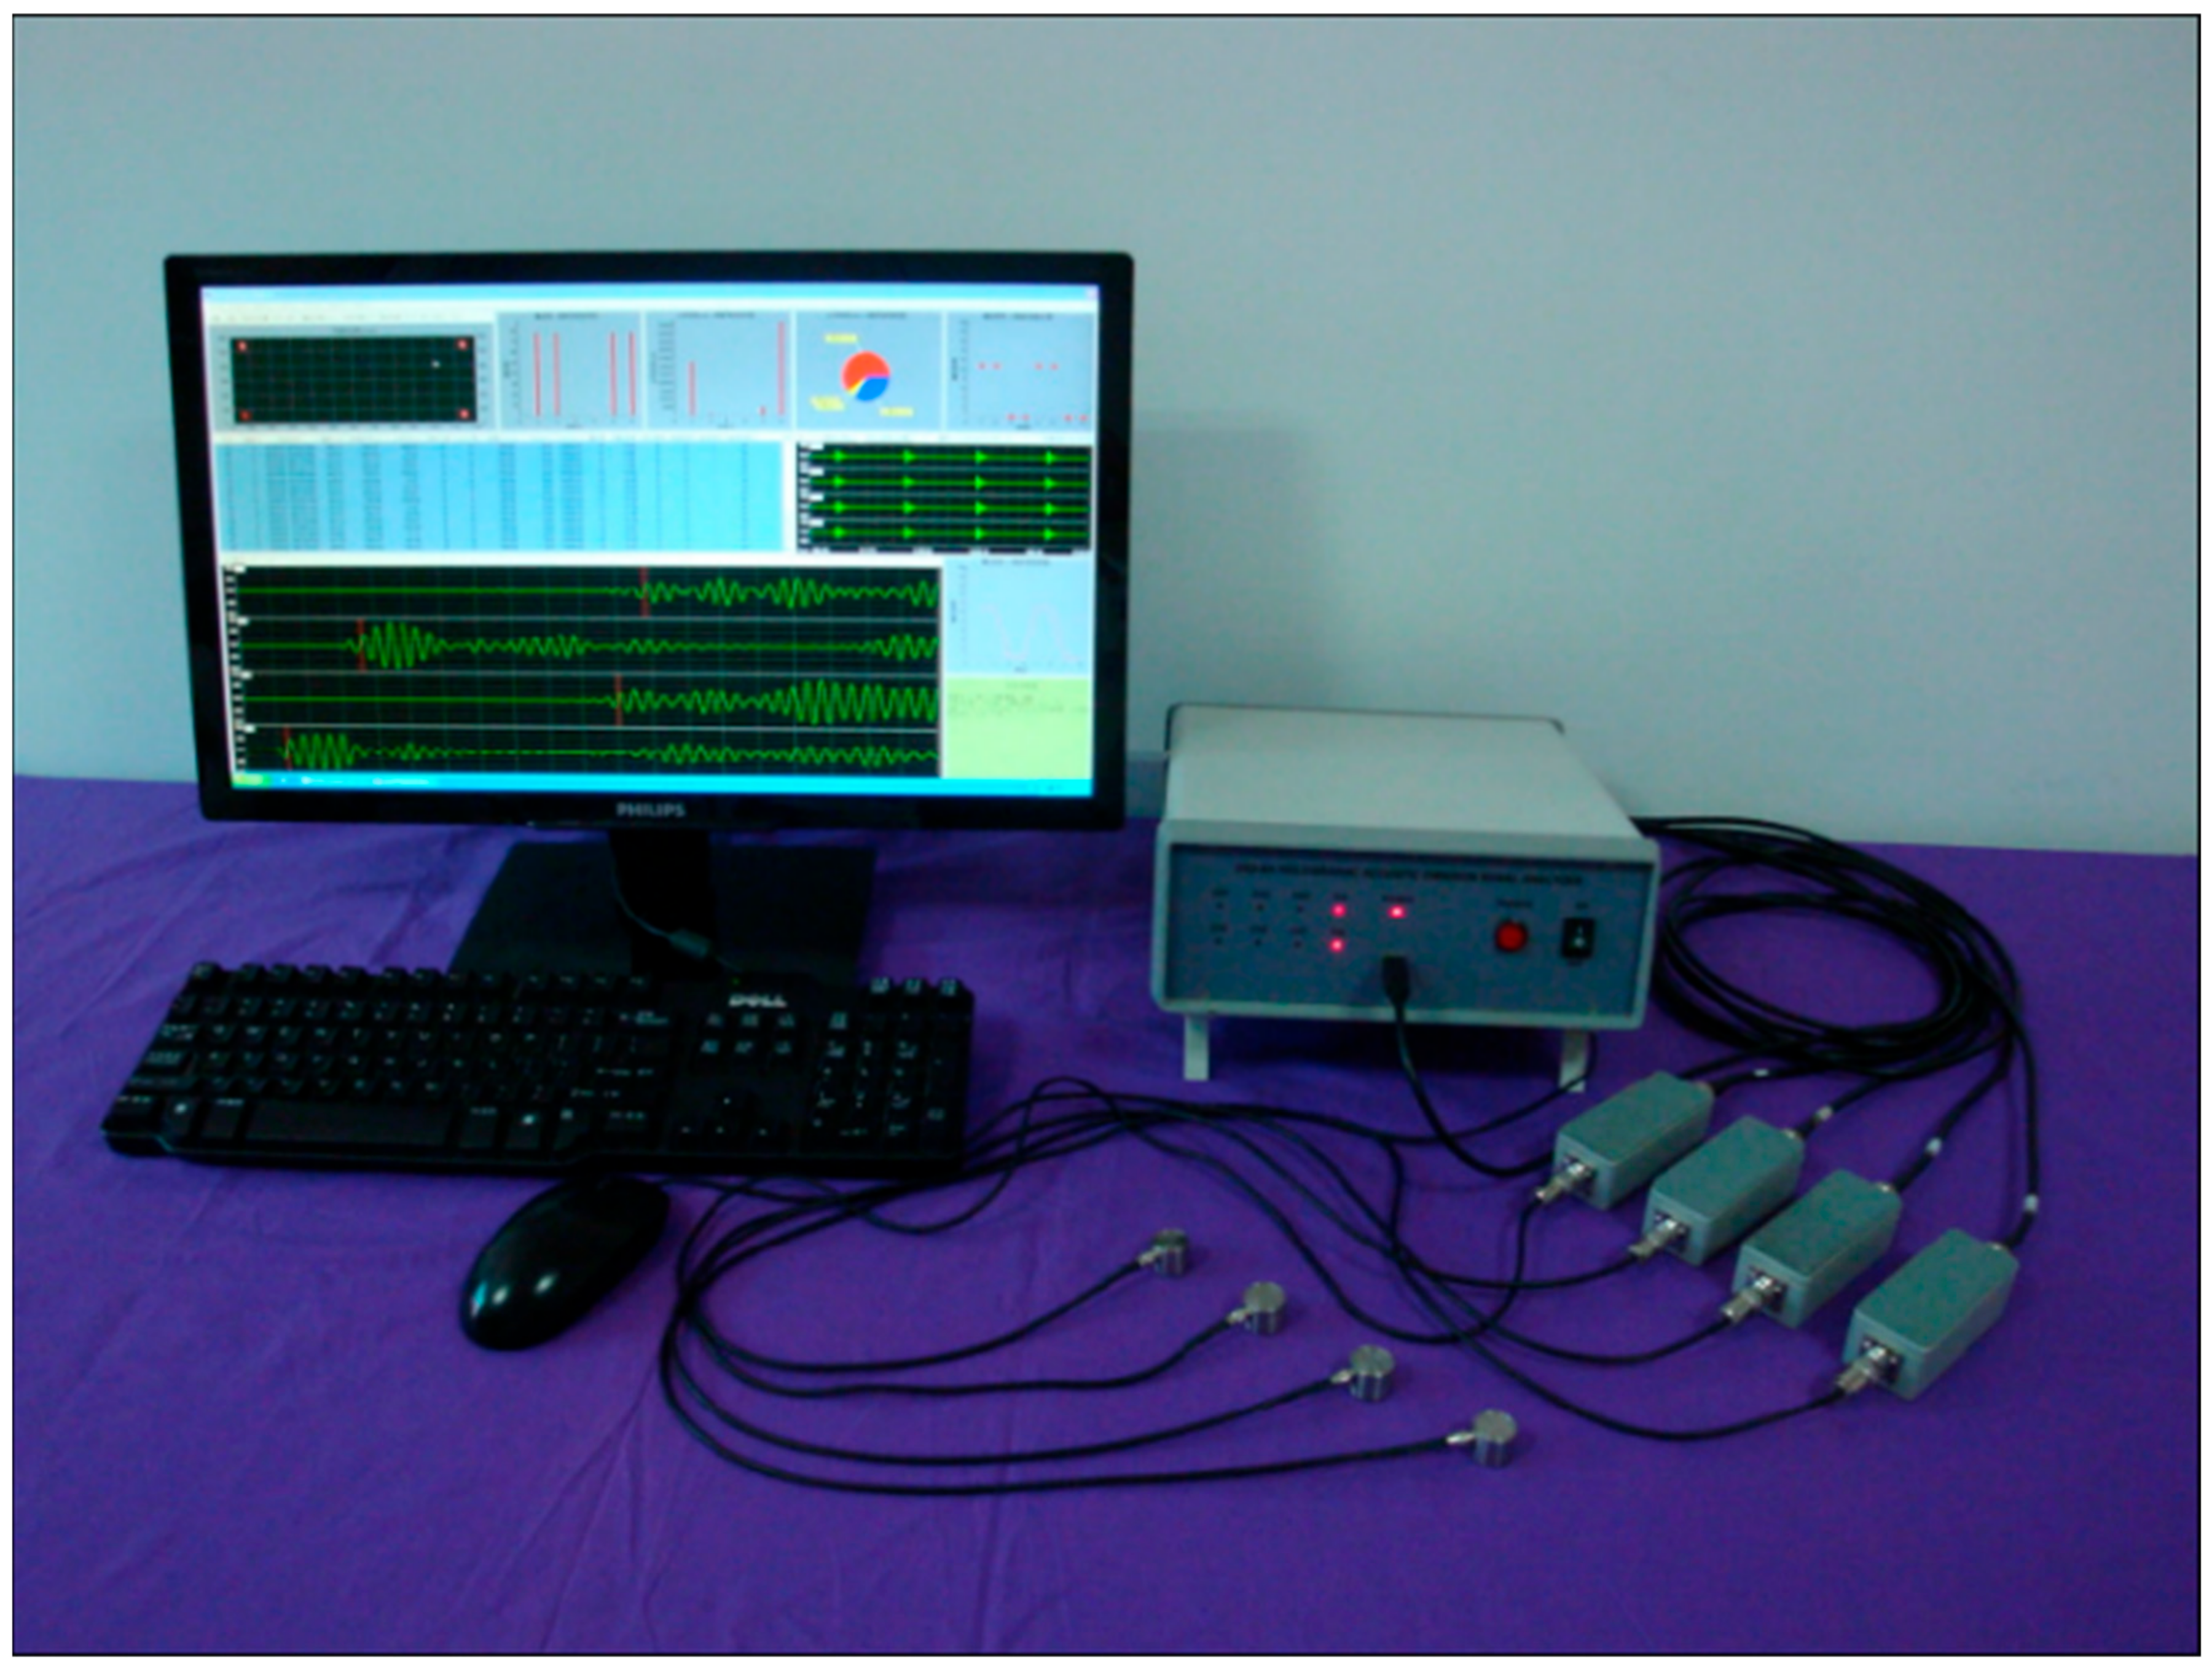
2.3. Acoustic Emission Testing System

At 270 d, the compressive strength of all pre-loaded samples and virgin samples were tested, and the acoustic emission signals were recorded. In this study, the eight-channel DS2-B series enhanced the full-information acoustic emission detection system produced by Beijing Soft Island Times Technology was used as shown in Figure 1 The testing system can dynamically track the whole process of cracking and expansion of micro-cracks in uniaxial compression. The acoustic emission sensor used was RS-2A type.
During the test, 8 sensors were pasted on the surface of the cubic sample by high vacuum grease as shown in Figure 2. The acoustic emission parameters were pre-set according to the experimental conditions: the signal acquisition threshold was 40 dB, the gain of the preamplifier and the main amplifier were both 40 dB, the filter bandwidth was selected as 0–400 kHz, the sampling frequency was 3 MHz, the peak discrimination time was 50 μs, and the impact discrimination time was 200 μs. The impact locking time was 300 μs.

3. Results and Discussion

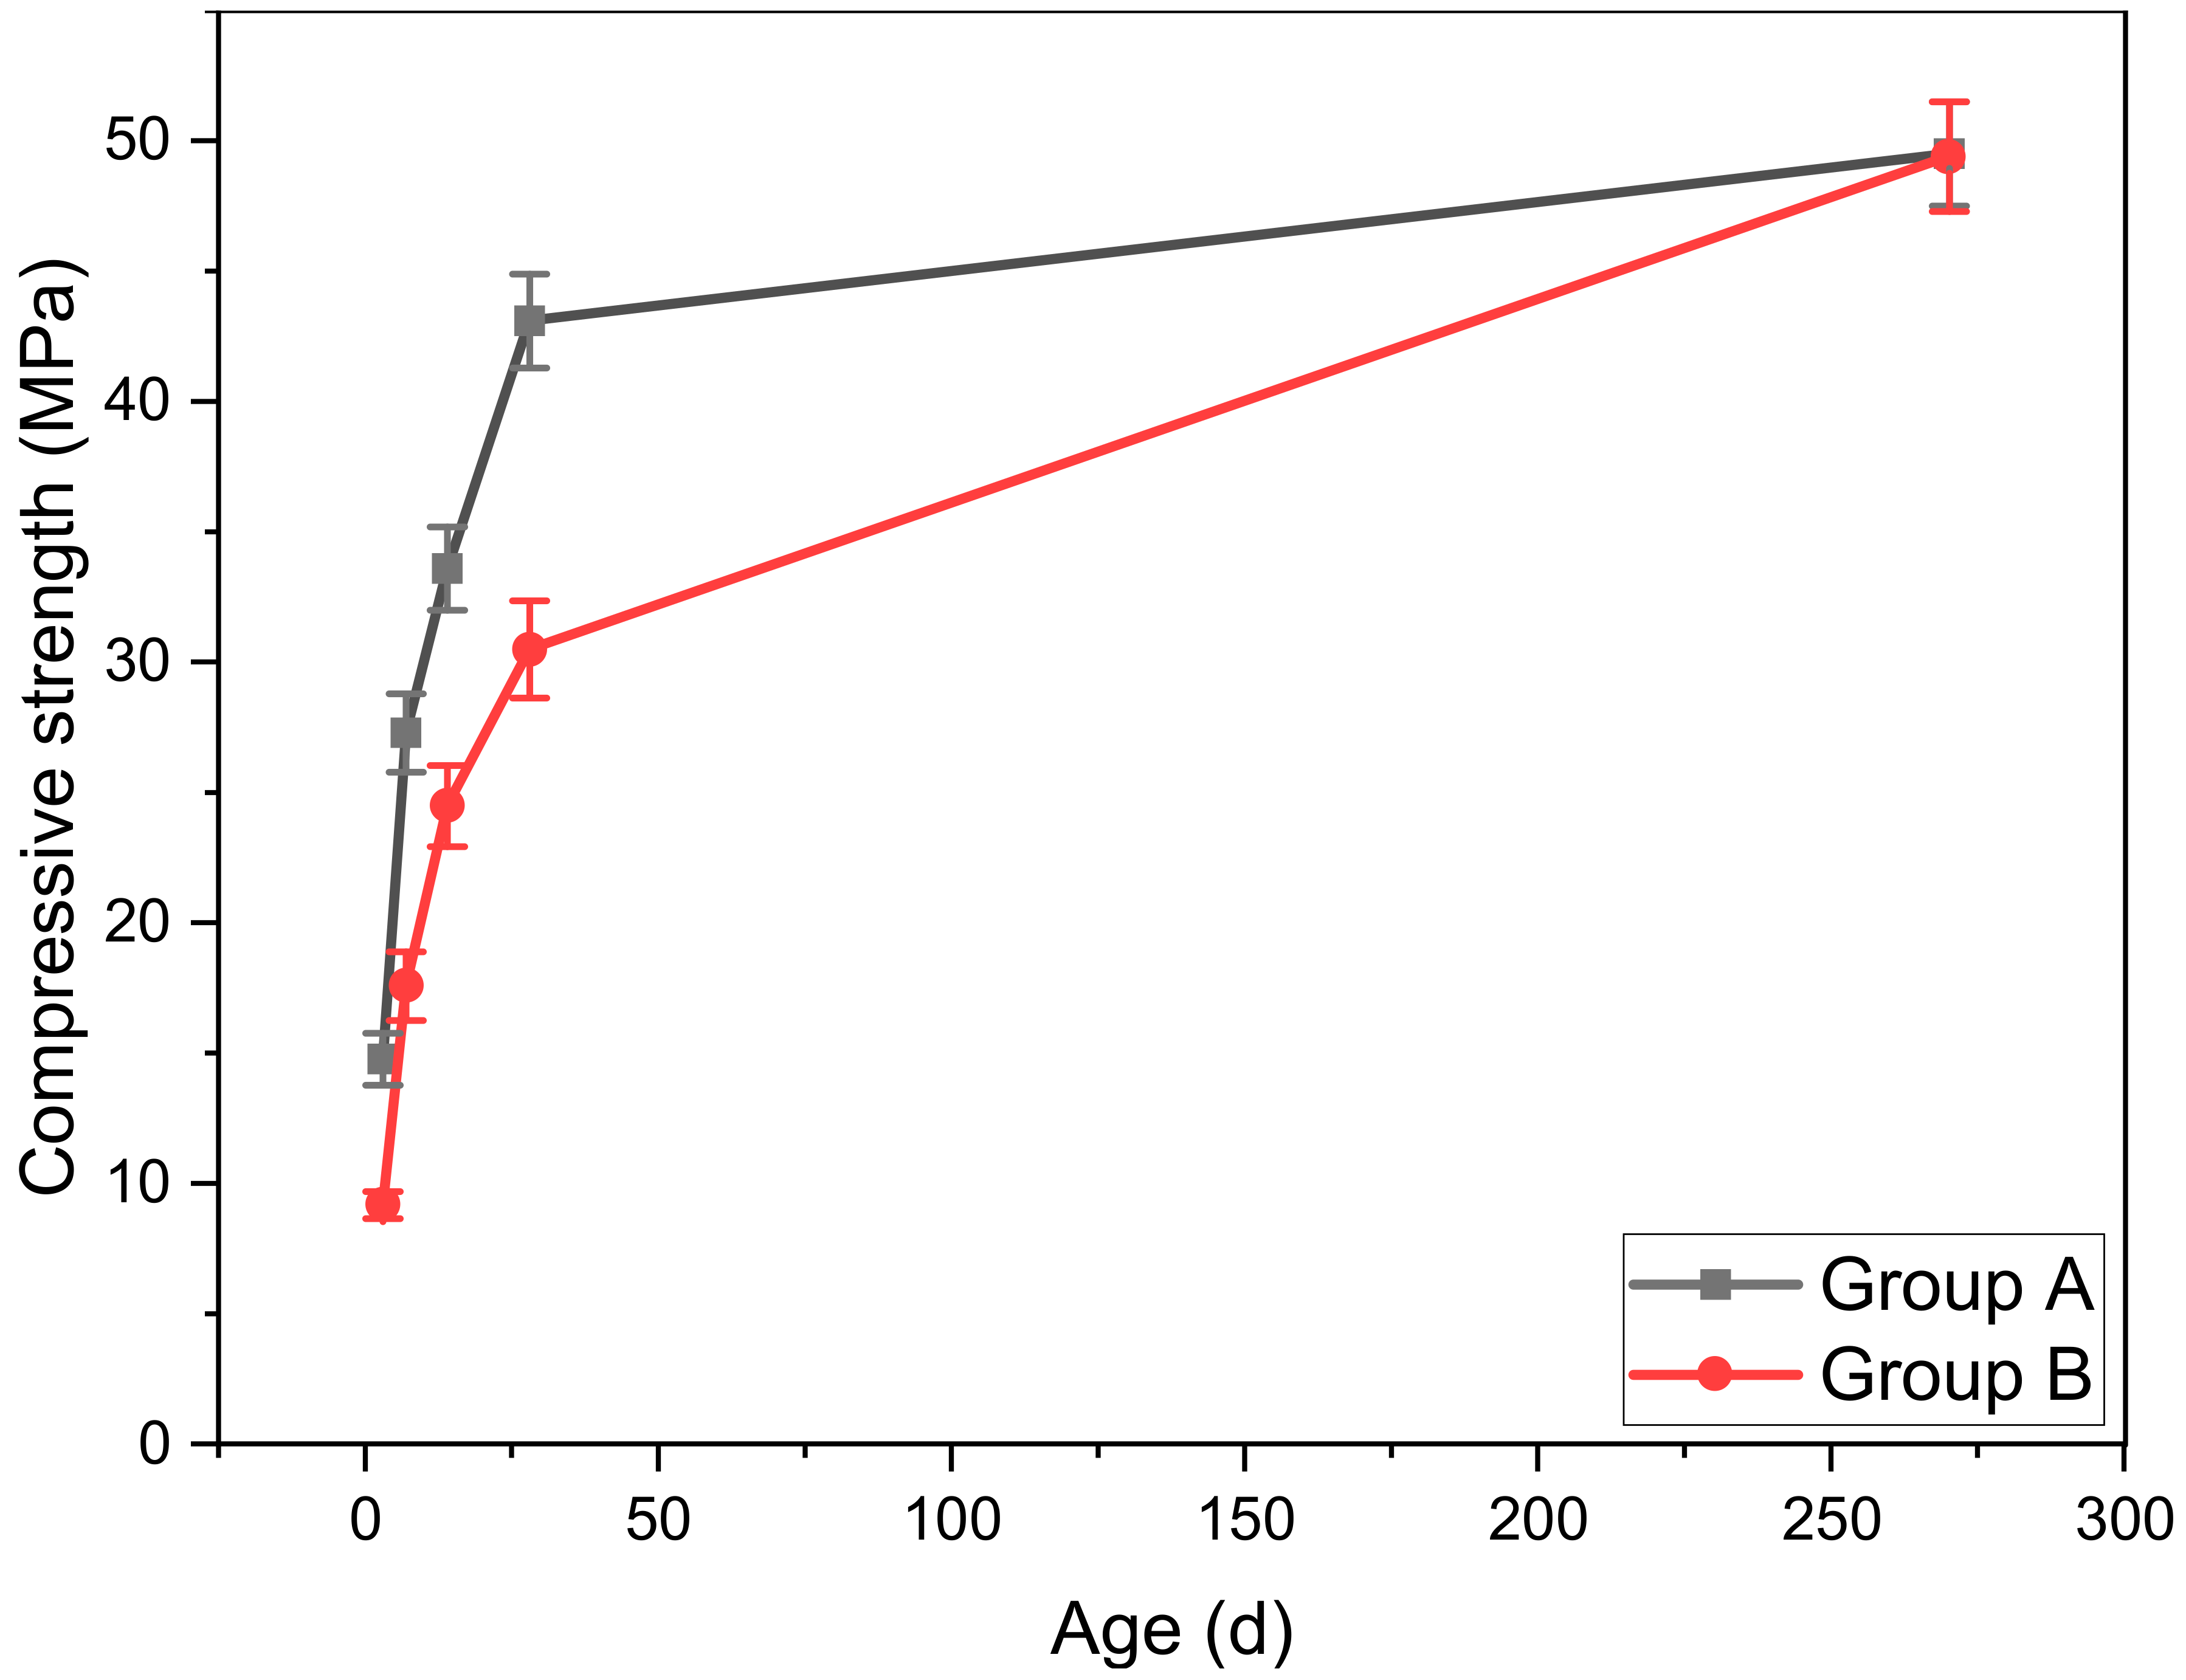
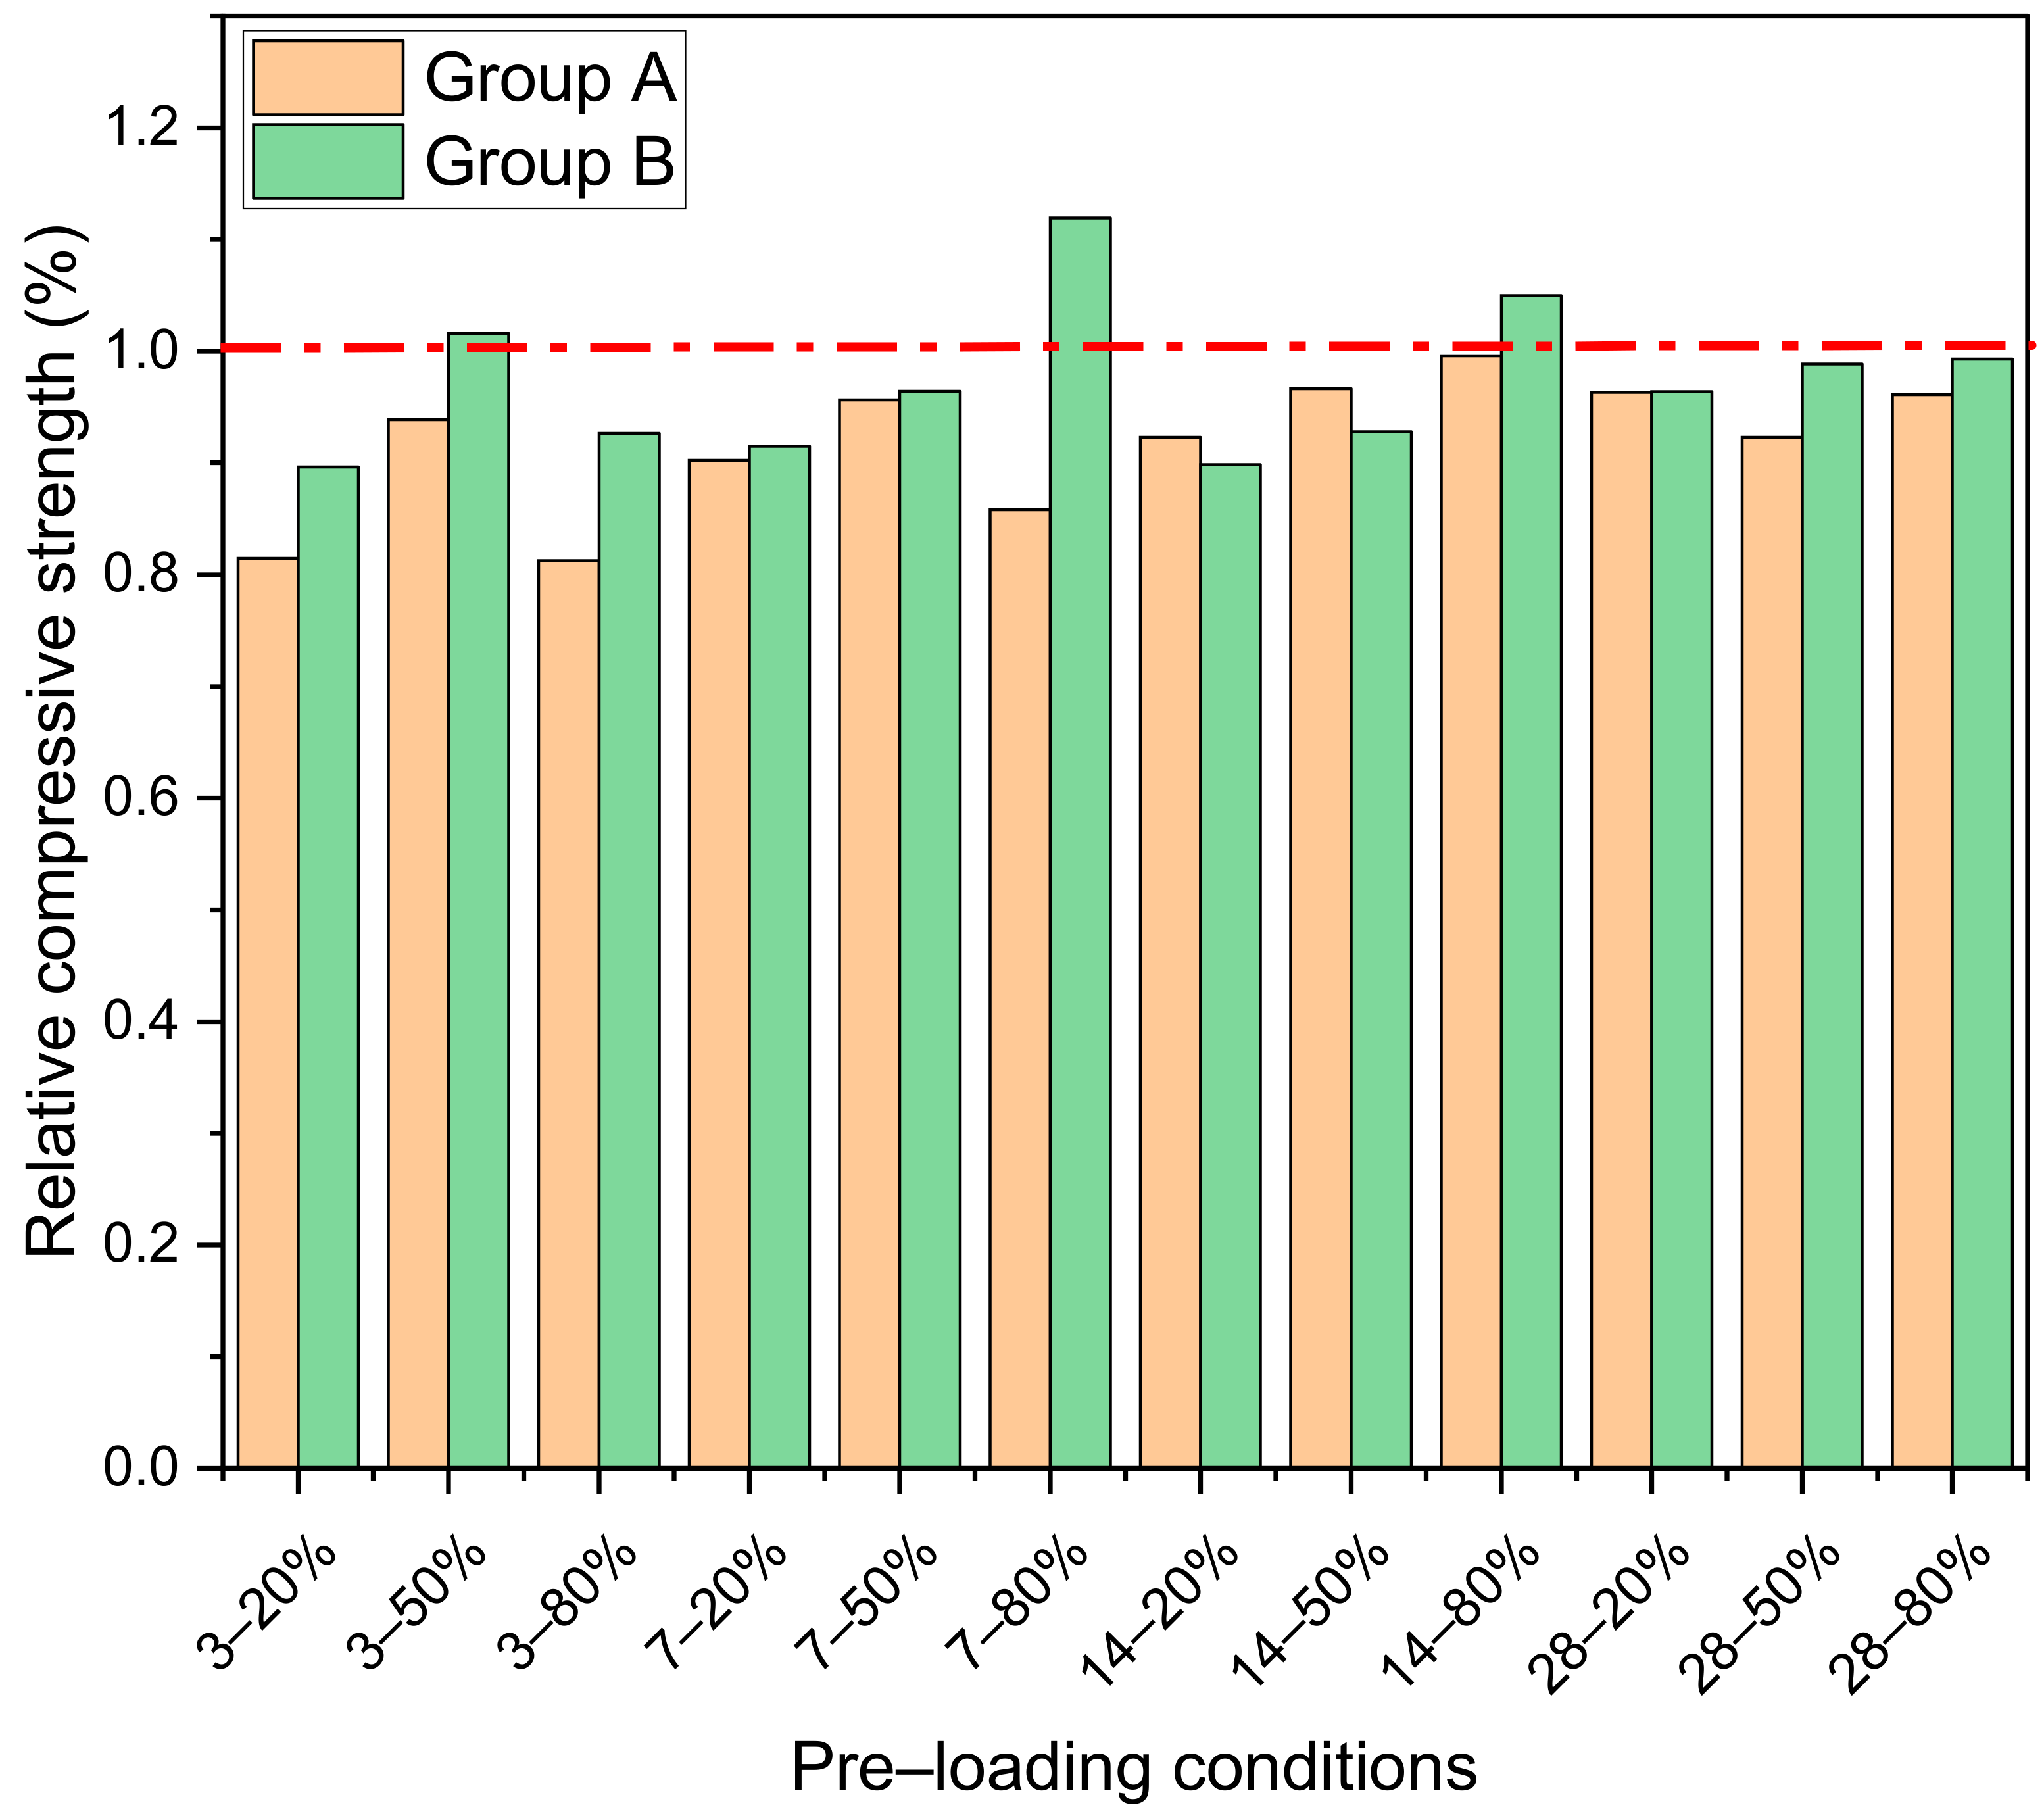
3.1. Compressive Strength Testing Results

The compressive strength developments of concrete samples are shown in Figure 3. The ordinary Portland concrete (OPC, i.e., group A) showed high strength before 28 d age while the supplementary cementitious materials (SCMs, i.e., fly ash, slag) replaced concrete mixture (i.e., group B) and gained more strength from 28 d to 270 d. The compressive strength values at 270 d for groups A and B were almost the same, being 49.5 MPa and 49.1 MPa, respectively. The compressive strength of group A concrete samples at 28 d reached 87.1% of 270 d’s value while group B was 61.7%. The reason for the low strength of group B concrete is the addition of SCMs, which decreased the cement content in the concrete. As a result, the content of hydration products such as calcium hydroxide (CH) and calcium silicate hydrate (C-S-H) is low in the early stages. Thus, the compressive strength of group B concrete is lower than group A’s. However, at later stages (i.e., 28 d to 270 d), group B concrete gained more strength than group A concrete. This can be attributed to the pozzolanic reaction of SCMs and the hydration products (i.e., CH), which generate C-S-H gel and fills the interconnected pore structure. Thus, the compressive strength development of group B concrete is faster than group A concrete.
The compressive strength results of pre-loaded samples were tested at 270 d age. The relative ratios of the compressive strength of pre-loaded and virgin samples at 270 d are presented in Figure 4. It is observed that the relative ratio of group B concrete is mostly higher than that of group A concrete. The results indicate that the micro-cracks induced by pre-loading were healed by the hydration products in later stage curing. Besides, group B concrete shows good post-injury repair performance, verifying that the incorporation of SCMs has a pozzolanic reaction. The pozzolanic reaction generated more C-S-H gel which refined the micro-pore structure and bridged the micro-cracks caused by pre-loading.
It is also found that loading concrete up to 90% of its strength at the age of 8 h does not affect its later age strength development [22]. Some researchers also found that incorporating SCMs can effectively heal the cracks induced by the early age damage [23]. It was observed that the 90% pre-loading degree on concrete at 28 d caused a 27% loss of ultimate compressive strength. However, after another 30 days of curing, the compressive strength of concrete with SCMs improved by 20%, while in the normal concrete without SCMs the compressive strength only improved by 6%.

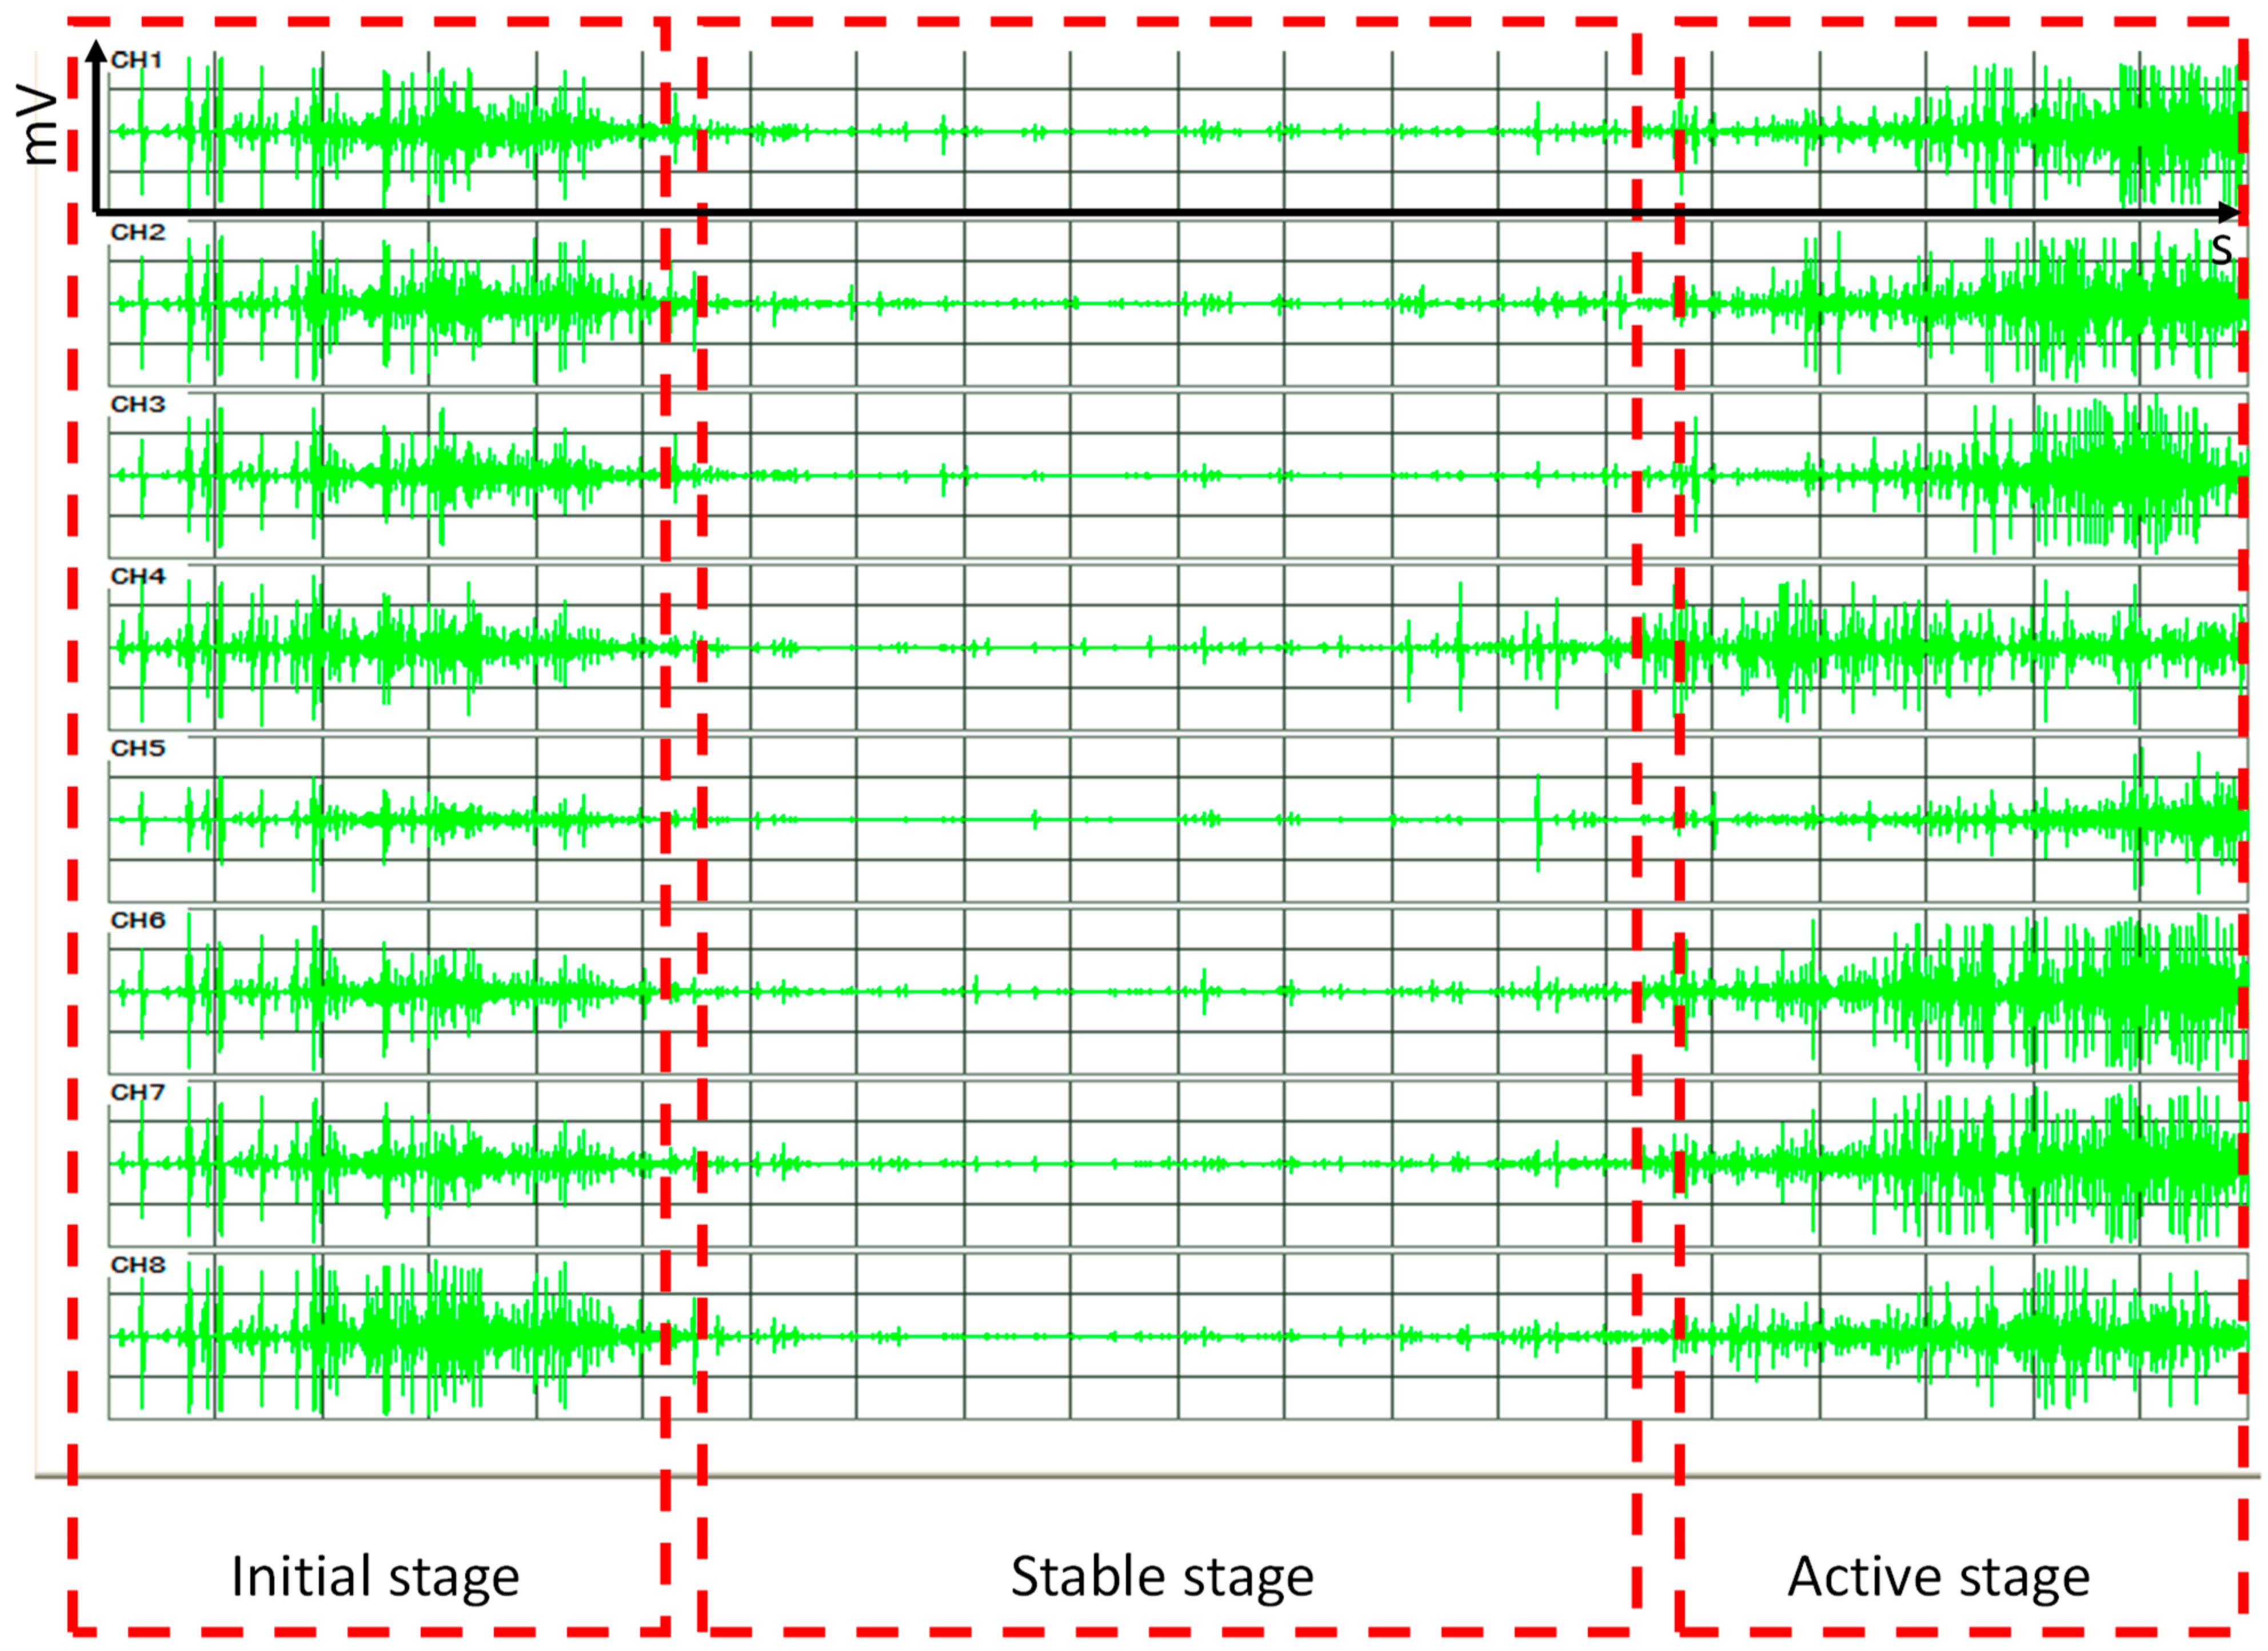
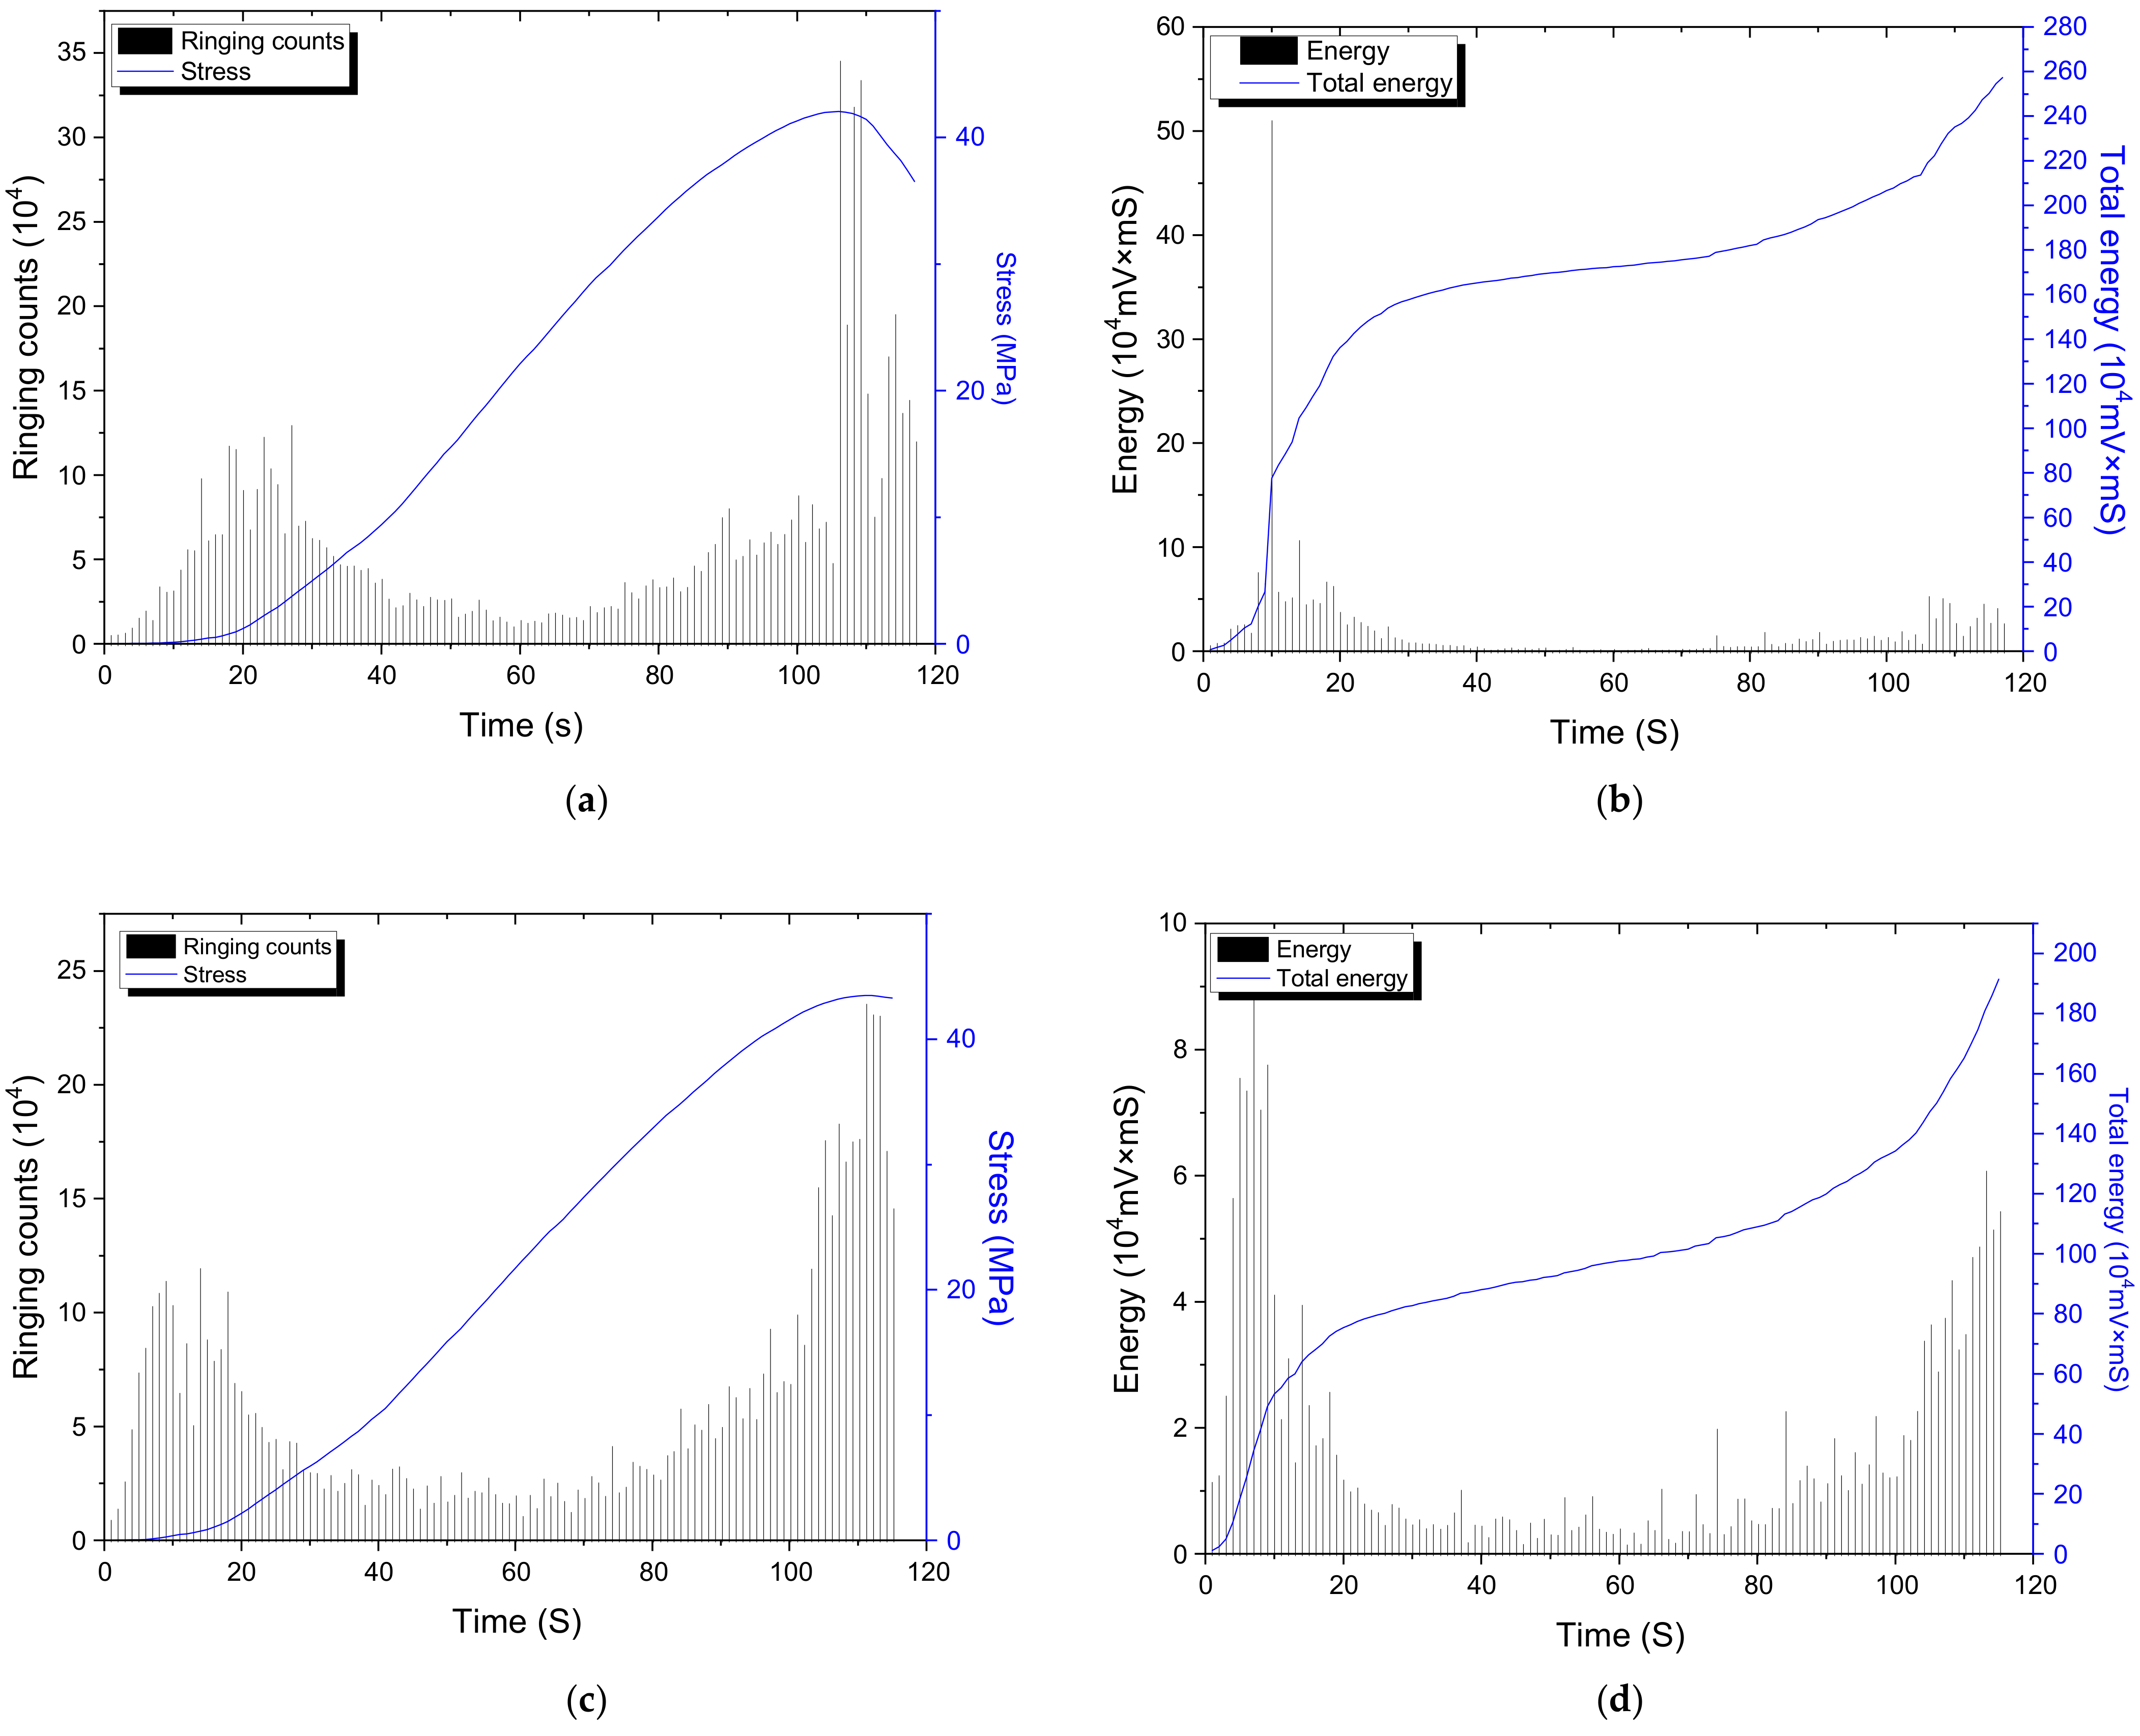
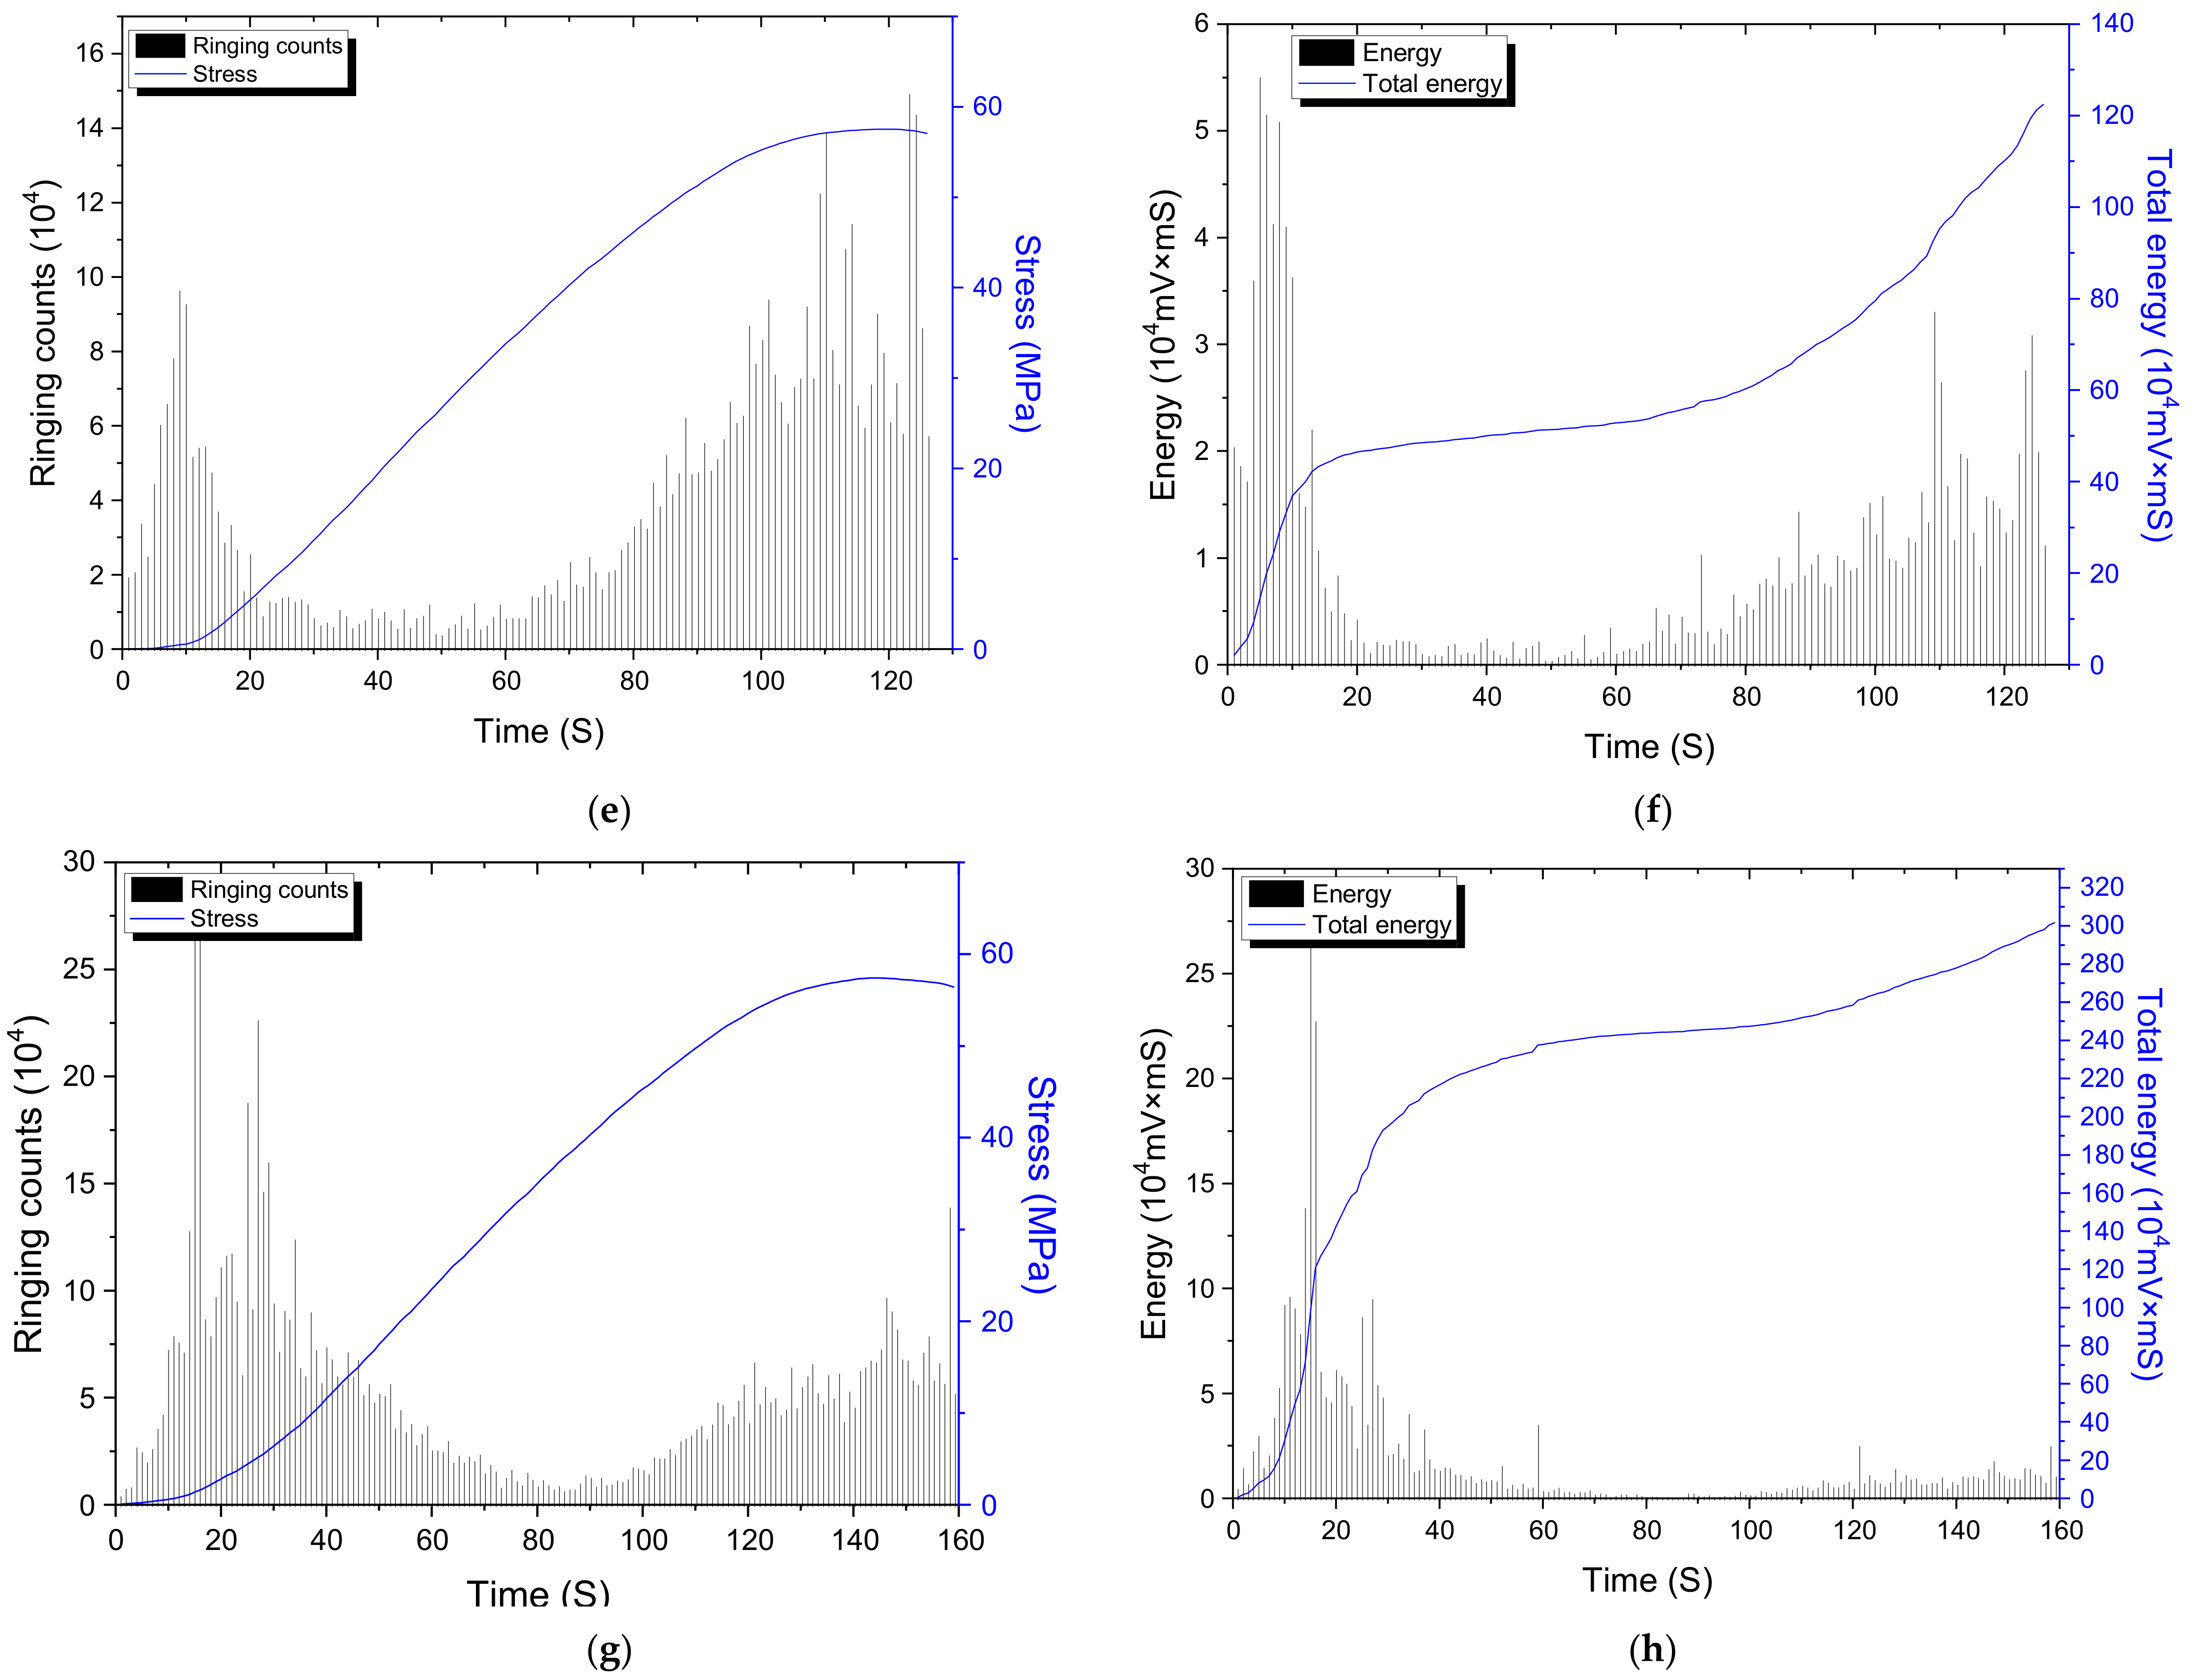
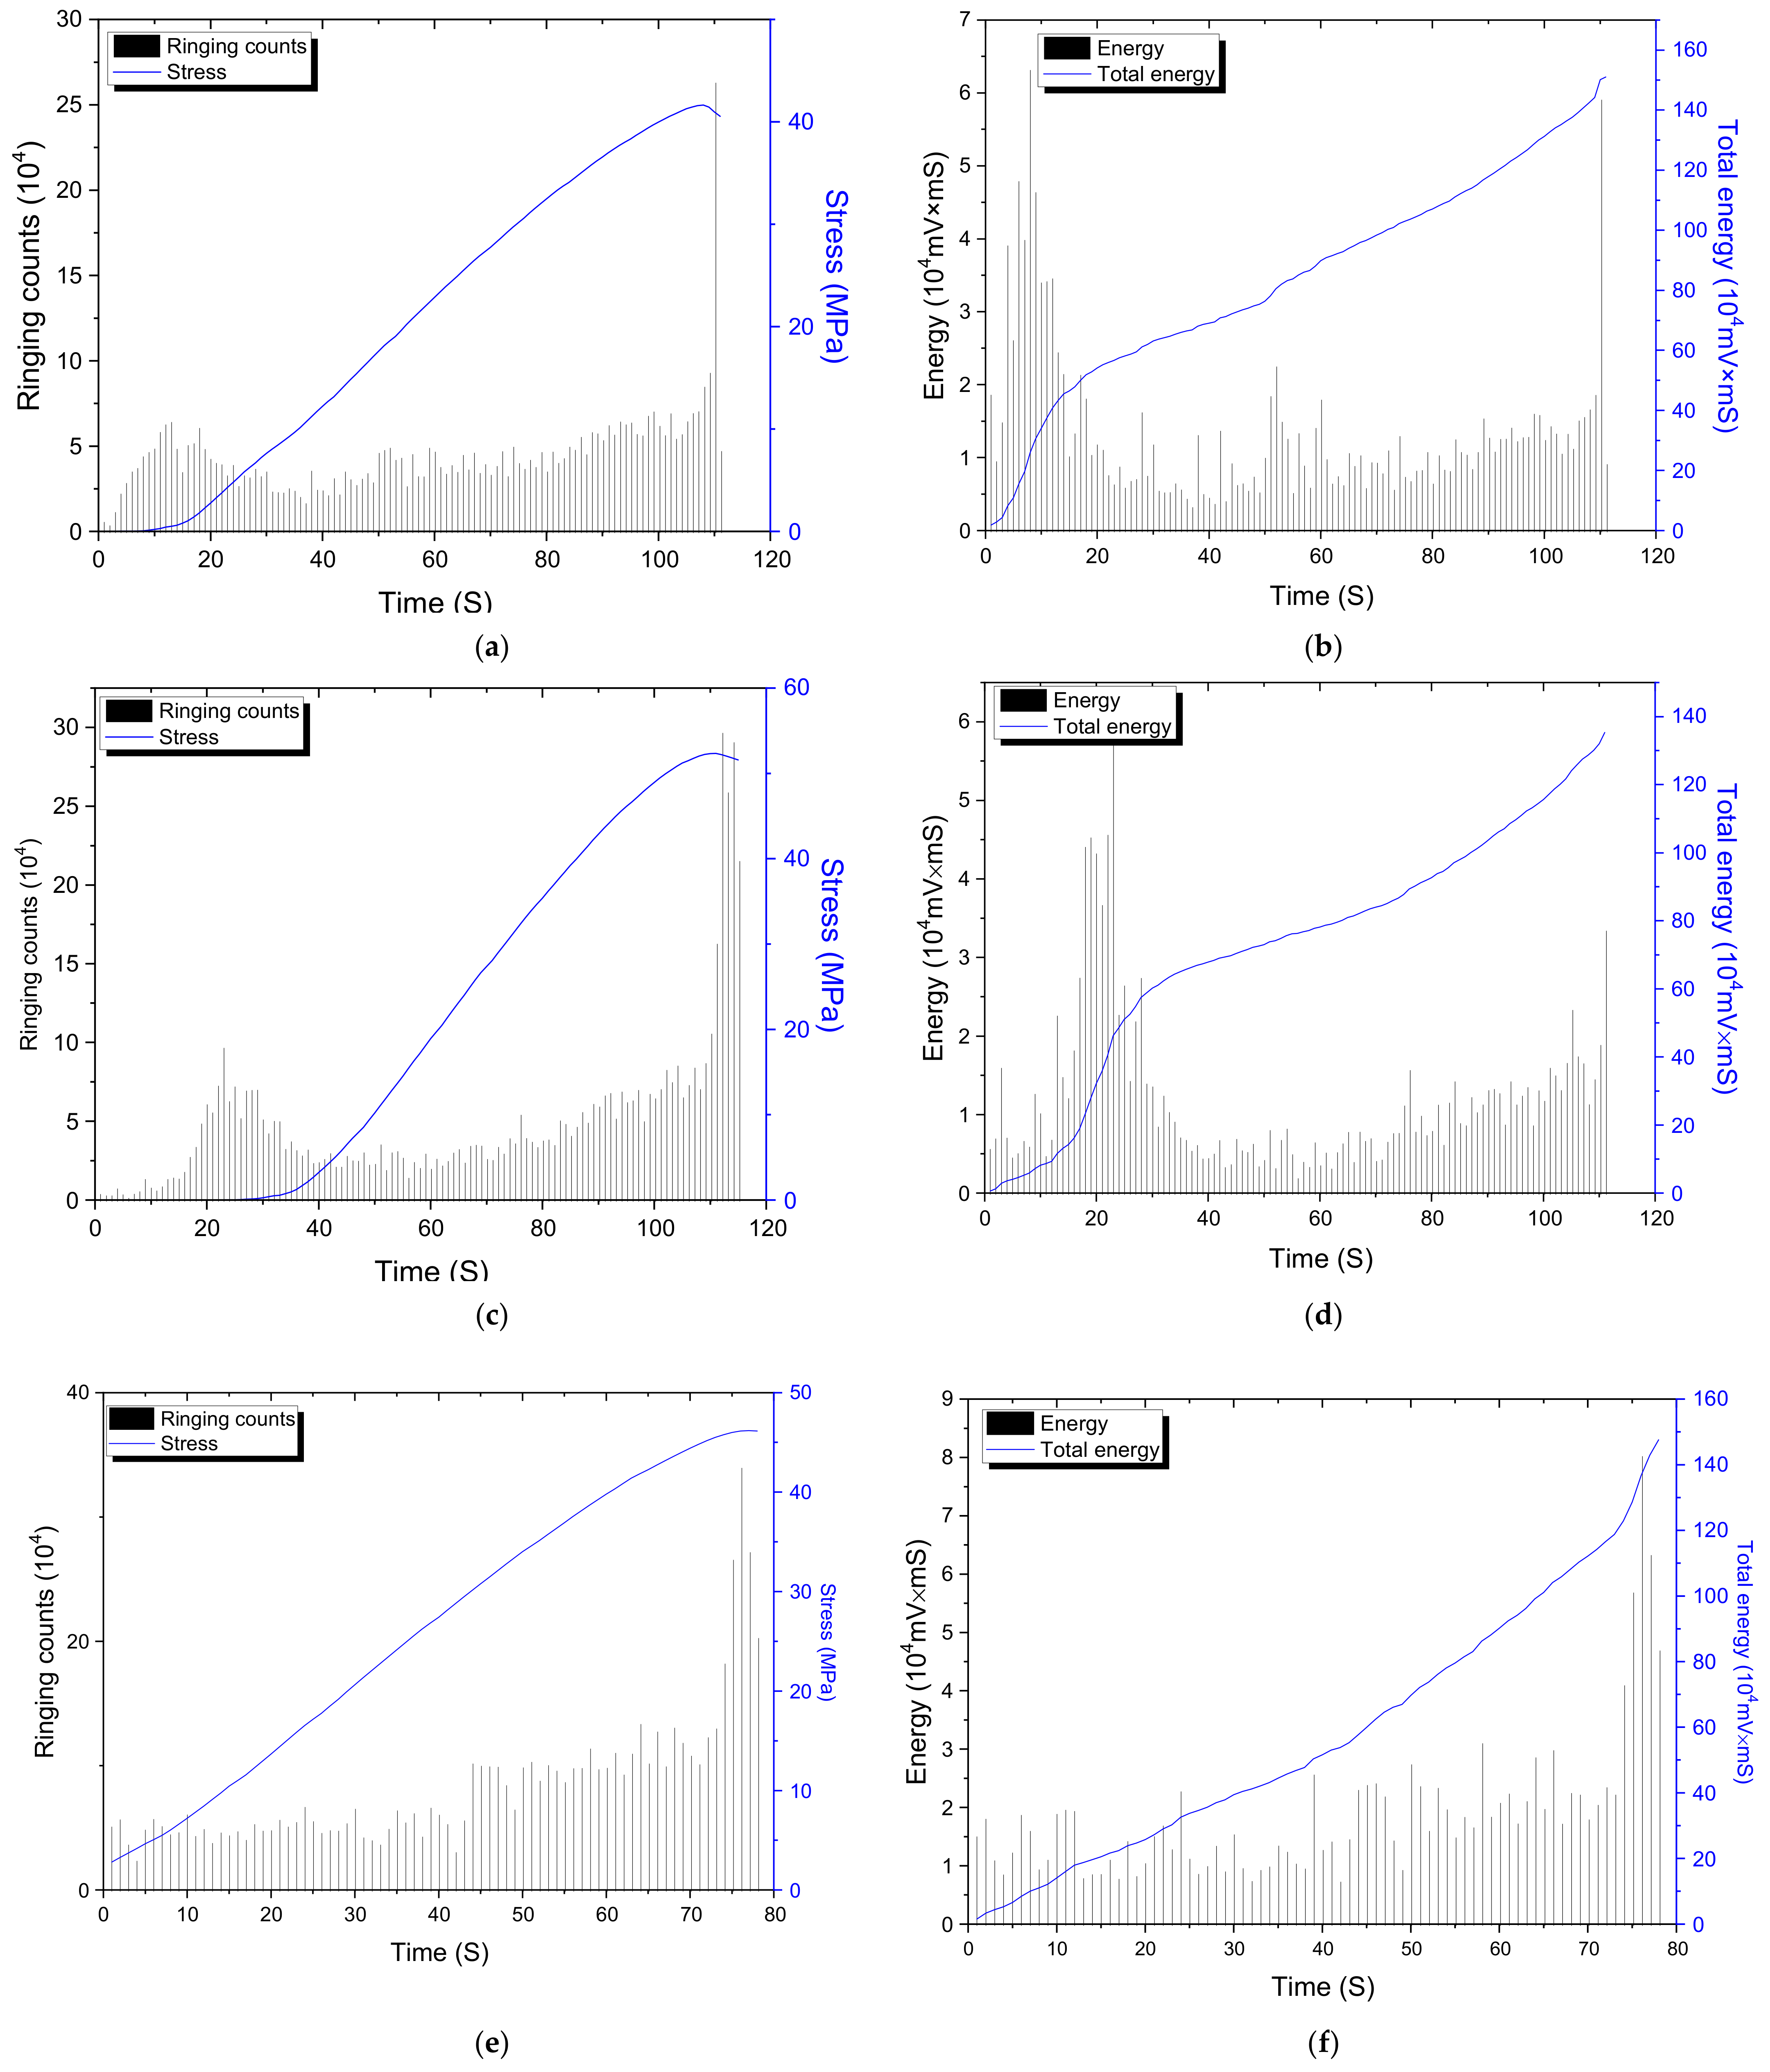
3.2. Acoustic Emission Results in the Process of Uniaxial Compression Test

Figure 5 shows the acoustic emission waveforms of 8 channels of B-14-80% sample during the compression test. According to the waveforms, the whole test process can be divided into 3 stages: initial stage, stable stage, and active stage, which corresponds to the micro-crack formation, micro-crack expansion, crack connection, and failure of concrete sample.
In this work, the acoustic emission results of A-80% samples, B-20%, B-50%, and B-80% at different pre-loading stages are presented and discussed. The testing results of other samples and further discussions are available on request from the corresponding author.
Figure 6 presents the counts, stress, and energy development in terms of loading time of group A samples for different pre-loading stages. Figure 6a reveals that under the condition of uniaxial compression, the AE ringing counts of A-3-80% concrete appeared in two peak stages, at around 20 s and 110 s loading time, which corresponds to the initial and active stages. Figure 6b indicates that a large proportion of energy appears in the initial stage (0–20 s).
For concrete at 3 d, the cement hydration has just entered a stable development period, the hydration is insufficient, and the concrete is still unstable. At 3 d, pre-loading is carried out, and the external force applied not only compacts the shrinkage cracks of the concrete but also the original micropores, microscopic gaps, and defects in the concrete are gradually compacted under the action of the external load so that the internal microstructure changes. Due to the pre-loading degree of 80% at 3 d compressive strength, the internal cracks in the concrete developed from the interface cracks between the aggregate and the mortar to the interior of the mortar. A large number of cracks were not completely repaired following the curing process, and they penetrated again at the initial stage of loading. Thus, in Figure 6b, a large proportion of energy appears at the initial stage. The unrepaired cracks reduced the final effective bearing area of the samples and made the energy intensity in the later stage.
Figure 6c–f shows the acoustic emission results of A-7–80% and A-14-80% samples. The ringing counts also showed 2 peaks at around 20 s (initial stage) and 110 s (active stage) loading time, which is similar to the results of A-3-80% samples. However, compared with A-3-80% samples, more counts were observed in the active stage. In Figure 6b, only one peak of the energy development of the A-3-80% sample in the initial stage was observed. However, the energy development in Figure 6d,f showed 2 major peaks, which correspond to the initial and active stages. This is because, at 7 d and 14 d, the hydration degree is sufficiently high to resist the 80% pre-loading degree. There were only a small amount of cracks generated during the pre-loading process. On the other hand, there were still enough un-hydrated cement particles. Thus, in later curing proceedings, the hydration products healed the cracks generated in the pre-loading process. Therefore, when the concrete was subjected to axial compression at 270 days, the energy transition moved backward, and a “double peak” phenomenon appeared in the energy history diagram.
The acoustic emission ringing counts of the A-28-80% samples under uniaxial compression have two peak stages, as shown in Figure 6g. The stable stage is short, which is shorter than that of the A-7-80% and A-14-80% samples. Figure 6h reveals that most of the energy for A-28-80% samples was concentrated in the initial stage. Only limited energy was released in the stable and active stages. This is because when the concrete is cured for 28 days, the cement hydration is sufficient, and the concrete is stable. At this time, the pre-loading was carried out, and some cracks were generated. However, most cement particles were hydrated in the first 28 d. There was insufficient hydration in the later curing process to heal the cracks. As a result, the cracks generated in pre-loading cannot be effectively healed. Thus, compared with A-7-80% and A-14-80% samples, most of the energy for the A-7-80% samples was released in the initial stage.
It is suggested that for ordinary concrete without SCMs, the load-bearing age should not be earlier than 7 days. Besides, the load should be less than 80% of the current strength.
Figure 7 shows the counts, stress, and energy development of group B concrete with different pre-loading stages. Compared with ground A concrete in Figure 6, there are more signals detected in the active stage, especially for B-3-80% and B-28-80% samples. Moreover, the signal intensity in the stable stage for group B concrete was also higher than for group A. The reason is that the addition of SCMs in group B concrete has a higher secondary hydration potential after the pre-loading process. The incorporation of SCMs induced a pozzolanic reaction during the curing process after pre-loading. Thus, the generated hydration products effectively healed the damage from the pre-loading. Therefore, compared with group A concrete, there are more signals detected in stable and active stages for group B concrete.
It is recommended that the loading-bearing stage for concrete with SCMs with group B mixture can be earlier than that of ordinary concrete without SCMs.

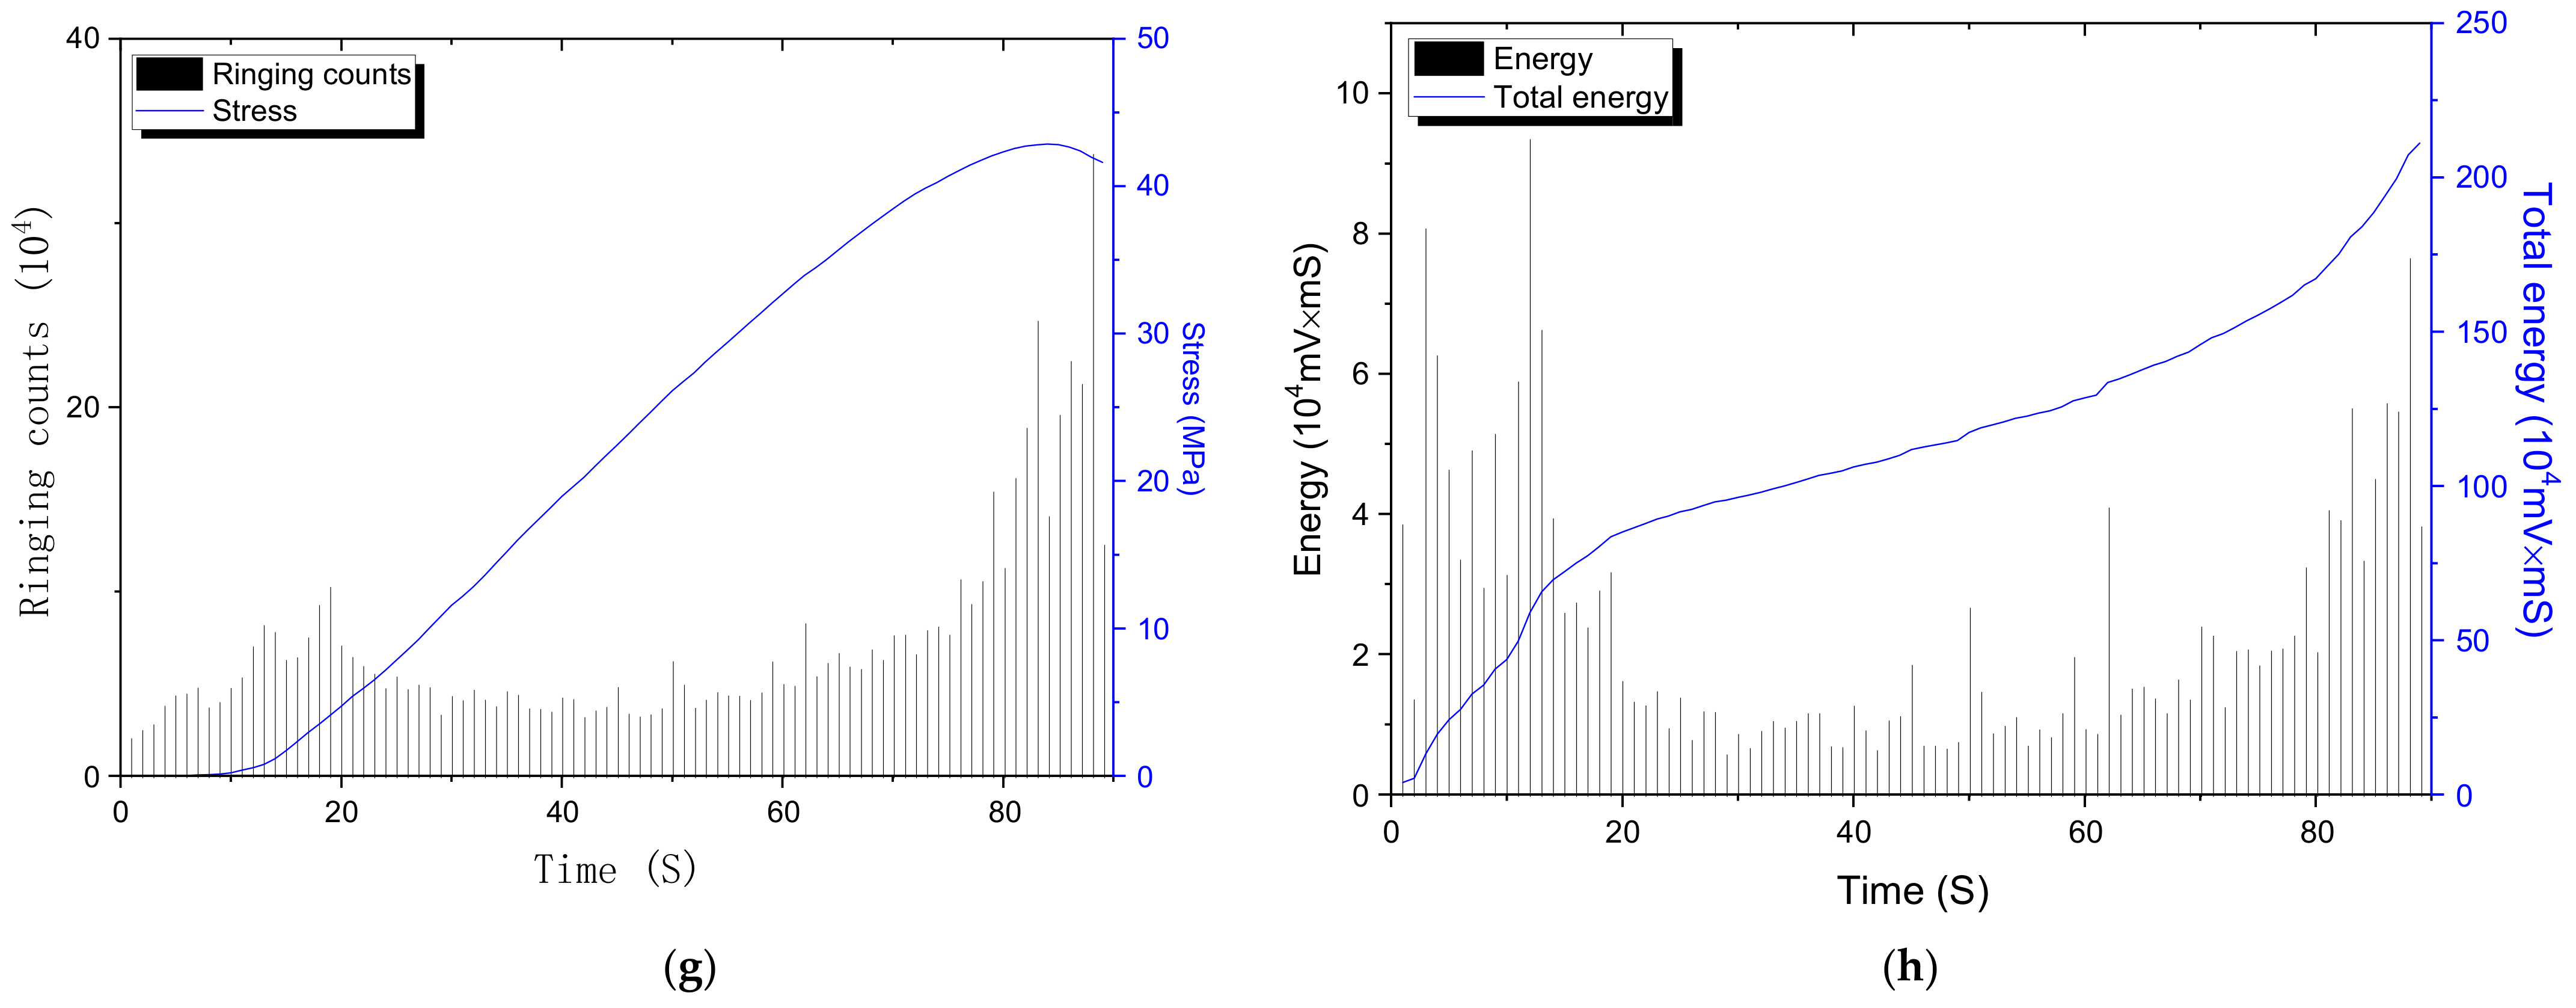
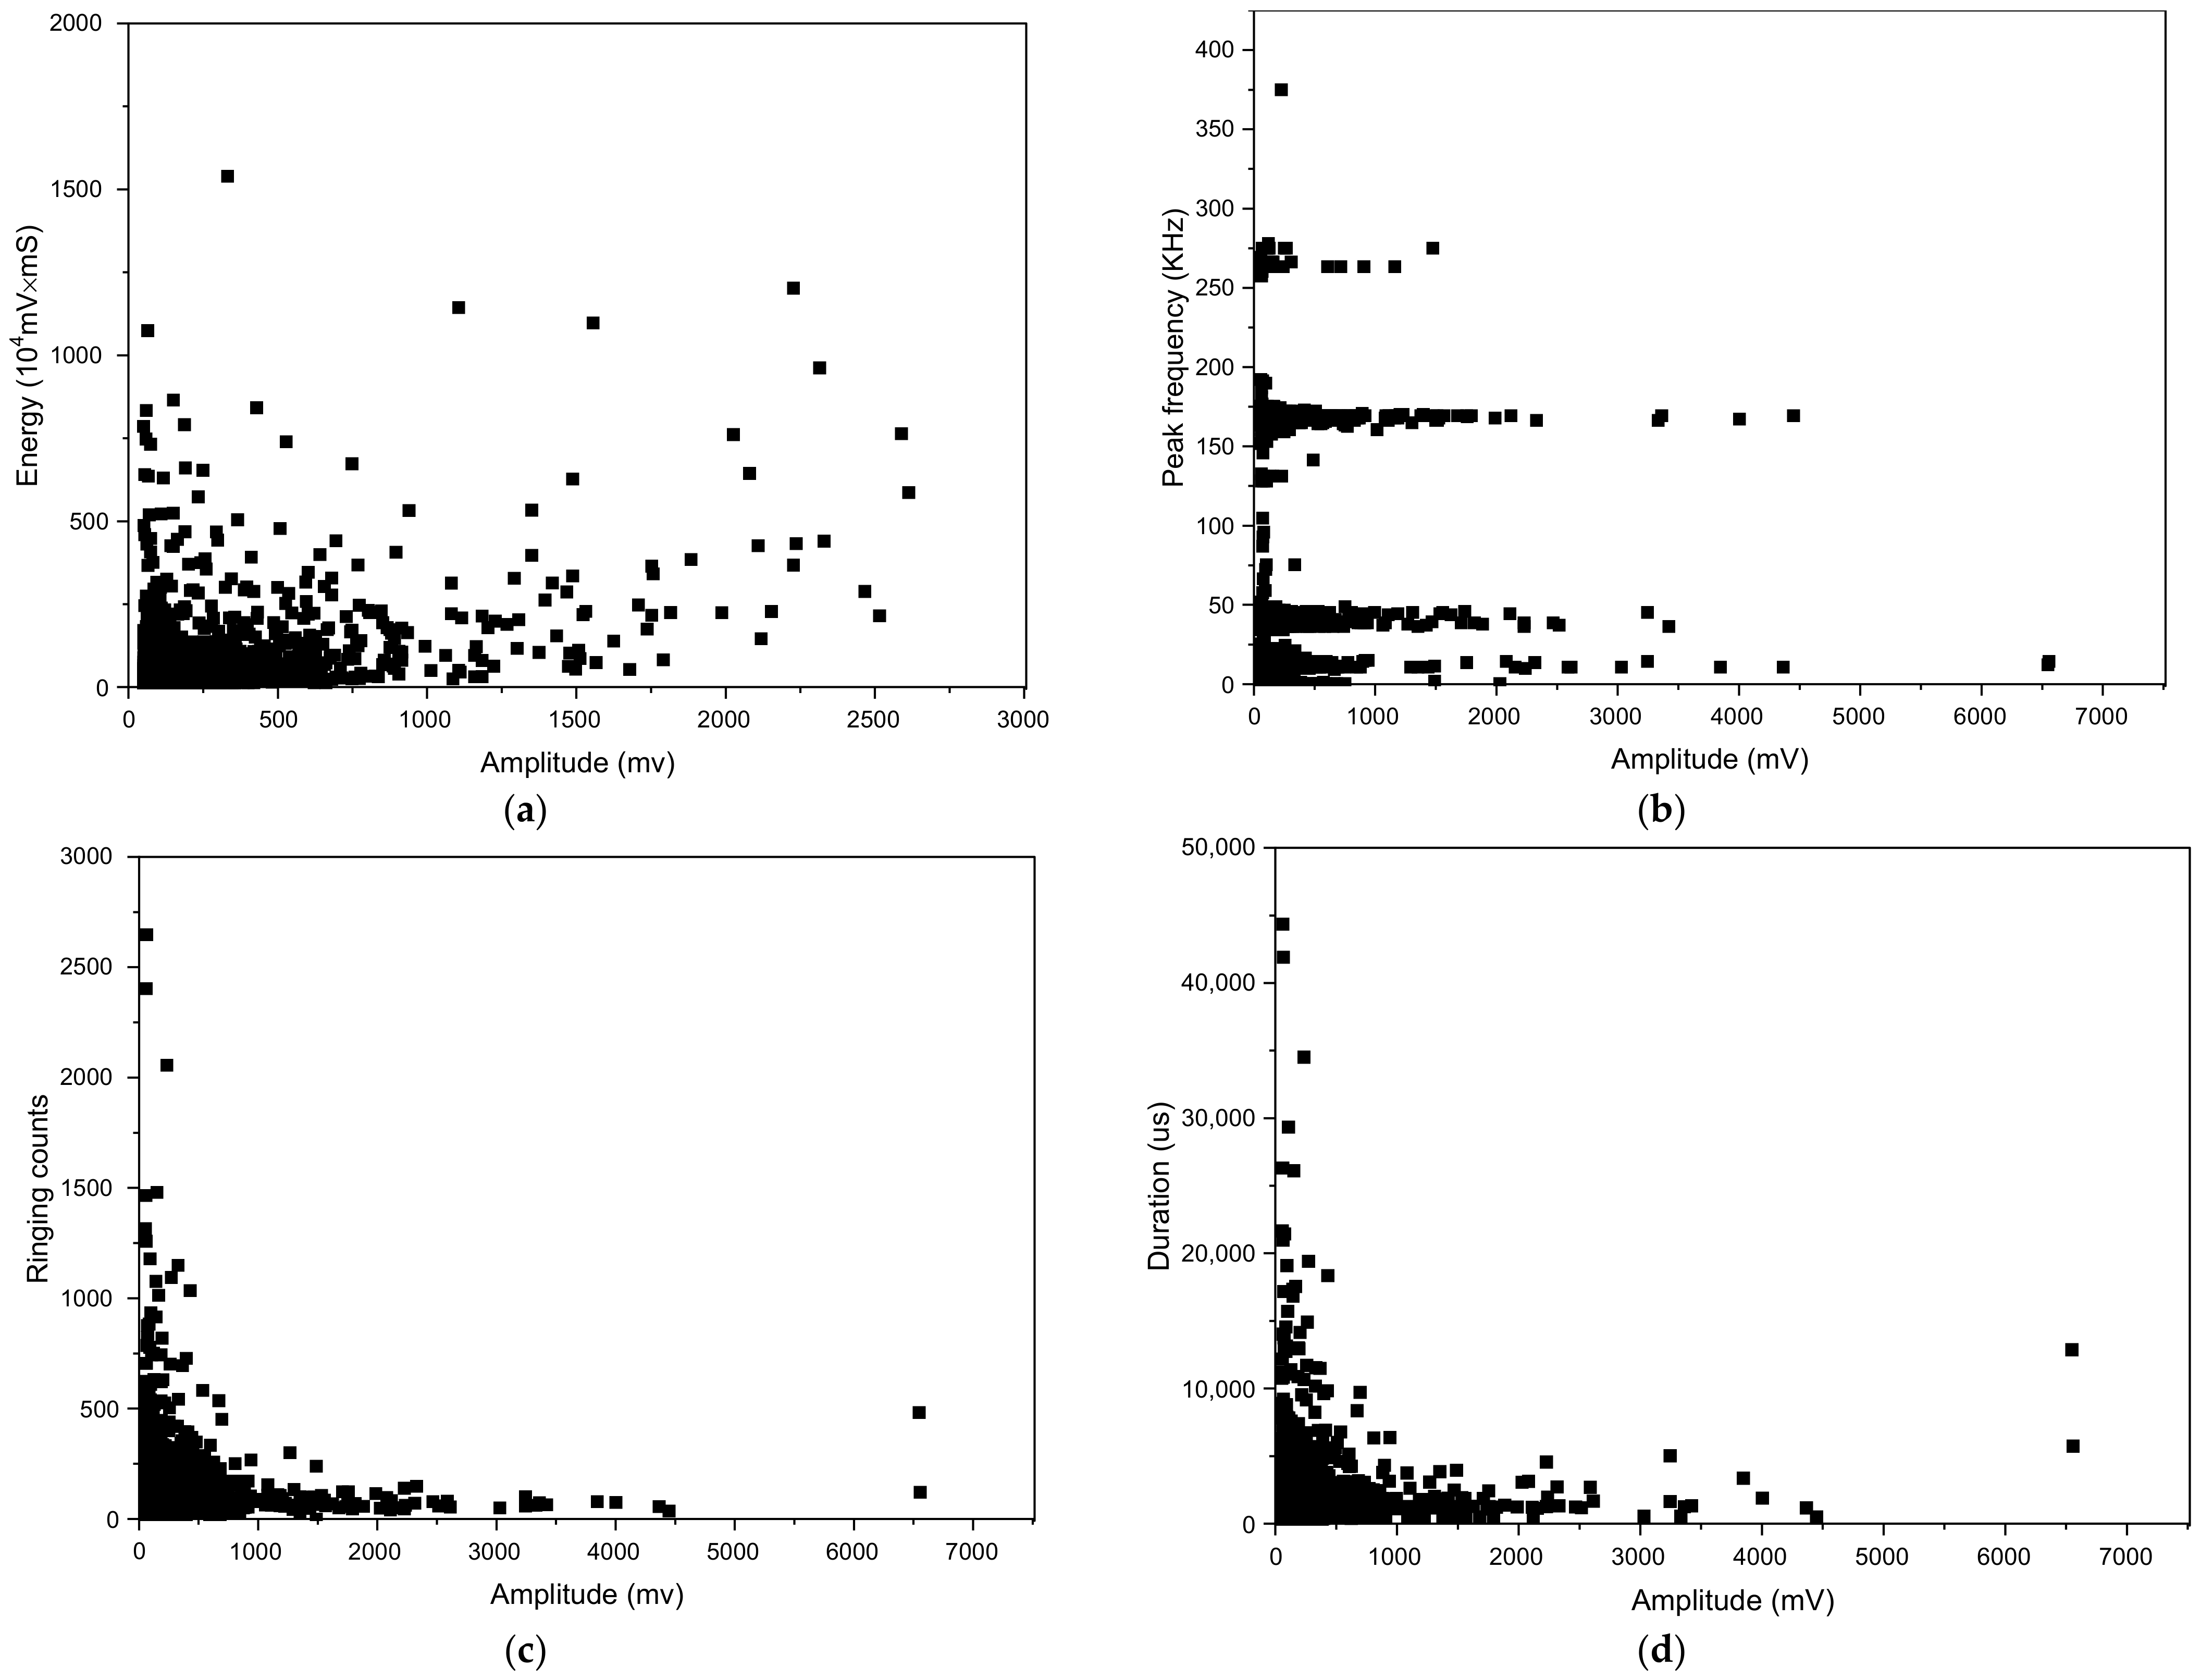
3.3. Parameter Distribution Analysis of Acoustic Emission Signal

To further analyze the parameter distribution of the acoustic emission signal, the signals are divided into an initial stage, a stable stage, and an active stage by the following characteristics:
(1)
In the ringing count history diagram, if the average value of the ringing counts for two consecutive seconds is lower than the average value of the ringing counts in the whole process, the acoustic emission signal enters the stable stage from the initial stage.
(2)
When the average value of the ringing counts for two consecutive seconds is higher than that of the ringing counts in the whole process, the acoustic emission signal enters the active stage from the stable stage.
Applying the aforementioned classification method, the distributions of impacts in terms of peak frequency for the three stages of A-7-80% samples are shown in Figure 8. It can be seen from Figure 8 that in the initial stage, the acoustic emission impacts mainly appear between 0–71 kHz, during which there are two peaks, with two major impact peaks at 12 kHz and 38 kHz, respectively. Besides, there is also a peak at around 171 kHz. In the stable stage, the acoustic emission peak frequency impacts mainly appear between 153 kHz and 180 kHz; the impact peak appears at 171 kHz. The peak frequency impacts in the active phase mainly occur between 153 kHz and 180 kHz, and its peak frequency is 171 kHz. Moreover, there are also some impacts at around 259 kHz.
The impact in the initial stage is mainly concentrated around 12 kHz and 38 kHz; the impact in the stable stage is mainly concentrated around 171 kHz, and the impact in the active stage is mainly concentrated at around 171 kHz, and the impact counts at around 259 kHz increase significantly. Most total impacts occur in the stable stage. The initial stage has the least total impacts, indicating that the damage mainly occurs in the stable and the active stages with the crack propagation and macroscopic cracking. Through the analysis of the acoustic emission impact count and peak frequency of the uniaxial compression of group A concrete samples, four characteristic intervals of the peak frequency are obtained (Table 2) to correspond to the damage mechanism of concrete, which are:
(1)
Interval I (12 ± 5 kHz): The peak value of the impact count appears at 12 kHz, which is because when the concrete sample is just stressed, the acoustic emission signal starts to be generated due to the contact between the concrete and the testing machine.
(2)
Interval II (38 ± 5 kHz): The peak value of the impact count appears at 38 kHz, which is because the original crack channel elements such as micropores, air voids, and defects in the concrete begin to be compacted under the action of external load.
(3)
Interval III (171 ± 5 kHz): The peak impact count appears at 171 kHz, due to the crack channel element being gradually compacted under the action of external load and its internal microstructure changes. Entering the stabilization stage, cracks begin to propagate in between the macropores of the interfacial zone between the aggregate and the hardened cement paste.
(4)
Interval IV (259 ± 5 kHz): The peak of the impact count appears at 259 kHz, the internal cracks in the concrete have developed from the interface cracks between the aggregate and the mortar to the interior of the mortar, and the damage and deterioration of the concrete gradually transition from the stable stage to the active stage. The cracks continue to expand, penetrate deep into the mortar, and combine to form large cracks. When the load exceeds the critical value, the macroscopic cracks form, and the specimen eventually be destroyed.
Table 2. Peak frequency—impacts count table.
StagesSources of the Acoustic EmissionHits Numbers in Different Frequencies (kHz)Total
12 ± 538 ± 5171 ± 5259 ± 5
InitialThe initial contacting of concrete and sample385825401939168353
46.19%30.41%23.21%0.19%100.00%
StableCrack propagation in concrete431172411,66627914,100
3.06%12.23%82.74%1.98%100.00%
ActiveInterface cracks between aggregate and paste, fracture of aggregate4131721830247510,911
3.79%15.77%76.09%4.35%100.00%

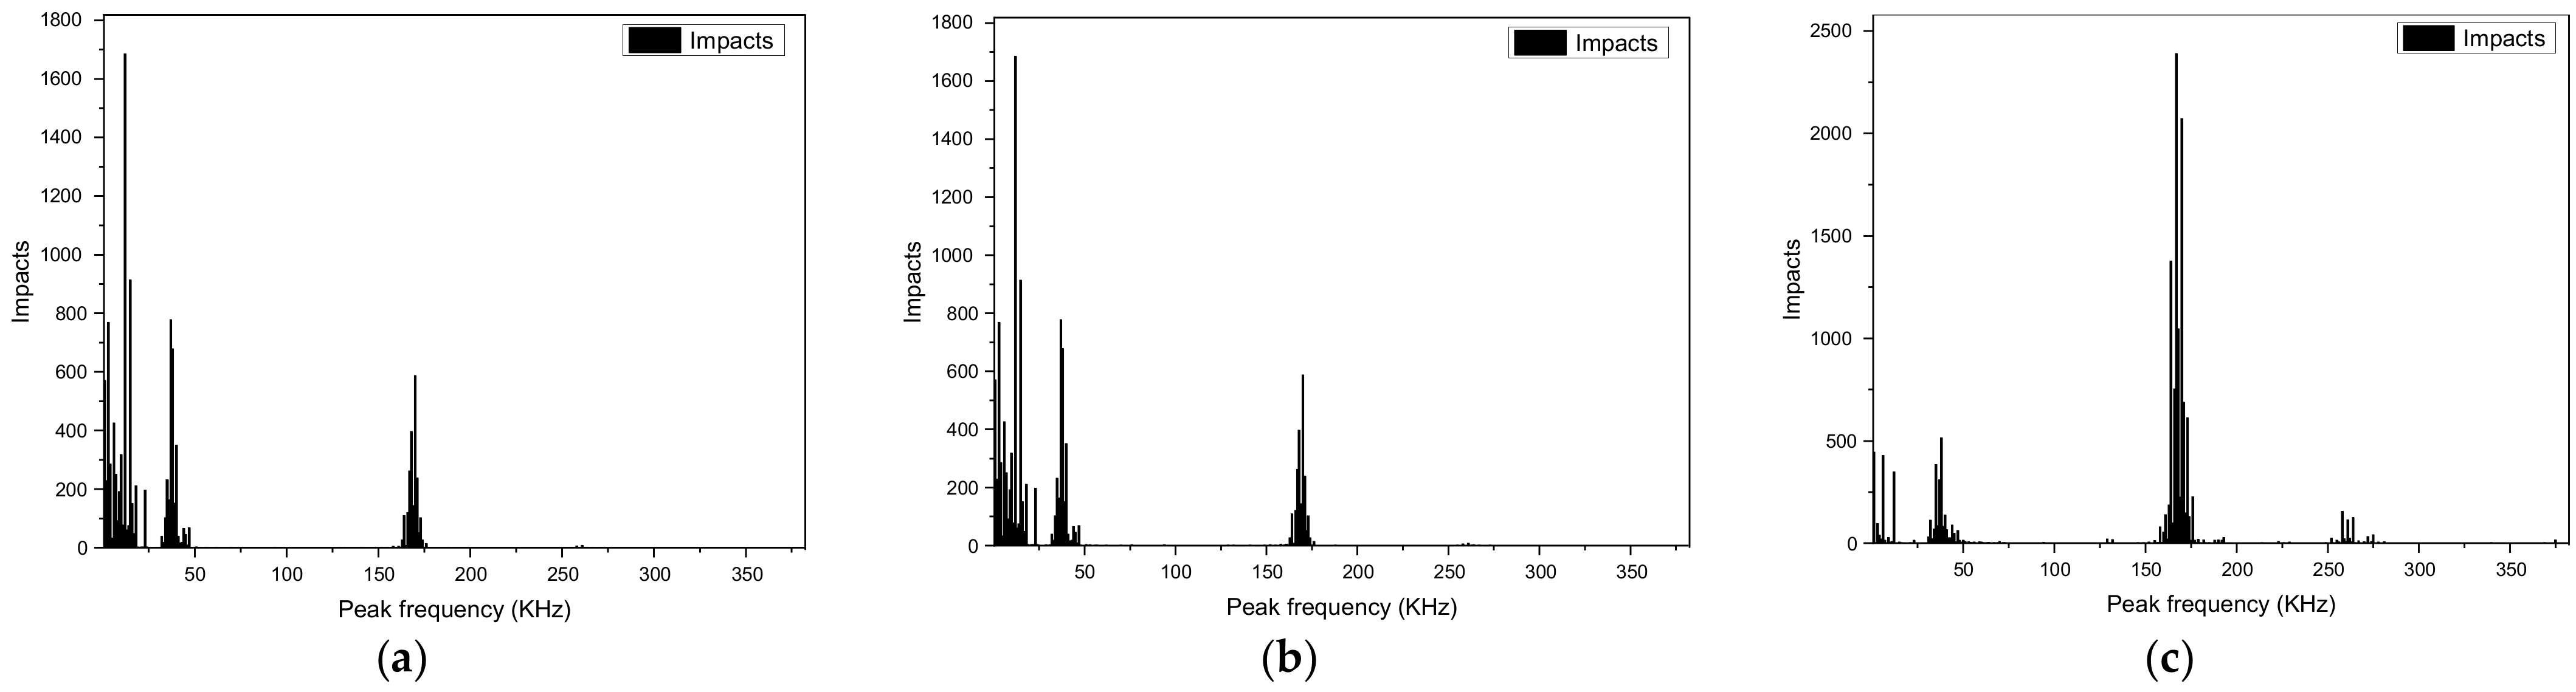
3.4. The Acoustic Emission Signal Correlation Analysis

Figure 9 and Figure 10 illustrate the acoustic emission signal correlations of A-7-80% and B-7-80% samples. Figure 9a and Figure 10a reveal that the correlation between energy and amplitude is clear. The energy of a vibration system is determined by the nature and amplitude, indicating that the concrete, as a composite system, has various acoustic emission sources (i.e., aggregate, mortar), which makes the correlation between energy and amplitude unclear.
Figure 9b and Figure 10b show an obvious correlation between peak frequency and amplitude, and there are four concentrated intervals of peak frequency. Combined with the analysis in the previous section, it shows that there are four kinds of acoustic emission sources in the concrete. In Figure 9b and Figure 10b, the peak frequencies are about 38 kHz and 171 kHz. The amplitude ranges are 0–4000 mv and 0–8000 mv, respectively, and a large number of acoustic emission signals are concentrated, indicating that there are two main types of acoustic emission sources for concrete materials, and the peak frequencies are about 38 kHz and 171 kHz, respectively.
Figure 9c and Figure 10c reveal that the ringing count and the amplitude have a clear relationship. The ringing count decreases with the increase of amplitude. Power relationships are obtained for group A and group B concrete samples. Compared with group A concrete, the signals of group B concrete with amplitude less than 1000 mv and ringing count less than 500 increased significantly.
The relationships between duration and amplitude are shown in Figure 9d and Figure 10d. It can be seen from the figures that there are obvious power relationships between the duration and the amplitude. The correlation plot of count and amplitude is very similar, indicating a close relationship between the duration, the ringing count, and the amplitude. The ringing count of group A concrete is between 0–5000, the duration is between 0–7000 μs, and the amplitude is between 0–8000 dB; the ringing count of group B concrete is between 0–2500, and the duration is between 0–4500 μs, the amplitude is between 0–7000 dB.

4. Conclusions

In this work, the influences of pre-loading degree and pre-loading age on compressive strength development were studied. The influence of the addition of supplementary cementitious materials (SCMs) on compressive strength development was investigated. The acoustic emission signals were tested during the uniaxial compression tests and analyzed. The main conclusions can be drawn as follows:
(1)
The pozzolanic reaction healed the damage caused by the pre-loading. The compressive strength of group B concrete at 270 d after pre-loading was higher than that of the group A concrete.
(2)
The damage threshold of early-age concrete is not static and is closely related to the age and concrete mix ratio, which influences the acoustic emission signals. The experimental results indicate that the 80% pre-loading degree at 3 d exceeds the damage threshold, which cannot be effectively healed following the curing process. For 7 d and 14 d concrete, the damage caused by 80% pre-loading degree can be effectively cured. For 28 d concrete, the 80% pre-loading might not exceed the damage threshold, but due to the high hydration degree, there was not enough cement for further hydration to heal the damage.
(3)
The acoustic emission characteristics of concrete during uniaxial compression can be divided into the initial stage, stable stage, and active stage. The peak frequency of the uniaxial compression acoustic emission of concrete can be divided into four frequency intervals to correspond to different damage mechanisms of concrete, namely: interval I (12 ± 5 kHz), interval II (38 kHz ± 5 kHz), interval III (171 kHz ± 5 kHz), interval IV (259 kHz ± 5 kHz).
It is suggested that the acoustic emission method can be reliable for studying the healing effect of concrete incorporated with SCMs. Also, for field practice, it is recommended that the SCMs can be added to a raw concrete mixture as an effective crack healing agent.

Author Contributions

Conceptualization, Z.C. and R.H.; investigation, X.J.; data curation, Z.C.; methodology, R.H.; visualization, R.H.; formal analysis, R.H.; writing—original draft, Z.C. and R.H.; writing—review and editing, Z.C., X.J. and R.H.; project administration, R.H.; funding acquisition, X.J.; validation, R.H.; resources, R.H. All authors have read and agreed to the published version of the manuscript.

Funding

The financial support from the National Basic Research Program (973 Program) (Grant No. 2015CB655103) of the China is gratefully acknowledged.

Institutional Review Board Statement

Not applicable.

Informed Consent Statement

Not applicable.

Data Availability Statement

The data presented in this study are available on request from the corresponding author.

Conflicts of Interest

The authors declare no conflict of interest.

References

  1. An, J.; Kim, S.; Nam, B.; Durham, S. Effect of Aggregate Mineralogy and Concrete Microstructure on Thermal Expansion and Strength Properties of Concrete. Appl. Sci. 2017, 7, 1307. [Google Scholar] [CrossRef] [Green Version]
  2. Li, Y.; Chen, J.; Wen, L.; Wang, J.; Li, K. Study of the Damage Evolution of Concrete with Different Initial Defect Rates under Uniaxial Compression with Acoustic Emission Technology. Adv. Cem. Res. 2021, 20, 1–27. [Google Scholar] [CrossRef]
  3. He, R.; Li, S.; Fu, C.; Zhou, K.; Dong, Z. Influence of cyclic drying-wetting and carbonation on oxygen diffusivity of cementitious materials: Interpretation from the perspective of microstructure. J. Mater. Civ. Eng. 2022, 22, 741–751. [Google Scholar] [CrossRef]
  4. Fu, C.; Li, S.; He, R.; Zhou, K.; Zhang, Y. Chloride profile characterization by electron probe microanalysis, powder extraction and AgNO3 colorimetric: A comparative study. Constr. Build. Mater. 2022, 341, 127892. [Google Scholar] [CrossRef]
  5. Chen, Z.; Fu, C.; Ling, Y.; Jin, X. Dynamic fracture catastrophe model of concrete beam under static load. Comput. Concr. 2020, 25, 517–523. [Google Scholar] [CrossRef]
  6. Świt, G.; Zapała-Sławeta, J. Application of acoustic emission to monitoring the course of the alkali-silica reaction. Bull. Polish Acad. Sci. Tech. Sci. 2020, 68, 169–178. [Google Scholar] [CrossRef]
  7. Hasheminejad, N.; Vuye, C.; Margaritis, A.; Ribbens, B.; Jacobs, G.; Blom, J.; Van den bergh, W.; Dirckx, J.; Vanlanduit, S. Investigation of Crack Propagation and Healing of Asphalt Concrete Using Digital Image Correlation. Appl. Sci. 2019, 9, 2459. [Google Scholar] [CrossRef] [Green Version]
  8. Zezulová, E.; Hasilová, K.; Dvořák, P.; Dubec, B.; Komárková, T.; Štoller, J. Experimental Campaign to Verify the Suitability of Ultrasound Testing Method for Steel Fiber Reinforced Concrete Fortification Structures. Appl. Sci. 2021, 11, 8759. [Google Scholar] [CrossRef]
  9. He, R.; Ma, H.; Hafiz, R.B.; Fu, C.; Jin, X.; He, J. Determining porosity and pore network connectivity of cement-based materials by a modified non-contact electrical resistivity measurement: Experiment and theory. Mater. Des. 2018, 156, 82–92. [Google Scholar] [CrossRef]
  10. He, R.; Ye, H.; Ma, H.; Fu, C.; Jin, X.; Li, Z. Correlating the Chloride Diffusion Coefficient and Pore Structure of Cement-Based Materials Using Modified Noncontact Electrical Resistivity Measurement. J. Mater. Civ. Eng. 2019, 31, 04019006. [Google Scholar] [CrossRef]
  11. He, R.; Fu, C.; Ma, H.; Ye, H.; Jin, X. Prediction of Effective Chloride Diffusivity of Cement Paste and Mortar from Microstructural Features. J. Mater. Civ. Eng. 2020, 32, 04020211. [Google Scholar] [CrossRef]
  12. Vicente, M.A.; Mena, Á.; Mínguez, J.; González, D.C. Use of computed tomography scan technology to explore the porosity of concrete: Scientific possibilities and technological limitations. Appl. Sci. 2021, 11, 8699. [Google Scholar] [CrossRef]
  13. Prosser, W.H. Advanced AE Techniques in Composite Materials Research. J. Acoust. Emiss. 1996, 14, S1–S11. [Google Scholar]
  14. Suzuki, T.; Shimamoto, Y. Damage evaluation in concrete materials by acoustic emission. In Acoustic Emission and Related Non-Destructive Evaluation Techniques in the Fracture Mechanics of Concrete; Elsevier: Amsterdam, The Netherlands, 2021; pp. 1–17. ISBN 9780128221365. [Google Scholar]
  15. Gu, Q.; Ma, Q.; Tan, Y.; Jia, Z.; Zhao, Z.; Huang, D. Acoustic emission characteristics and damage model of cement mortar under uniaxial compression. Constr. Build. Mater. 2019, 213, 377–385. [Google Scholar] [CrossRef]
  16. Holan, J.; Novák, J.; Müller, P.; Štefan, R. Experimental investigation of the compressive strength of normal-strength air-entrained concrete at high temperatures. Constr. Build. Mater. 2020, 248, 118662. [Google Scholar] [CrossRef]
  17. De Belie, N.; Gruyaert, E.; Al-Tabbaa, A.; Antonaci, P.; Baera, C.; Bajare, D.; Darquennes, A.; Davies, R.; Ferrara, L.; Jefferson, T.; et al. A Review of Self-Healing Concrete for Damage Management of Structures. Adv. Mater. Interfaces 2018, 5, 1800074. [Google Scholar] [CrossRef]
  18. Yang, Y.; Yang, E.H.; Li, V.C. Autogenous healing of engineered cementitious composites at early age. Cem. Concr. Res. 2011, 41, 176–183. [Google Scholar] [CrossRef]
  19. Ahn, T.-H.; Kishi, T. Crack Self-healing Behavior of Cementitious Composites Incorporating Various Mineral Admixtures. J. Adv. Concr. Technol. 2010, 8, 171–186. [Google Scholar] [CrossRef] [Green Version]
  20. Sahmaran, M.; Yildirim, G.; Erdem, T.K. Self-healing capability of cementitious composites incorporating different supplementary cementitious materials. Cem. Concr. Compos. 2013, 35, 89–101. [Google Scholar] [CrossRef] [Green Version]
  21. Zhang, Z.; Qian, S.; Ma, H. Investigating mechanical properties and self-healing behavior of micro-cracked ECC with different volume of fly ash. Constr. Build. Mater. 2014, 52, 17–23. [Google Scholar] [CrossRef]
  22. Abdel-Jawad, Y.; Haddad, R. Effect of Early Overloading of Concrete on. Cem. Concr. Res. 1992, 22, 927–936. [Google Scholar] [CrossRef]
  23. Şahmaran, M.; Keskin, S.B.; Ozerkan, G.; Yaman, I.O. Self-healing of mechanically-loaded self consolidating concretes with high volumes of fly ash. Cem. Concr. Compos. 2008, 30, 872–879. [Google Scholar] [CrossRef]
Figure 1. 8- channel DS2-B series acoustic emission testing system.
Applsci 12 05871 g001
Figure 2. The layout of sensors on a concrete surface. (a) The configuration of 8 sensors on a concrete surface. (b) The photo of the testing setup.
Applsci 12 05871 g002aApplsci 12 05871 g002b
Figure 3. Compressive strength development of concrete samples.
Applsci 12 05871 g003
Figure 4. The relative compressive ratio results between pre-loading samples and virgin samples.
Applsci 12 05871 g004
Figure 5. Acoustic emission waveforms of 8 channels during the whole loading process.
Applsci 12 05871 g005
Figure 6. Counts, stress, and energy in terms of loading time of A-80% concrete samples of different pre-loading stages. (a) A-3-80% counts and stress development. (b) A-3-80% energy development. (c) A-7-80% counts and stress development. (d) A-7-80% energy development. (e) A-14-80% counts and stress development. (f) A-14-80% energy development. (g) A-28-80% counts and stress development. (h) A-28-80% energy development.
Applsci 12 05871 g006aApplsci 12 05871 g006b
Figure 7. Counts, stress, and energy in terms of loading time of B-80% concrete samples of different pre-loading stages. (a) B-3-80% counts and stress development. (b) B-3-80% energy development. (c) B-7-80% counts and stress development. (d) B-7-80% energy development. (e) B-14-80% counts and stress development. (f) B-14-80% energy development. (g) B-28-80% counts and stress development. (h) B-28-80% energy development.
Applsci 12 05871 g007aApplsci 12 05871 g007b
Figure 8. The distribution of impacts in terms of the peak frequency of A-7-80% samples for three stages. (a) Initial stage. (b) Stable stage. (c) Active stage.
Applsci 12 05871 g008
Figure 9. The acoustic emission signal correlations of the A-7-80% sample. (a) The total energy in terms of amplitude. (b) The frequency of the peak in terms of amplitude. (c) The ringing counts in terms of amplitude. (d) The duration in terms of amplitude.
Applsci 12 05871 g009
Figure 10. The acoustic emission signal correlations of the B-7-80% sample. (a) The total energy in terms of amplitude. (b) The frequency of the peak in terms of amplitude. (c) The ringing counts in terms of amplitude. (d) The duration in terms of amplitude.
Applsci 12 05871 g010
Table 1. Mixture compositions (kg/m3).
MixturesCementFly AshSlagFine AggregateCoarse AggregateWater
A372006981116175
B24256746981116175
Publisher’s Note: MDPI stays neutral with regard to jurisdictional claims in published maps and institutional affiliations.

