
Classifying Breast Density from Mammogram with Pretrained CNNs and Weighted Average Ensembles


Abstract
:1. Introduction
1.1. Breast Density
1.2. Convolutional Neural Network (CNN)
1.3. Transfer Learning and Pre-Trained CNNs
2. Related Works
3. Methodology
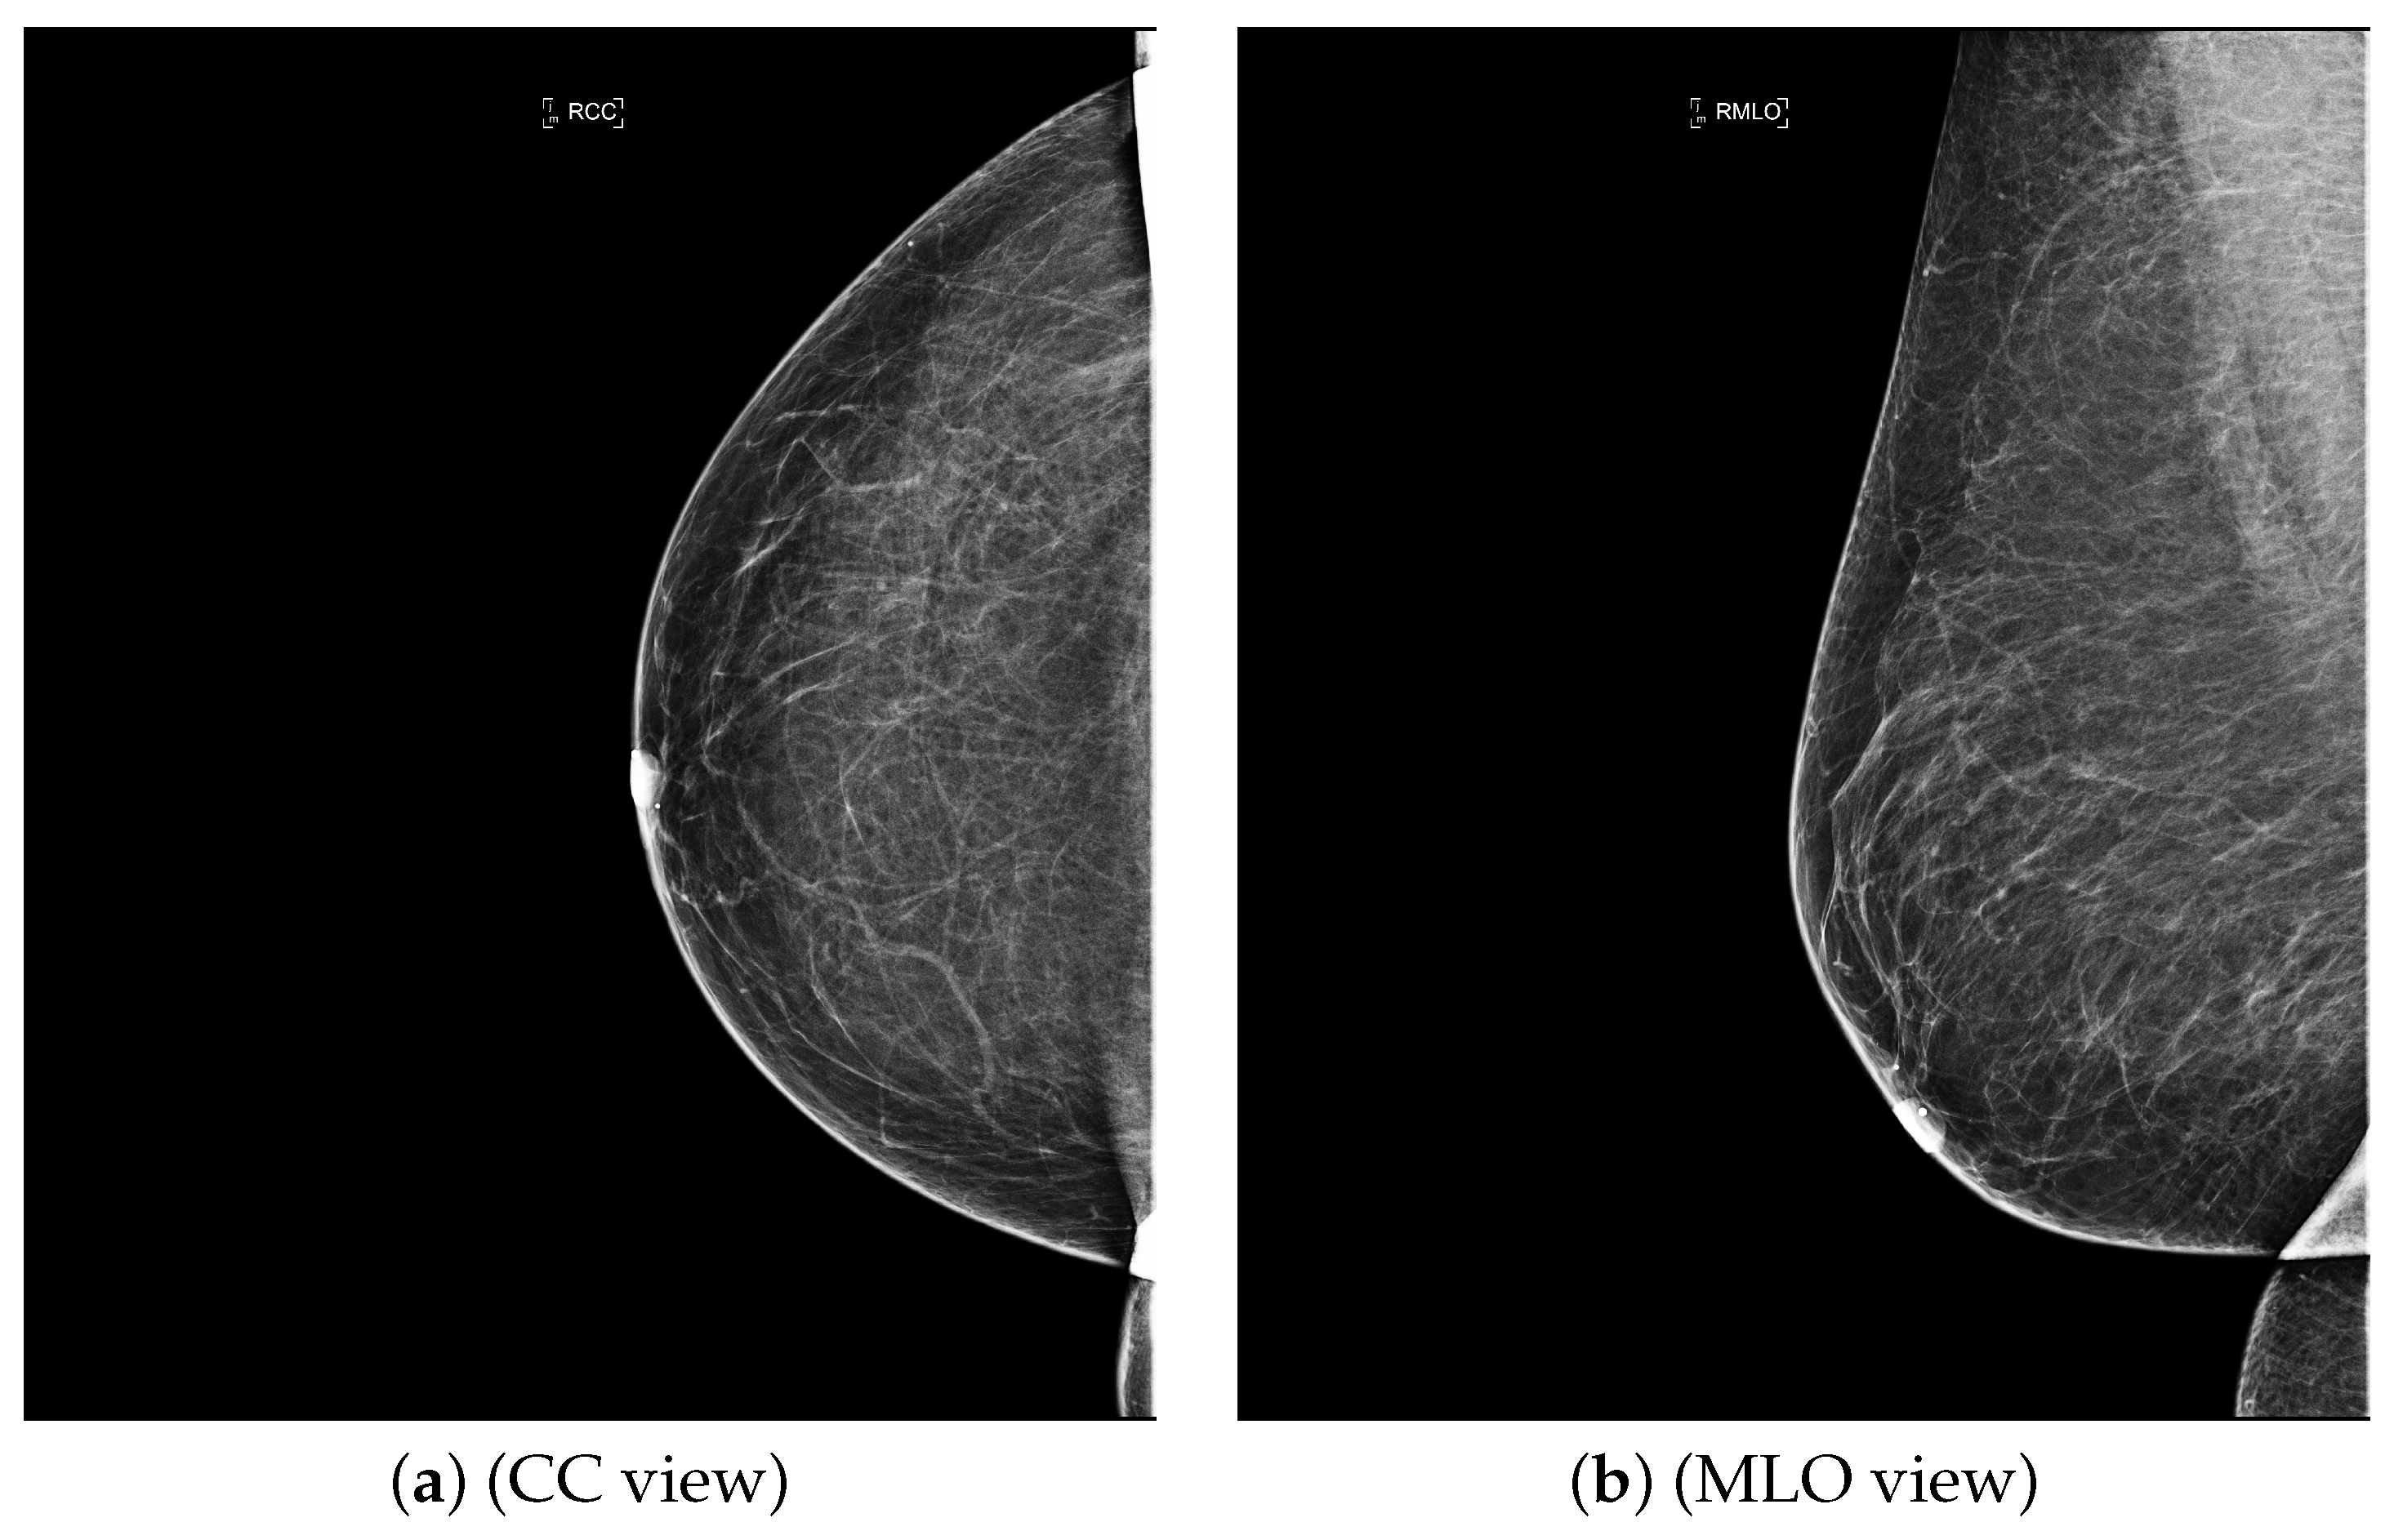
3.1. Dataset
3.2. Data Preparation
3.3. Pre-Trained Model
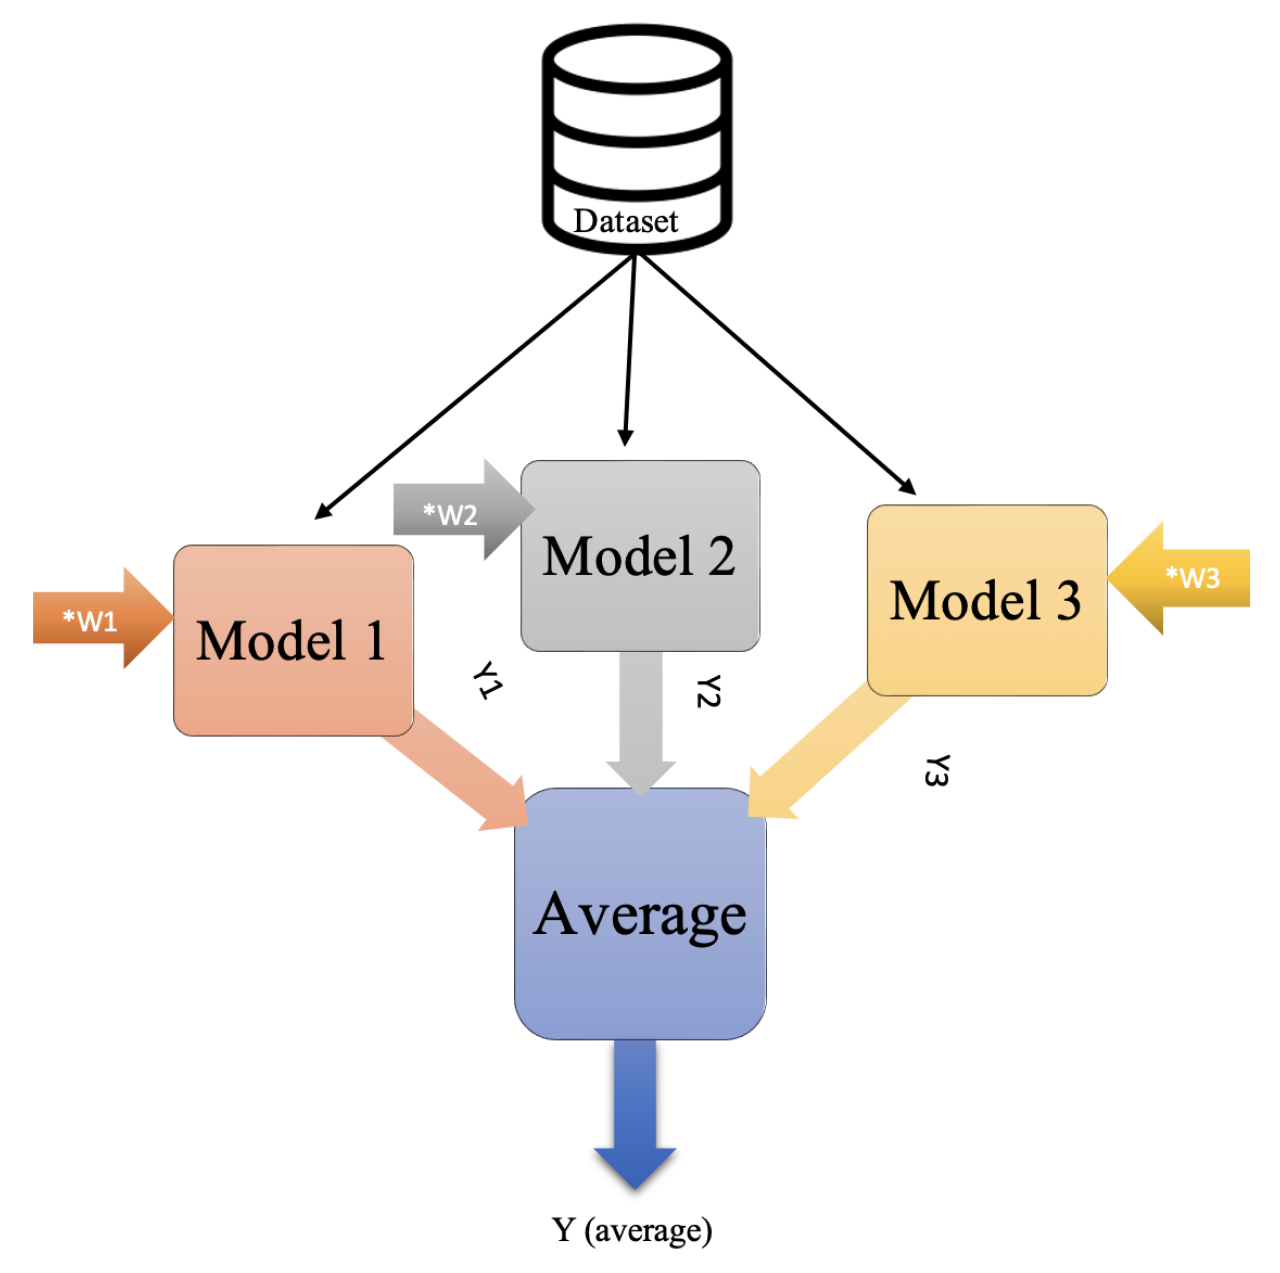
3.4. Average Ensembles
3.5. Experimental Tools
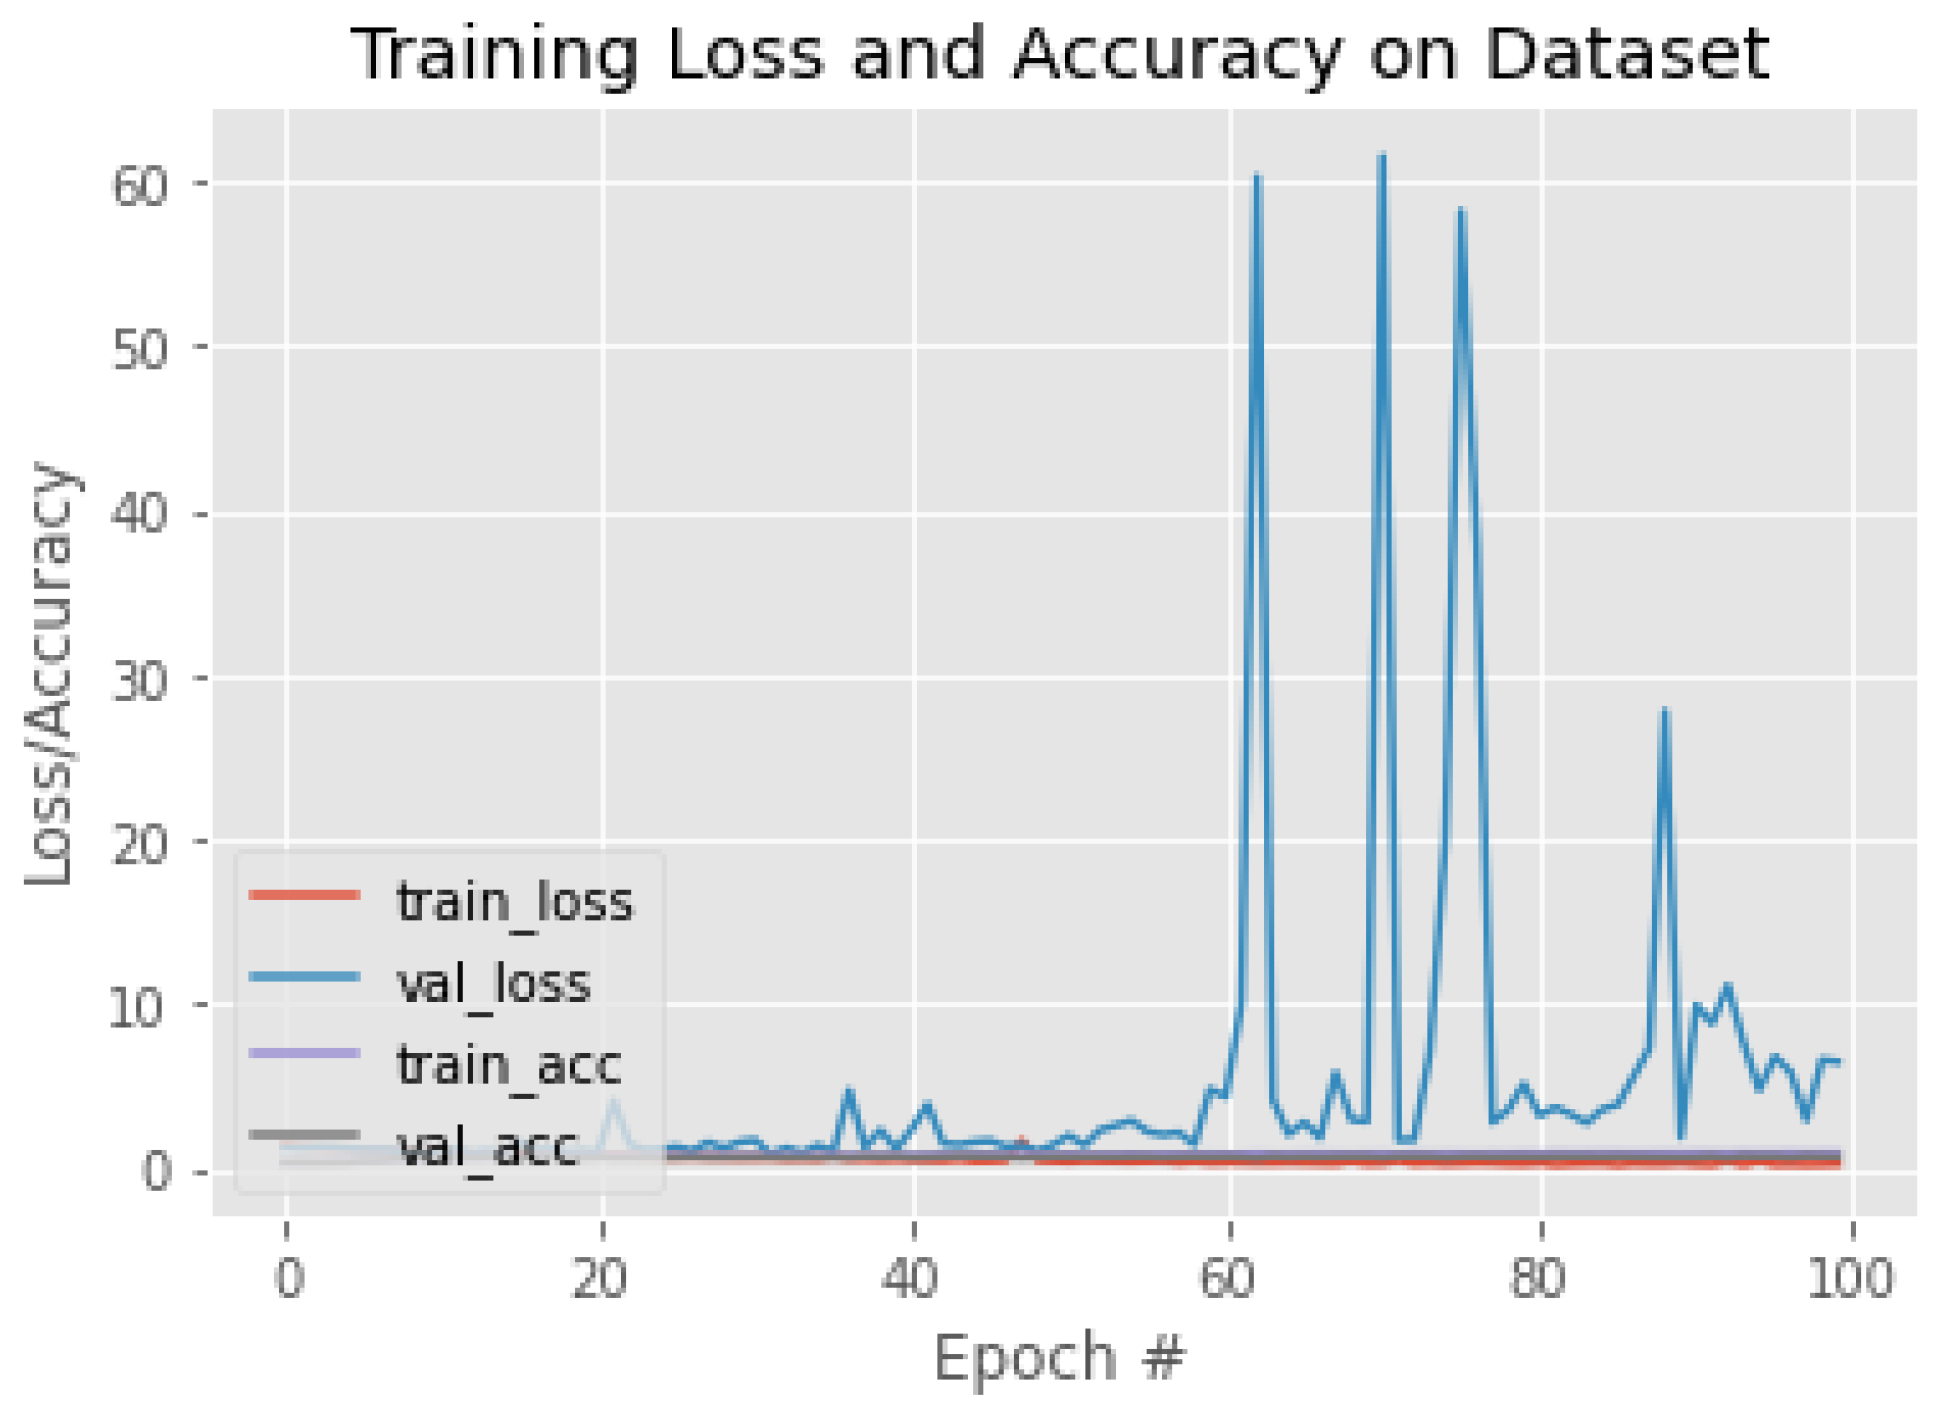
4. Results and Discussion
5. Conclusions
Author Contributions
Funding
Institutional Review Board Statement
Informed Consent Statement
Acknowledgments
Conflicts of Interest
Abbreviations
| AI | Artificial Intelligence |
| BI-RADS | Breast imaging-reporting and data system |
| CNN | Convolutional neural network |
| DICOM | Digital image communication in medicine |
| KAMC | King Abdulaziz Medical City |
| RMS prop | Root mean square propagation |
References
- Bradley, W.G. History of medical imaging. Proc. Am. Philos. Soc. 2008, 152, 349–361. [Google Scholar] [PubMed]
- Giger, M.L. Machine learning in medical imaging. J. Am. Coll. Radiol. 2018, 15, 512–520. [Google Scholar] [CrossRef] [PubMed]
- Sung, H.; Ferlay, J.; Siegel, R.L.; Laversanne, M.; Soerjomataram, I.; Jemal, A.; Bray, F. Global cancer statistics 2020: GLOBOCAN estimates of incidence and mortality worldwide for 36 cancers in 185 countries. CA Cancer J. Clin. 2021, 71, 209–249. [Google Scholar] [CrossRef] [PubMed]
- Alotaibi, R.M.; Rezk, H.R.; Juliana, C.I.; Guure, C. Breast cancer mortality in Saudi Arabia: Modelling observed and unobserved factors. PLoS ONE 2018, 13, e0206148. [Google Scholar] [CrossRef] [PubMed]
- Reinisch, M.; Seiler, S.; Hauzenberger, T.; Kamischke, A.; Schmatloch, S.; Strittmatter, H.J.; Zahm, D.M.; Thode, C.; Furlanetto, J.; Strik, D.; et al. Efficacy of endocrine therapy for the treatment of breast cancer in men: Results from the MALE phase 2 randomized clinical trial. JAMA Oncol. 2021, 7, 565–572. [Google Scholar] [CrossRef]
- Alqahtani, W.S.; Almufareh, N.A.; Domiaty, D.M.; Albasher, G.; Alduwish, M.A.; Alkhalaf, H.; Almuzzaini, B.; Al-Marshidy, S.S.; Alfraihi, R.; Elasbali, A.M.; et al. Epidemiology of cancer in Saudi Arabia thru 2010–2019: A systematic review with constrained meta-analysis. AIMS Public Health 2020, 7, 679. [Google Scholar]
- Ministry of Health, Cancerous Diseases, Breast Cancer 2018. Available online: https://www.moh.gov.sa/en/HealthAwareness/EducationalContent/Diseases/Cancer/Pages/Cancer-2012-01-18-001.aspx (accessed on 12 September 2021).
- Kerlikowske, K.; Miglioretti, D.L.; Vachon, C.M. Discussions of Dense Breasts, Breast Cancer Risk, and Screening Choices in 2019. JAMA 2019, 322, 69–70. [Google Scholar] [CrossRef]
- Saha, D.; Vaishnav, N.; Jha, A.K. Imaging Techniques for Breast Cancer Diagnosis. In Biomedical Computing for Breast Cancer Detection and Diagnosis; IGI Global: Hershey, PA, USA, 2021; pp. 188–210. [Google Scholar]
- Jafari, S.H.; Saadatpour, Z.; Salmaninejad, A.; Momeni, F.; Mokhtari, M.; Nahand, J.S.; Rahmati, M.; Mirzaei, H.; Kianmehr, M. Breast cancer diagnosis: Imaging techniques and biochemical markers. J. Cell. Physiol. 2018, 233, 5200–5213. [Google Scholar] [CrossRef]
- Breast Cancer, R.T. Mammography 2019. Available online: https://www.radiologyinfo.org/en/info.cfm?pg=mammo#top/ (accessed on 4 April 2021).
- Komen, S.G. Imaging Methods Used to Find Breast Cancer; 2016; Available online: https://www.komen.org/wp-content/uploads/Imaging-Methods-used-to-Find-Breast-Cancer.pdf (accessed on 4 April 2021).
- Wolstencroft, R.T.W. Digital Database for Screening Mammography 2006, Computer Vision and Pattern Recognition. Available online: http://www.eng.usf.edu/cvprg/Mammography/Database.html (accessed on 30 September 2020).
- Moghbel, M.; Ooi, C.Y.; Ismail, N.; Hau, Y.W.; Memari, N. A review of breast boundary and pectoral muscle segmentation methods in computer-aided detection/diagnosis of breast mammography. Artif. Intell. Rev. 2019, 53, 1873–1918. [Google Scholar] [CrossRef]
- Center for Disease Control and Prevention. What Does It Mean to Have Dense Breasts? 2020. Available online: https://www.cdc.gov/cancer/breast/basic_info/dense-breasts.htm (accessed on 16 March 2021).
- Daniaux, M.; Gruber, L.; Santner, W.; Czech, T.; Knapp, R. Interval breast cancer: Analysis of occurrence, subtypes and implications for breast cancer screening in a model region. Eur. J. Radiol. 2021, 143, 109905. [Google Scholar] [CrossRef]
- Ali, E.A.; Raafat, M. Relationship of mammographic densities to breast cancer risk. Egypt. J. Radiol. Nucl. Med. 2021, 52, 1–5. [Google Scholar] [CrossRef]
- Mistry, K.A.; Thakur, M.H.; Kembhavi, S.A. The effect of chemotherapy on the mammographic appearance of breast cancer and correlation with histopathology. Br. J. Radiol. 2016, 89, 20150479. [Google Scholar] [CrossRef] [PubMed] [Green Version]
- Education, I.C. Convolutional Neural Networks 2020. Available online: https://www.ibm.com/cloud/learn/convolutional-neural-networks (accessed on 22 April 2022).
- Sebastian Raschka, V.M. Python Machine Learning; Packt: Birmingham, UK, 2017. [Google Scholar]
- Brownlee, J. How to Choose Loss Functions When Training Deep Learning Neural Networks. 2020. Available online: https://machinelearningmastery.com/how-to-choose-loss-functions-when-training-deep-learning-neural-networks/ (accessed on 12 January 2022).
- Gupta, A. A Comprehensive Guide on Deep Learning Optimizers. 2021. Available online: https://www.analyticsvidhya.com/blog/2021/10/a-comprehensive-guide-on-deep-learning-optimizers/ (accessed on 16 December 2021).
- Hamdia, K.M.; Ghasemi, H.; Bazi, Y.; AlHichri, H.; Alajlan, N.; Rabczuk, T. A novel deep learning based method for the computational material design of flexoelectric nanostructures with topology optimization. Finite Elem. Anal. Des. 2019, 165, 21–30. [Google Scholar] [CrossRef]
- Zhuang, F.; Qi, Z.; Duan, K.; Xi, D.; Zhu, Y.; Zhu, H.; Xiong, H.; He, Q. A comprehensive survey on transfer learning. Proc. IEEE 2020, 109, 43–76. [Google Scholar] [CrossRef]
- Wu, Y.; Qin, X.; Pan, Y.; Yuan, C. Convolution neural network based transfer learning for classification of flowers. In Proceedings of the 2018 IEEE 3rd international conference on signal and image processing (ICSIP), Shenzhen, China, 13–15 July 2018; pp. 562–566. [Google Scholar]
- Tsochatzidis, L.; Costaridou, L.; Pratikakis, I. Deep learning for breast cancer diagnosis from mammograms—A comparative study. J. Imaging 2019, 5, 37. [Google Scholar] [CrossRef] [Green Version]
- Keras Applications 2022. Available online: https://keras.io/api/applications/ (accessed on 16 November 2021).
- Dang, A.T. Accuracy and Loss: Things to Know about The Top 1 and Top 5 Accuracy. 2021. Available online: https://towardsdatascience.com/accuracy-and-loss-things-to-know-about-the-top-1-and-top-5-accuracy-1d6beb8f6df3 (accessed on 20 May 2021).
- Russakovsky, O.; Deng, J.; Su, H.; Krause, J.; Satheesh, S.; Ma, S.; Huang, Z.; Karpathy, A.; Khosla, A.; Bernstein, M.; et al. Imagenet large scale visual recognition challenge. Int. J. Comput. Vis. 2015, 115, 211–252. [Google Scholar] [CrossRef] [Green Version]
- Maskarinec, G.; Meng, L.; Ursin, G. Ethnic differences in mammographic densities. Int. J. Epidemiol. 2001, 30, 959–965. [Google Scholar] [CrossRef] [Green Version]
- Maskarinec, G.; Pagano, I.; Chen, Z.; Nagata, C.; Gram, I.T. Ethnic and geographic differences in mammographic density and their association with breast cancer incidence. Breast Cancer Res. Treat. 2007, 104, 47–56. [Google Scholar] [CrossRef]
- Wu, N.; Geras, K.J.; Shen, Y.; Su, J.; Kim, S.G.; Kim, E.; Wolfson, S.; Moy, L.; Cho, K. Breast density classification with deep convolutional neural networks. In Proceedings of the 2018 IEEE International Conference on Acoustics, Speech and Signal Processing (ICASSP), Calgary, AB, Canada, 15–20 April 2018; pp. 6682–6686. [Google Scholar]
- Shi, P.; Wu, C.; Zhong, J.; Wang, H. Deep Learning from Small Dataset for BI-RADS Density Classification of Mammography Images. In Proceedings of the 2019 10th International Conference on Information Technology in Medicine and Education (ITME), Qingdao, China, 23–25 August 2019; pp. 102–109. [Google Scholar]
- Deng, J.; Ma, Y.; Li, D.a.; Zhao, J.; Liu, Y.; Zhang, H. Classification of breast density categories based on SE-Attention neural networks. Comput. Methods Programs Biomed. 2020, 193, 105489. [Google Scholar] [CrossRef]
- Gandomkar, Z.; Suleiman, M.E.; Demchig, D.; Brennan, P.C.; McEntee, M.F. BI-RADS density categorization using deep neural networks. In Medical Imaging 2019: Image Perception, Observer Performance, and Technology Assessment; SPIE: San Diego, CA, USA, 2019; Volume 10952, pp. 149–155. [Google Scholar]
- Tardy, M.; Scheffer, B.; Mateus, D. Breast Density Quantification Using Weakly Annotated Dataset. In Proceedings of the 2019 IEEE 16th International Symposium on Biomedical Imaging (ISBI 2019), Venice, Italy, 8–11 April 2019; pp. 1087–1091. [Google Scholar]
- Lehman, C.D.; Yala, A.; Schuster, T.; Dontchos, B.; Bahl, M.; Swanson, K.; Barzilay, R. Mammographic breast density assessment using deep learning: Clinical implementation. Radiology 2019, 290, 52–58. [Google Scholar] [CrossRef] [Green Version]
- Saffari, N.; Rashwan, H.A.; Abdel-Nasser, M.; Kumar Singh, V.; Arenas, M.; Mangina, E.; Herrera, B.; Puig, D. Fully Automated Breast Density Segmentation and Classification Using Deep Learning. Diagnostics 2020, 10, 988. [Google Scholar] [CrossRef] [PubMed]
- Ciritsis, A.; Rossi, C.; Vittoria De Martini, I.; Eberhard, M.; Marcon, M.; Becker, A.S.; Berger, N.; Boss, A. Determination of mammographic breast density using a deep convolutional neural network. Br. J. Radiol. 2019, 92, 20180691. [Google Scholar] [CrossRef] [PubMed]
- Ma, X.; Fisher, C.; Wei, J.; Helvie, M.A.; Chan, H.P.; Zhou, C.; Hadjiiski, L.; Lu, Y. Multi-path deep learning model for automated mammographic density categorization. In Medical Imaging 2019: Computer-Aided Diagnosis; SPIE: San Diego, CA, USA, 2019; Volume 10950, pp. 621–626. [Google Scholar]
- Lizzi, F.; Laruina, F.; Oliva, P.; Retico, A.; Fantacci, M.E. Residual convolutional neural networks to automatically extract significant breast density features. In International Conference on Computer Analysis of Images and Patterns; Springer: Berlin/Heidelberg, Germany, 2019; pp. 28–35. [Google Scholar]
- Lizzi, F.; Atzori, S.; Aringhieri, G.; Bosco, P.; Marini, C.; Retico, A.; Traino, A.C.; Caramella, D.; Fantacci, M.E. Residual Convolutional Neural Networks for Breast Density Classification. In BIOINFORMATICS; SciTePress: Setúbal, Portugal, 2019; pp. 258–263. [Google Scholar]
- Cogan, T.; Tamil, L. Deep Understanding of Breast Density Classification. In Proceedings of the 2020 42nd Annual International Conference of the IEEE Engineering in Medicine & Biology Society (EMBC), Montreal, QC, Canada, 20–24 July 2020; pp. 1140–1143. [Google Scholar]
- Chang, K.; Beers, A.L.; Brink, L.; Patel, J.B.; Singh, P.; Arun, N.T.; Hoebel, K.V.; Gaw, N.; Shah, M.; Pisano, E.D.; et al. Multi-institutional assessment and crowdsourcing evaluation of deep learning for automated classification of breast density. J. Am. Coll. Radiol. 2020, 17, 1653–1662. [Google Scholar] [CrossRef] [PubMed]
- Roth, H.R.; Chang, K.; Singh, P.; Neumark, N.; Li, W.; Gupta, V.; Gupta, S.; Qu, L.; Ihsani, A.; Bizzo, B.C.; et al. Federated learning for breast density classification: A real-world implementation. In Domain Adaptation and Representation Transfer, and Distributed and Collaborative Learning; Springer: Berlin/Heidelberg, Germany, 2020; pp. 181–191. [Google Scholar]
- Li, C.; Xu, J.; Liu, Q.; Zhou, Y.; Mou, L.; Pu, Z.; Xia, Y.; Zheng, H.; Wang, S. Multi-view mammographic density classification by dilated and attention-guided residual learning. IEEE/ACM Trans. Comput. Biol. Bioinform. 2020, 18, 1003–1013. [Google Scholar] [CrossRef] [PubMed]
- Zhao, W.; Wang, R.; Qi, Y.; Lou, M.; Wang, Y.; Yang, Y.; Deng, X.; Ma, Y. BASCNet: Bilateral adaptive spatial and channel attention network for breast density classification in the mammogram. Biomed. Signal Process. Control 2021, 70, 103073. [Google Scholar] [CrossRef]
- Tlusty, T.; Amit, G.; Ben-Ari, R. Unsupervised clustering of mammograms for outlier detection and breast density estimation. In Proceedings of the 2018 24th International Conference on Pattern Recognition (ICPR), Beijing, China, 20–24 August 2018; pp. 3808–3813. [Google Scholar]
- Cao, Y.; Geddes, T.A.; Yang, J.Y.H.; Yang, P. Ensemble deep learning in bioinformatics. Nat. Mach. Intell. 2020, 2, 500–508. [Google Scholar] [CrossRef]
- Ganaie, M.; Hu, M. Ensemble Deep Learning: A Review; Cornell University: Ithaca, NY, USA, 2021. [Google Scholar]
- Liashchynskyi, P.; Liashchynskyi, P. Grid search, random search, genetic algorithm: A big comparison for NAS. arXiv 2019, arXiv:1912.06059. [Google Scholar]
- Bhattiprolu, S. Ensemble Sign Language. 2021. Available online: https://github.com/bnsreenu/python_for_microscopists/blob/master/213-ensemble_sign_language.py (accessed on 4 January 2022).


| ACR Class | Feature | Tissues Proportion | Example |
|---|---|---|---|
| A | Fatty | Less than 25% dense tissue |  |
| B | Fibro-glandular | 25–50% dense tissue |  |
| C | Heterogeneously dense | 50–75% dense tissue |  |
| D | Extremely dense | More than 75% dense tissue |  |
| CNN Model | Model Name Origin | Number of Layers | Top-1 Accuracy | Year Established/Updated |
|---|---|---|---|---|
| VGG16 | Visual Geometry Group | 16 | 71.3% | 2015 |
| VGG19 | Visual Geometry Group | 19 | 71.3% | 2015 |
| ResNet50V2 | Residual Neural Network | 103 | 76.0% | 2016 |
| InceptionV3 | Inception | 189 | 77.9% | 2016 |
| Xception | Extrem Inception | 81 | 79% | 2017 |
| InceptionResNetV2 | Inveption-Residual Neural Network | 449 | 80.3% | 2017 |
| DenseNet121 | Densely Connected Convolutional Networks | 242 | 75.0% | 2017 |
| MobileNetV2 | MobileNet | 105 | 71.3% | 2018 |
| EfficientNetB0 | EfficientNet | 132 | 77.1% | 2019 |
| Work Title | Dataset | Included | Pre-Processing | Data Splitting | Deep Learning | Two Classes | ACR | AUC |
|---|---|---|---|---|---|---|---|---|
| Cases | Techniques | Model | Accuracy | Accuracy | ||||
| Deep | 200,000 | All | 80% training, | Baseline | 81.1% | 67.9% | 0.832 | |
| CNN [32] | mammograms | cases | Augmentation | 10% testing, | ||||
| 10% validation | CNN | 86.5% | 76.7% | 0.916 | ||||
| Deep | MIAS | All | 1- Segment | 80% training, | ||||
| Learning | pectoral | (apply | ||||||
| from | cases | muscle | five-fold | CNN | — | 83.6% | — | |
| Small | and breast | cross- | ||||||
| Dataset | 2-Augmentation | validation) | ||||||
| [33] | 3- Resize images | 20% testing, | ||||||
| DENSITY | 1602 | Augmentation | 70% training | |||||
| QUANTI- | images | All cases | 30% | VGG16 | — | 79.6% | — | |
| FICATION [36] | testing | |||||||
| Neural | 1-Remove | ten-fold | InceptionV4 | 89.97% | ||||
| background | ||||||||
| Networks | 18,157 | All | 2- Grayscale | Inception-SE | 92.17% | |||
| transformation | cross- | ResNeXt50 | — | 89.64% | — | |||
| based on | images | cases | 3-Augmentation | validation | ResNeXt-SE | 91.57% | ||
| SE-Attention | 4-Normalized into a | DenseNet121 | 89.20% | |||||
| [34] | Gauss distribution | DenseNet-SE | 91.79% | |||||
| Density | 41,479 | All | 41,479 | |||||
| Assessment | mammograms | Augmentation | train-images | ResNet-18 | 86.88% | 76.78% | — | |
| Using Deep | cases | 8677 | ||||||
| Learning [37] | test-images | |||||||
| BI-RADS | 3813 | 1- Remove | ||||||
| density | mammograms | — | background | — | InceptionV3 | — | 83.33% | — |
| categorization [35] | 2- Augmentation | |||||||
| Automated | All | 1- Remove | 80% training, | cGAN for | ||||
| Density | pectoral | (holdout | segmentation | |||||
| Segmentation | INbreast | cases | muscles | cross- | and | — | 98.75% | — |
| and | 2- Resize images | validation) | CNN for | |||||
| Classification [38] | 3- Augmentation | 20% testing, | classification | |||||
| Determination | 20,578 | 12,932 | 70% training, | Deep | MLO: | MLO: | ||
| of breast | images | images | 30% testing, | CNN | 90.9% | 0.98 | ||
| density [39] | Augmentation | — | CC: | CC: | ||||
| 90.1% | 0.97 | |||||||
| Residual | 7848 | 1962 | cross- | |||||
| Convolutional | images | images | — | validation | CNN | 86.3% | 76.0% | — |
| Neural | ||||||||
| Networks [42] | ||||||||
| DualViewNet | CBIS-DDSM | Exclude | Augmentation | — | MobileNetv2 | 0.988 | ||
| [43] | suspect | — | — | |||||
| labels | ||||||||
| Multi- | 108,230 | All | ResNet | 66.6% | ||||
| Institutional | images | cases | Augmentation | InceptionV3 | — | 64.4% | — | |
| Assessment | DenseNet201 | 65% | ||||||
| [44] | VGG16 | 66.7% | ||||||
| Residual | 1985 | All | 1- Remove | five fold | ResNet50 | 87.1% | 97.2 | |
| Learning | mammograms | cases | background | cross- | — | |||
| [46] | 2- Resize images | validation) | ||||||
| INbreast | 3- Augmentation | 70% | 84.7 | |||||
| DDSM | 250 cases | 1-Remove | five fold | ResNet | 85.1% | |||
| BASCNet | from each | background | cross- | — | ||||
| [47] | INbreast | ACR class | 2-Resize images | validation) | 90.51% | |||
| 3-Augmentation |
| Confusion Matrix | Precision | Recall | F1 | ||||
|---|---|---|---|---|---|---|---|
| A | B | C | D | ||||
| A | 123 | 10 | 0 | 0 | 0.45 | 0.92 | 0.6 |
| B | 93 | 125 | 5 | 4 | 0.57 | 0.55 | 0.56 |
| C | 36 | 82 | 68 | 30 | 0.86 | 0.31 | 0.46 |
| D | 23 | 2 | 6 | 10 | 0.23 | 0.24 | 0.24 |
| Accuracy | 0.53 | ||||||
| Overall F1 score | 0.51 | ||||||
| Confusion Matrix | Precision | Recall | F1 | ||||
|---|---|---|---|---|---|---|---|
| A | B | C | D | ||||
| A | 119 | 14 | 0 | 0 | 0.44 | 0.89 | 0.59 |
| B | 124 | 92 | 8 | 3 | 0.40 | 0.41 | 0.40 |
| C | 24 | 115 | 76 | 1 | 0.71 | 0.35 | 0.47 |
| D | 5 | 10 | 23 | 3 | 0.43 | 0.07 | 0.12 |
| Accuracy | 0.47 | ||||||
| Overall F1 score | 0.45 | ||||||
| Confusion Matrix | Precision | Recall | F1 | ||||
|---|---|---|---|---|---|---|---|
| A | B | C | D | ||||
| A | 114 | 16 | 2 | 1 | 0.66 | 0.86 | 0.75 |
| B | 51 | 134 | 34 | 8 | 0.73 | 0.59 | 0.65 |
| C | 8 | 34 | 164 | 10 | 0.76 | 0.76 | 0.76 |
| D | 0 | 0 | 15 | 26 | 0.58 | 0.63 | 0.60 |
| Accuracy | 0.71 | ||||||
| Overall F1 score | 0.71 | ||||||
| Confusion Matrix | Precision | Recall | F1 | ||||
|---|---|---|---|---|---|---|---|
| A | B | C | D | ||||
| A | 103 | 28 | 1 | 1 | 0.78 | 0.77 | 0.78 |
| B | 22 | 167 | 36 | 2 | 0.70 | 0.74 | 0.72 |
| C | 7 | 41 | 160 | 8 | 0.73 | 0.74 | 0.74 |
| D | 0 | 3 | 22 | 16 | 0.59 | 0.39 | 0.47 |
| Accuracy | 0.72 | ||||||
| Overall F1 score | 0.72 | ||||||
| Confusion Matrix | Precision | Recall | F1 | ||||
|---|---|---|---|---|---|---|---|
| A | B | C | D | ||||
| A | 48 | 84 | 1 | 0 | 0.69 | 0.36 | 0.47 |
| B | 21 | 153 | 53 | 0 | 0.53 | 0.67 | 0.60 |
| C | 1 | 49 | 166 | 0 | 0.64 | 0.77 | 0.70 |
| D | 0 | 1 | 38 | 2 | 1.00 | 0.05 | 0.09 |
| Accuracy | 0.60 | ||||||
| Overall F1 score | 0.57 | ||||||
| Confusion Matrix | Precision | Recall | F1 | ||||
|---|---|---|---|---|---|---|---|
| A | B | C | D | ||||
| A | 106 | 23 | 3 | 1 | 0.61 | 0.80 | 0.69 |
| B | 61 | 129 | 30 | 7 | 0.62 | 0.57 | 0.59 |
| C | 7 | 56 | 135 | 18 | 0.70 | 0.62 | 0.66 |
| D | 0 | 0 | 25 | 16 | 0.38 | 0.39 | 0.39 |
| AccuracyAccuracy | 0.63 | ||||||
| Overall F1 score | 0.62 | ||||||
| Confusion Matrix | Precision | Recall | F1 | ||||
|---|---|---|---|---|---|---|---|
| A | B | C | D | ||||
| A | 64 | 60 | 7 | 2 | 0.81 | 0.48 | 0.60 |
| B | 14 | 133 | 79 | 1 | 0.62 | 0.57 | 0.60 |
| C | 1 | 23 | 186 | 6 | 0.63 | 0.86 | 0.73 |
| D | 0 | 0 | 21 | 20 | 0.69 | 0.49 | 0.57 |
| Accuracy | 0.65 | ||||||
| verall F1 score | 0.64 | ||||||
| Confusion Matrix | Precision | Recall | F1 | ||||
|---|---|---|---|---|---|---|---|
| A | B | C | D | ||||
| A | 103 | 26 | 3 | 1 | 0.72 | 0.77 | 0.74 |
| B | 33 | 127 | 62 | 5 | 0.72 | 0.56 | 0.63 |
| C | 8 | 24 | 178 | 8 | 0.69 | 0.82 | 0.75 |
| D | 0 | 0 | 15 | 26 | 0.68 | 0.63 | 0.66 |
| Accuracy | 0.70 | ||||||
| Overall F1 score | 0.70 | ||||||
| Confusion Matrix | Precision | Recall | F1 | ||||
|---|---|---|---|---|---|---|---|
| A | B | C | D | ||||
| A | 98 | 34 | 1 | 0 | 0.78 | 0.74 | 0.76 |
| B | 21 | 171 | 34 | 1 | 0.68 | 0.75 | 0.71 |
| C | 6 | 47 | 152 | 8 | 0.74 | 0.70 | 0.72 |
| D | 1 | 0 | 18 | 22 | 0.65 | 0.54 | 0.59 |
| Accuracy | 0.72 | ||||||
| Overall F1 score | 0.72 | ||||||
| Pre-Trained CNN | Accuracy | F1 Score |
|---|---|---|
| DenseNet121 | 53% | 51% |
| MobileNet | 47% | 45% |
| ResNet50V2 | 71% | 71% |
| InceptionV3 | 72% | 72% |
| VGG16 | 60% | 57% |
| VGG19 | 63% | 62% |
| InceptionResNetV2 | 65% | 64% |
| EfficientNetV2B0 | 72% | 72% |
| Xception | 70% | 70% |
| Pre-Trained CNN | Accuracy | F1 Score |
|---|---|---|
| DenseNet121 | 85% | 85% |
| MobileNet | 79% | 79% |
| ResNet50V2 | 84% | 84% |
| InceptionV3 | 85% | 85% |
| VGG16 | 81% | 81% |
| VGG19 | 79% | 79% |
| InceptionResNetV2 | 82% | 82% |
| EfficientNetV2B0 | 85% | 85% |
| Xception | 85% | 85% |
| Confusion Matrix | Precision | Recall | F1 | ||||
|---|---|---|---|---|---|---|---|
| A | B | C | D | ||||
| A | 97 | 35 | 1 | 0 | 0.81 | 0.73 | 0.77 |
| B | 17 | 165 | 43 | 2 | 0.72 | 0.73 | 0.72 |
| C | 6 | 29 | 178 | 3 | 0.74 | 0.82 | 0.87 |
| D | 0 | 0 | 20 | 21 | 0.81 | 0.51 | 0.63 |
| Accuracy | 0.747 | ||||||
| Overall F1 score | 0.75 | ||||||
| Confusion Matrix | Precision | Recall | F1 | ||||
|---|---|---|---|---|---|---|---|
| A | B | C | D | ||||
| A | 106 | 27 | 0 | 0 | 0.78 | 0.80 | 0.79 |
| B | 21 | 184 | 19 | 3 | 0.75 | 0.81 | 0.80 |
| C | 9 | 34 | 168 | 5 | 0.83 | 0.87 | 0.80 |
| D | 0 | 0 | 16 | 25 | 0.76 | 0.61 | 0.68 |
| Accuracy | 0.779 | ||||||
| Overall F1 score | 0.78 | ||||||
| Confusion Matrix | Precision | Recall | F1 | ||||
|---|---|---|---|---|---|---|---|
| A | B | C | D | ||||
| A | 107 | 26 | 0 | 0 | 0.77 | 0.80 | 0.79 |
| B | 23 | 181 | 20 | 2 | 0.75 | 0.80 | 0.77 |
| C | 9 | 34 | 169 | 4 | 0.82 | 0.87 | 0.80 |
| D | 0 | 0 | 16 | 25 | 0.81 | 0.61 | 0.69 |
| Accuracy | 0.7811 | ||||||
| Overall F1 score | 0.78 | ||||||
| Confusion Matrix | Precision | Recall | F1 | ||||
|---|---|---|---|---|---|---|---|
| A | B | C | D | ||||
| A | 106 | 27 | 0 | 0 | 0.76 | 0.80 | 0.78 |
| B | 26 | 173 | 26 | 2 | 0.73 | 0.76 | 0.75 |
| C | 8 | 36 | 167 | 5 | 0.79 | 0.77 | 0.78 |
| D | 0 | 0 | 19 | 22 | 0.76 | 0.54 | 0.63 |
| Accuracy | 0.758 | ||||||
| Overall F1 score | 0.76 | ||||||
| Ensembles | Accuracy | F1 Score |
|---|---|---|
| Averaging all models | 74.70% | 74% |
| Weighted average with best 5 models | 77.95% | 78% |
| Weighted average with best 4 models | 78.11% | 78% |
| Weighted average with best 3 models | 75.85% | 76% |
| Ensembles | Accuracy | F1 Score |
|---|---|---|
| Averaging all models | 86.20% | 86% |
| Weighted average with best 5 models | 86.70% | 87% |
| Weighted average with best 4 models | 87.60% | 87% |
| Weighted average with best 3 models | 85% | 85% |
Publisher’s Note: MDPI stays neutral with regard to jurisdictional claims in published maps and institutional affiliations. |
© 2022 by the authors. Licensee MDPI, Basel, Switzerland. This article is an open access article distributed under the terms and conditions of the Creative Commons Attribution (CC BY) license (https://creativecommons.org/licenses/by/4.0/).
Share and Cite
Justaniah, E.; Aldabbagh, G.; Alhothali, A.; Abourokbah, N. Classifying Breast Density from Mammogram with Pretrained CNNs and Weighted Average Ensembles. Appl. Sci. 2022, 12, 5599. https://doi.org/10.3390/app12115599
Justaniah E, Aldabbagh G, Alhothali A, Abourokbah N. Classifying Breast Density from Mammogram with Pretrained CNNs and Weighted Average Ensembles. Applied Sciences. 2022; 12(11):5599. https://doi.org/10.3390/app12115599
Chicago/Turabian StyleJustaniah, Eman, Ghadah Aldabbagh, Areej Alhothali, and Nesreen Abourokbah. 2022. "Classifying Breast Density from Mammogram with Pretrained CNNs and Weighted Average Ensembles" Applied Sciences 12, no. 11: 5599. https://doi.org/10.3390/app12115599