
Optimization of the Preformulation and Formulation Parameters in the Development of New Extended-Release Tablets Containing Felodipine

 ,
,  ,
, 
 ,
,  ,
,
Abstract
:1. Introduction
2. Materials and Methods
2.1. Materials
2.2. Methods
2.2.1. Physical and Chemical Characterization
2.2.2. Formulation Studies for Felodipine Extended-Release Tablets
- -
- 0.4% cetrimide (CTAB), according to the specification of the reference product. 400 mg cetrimide was dissolved in phosphate buffer (NaH2PO4) pH = 6.5;
- -
- 1% sodium lauryl sulphate (LSNa) (m/V), according to USP specifications. 1 g of sodium lauryl sulphate was dissolved in phosphate buffer (NaH2PO4) pH = 6.5;
2.2.3. Release Kinetic Studies
3. Results and Discussion
3.1. Organoleptic Evaluation of the Compounds
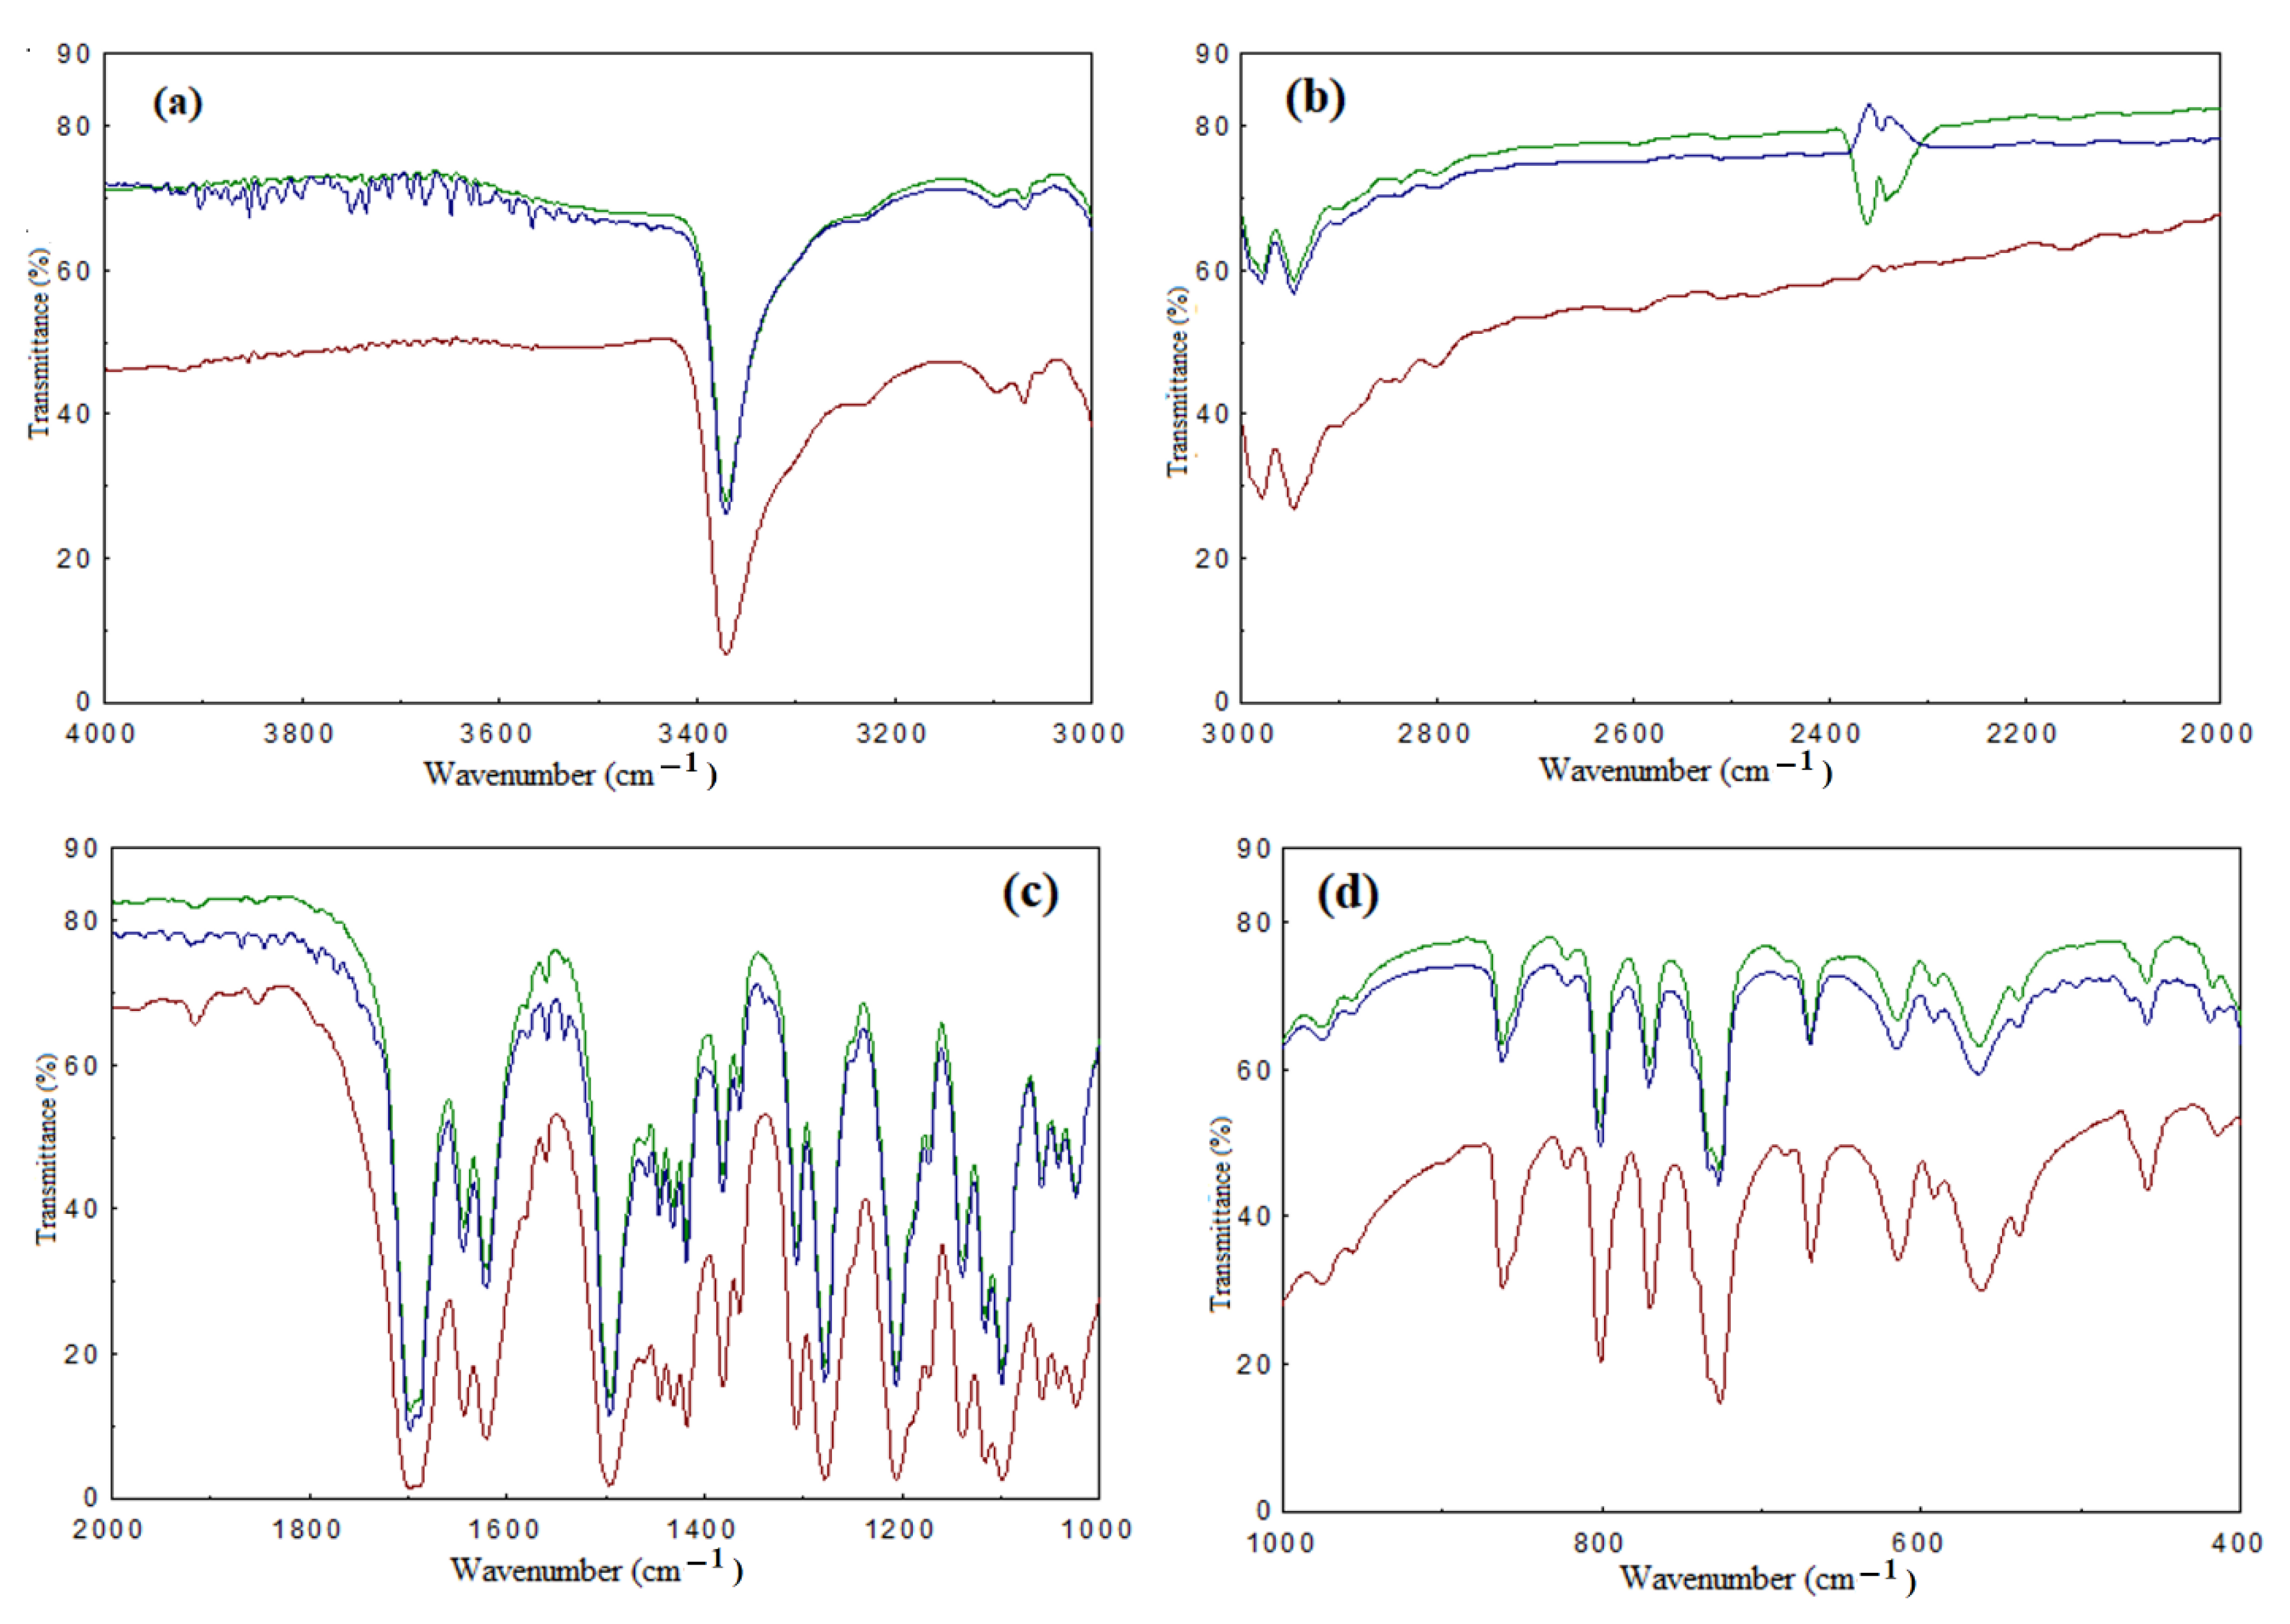
3.2. Physical and Chemical Characterization
3.3. Influence of Formulation Factors on the In Vitro Availability of Felodipine in Experimental Tablets
3.4. Modelling of Release Kinetics
4. Conclusions
Author Contributions
Funding
Conflicts of Interest
References
- Balaci, T.; Velescu, B.; Karampelas, O.; Musuc, A.M.; Nitulescu, G.M.; Ozon, E.A.; Nitulescu, G.; Gird, C.E.; Fita, C.; Lupuliasa, D. Physico-Chemical and Pharmaco-Technical Characterization of Inclusion Complexes Formed by Rutoside with beta-Cyclodextrin and Hydroxypropyl-beta-Cyclodextrin Used to Develop Solid Dosage Forms. Processes 2021, 9, 26. [Google Scholar] [CrossRef]
- Paus, R.; Ji, Y. Modeling and predicting the influence of variable factors on dissolution of crystalline pharmaceuticals. Chem. Eng. Sci. 2016, 145, 10–20. [Google Scholar] [CrossRef]
- Asachi, M.; Nourafkan, E.; Hassanpour, A. A review of current techniques for the evaluation of powder mixing. Adv. Powder Technol. 2018, 29, 1525–1549. [Google Scholar] [CrossRef]
- Available online: https://www.who.int/news/item/25-08-2021-more-than-700-million-people-with-untreated-hypertension (accessed on 8 January 2022).
- Fleckenstein, A. History of calcium antagonists. Circ. Res. 1983, 52, 13–16. [Google Scholar]
- Buckley, N.; Dawson, A.; Whyte, I. Calcium Channel Blockers. Medicine 2007, 35, 599–602. [Google Scholar] [CrossRef]
- Bhole, P.G.; Patil, V.R. Enhancement of water solubility of felodipine by preparing solid dispersion using poly-ethylene glycol 6000 and poly-vinyl alcohol. Asian J. Pharm. 2009, 3, 240–244. [Google Scholar] [CrossRef]
- Kim, E.J.; Chun, M.K.; Jang, J.S.; Lee, I.H.; Lee, K.R.; Choi, H.K. Preparation of a solid dispersion of felodipine using a solvent wetting method. Eur. J. Pharm. Biopharm. 2006, 64, 200–205. [Google Scholar] [CrossRef]
- Mielcarek, J.; Czernielewska, A.; Czarczyńska, B. Inclusion complexes of felodipine and amlodipine with methyl-β-cyclodextrin. J. Incl. Phenom. 2006, 54, 17–21. [Google Scholar] [CrossRef]
- Ali, J.; Zgair, A.; Hammed, G.S.; Garnett, M.C.; Roberts, C.J.; Burley, J.C.; Gershkovich, P. Application of biorelevant saliva-based dissolution for optimisation of orally disintegrating formulations of felodipine. Int. J. Pharm. 2019, 555, 228–236. [Google Scholar] [CrossRef]
- Joshi, G.S.; Burnett, J.C.; Abraham, D.J. Cardiac Drugs: Antianginal, Vasodilators, Antiarrhythmic. In Burger’s Medicinal Chemistry and Drug Discovery. Cardiovascular Agents and Endocrines, 6th ed.; Abraham, D.J., Ed.; Wiley: Hoboken, NJ, USA, 2003; Volume 3. [Google Scholar]
- Greene, S.L.; Gawarammana, I.; Wood, D.M.; Jones, A.L.; Dargan, P.I. Relative safety of hyperinsulinaemia/euglycaemia therapy in the management of calcium channel blocker overdose: A prospective observational study. Intensive Care Med. 2007, 33, 2019–2024. [Google Scholar] [CrossRef]
- Bangalore, S.; Parkar, S.; Messerli, F.H. Long-acting calcium antagonists in patients with coronary artery disease: A meta-analysis. Am. J. Med. 2009, 122, 356. [Google Scholar] [CrossRef]
- Fihn, S.D.; Blankenship, J.C.; Alexander, K.P.; Bittl, J.A.; Byrne, J.G.; Fletcher, B.J.; Fonarow, G.C.; Lange, R.A.; Levine, G.N.; Maddox, T.M.; et al. ACC/AHA/AATS/PCNA/SCAI/STS focused update of the guideline for the diagnosis and management of patients with stable ischemic heart disease: A report of the American College of Cardiology/American Heart Association Task Force on Practice Guidelines, and the American Association for Thoracic Surgery, Preventive Cardiovascular Nurses Association, Society for Cardiovascular Angiography and Interventions, and Society of Thoracic Surgeons. J. Am. Coll. Cardiol. 2014, 64, 1929. [Google Scholar]
- Li, D.; Xu, S.; Wang, Y.; Li, D.; Li, X.; Pan, J.; Xu, P. Pharmacokinetics and drug-drug interaction between enalapril, enalaprilat and felodipine extended release (ER) in healthy subjects. Oncotarget 2017, 8, 70752–70760. [Google Scholar] [CrossRef] [Green Version]
- Baranda, A.B.; Mueller, C.A.; Alonso, R.M.; Jimenez, R.M.; Weinmann, W. Quantitative determination of the calcium channel antagonists amlodipine, lercanidipine, nitrendipine, felodipine, and lacidipine in human plasma using liquid chromatography-tandem mass spectrometry. Ther. Drug Monit. 2005, 27, 44–52. [Google Scholar] [CrossRef]
- Zhou, X.; Nauka, E.; Narang, A.; Mao, C. Flow Function of Pharmaceutical Powders at Low-Stress Conditions Can Be Inferred Using a Simple Flow-through-Orifice Device. J. Pharm. Sci. 2020, 109, 2009–2017. [Google Scholar] [CrossRef]
- Ghori, M.U.; Conway, B.R. Hydrophilic Matrices for Oral Control Drug Delivery. Am. J. Pharmacol. Sci. 2015, 3, 103–109. [Google Scholar]
- Paus, R.; Prudic, A.; Ji, Y. Influence of excipients on solubility and dissolution of pharmaceuticals. Int. J. Pharm. 2015, 485, 277–287. [Google Scholar] [CrossRef]
- Kim, M.S.; Kim, J.S.; Kang, S.H.; Yoo, Y.H.; Lee, S.; Park, J.S.; Woo, J.S.; Hwang, S.J. Influence of water soluble additives and HPMCP on drug release from surelease®-coated pellets containing tamsulosin hydrochloride. Arch. Pharm. Res. 2007, 30, 1008–1013. [Google Scholar] [CrossRef]
- Cao, Q.-R.; Choi, Y.-W.; Cui, J.-H.; Lee, B.-J. Formulation, release characteristics and bioavailability of novel monolithic hydroxypropylmethylcellulose matrix tablets containing acetaminophen. J. Control. Release 2005, 108, 351–361. [Google Scholar] [CrossRef]
- Popescu, I.A.; Donea, C.; Lupulesa, D.; Nicoară, A.C.; Popa, D.E.; Miron, D.S.; Rădulescu, F.S. Comparative assesment of the in vitro performance for modified release tablets containing pentoxifylline using padlle method and flow-through cells. Farmacia 2015, 63, 903–908. [Google Scholar]
- The United States Pharmacopoeia (USP 36). United States Pharmacopoeia Convention; United States Pharmacopoeia: Rockville, MD, USA, 2013. [Google Scholar]
- Musuc, A.M.; Anuta, V.; Atkinson, I.; Sarbu, I.; Popa, V.T.; Munteanu, C.; Mircioiu, C.; Ozon, E.A.; Nitulescu, G.M.; Mitu, M.A. Formulation of Chewable Tablets Containing Carbamazepine-β-cyclodextrin Inclusion Complex and F-Melt Disintegration Excipient. The Mathematical Modeling of the Release Kinetics of Carbamazepine. Pharmaceutics 2021, 13, 915. [Google Scholar] [CrossRef]
- Peppas, N.A. Analysis of Fickian and non-Fickian drug release from polymers. Pharm. Acta Helv. 1985, 60, 110–111. [Google Scholar]
- Council of Europe. European Pharmacopoeia, 10th ed.; EDQM, Council of Europe: Strasbourg, France, 2019. [Google Scholar]
- Song, Y.; Wang, L.; Yang, P.; Wenslow, R.M., Jr.; Tan, B.; Zhang, H.; Deng, Z. Physicochemical Characterization of Felodipine-Kollidon VA64 Amorphous Solid Dispersions Prepared by Hot-Melt Extrusion. J. Pharm. Sci. 2013, 102, 1915–1923. [Google Scholar] [CrossRef]
- Wang, L.; Song, Y.J.; Yang, P.; Tan, B.; Zhang, H.L.; Deng, Z.W. Preparation and thermodynamic properties of felodipine form IV. J. Therm. Anal. Calorim. 2015, 120, 947–951. [Google Scholar] [CrossRef]
- Karavas, E.; Georgarakis, E.; Sigalas, M.P.; Avgoustakis, K.; Bikiaris, D. Investigation of the release mechanism of a sparingly water-soluble drug from solid dispersions in hydrophilic carriers based on physical state of drug, particle size distribution and drug–polymer interactions. Eur. J. Pharm. Biopharm. 2007, 66, 334–347. [Google Scholar] [CrossRef]
- Chiou, A.H.J.; Cheng, H.C.; Wang, D.P. Micronization and microencapsulation of felodipine by subcritical carbon dioxide. J. Microencapsu. 2006, 23, 265–276. [Google Scholar] [CrossRef]
- Le, T.-T.; Elzhry Elyafi, A.K.; Mohammed, A.R.; Al-Khattawi, A. Delivery of Poorly Soluble Drugs via Mesoporous Silica: Impact of Drug Overloading on Release and Thermal Profiles. Pharmaceutics 2019, 11, 269. [Google Scholar] [CrossRef] [Green Version]
- Dengale, S.J.; Grohganz, H.; Rades, T.; Löbmann, K. Recent advances in co-amorphous drug formulations. Adv. Drug Deliv. Rev. 2016, 100, 116–125. [Google Scholar] [CrossRef]
- Mitu, M.A.; Cretu, E.A.; Novac, M.; Karampelas, O.; Nicoara, A.; Nitulescu, G.; Lupuleasa, D. The Flowing Characteristics of Some Composed Powders Containing Inclusion Complexes in Beta-Cyclodextrin. In Romanian National Congress of Pharmacy, 21st Century Pharmacy—Between Intelligent Specialization and Social Responsibility, Bu-charest, Romania, 26–29 September 2018, 17th ed.; Draganescu, D., Arsene, A., Eds.; Carol Davila University of Medicine and Pharmacy: Bucharest, Romania, 2018; pp. 129–133. [Google Scholar]
- Lu, Y.; Chen, J.; Yi, S.; Xiong, S. Enhanced felodipine dissolution from high drug loading amorphous solid dispersions with PVP/VA and sodium dodecyl sulfate. J. Drug Deliv. Sci. Technol. 2019, 53, 101151. [Google Scholar] [CrossRef]
- Nokhodchi, A.; Raja, S.; Patel, P.; Asare-Addo, K. The role of oral controlled release matrix tablets in drug delivery systems. Bioimpacts 2012, 2, 175–187. [Google Scholar]
- Nicoară, A.C.; Cazacincu, R.G.; Lupuleasa, D.; Miron, D.S.; Rădulescu, F.S. Formulation and in-vitro release testing of rectal suppositories containing nimesulide. Farmacia 2015, 63, 111–117. [Google Scholar]
- Mapa, B.D.C.; Araújo, L.U.; Silva-Barcellos, N.M.; Caldeira, T.G.; Souza, J. Gliclazide: Biopharmaceutics Characteristics to Discuss the Biowaiver of Immediate and Extended Release Tablets. Appl. Sci. 2020, 10, 7131. [Google Scholar] [CrossRef]
- Sun, Y.; Tao, J.; Zhang, G.G.Z.; Yu, L. Solubilities of crystalline drugs in polymers: An improved analytical method and comparison of solubilities of indomethacin and nifedipine in PVP, PVP/VA, and PVAc. J. Pharm. Sci. 2010, 99, 4023–4031. [Google Scholar] [CrossRef]
- Lee, B.-J.; Ryu, S.-G.; Cui, J.-H. Controlled release of dual drug-loaded hydroxypropyl methylcellulose matrix tablet using drug-containing polymeric coatings. Int. J. Pharm. 1999, 188, 71–80. [Google Scholar] [CrossRef]
- Wen, X.; Deng, Z.; Xu, Y.; Yan, G.; Deng, X.; Wu, L.; Liang, Q.; Fang, F.; Feng, X.; Yu, M.; et al. Preparation and In Vitro/In Vivo Evaluation of Orally Disintegrating/Modified-Release Praziquantel Tablets. Pharmaceutics 2021, 13, 1567. [Google Scholar] [CrossRef]
- Manescu, O.; Lupuleasa, D.; Miron, D.S.; Budura, E.A.; Radulescu, F.S. In vitro drug release from topical antifungal pharmaceutical formulations. Farmacia 2011, 59, 15–23. [Google Scholar]
- Wakamatsu, J.; Sato, K.; Uryu, K.; Maru, I. Clinical Demonstrations of Controlled-Release Tablets Constructed by the Combined Usage of Shellac and Hydroxypropyl Methylcellulose. Future Pharmacol. 2021, 1, 48–59. [Google Scholar] [CrossRef]
- Raina, S.A.; Alonzo, D.E.; Zhang, G.G.Z.; Gao, Y.; Taylor, L.S. Impact of polymers on the crystallization and phase transition kinetics of amorphous nifedipine during dissolution in aqueous media. Mol. Pharm. 2014, 11, 3565–3576. [Google Scholar] [CrossRef]
- Yang, R.; Mann, A.K.P.; Van Duong, T.; Ormes, J.D.; Okoh, G.A.; Hermans, A.; Taylor, L.S. Drug Release and Nanodroplet Formation from Amorphous Solid Dispersions: Insight into the Roles of Drug Physicochemical Properties and Polymer Selection. Mol. Pharm. 2021, 18, 2066–2081. [Google Scholar] [CrossRef]
- Surov, A.O.; Solanko, K.A.; Bond, A.D.; Perlovich, G.L.; Bauer-Brandl, A. Crystallization and Polymorphism of Felodipine. Cryst. Growth Des. 2012, 12, 4022–4030. [Google Scholar] [CrossRef]
- Prudic, A.; Kleetz, T.; Korf, M.; Ji, Y.; Sadowski, G. Influence of copolymer composition on the phase behavior of solid dispersions. Mol. Pharm. 2014, 11, 4189–4198. [Google Scholar] [CrossRef] [PubMed]
- Karavas, E.; Ktistis, G.; Xenakis, A.; Georgarakis, E. Miscibility behavior and formation mechanism of stabilized felodipine-polyvinylpyrrolidone amorphous solid dispersions. Drug Dev. Ind. Pharm. 2005, 31, 473–489. [Google Scholar] [CrossRef] [PubMed]
- Vetchy, D.; Vetcha, M.; Rabiškova, M.; Gryczova, E.; Bartošikova, L. Comparison in vitro felodipine release rate from the original versus generic product with controlled release of the drug. Medicina 2007, 43, 326. [Google Scholar] [CrossRef] [PubMed] [Green Version]
- Ciobanu, A.-M.; Pop, A.L.; Crisan, S.; Pali, M.; Burcea-Dragomiroiu, G.T.A.; Popa, D.E.; Lupuliasa, D.; Barca, M. HPLC studies for assessing the stability of carvedilol tablets. Farmacia 2017, 65, 523. [Google Scholar]
- Anselmo, A.C.; Mitragotri, S. An overview of clinical and commercial impact of drug delivery systems. J. Control. Release 2014, 190, 15–28. [Google Scholar] [CrossRef] [PubMed] [Green Version]
- Rodriguez-Aller, M.; Guillarme, D.; Veuthey, J.-L.; Gurny, R. Strategies for formulating and delivering poorly water-soluble drugs. J. Drug Deliv. Sci. Technol. 2015, 30, 342–351. [Google Scholar] [CrossRef]
- Pop, A.L.; Crișan, S.; Bârcă, M.; Ciobanu, A.-M.; Varlas, V.N.; Pop, C.; Pali, M.-A.; Cauni, D.; Ozon, E.A.; Udeanu, D.; et al. Evaluation of Dissolution Profiles of a Newly Developed Solid Oral Immediate-Release Formula Containing Alpha-Lipoic Acid. Processes 2021, 9, 176. [Google Scholar] [CrossRef]
- Ciolan, D.F.; Mînea, A.; Andrieș, A.; Nicoară, A.C.; Rădulescu, F.S.; Miron, D.S. The influence of compendial cells design and experimental setup on the in-vitro similarity of ketoconazole topical creams. Farmacia 2015, 63, 865–871. [Google Scholar]
- Mircia, E.; Sipos, E.; Imre, S.; Avrigeanu, V.; Hancu, G.; Iantovics, B.; Balaci, T. New modified release tablets with pentoxifylline based on lipophilic matrix. Note 1. Formulation, physical study and determination of dissolution profiles of the active substance from the proposed formulations. Farmacia 2012, 60, 218–222. [Google Scholar]
- Barakh Ali, F.B.; Afrooz, H.; Hampel, R.; Mohamed, E.M.; Bhattacharya, R.; Cook, P.; Khan, M.A.; Rahman, Z. Blend of cellulose ester and enteric polymers for delayed and enteric coating of core tablets of hydrophilic and hydrophobic drugs. Int. J. Pharm. 2019, 567, 118462. [Google Scholar]
- Carje, A.G.; Balint, A.; Ion, V.; Pop, A.L.; Muntean, D.L.; Sabau, R.; Imre, S. HPLC-UV method approach for the analysis and impurity profiling of captopril. Stud. Univ. Babes-Bolyai Chem. 2019, 64, 231–242. [Google Scholar]
- Musuc, A.M.; Anuta, V.; Atkinson, I.; Popa, V.T.; Sarbu, I.; Mircioiu, C.; Abdalrb, G.A.; Mitu, M.A.; Ozon, E.A. Development and Characterization of Orally Disintegrating Tablets Containing a Captopril-Cyclodextrin Complex. Pharmaceutics 2020, 12, 744. [Google Scholar] [CrossRef] [PubMed]
- Galdón, E.; Millán-Jiménez, M.; Mora-Castaño, G.; de Ilarduya, A.M.; Caraballo, I. A Biodegradable Copolyester, Poly (butylene succinate-co-ε-caprolactone), as a High Efficiency Matrix Former for Controlled Release of Drugs. Pharmaceutics 2021, 13, 1057. [Google Scholar] [CrossRef] [PubMed]
- Klein, S. The Use of Biorelevant Dissolution Media to Forecast the In Vivo Performance of a Drug. AAPS J. 2010, 12, 397–406. [Google Scholar] [CrossRef] [Green Version]
- Konno, H.; Handa, T.; Alonzo, D.E.; Taylor, L.S. Effect of polymer type on the dissolution profile of amorphous solid dispersions containing felodipine. Eur. J. Pharm. Biopharm. 2008, 70, 493–499. [Google Scholar] [CrossRef]
- Korsmeyer, R.W.; Gurny, R.; Doelker, E.M.; Buri, P.; Peppas, N.A. Mechanism of solute release from porous hydrophilic polymers. Int. J. Pharm. 1983, 15, 25–35. [Google Scholar] [CrossRef]
- Ritger, P.L.; Peppas, N.A. A Simple Equation for Description of Solute Release I. Fickian and Non-Fickian Release from Non-Swellable Devices in the form of Slabs, Spheres, Cylinders or Discs. J. Control. Release 1987, 5, 23–36. [Google Scholar] [CrossRef]
- Peppas, N.A.; Narasimhan, B. Mathematical models in drug delivery: How modelling has shaped the way we design new drug delivery systems. J. Control. Release 2014, 190, 75–81. [Google Scholar] [CrossRef]
- Costa, P.; Sousa Lobo, J.M. Modelling and comparison of dissolution profiles. Eur. J. Pharm. Sci. 2001, 13, 123–133. [Google Scholar] [CrossRef]


| Ingredients | % of the Tablets’ Total Mass |
|---|---|
| PEG 4000 | 5.4 |
| Propyl gallate | 0.05 |
| Magnesium stearate | 1 |
| PVP K 30 | 20 |
| Total | 26.45 |
| Formulation Code | % of the Tablets’ Total Mass | ||||||||
|---|---|---|---|---|---|---|---|---|---|
| F1 | F2 | F3 | F4 | F5 | F6 | F7 | F8 | F9 | |
| Felodipine | 5 | 5 | 5 | 5 | 5 | 5 | 5 | 5 | 5 |
| HPMC E5 | - | - | 25 | - | - | - | - | - | - |
| HPMC E10 | - | - | - | - | 15 | 35 | 38 | - | - |
| HPMC E50 | - | - | - | 23 | 35 | 15 | - | 27.5 | 27.5 |
| HPMC K100M | 15 | 30 | 15 | 10 | - | - | 12 | 19 | 15 |
| Microcrystalline cellulose | 26.05 | 18.55 | 13.55 | 17.25 | 8.55 | 8.55 | 8.55 | 12.05 | 12.05 |
| Lactose monohydrate | 27.5 | 20 | 15 | 18.3 | 10 | 10 | 10 | 10 | 14 |
| NVI | 26.45 | 26.45 | 26.45 | 26.45 | 26.45 | 26.45 | 26.45 | 26.45 | 26.45 |
| Formulation Code | % of the Tablets’ Total Mass | |
|---|---|---|
| F10 | F11 | |
| Felodipine macrocrystalline | 5 | - |
| Felodipine microcrystalline | - | 5 |
| HPMC E50 | 27.5 | 27.5 |
| HPMC K100M | 15 | 15 |
| Microcrystalline cellulose | 12.05 | 12.05 |
| Lactose monohydrate | 14 | 14 |
| NVI | 26.45 | 26.45 |
| Formulation Code | % of the Tablets’ Total Mass | |
|---|---|---|
| F12 (45N) | F13 (90N) | |
| Felodipine | 5 | 5 |
| HPMC E50 | 27.5 | 27.5 |
| HPMC K100M | 15 | 15 |
| Microcrystalline cellulose | 12.05 | 12.05 |
| Lactose monohydrate | 14 | 14 |
| NVI | 26.45 | 26.45 |
| Formulation Code | % of the Tablets’ Total Mass | |
|---|---|---|
| F14 | F15 | |
| Felodipine | 5 | 5 |
| Methocel K100 | 15 | 15 |
| Methocel E50 | 27.5 | 27.5 |
| Microcrystalline cellulose | 21.05 | 9.55 |
| Lactose monohydrate | 5 | 16.5 |
| NVI | 26.45 | 26.45 |
| Formulation Code | % of the Tablets’ Total Mass | |
|---|---|---|
| F16 | F17 | |
| Felodipine | 5 | 5 |
| Methocel K100 | 15 | 15 |
| Methocel E50 | 27.5 | 27.5 |
| Microcrystalline cellulose | 12.05 | 5.05 |
| Lactose monohydrate | 14 | 21 |
| NVI | 26.45 | 26.45 |
| Formulation Code | % of the Tablets’ Total Mass | |
|---|---|---|
| F18 | F19 | |
| Felodipine | 5 | 5 |
| PEG 4000 | 5.4 | 5.4 |
| Propyl gallate | 0.05 | 0.05 |
| Methocel K100 | 15 | 15 |
| Methocel E50 | 5527.5 | 27.5 |
| Microcrystalline cellulose | 17.05 | 12.05 |
| Lactose monohydrate | 19 | 14 |
| Magnesium stearate | 21 | 21 |
| PVP K 30 | 10 | 20 |
| Ingredients | Quantity (mg) | % of the Tablets’ Total Mass |
|---|---|---|
| Felodipine | 10.00 | 5 |
| PEG 4000 | 10.80 | 5.40 |
| Propyl gallate | 0.10 | 0.05 |
| Methocel K100 | 30.00 | 15 |
| Methocel E50 | 55.00 | 27.50 |
| Microcrystalline cellulose | 24.10 | 12.05 |
| Lactose monohydrate | 28.00 | 14 |
| Magnesium stearate | 2.00 | 1 |
| PVP K 30 | 40.00 | 20 |
| Total mass | 200.00 | 100.00 |
| Felodipine Crystalline Type | Macrocrystalline Form | Microcrystalline Form | ||
|---|---|---|---|---|
| Parameter | Particle Size (µm) | Particle Surface Area (mm2) | Particle Size (µm) | Particle Surface Area (mm2) |
| Average value | 3573.71 | 14.683 | 30.3621 | 0.924 |
| STDEV * | 1412.23 | 10.465 | 17.55609 | 5.298 |
| SAMPLE MEAN | 565.00 | 4.187 | 6.389642 | 2.576 |
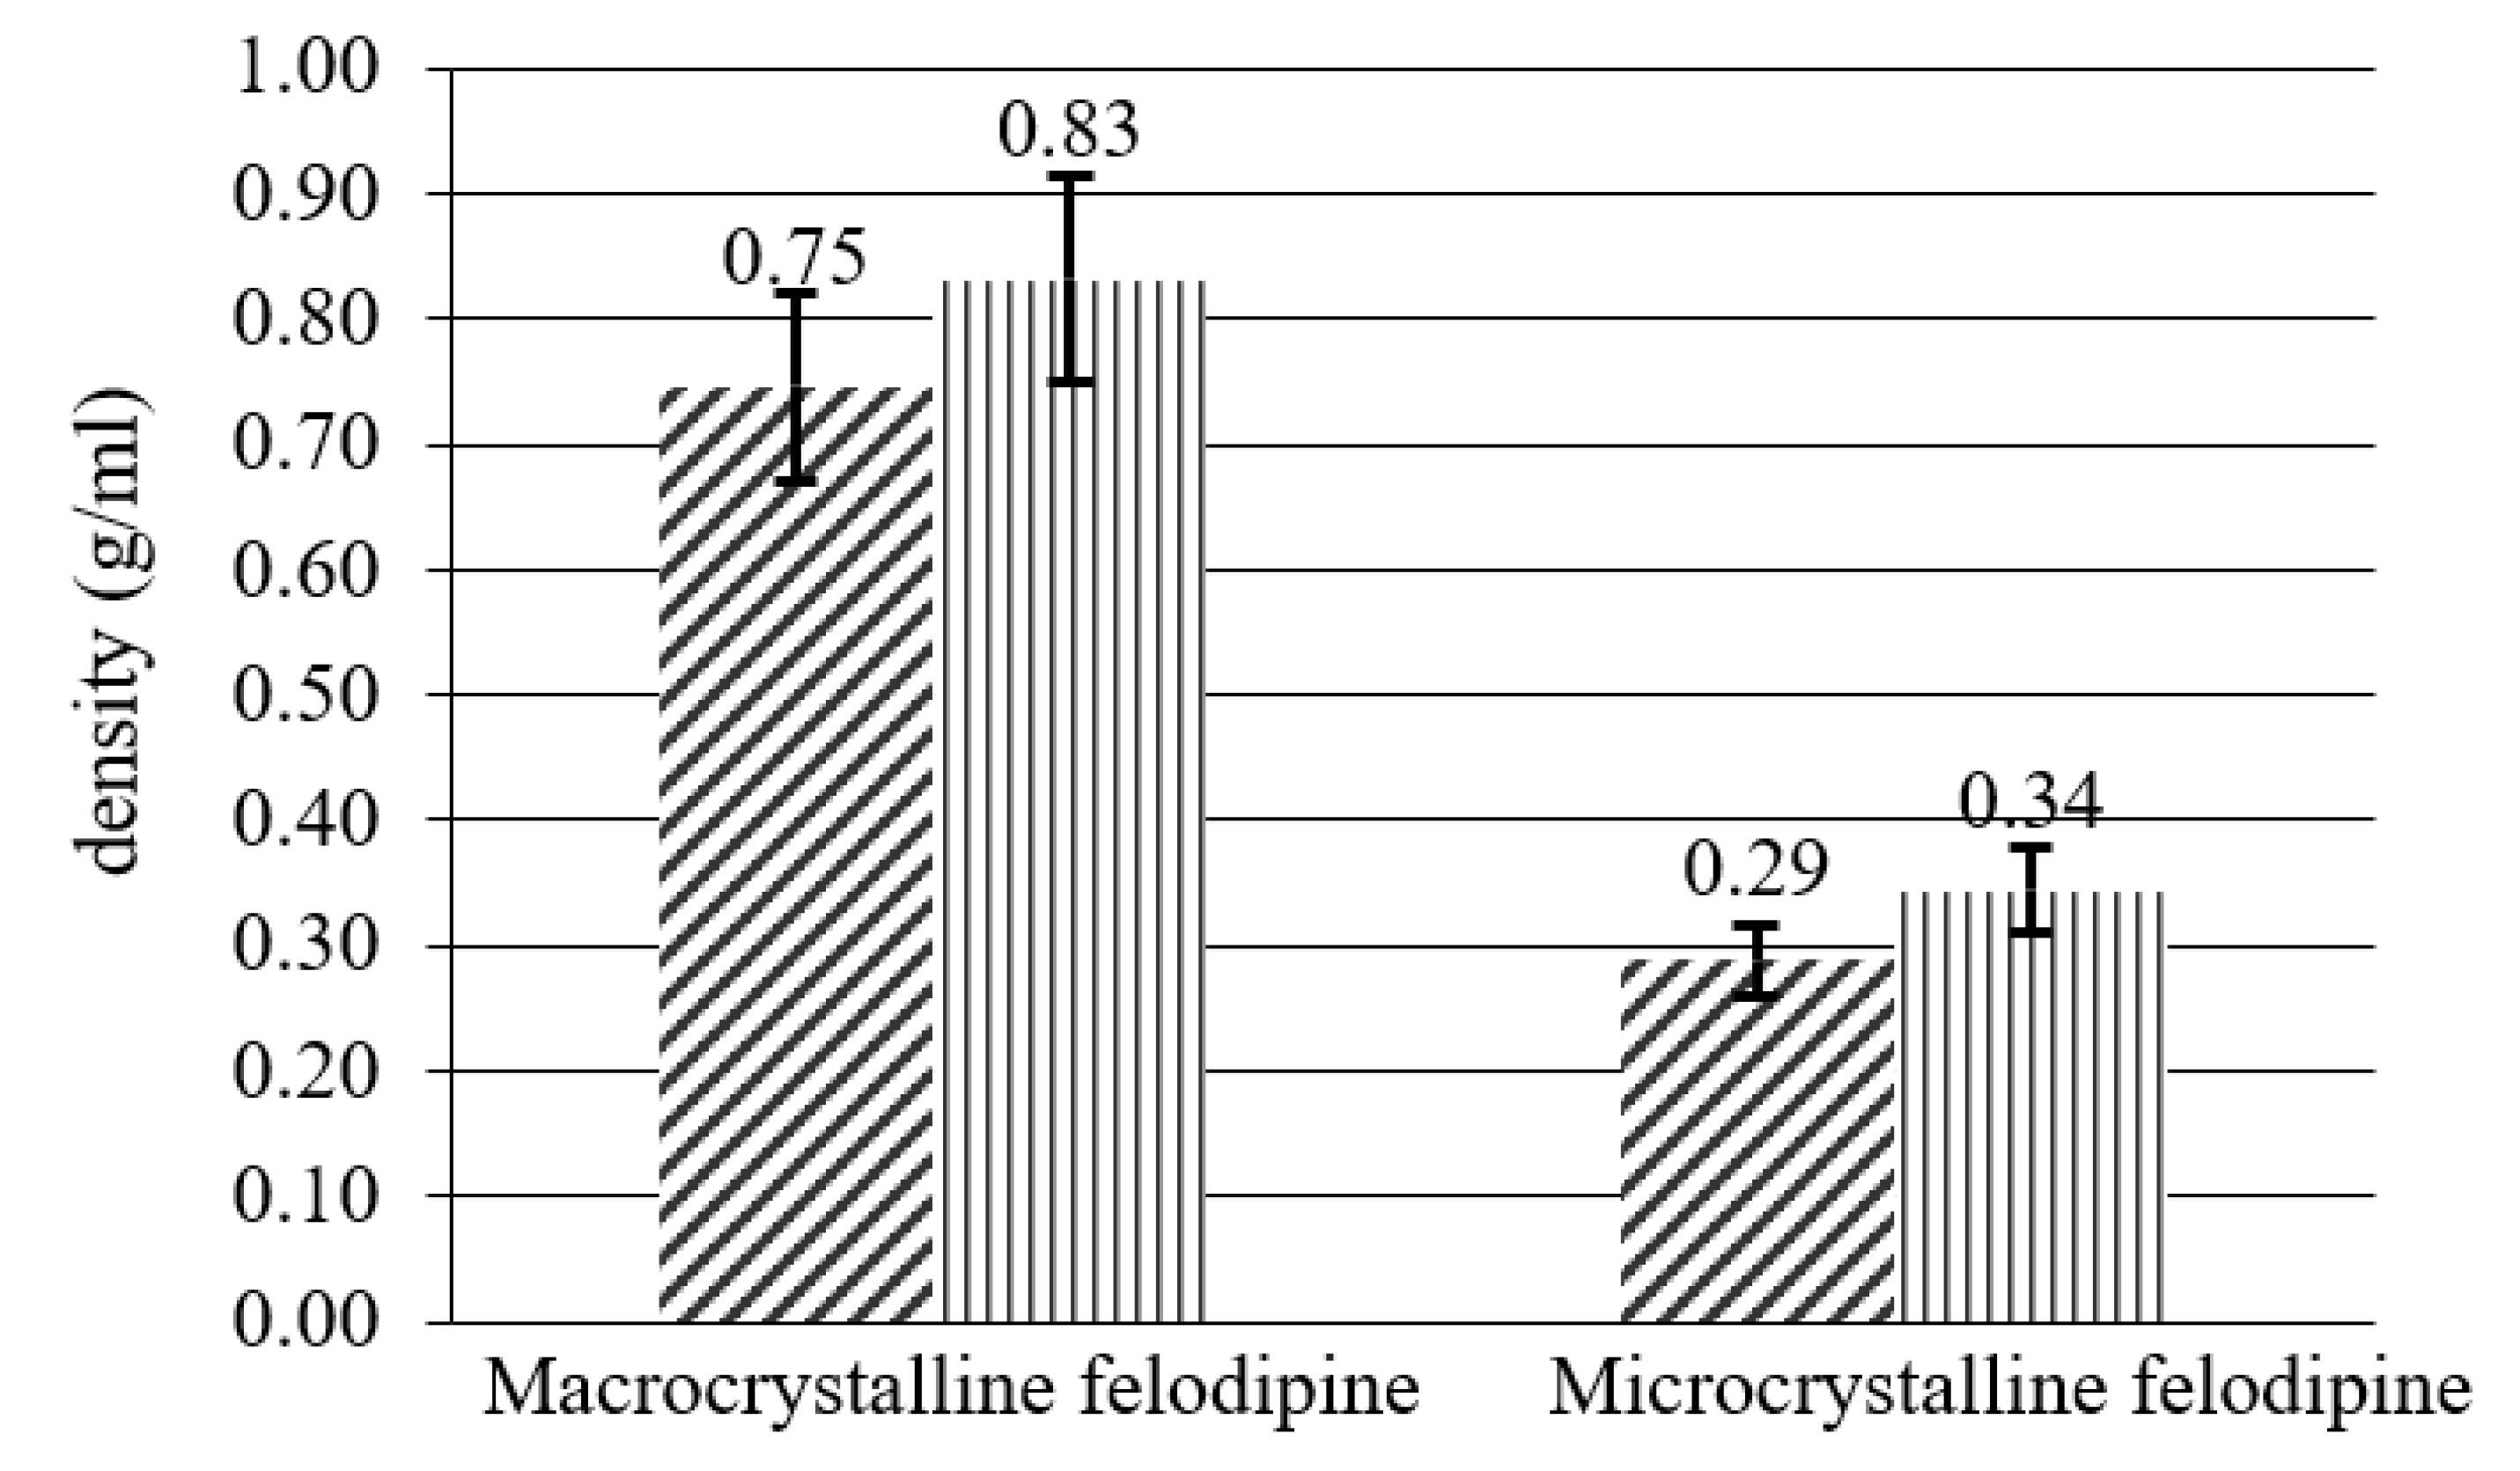
| Ingredient | Density (g/mL) | Flowability and Compressibility Indexes | ||
|---|---|---|---|---|
| Bulk | Tapped | CI | HR | |
| macrocrystalline felodipine | 0.7461 | 0.8318 | 11.49 | 1.11 |
| microcrystalline felodipine | 0.2882 | 0.3440 | 19.36 | 1.19 |
| (a) | |||
| Medium | Difference Factor f1 | Similarity Factor f2 | |
| LSNa 1.00%-CTAB 0.40% | REF | 32.24 | 37.85 |
| LSNa 1.00%-CTAB 0.40% | F1 | - | - |
| LSNa 1.00%-CTAB 0.40% | F2 | 37.89 | 36.99 |
| LSNa 1.00%-CTAB 0.40% | F3 | 22.90 | 36.76 |
| LSNa 1.00%-CTAB 0.40% | F4 | 128.12 | 14.32 |
| LSNa 1.00%-CTAB 0.40% | F5 | 23.82 | 58.34 |
| LSNa 1.00%-CTAB 0.40% | F6 | - | - |
| LSNa 1.00%-CTAB 0.40% | F7 | 36.22 | 35.46 |
| LSNa 1.00%-CTAB 0.40% | F8 | 15.50 | 57.20 |
| LSNa 1.00%-CTAB 0.40% | F9 | 17.62 | 55.69 |
| (b) | |||
| Medium | Difference Factor f1 | Similarity Factor f2 | |
| REF–F1 | LSNa 1.00% | - | - |
| REF–F2 | LSNa 1.00% | 12.53 | 58.87 |
| REF–F3 | LSNa 1.00% | 31.56 | 37.43 |
| REF–F4 | LSNa 1.00% | 92.45 | 4.86 |
| REF–F5 | LSNa 1.00% | 35.68 | 40.47 |
| REF–F6 | LSNa 1.00% | - | - |
| REF–F7 | LSNa 1.00% | 11.79 | 56.67 |
| REF–F8 | LSNa 1.00% | 33.60 | 40.49 |
| REF–F9 | LSNa 1.00% | 14.55 | 58.74 |
| REF–F1 | CTAB 0.40% | 43.98 | 39.44 |
| REF–F2 | CTAB 0.40% | 21.35 | 55.83 |
| REF–F3 | CTAB 0.40% | 31.35 | 37.43 |
| REF–F4 | CTAB 0.40% | 15.70 | 51.27 |
| REF–F5 | CTAB 0.40% | 38.68 | 39.38 |
| REF–F6 | CTAB 0.40% | - | - |
| REF–F7 | CTAB 0.40% | 33.66 | 39.30 |
| REF–F8 | CTAB 0.40% | 11.57 | 62.91 |
| REF–F9 | CTAB 0.40% | 37.24 | 51.48 |
| Formulation | Dissolution Media | Difference Factor f1 | Similarity Factor f2 |
|---|---|---|---|
| F10–F11 | LSNa 1.00% | 49.86 | 32.16 |
| F10–F11 | CTAB 0.40% | 20.05 | 57.61 |
| Formulation | Dissolution Media | Difference Factor f1 | Similarity Factor f2 |
|---|---|---|---|
| F12–F13 | LSNa 1.00% | 7.13 | 64.42 |
| F12–F13 | CTAB 0.40% | 9.35 | 74.57 |
| Formulation | Dissolution Media | Difference Factor f1 | Similarity Factor f2 |
|---|---|---|---|
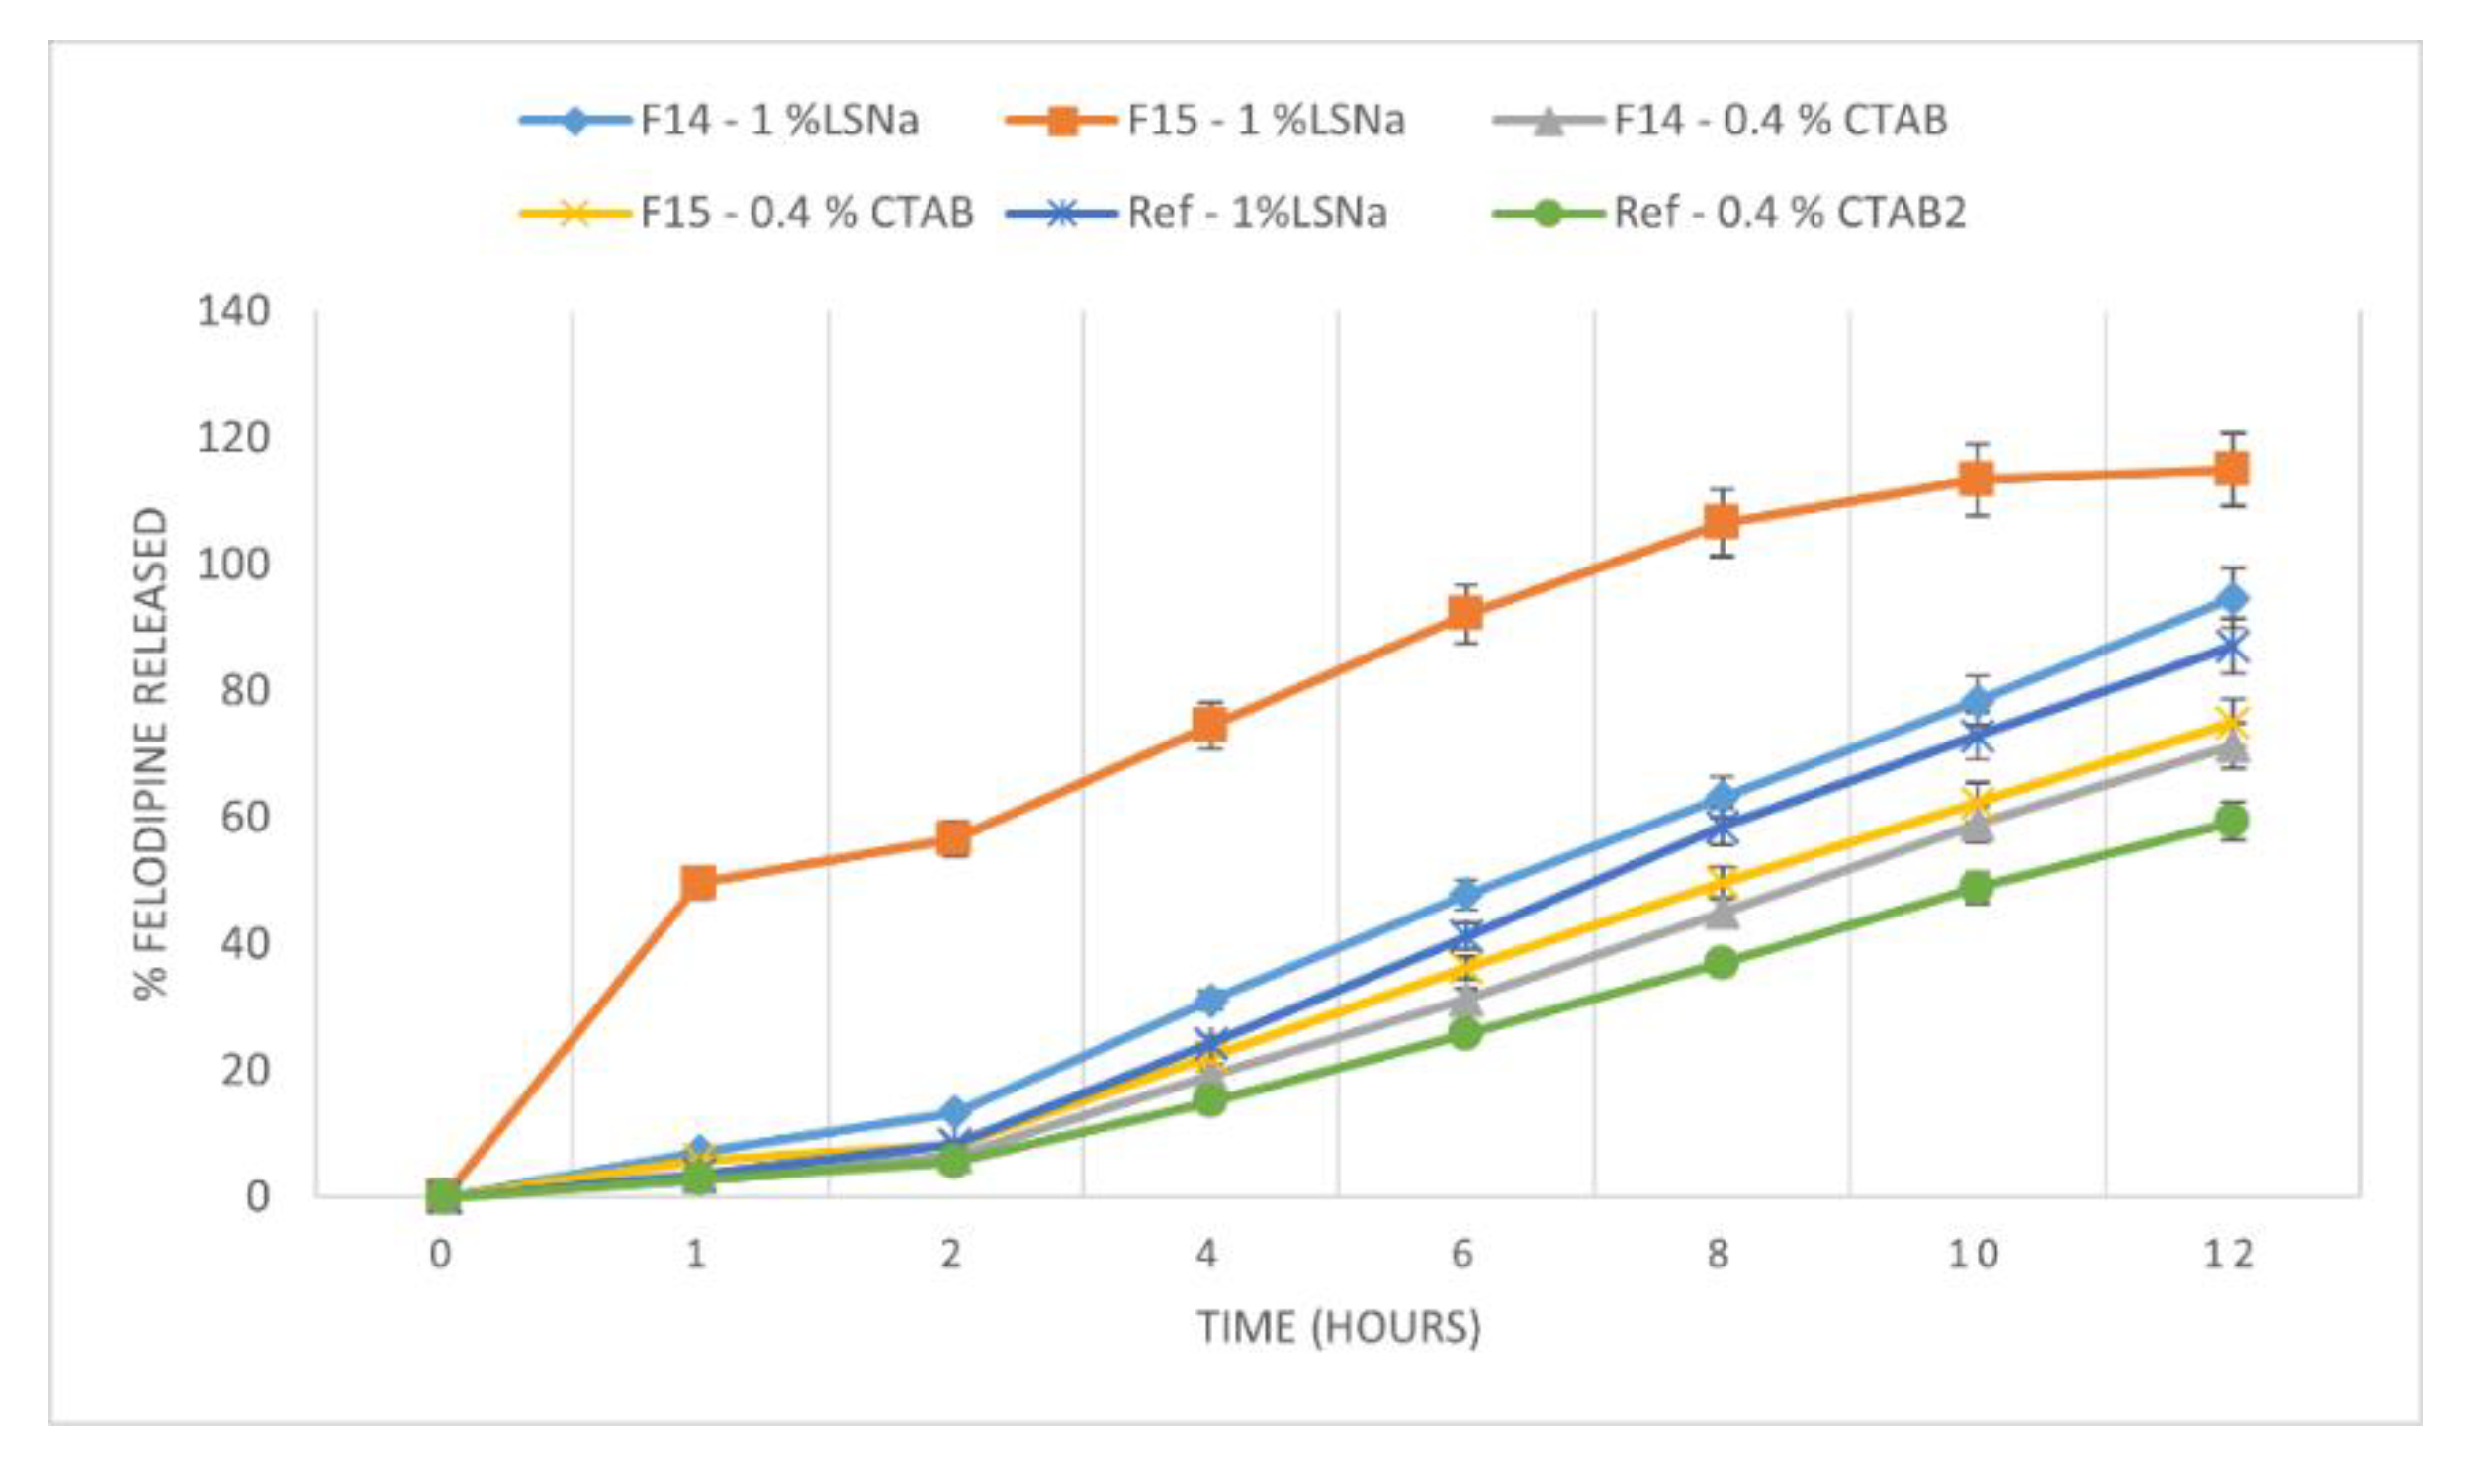
| REF–F14 | LSNa 1.00% | 17.06 | 53.68 |
| REF–F15 | LSNa 1.00% | 111.07 | 16.85 |
| REF–F14 | CTAB 0.40% | 17.90 | 53.86 |
| REF–F15 | CTAB 0.40% | 11.51 | 63.03 |
| LSNa–CTAB | F14 | 42.59 | 40.12 |
| LSNa–CTAB | F15 | 134.18 | 15.01 |
| Dissolution Medium/ Tablet Formulation | Drug Release Exponents, n and Regression Coefficient, R2 | |||||
|---|---|---|---|---|---|---|
| 1.0% LSNa | 0.4% CTAB | |||||
| Equation | n | R2 | Equation | n | R2 | |
| F1 | y = 0.48x + 2.20 | 0.48 | - | y = 1.38x − 4.59 | 1.38 | 0.9893 |
| F2 | y = 1.20x − 3.52 | 1.20 | 0.9989 | y = 0.97x − 2.62 | 0.97 | 0.9893 |
| F3 | y = 0.99x − 1.63 | 0.99 | 0.9850 | y = 1.29x − 3.71 | 1.29 | 0.9972 |
| F4 | y = 0.24x + 3.14 | 0.24 | 0.9880 | y = 0.77x − 0.75 | 0.77 | 0.9873 |
| F5 | y = 3.32x − 11.20 | 3.32 | - | y = 0.54x + 0.88 | 0.54 | 0.9650 |
| F6 | y = 0.06x + 4.45 | 0.06 | - | y = 0.09x + 4.17 | 0.09 | - |
| F7 | y = 0.47x + 0.53 | 0.47 | 0.9248 | y = 0.84x − 1.67 | 0.84 | 0.9697 |
| F8 | y = 0.99x − 2.08 | 0.99 | 0.9880 | y = 1.05x − 2.98 | 1.05 | 0.9909 |
| F9 | y = 1.05x − 2.38 | 1.05 | 0.9878 | y = 1.28x − 4.16 | 1.28 | 0.9961 |
| F10 | y = 1.01x − 2.26 | 1.01 | 0.9969 | y = 1.13x − 3.39 | 1.13 | 0.9971 |
| F11 | y = 0.39x + 1.90 | 0.39 | 0.9579 | y = 1.51x − 5.87 | 1.51 | 0.9746 |
| F12 | y = 0.62x + 0.34 | 0.62 | 0.9675 | y = 0.98x − 2.38 | 0.98 | 0.9625 |
| F13 | y = 0.97x − 1.72 | 0.97 | 0.9950 | y = 1.25x − 4.09 | 1.25 | 0.9847 |
| F14 | y = 1.05x − 2.38 | 1.05 | 0.9970 | y = 1.28x − 4.16 | 1.28 | 0.9961 |
| F15 | y = 0.37x + 2.32 | 0.37 | 0.9750 | y = 1.09x − 2.89 | 1.09 | 0.9817 |
| F16 | y = 0.99x − 1.63 | 0.99 | 0.9850 | y = 1.29x − 3.71 | 1.29 | 0.9972 |
| F17 | y = 0.62x + 1.70 | 0.62 | - | y = 1.07x − 2.47 | 1.07 | 0.9862 |
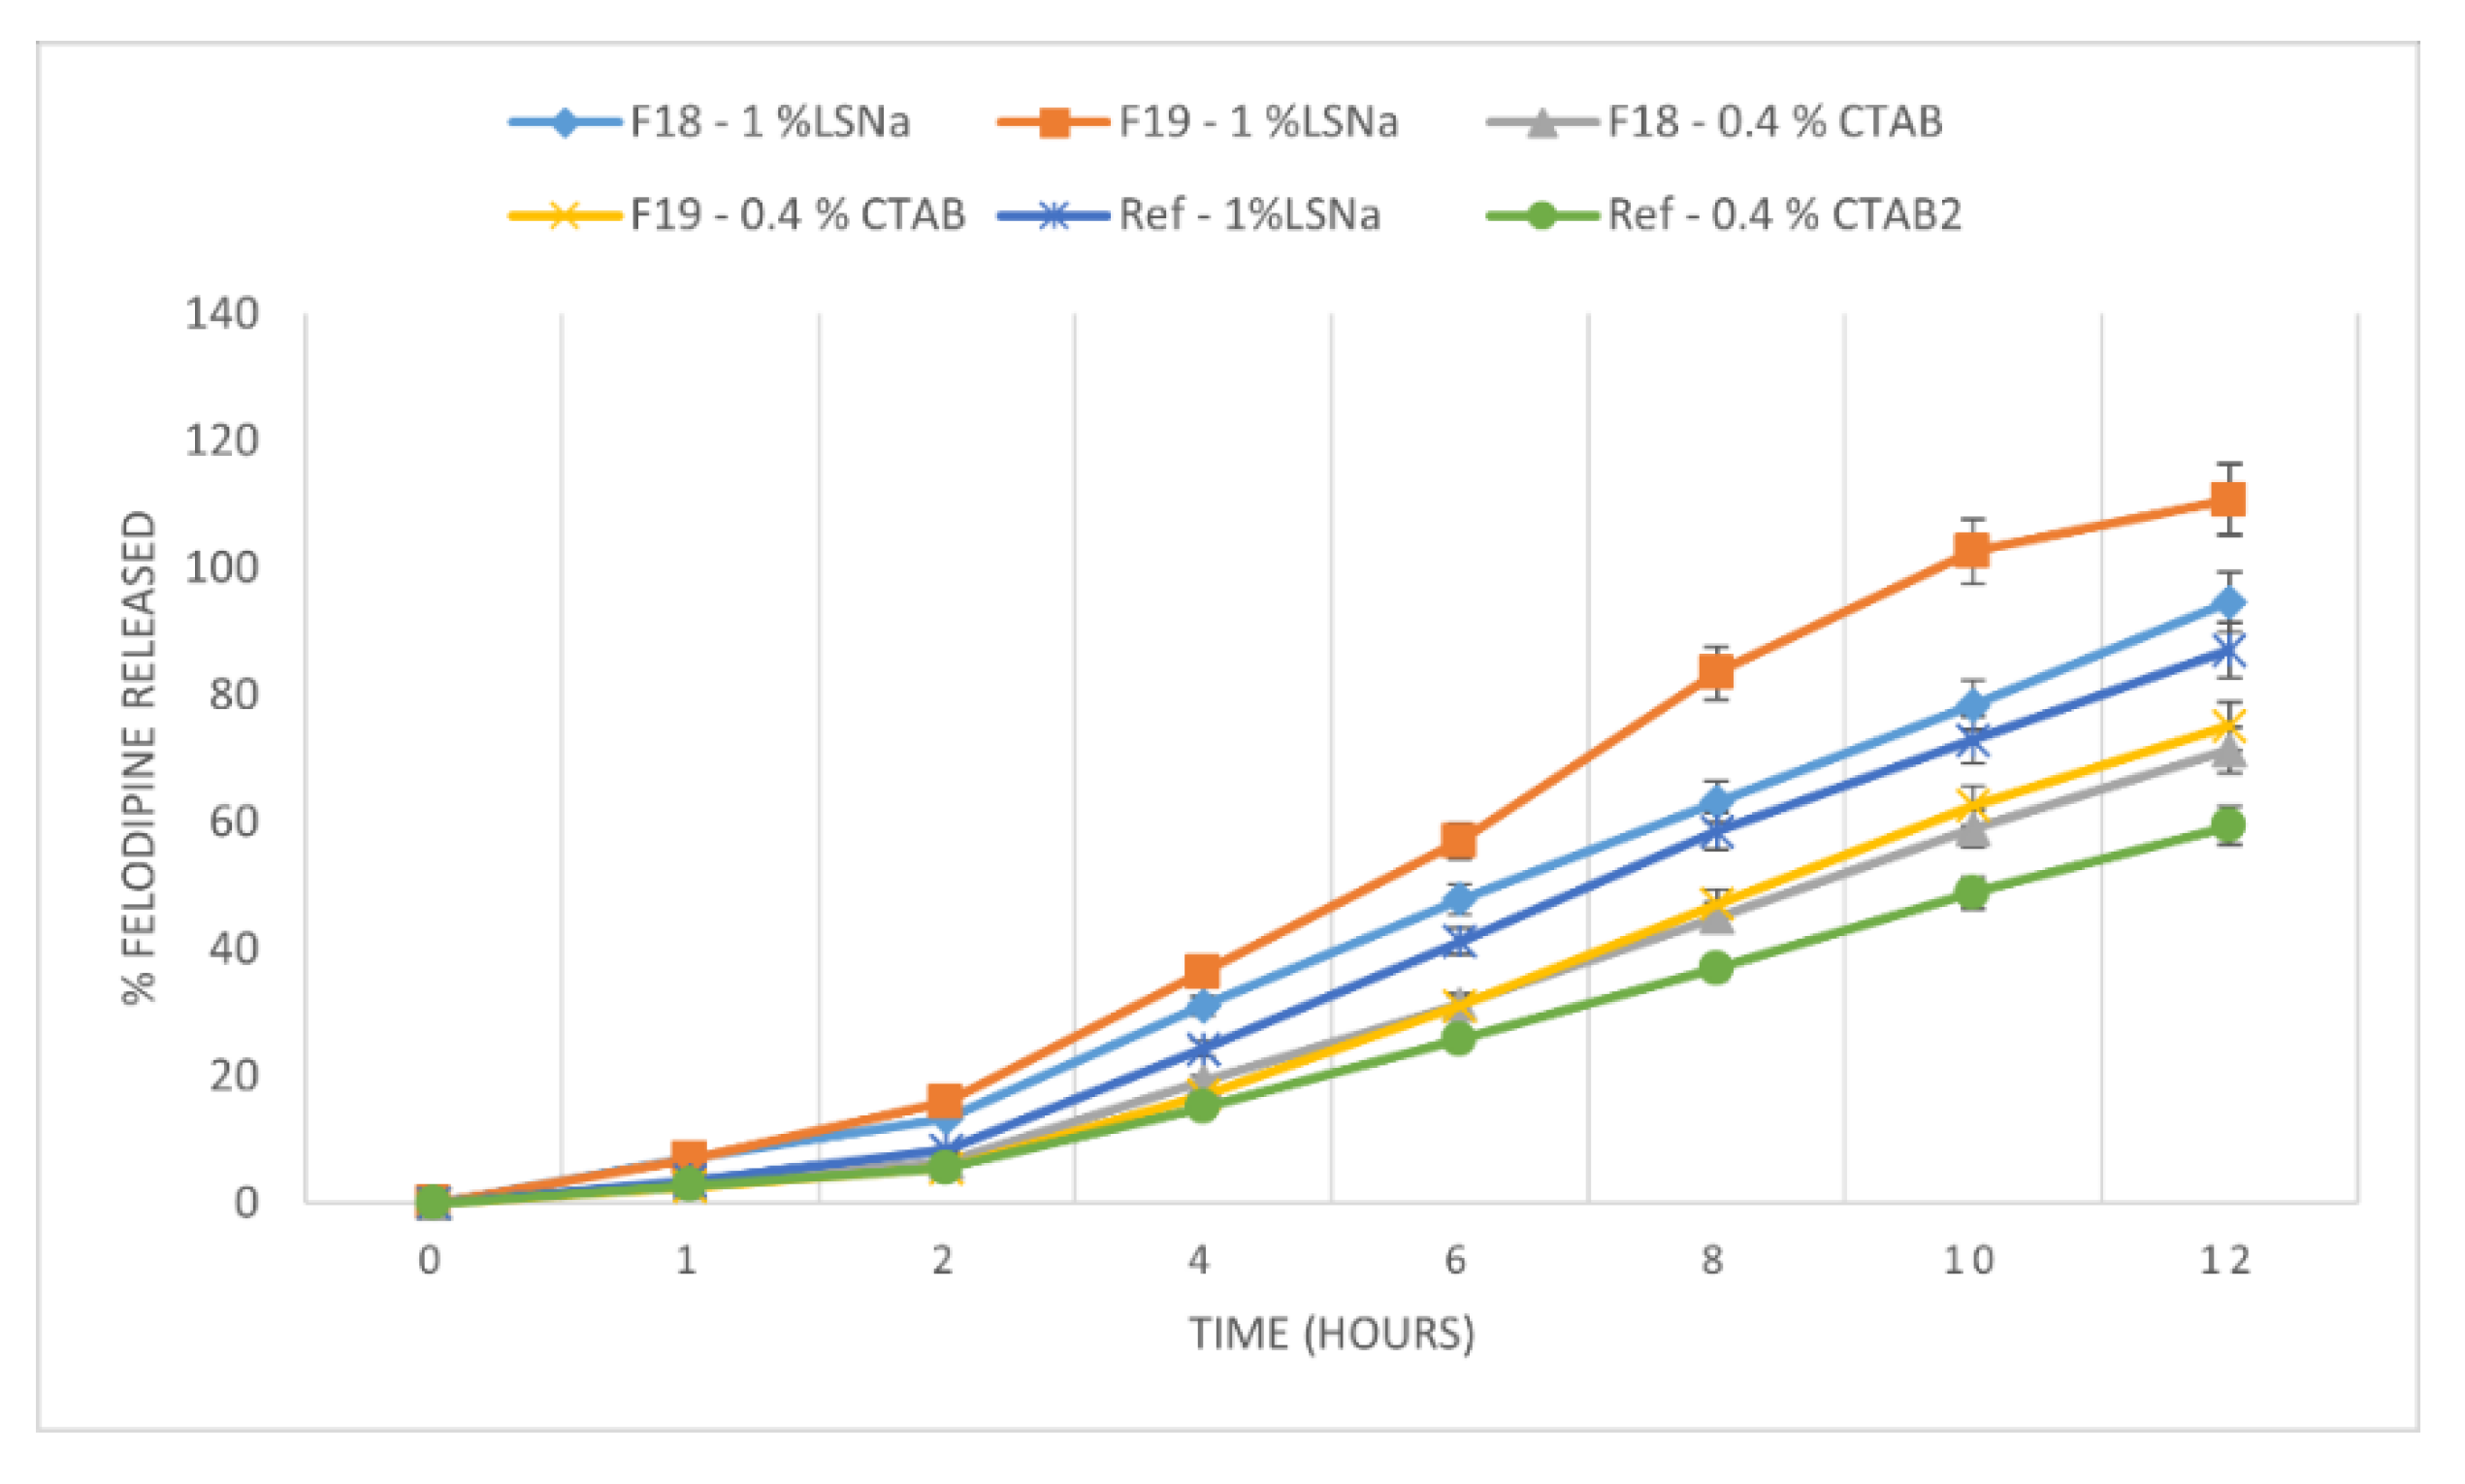
| F18 | y = 1.05x − 2.38 | 1.05 | 0.9970 | y = 1.28x − 4.16 | 1.28 | 0.9961 |
| F19 | y = 1.14x − 2.69 | 1.14 | 0.9960 | y = 1.47x − 4.89 | 1.47 | 0.9957 |
Publisher’s Note: MDPI stays neutral with regard to jurisdictional claims in published maps and institutional affiliations. |
© 2022 by the authors. Licensee MDPI, Basel, Switzerland. This article is an open access article distributed under the terms and conditions of the Creative Commons Attribution (CC BY) license (https://creativecommons.org/licenses/by/4.0/).
Share and Cite
Pop, A.L.; Musuc, A.M.; Nicoară, A.C.; Ozon, E.A.; Crisan, S.; Penes, O.N.; Nasui, B.A.; Lupuliasa, D.; Secăreanu, A.A. Optimization of the Preformulation and Formulation Parameters in the Development of New Extended-Release Tablets Containing Felodipine. Appl. Sci. 2022, 12, 5333. https://doi.org/10.3390/app12115333
Pop AL, Musuc AM, Nicoară AC, Ozon EA, Crisan S, Penes ON, Nasui BA, Lupuliasa D, Secăreanu AA. Optimization of the Preformulation and Formulation Parameters in the Development of New Extended-Release Tablets Containing Felodipine. Applied Sciences. 2022; 12(11):5333. https://doi.org/10.3390/app12115333
Chicago/Turabian StylePop, Anca Lucia, Adina Magdalena Musuc, Anca Cecilia Nicoară, Emma Adriana Ozon, Simona Crisan, Ovidiu Nicolae Penes, Bogdana Adriana Nasui, Dumitru Lupuliasa, and Ana Andreea Secăreanu. 2022. "Optimization of the Preformulation and Formulation Parameters in the Development of New Extended-Release Tablets Containing Felodipine" Applied Sciences 12, no. 11: 5333. https://doi.org/10.3390/app12115333