Article

A Hybrid ANN-GA Model for an Automated Rapid Vulnerability Assessment of Existing RC Buildings

by
Mehmet Akif Bülbül
1,
Ehsan Harirchian
2,*,
Mehmet Fatih Işık
3,
Seyed Ehsan Aghakouchaki Hosseini
4 and
Ercan Işık
5
1
Department of Computer Technologies, Hitit University, Çorum 19030, Turkey
2
Institute of Structural Mechanics (ISM), Bauhaus-Universität Weimar, 99423 Weimar, Germany
3
Department of Electrical-Electronics Engineering, Hitit University, Çorum 19030, Turkey
4
Department of Built Environment Engineering, School of Future Environments, Auckland University of Technology, Auckland 1010, New Zealand
5
Department of Civil Engineering, Bitlis Eren University, Bitlis 13100, Turkey
*
Author to whom correspondence should be addressed.
Appl. Sci. 2022, 12(10), 5138; https://doi.org/10.3390/app12105138
Submission received: 25 April 2022 / Revised: 14 May 2022 / Accepted: 17 May 2022 / Published: 19 May 2022

Abstract

:
Determining the risk priorities for the building stock in highly seismic-prone regions and making the final decisions about the buildings is one of the essential precautionary measures that needs to be taken before the earthquake. This study aims to develop an Artificial Neural Network (ANN)-based model to predict risk priorities for reinforced-concrete (RC) buildings that constitute a large part of the existing building stock. For this purpose, the network parameters in the network structure have been optimized by establishing a hybrid structure with the Genetic Algorithm (GA). As a result, the ANN model can make accurate predictions with maximum efficiency. The suggested ANN model is a feedforward back-propagation network model. It aims to predict the risk priorities for 329 RC buildings in the most successful way, for which the performance score was calculated using the Turkey Rapid Evaluation Method (2013). In this paper, a GA-ANN hybrid model was implemented in which the ANN, using the most successful gene revealed by the model, produced successful results in calculating the performance score. In addition, the required input parameters for obtaining more efficient results in solving such a problem and the parameters that need to be used in establishing such an ANN network structure have been optimized. With the help of such a model, the operation process will be eliminated. The created hybrid model was 98% successful in determining the risk priority in RC buildings.

1. Introduction

Significant loss of life and property due to structural damages and failures is frequently caused by earthquakes and similar natural disasters that strike different world regions. Especially, the large-scale damages after earthquakes reveal the importance of precautionary measures that can be taken before earthquakes [1,2,3,4]. Designing earthquake-resistant structures and prioritizing existing vulnerable structures for further retrofitting plans are among the prominent measures that can extensively mitigate the following disasters since it does not seem possible to predict earthquakes with current technology [5,6,7]. Rocketing populations in urban areas and expanding building stocks day-by-day can pose severe risks of damage or failure depending on the characteristics of existing structures. In this context, determining the earthquake safety levels of buildings before a possible earthquake helps make accurate and fast decisions on the existing building stock [8,9,10,11]. Many existing building stocks make it difficult to evaluate them in a reasonable timeframe and present challenges—like lack of qualified personnel and economic resources [12,13]. Even a detailed examination of the seismic safety level of a building can take days. Therefore, it does not seem reasonable to examine every existing structure in detail. As a solution, risk priorities can be decided on a regional basis using methods that will provide faster and more accurate results than time-consuming techniques for individual structures. In this regard, rapid screening methods are used to determine the risk priorities of buildings. Therefore, the preliminary earthquake safety levels of the building stock in any region can be determined, and risk priorities can be decided on a regional basis [14,15,16]. The data obtained as a result of these methods can decide which buildings will be subjected to detailed structural analyses within the scope of performance-based earthquake engineering. This will significantly reduce the number of risky buildings subjected to detailed structural analyses. In order to overcome the destructive effects of earthquakes on the structural parameters and responses of buildings and reduce human losses, different countries have developed various approaches and methodologies related to rapid screening techniques. These methods enable decision-makers to adopt vital measures available in a modern pre-disaster management sense while also playing a pivotal role in spatial planning and urban transformation [17,18,19,20]. These approaches were first put on a legal basis with the regulation published officially by the Ministry of Environment and Urbanization in 2013 in Turkey (PDRB-2013). With this regulation, the evaluation of risky structures and their regional prioritization are explained extensively for different structural systems. The performance scores for each building can be calculated based on the parameter values in this method. In this study, the performance scores were determined for 329 RC buildings to assess the earthquake risk priority using the Turkish rapid screening method by the authors within the scope of this study.
Soft Computing (SC) techniques, including ANN, GA, and Machine Learning (ML) tools, have found many opportunities in different science and engineering applications. These methods can make more enhanced predictions while also being applied to solve intricate problems very fast with high levels of efficiency and performance. When it comes to structural and earthquake engineering applications, these techniques play a pivotal role in simulation, modelling, optimization, regression and classification, etc. [21,22,23,24,25].
ANNs have been developed based on the concept of imitating the behaviour of biological systems and the human brain in terms of learning, adaptation, and memory ability. General architectures that can be considered for a neural network are Feedforward (single-layer and multiple-layer), Feedback (Recurrent), and Mesh architectures [26]. Some examples of ANN applications in the field of structural engineering include developing prediction models for the compressive strength and slump of concrete [27,28], prediction of the strength capacities of reinforced concrete members under different internal stresses [29,30], shear strength of reinforced masonry walls [31], a prediction model for lateral–torsional buckling resistance of slender steel cellular beams [32], structural crack detection [33], design and compression capacity prediction of concrete-filled steel tubular columns [34,35], compressive strength prediction of self-compacting and high-performance concrete [36], predicting the mechanical behaviour of semi-rigid steel structure connections [37], predicting cyclic hysteresis behaviour of reduced beam sections in steel buildings [38], damage assessment of pre-stressed concrete beams [39], fire resistance prediction of RC T-beams strengthened with carbon fibre reinforced polymers [40], structural health monitoring and damage identification of bridges [41,42], seismic damage prediction of RC buildings [43], and establishment of prediction models for the damage state, damage ratio, and seismic vulnerability assessment of buildings [44,45,46,47]. Additionally, Esteghamati and Flint (2021) determined that the most influential parameters resulting from machine learning are floor area, building height, lateral-resisting frame weight, and average beam section dimensions by making simulation-based seismic and environmental assessments of 720 mid-rise reinforced-concrete office buildings in South Carolina [48]. Abdullahi et al. (2022) proposed a framework that is sensitive to the uncertainties found in the optimization of engineering structures. The algorithm proposed for optimal shape design for gravity dams in this study includes a series of local and global time-varying/invariant performance indices [49]. Omoya et al. (2022) created a database to support post-earthquake damage and recovery modelling by considering 3695 buildings affected by the 2014 South Napa, California earthquake. The Napa dataset indicated the usability of different modelling techniques to validate post-earthquake recovery simulation methodologies and predict damage [50]. Esteghamati et al. (2020) have created an open-access Inventory of Seismic Structural Evaluations, Performance Functions, and Taxonomies for Buildings (INSSEPT) that includes evaluations in terms of performance-based earthquake engineering for 222 buildings. The study provides data to determine the regional seismic risk analysis for buildings [51]. Ahmad et al. (2022) developed a new stacked long-short-term memory (LSTM) network for fragility curves that vary depending on many properties. In this network, where overlapping data with the previous stack is taken into account to connect each stack, the temporal dimension and time for training are shortened. The flexible model can be used in different structures [52]. Yuan et al. (2022) developed a multivariate classifier with multiple IMs to estimate earthquake intensity and diversity in a fragility estimation. The generating classifier, seismic fragility, and earthquake damage estimations can be made [53]. De-Miguel-Rodriguez et al. (2022) proposed a massive method to reveal the seismic vulnerability of the existing building stock. With the help of neural networks, the capacity curves of low-rise RC buildings can be obtained with a minimum error [54]. Kim and Song (2022) proposed a deep neural network (DNN)-based framework to determine post-earthquake structural damage. In the study, a steel structure was chosen as a sample building and two different earthquake records were applied to this structure. With the proposed framework, the damage that may occur after the earthquake is correctly defined in time [55].
On the other hand, GA is a subset of evolutionary computing techniques that are metaheuristic algorithms with key characteristics of being bio-inspired, population-based, and stochastic. Inspired by biological mechanisms for operations on chromosomes, reproduction, crossover, and mutation, this algorithm can perform parallel mathematical computations, examine several input variables and their fitness simultaneously, and refine the search and find the best candidate solution that satisfies the objective function [21]. Owing to its capabilities in manipulating many variables, discrete variables, consideration of constraints on possible solutions, and simultaneous search and provision of alternative solutions for a single problem, GA has found a variety of applications in identification, multi-objective optimization, and simulation problems. The dynamic and static identification of base-isolated bridges [56], optimal sensor placement for the identification of structural parameters [57], structural damage detection [58,59], topology and shape optimization of free-form space frames [60,61], optimal design of a passive control strategy for seismic protection of a wall-frame system [62], and the optimization of fuzzy rule weights for the development of global damage levels of buildings [63] can be mentioned among many other applications of GA in structural and earthquake engineering.
In the studies conducted in the literature, the input parameters used in the ANN network structure, the number of hidden layers, the number of neurons in the hidden layers, the activation functions used in the neurons, and the learning algorithm of the network are determined by trial-and-error methods. The network parameters found here are directly effective in producing the most successful results of the network [64]. Different ANN network structures built on the same problem produce different results. In the network structure used in this study, the network parameters form a five-dimensional solution space. Determining the parameters to produce the best results for the network within this solution space is almost impossible by trial and error because there are nearly infinite solutions in such a solution space. Even if the models established according to the network parameters determined by trial and error in the literature achieve an inevitable success, studies on whether the established network is the most successful network or a network structure close to the most successful network structure are insufficient. In such a solution space, the most successful network structure or network structure parameters close to the most successful network structure can be determined through optimization algorithms. In determining the desired ANN structure for solving a problem, establishing hybrid structures with optimization algorithms is mandatory to produce the most successful result [65].
Within the scope of this study, it aims to predict the most successful risk priorities by implementing the results obtained from 329 RC buildings using an ANN and a GA. For this purpose, all suitable parameters found in an ANN network have been determined by establishing a hybrid structure with the GA. The chromosomes in each gene in the GA constitute the parameters in the network structure. The network model established to obtain the best network parameters is a feedforward back-propagation network model. Feedforward back-propagation networks are frequently used in the literature and can achieve successful results [65]. Thanks to the capability of the hybrid structure, the necessary network parameters for the rapid evaluation of reinforced-concrete buildings and the input parameters that should be used in solving such a problem are optimized. The proposed hybrid model enables rapid evaluations of existing RC buildings while decreasing classical approaches’ time, energy, and costs.
In this study, a hybrid model was used for the first time for the Turkish Rapid Assessment Method, which is used to determine regional risk priorities in RC buildings. The performance score was obtained for each building using the parameters considered in this method. Since the method is a rapid evaluation method, detailed structural analyses were not needed at this stage. The hybrid model created with the ANN-GA was realized by obtaining the network parameters through the GA optimization technique rather than trial and error, which is familiar to the classical method. The obtained results demonstrated the success of the proposed hybrid model for the rapid evaluation of existing RC building stocks. This model has a flexible structure that can easily be applied to different problems. Feedforward back-propagation ANN networks are frequently used in the literature. There were significant challenges in trial and error in determining the most successful network structure. Some of them were to find the required number of inputs to establish the most successful ANN network structure, the number of hidden layers and neurons in the hidden layers, the activation functions used in each layer, and the learning algorithm used in the network structure. The main difference of this study from other studies in the literature is that all parameters in the established ANN network structure are determined in a hybrid structure with a GA to produce the most successful result. Thanks to the established ANN-GA hybrid structure, the ANN network is created in the most optimal way to produce the most successful result.

2. Rapid Visual Screening Technique

Conducting detailed and advanced finite element (FE) analyses to evaluate dynamic responses and seismic risk conditions of the large building stock in a vast area has a substantial computational burden and is very time-consuming. Therefore, applying a rapid, reliable, and efficient approach for a seismic vulnerability assessment of building stock, determining risk priorities, and filtering out buildings with high-risk levels for further analyses is vital for seismic risk mitigation and post-disaster crisis management plans [66]. To overcome these problems, Rapid Visual Screening (RVS), a preliminary survey to observe and record structural parameters, evaluate damage grades of buildings, and prioritize them for further comprehensive analyses, has proven to be a successful means [67,68,69,70].
A performance score is assigned to a building through the survey outside or partially inside the building. Although there are many different methods, the main logic is based on obtaining the final score by taking into account the parameters that affect the seismic behaviour of the structure. Various approaches can be applied to analyse the data obtained from an RVS method for further risk prioritization and damage level classifications. A detailed review of different AI and SC techniques that have been used in the literature to conduct an RVS and damage classification of existing buildings can be found in [23].
Within the scope of this study, the 2013 Turkish Rapid Evaluation method has been taken into consideration as a rapid evaluation method for RC buildings [71]. The parameters considered in this research, which can be used for existing 1–7 stories RC buildings, are given below:
  • Number of stories
  • Type of structural system
  • Current status and apparent quality
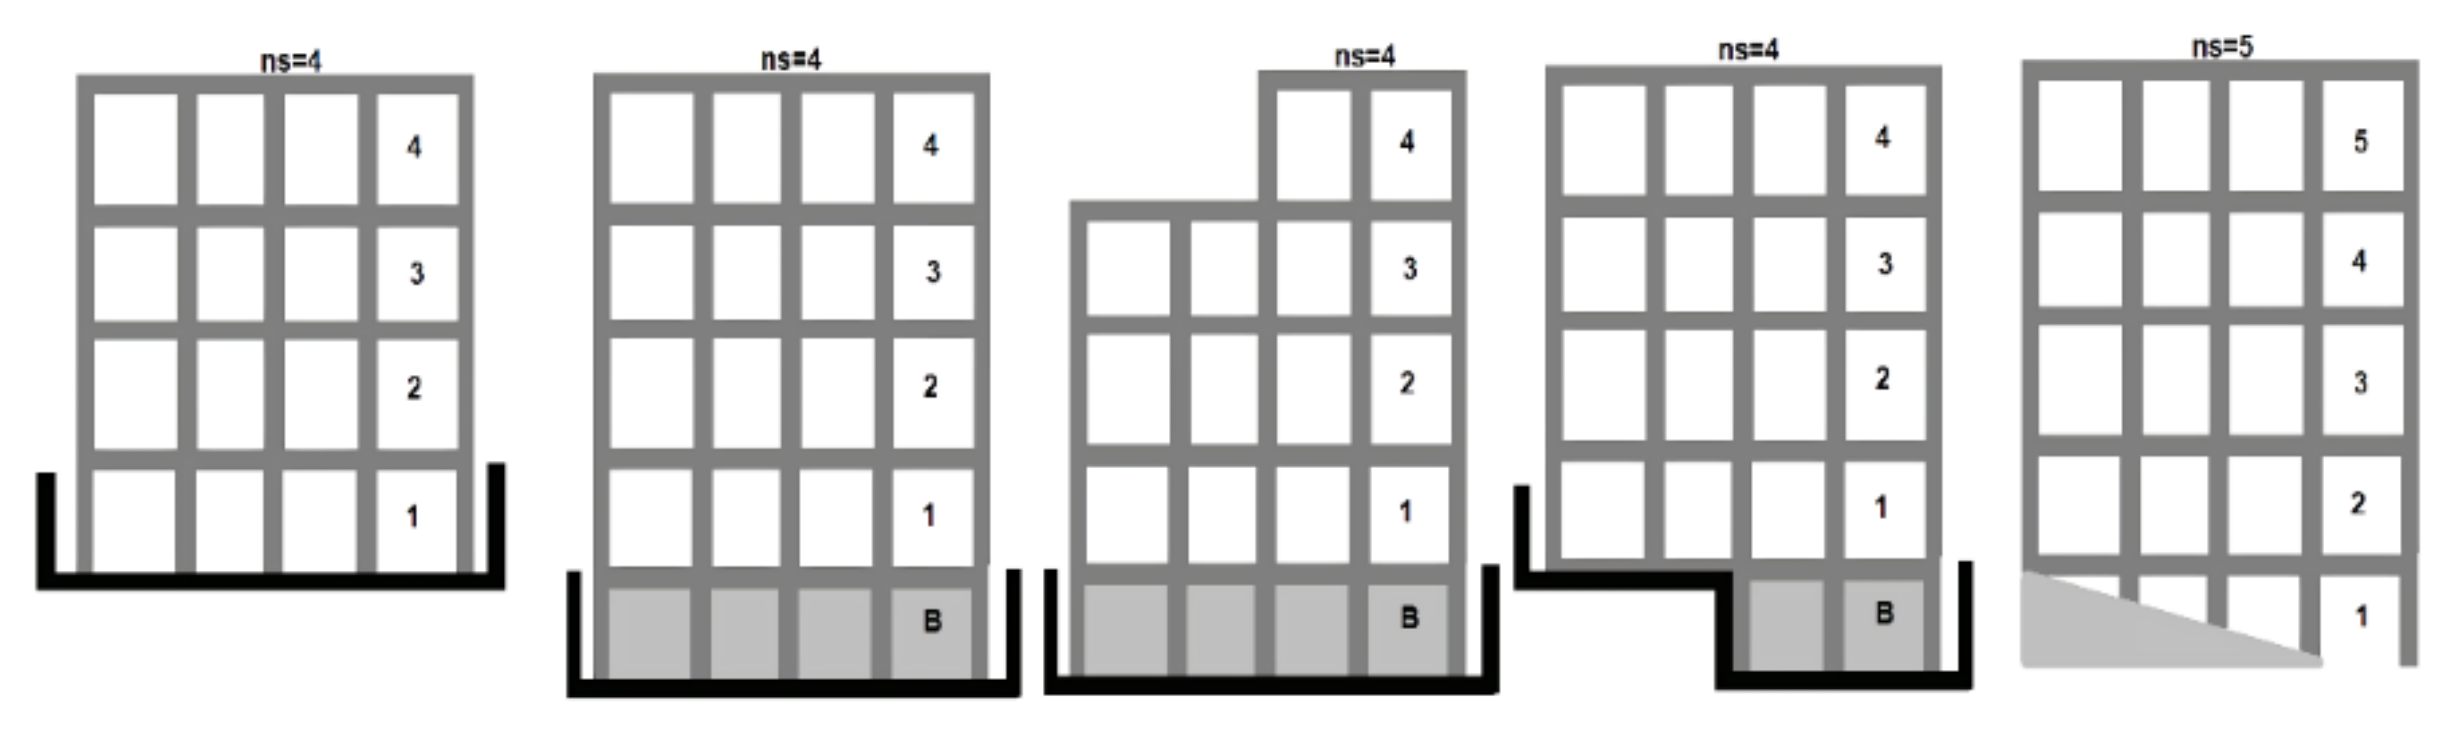
  • Soft story/weak story
  • Vertical irregularity
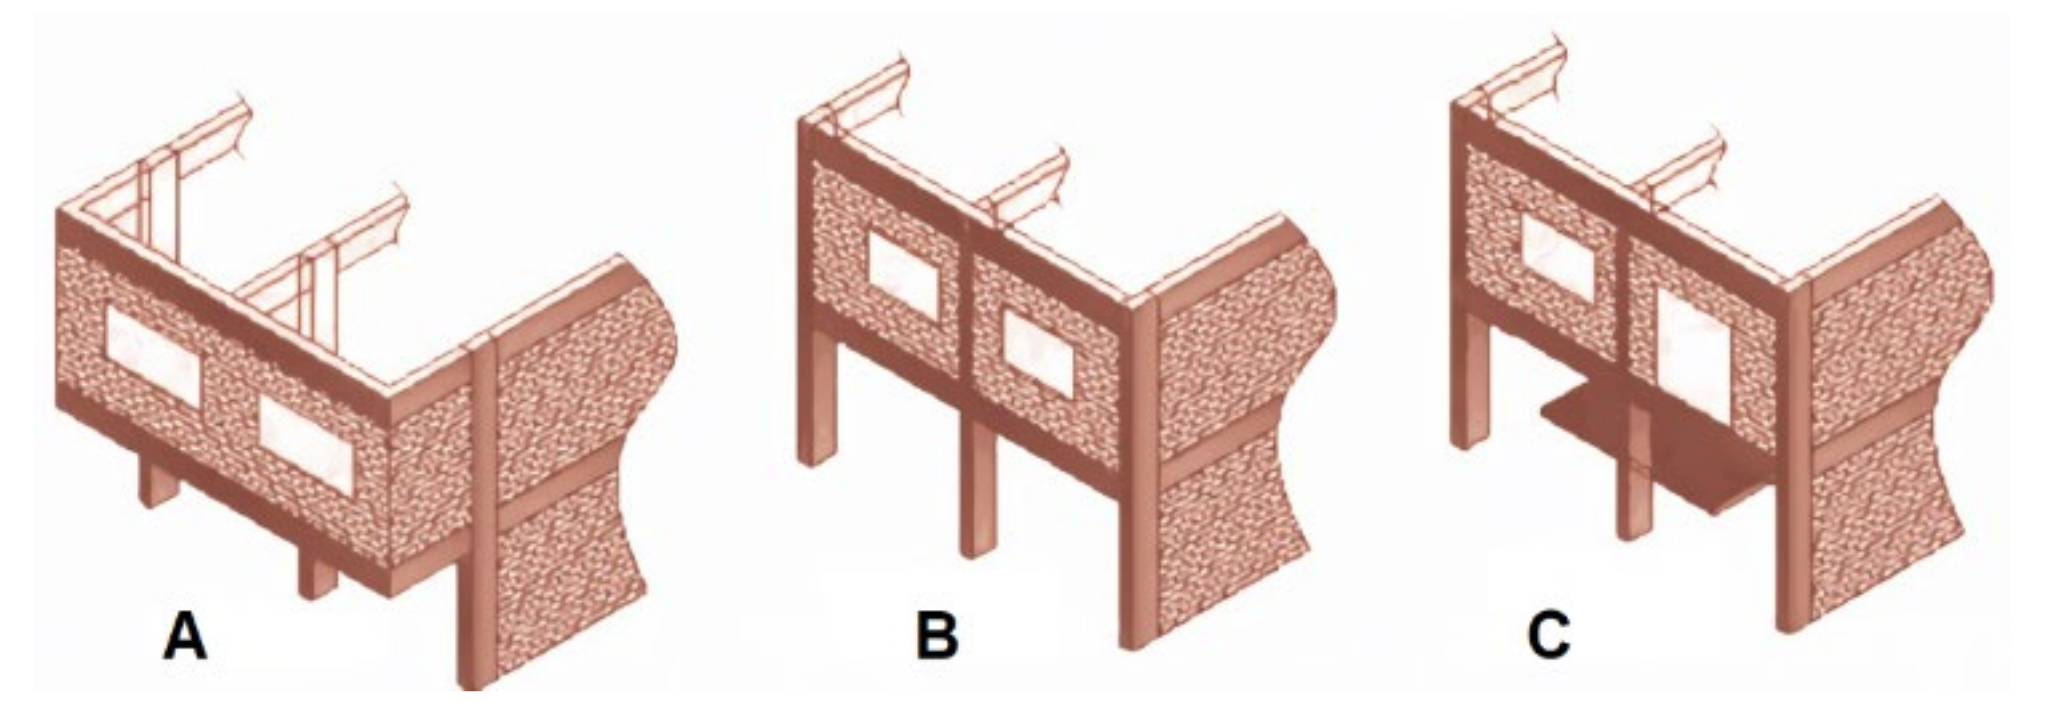
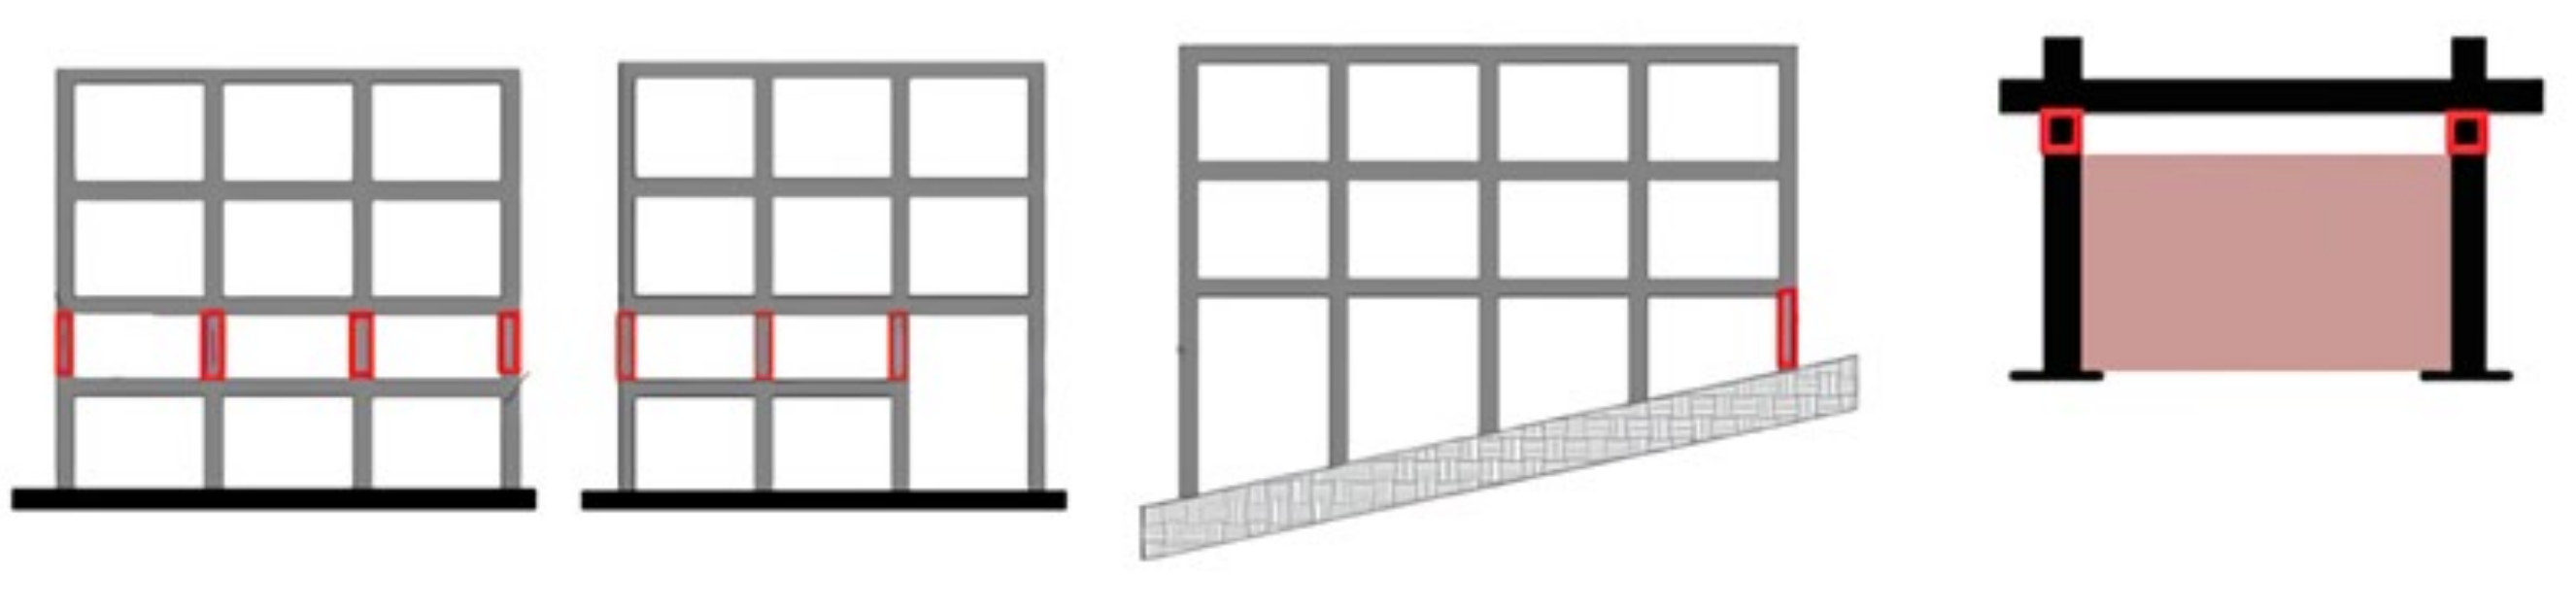
  • Heavy overhangs
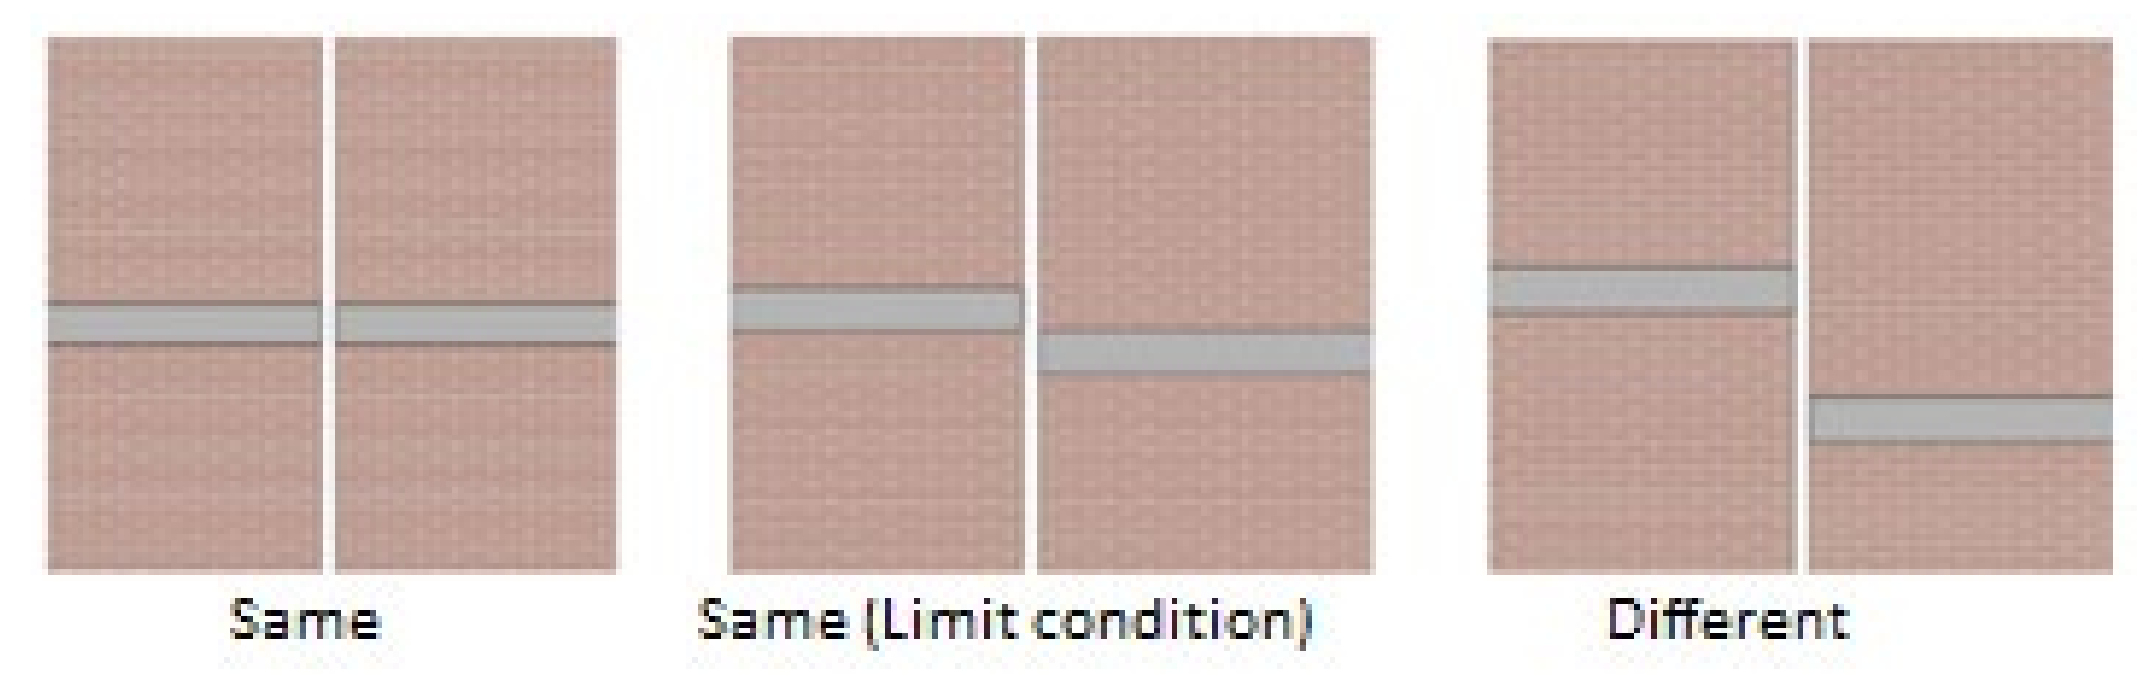
  • Irregularity/torsion effect in plan
  • Short column effect
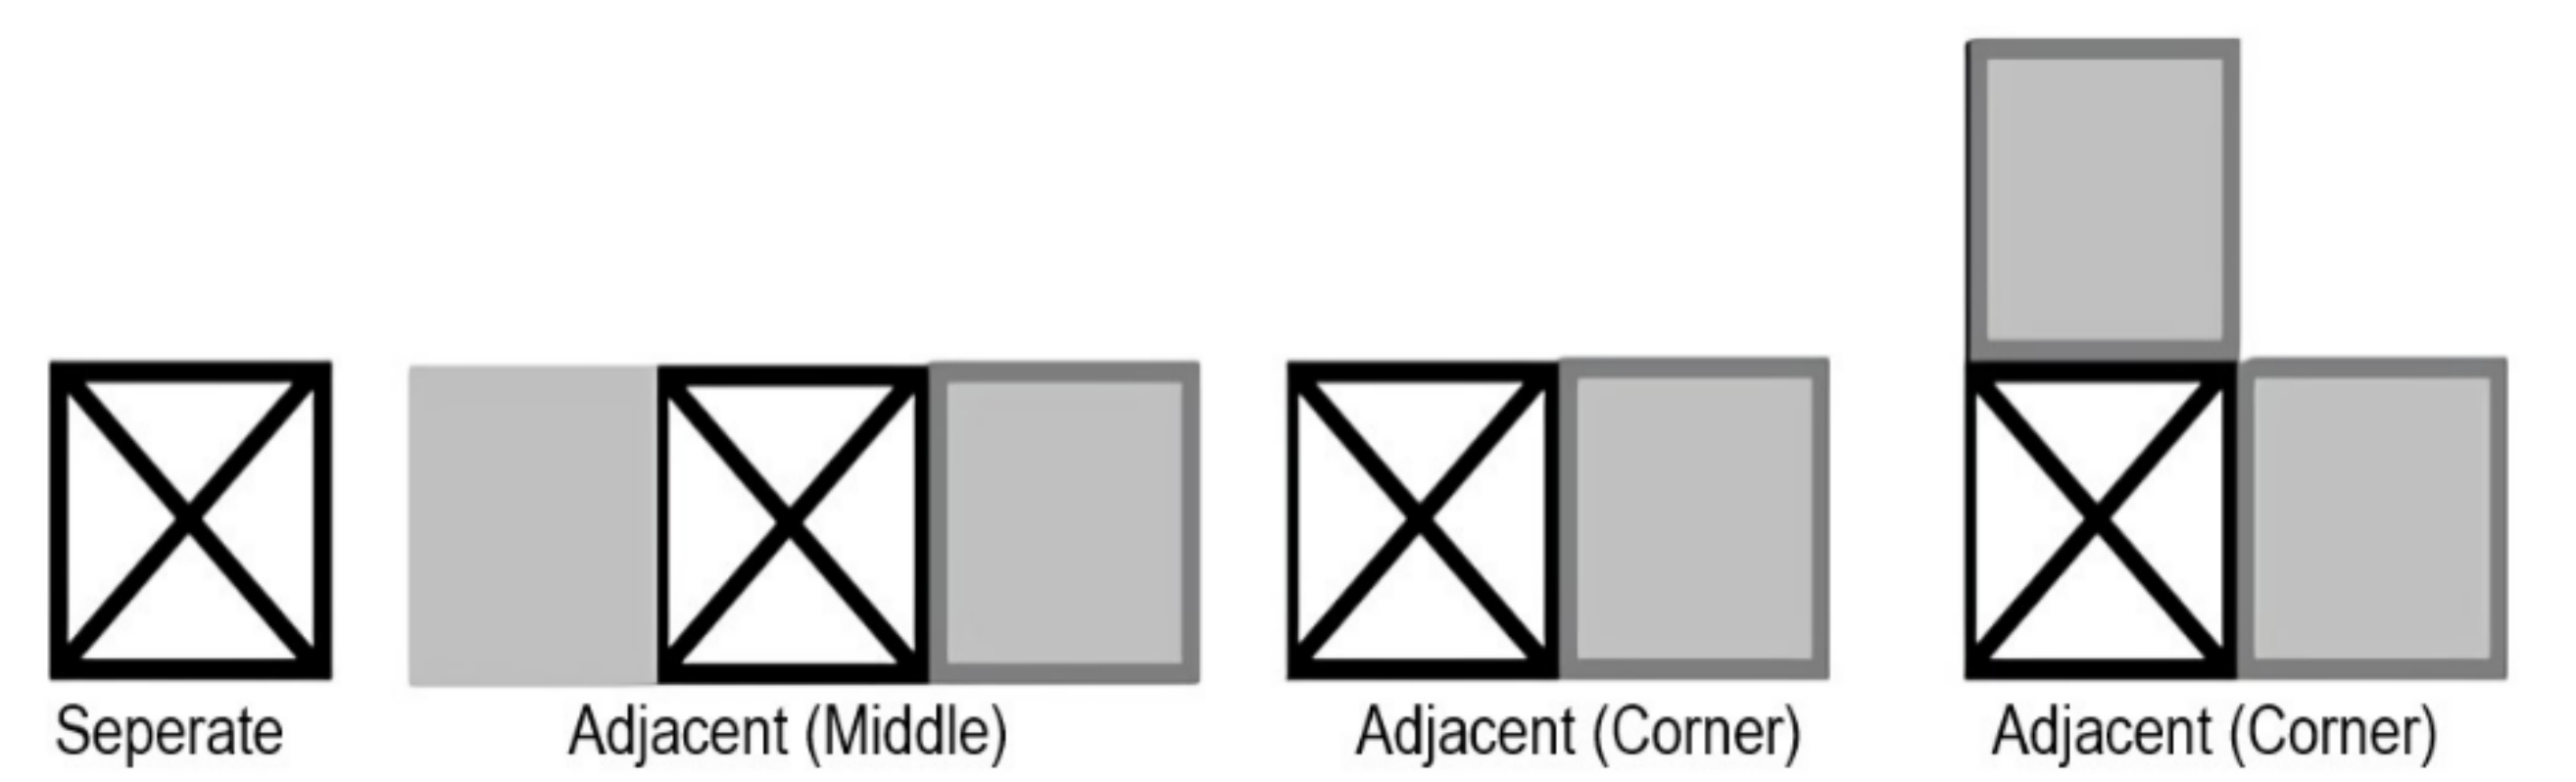
  • Adjacent/pounding effect
  • Hill/slope effect
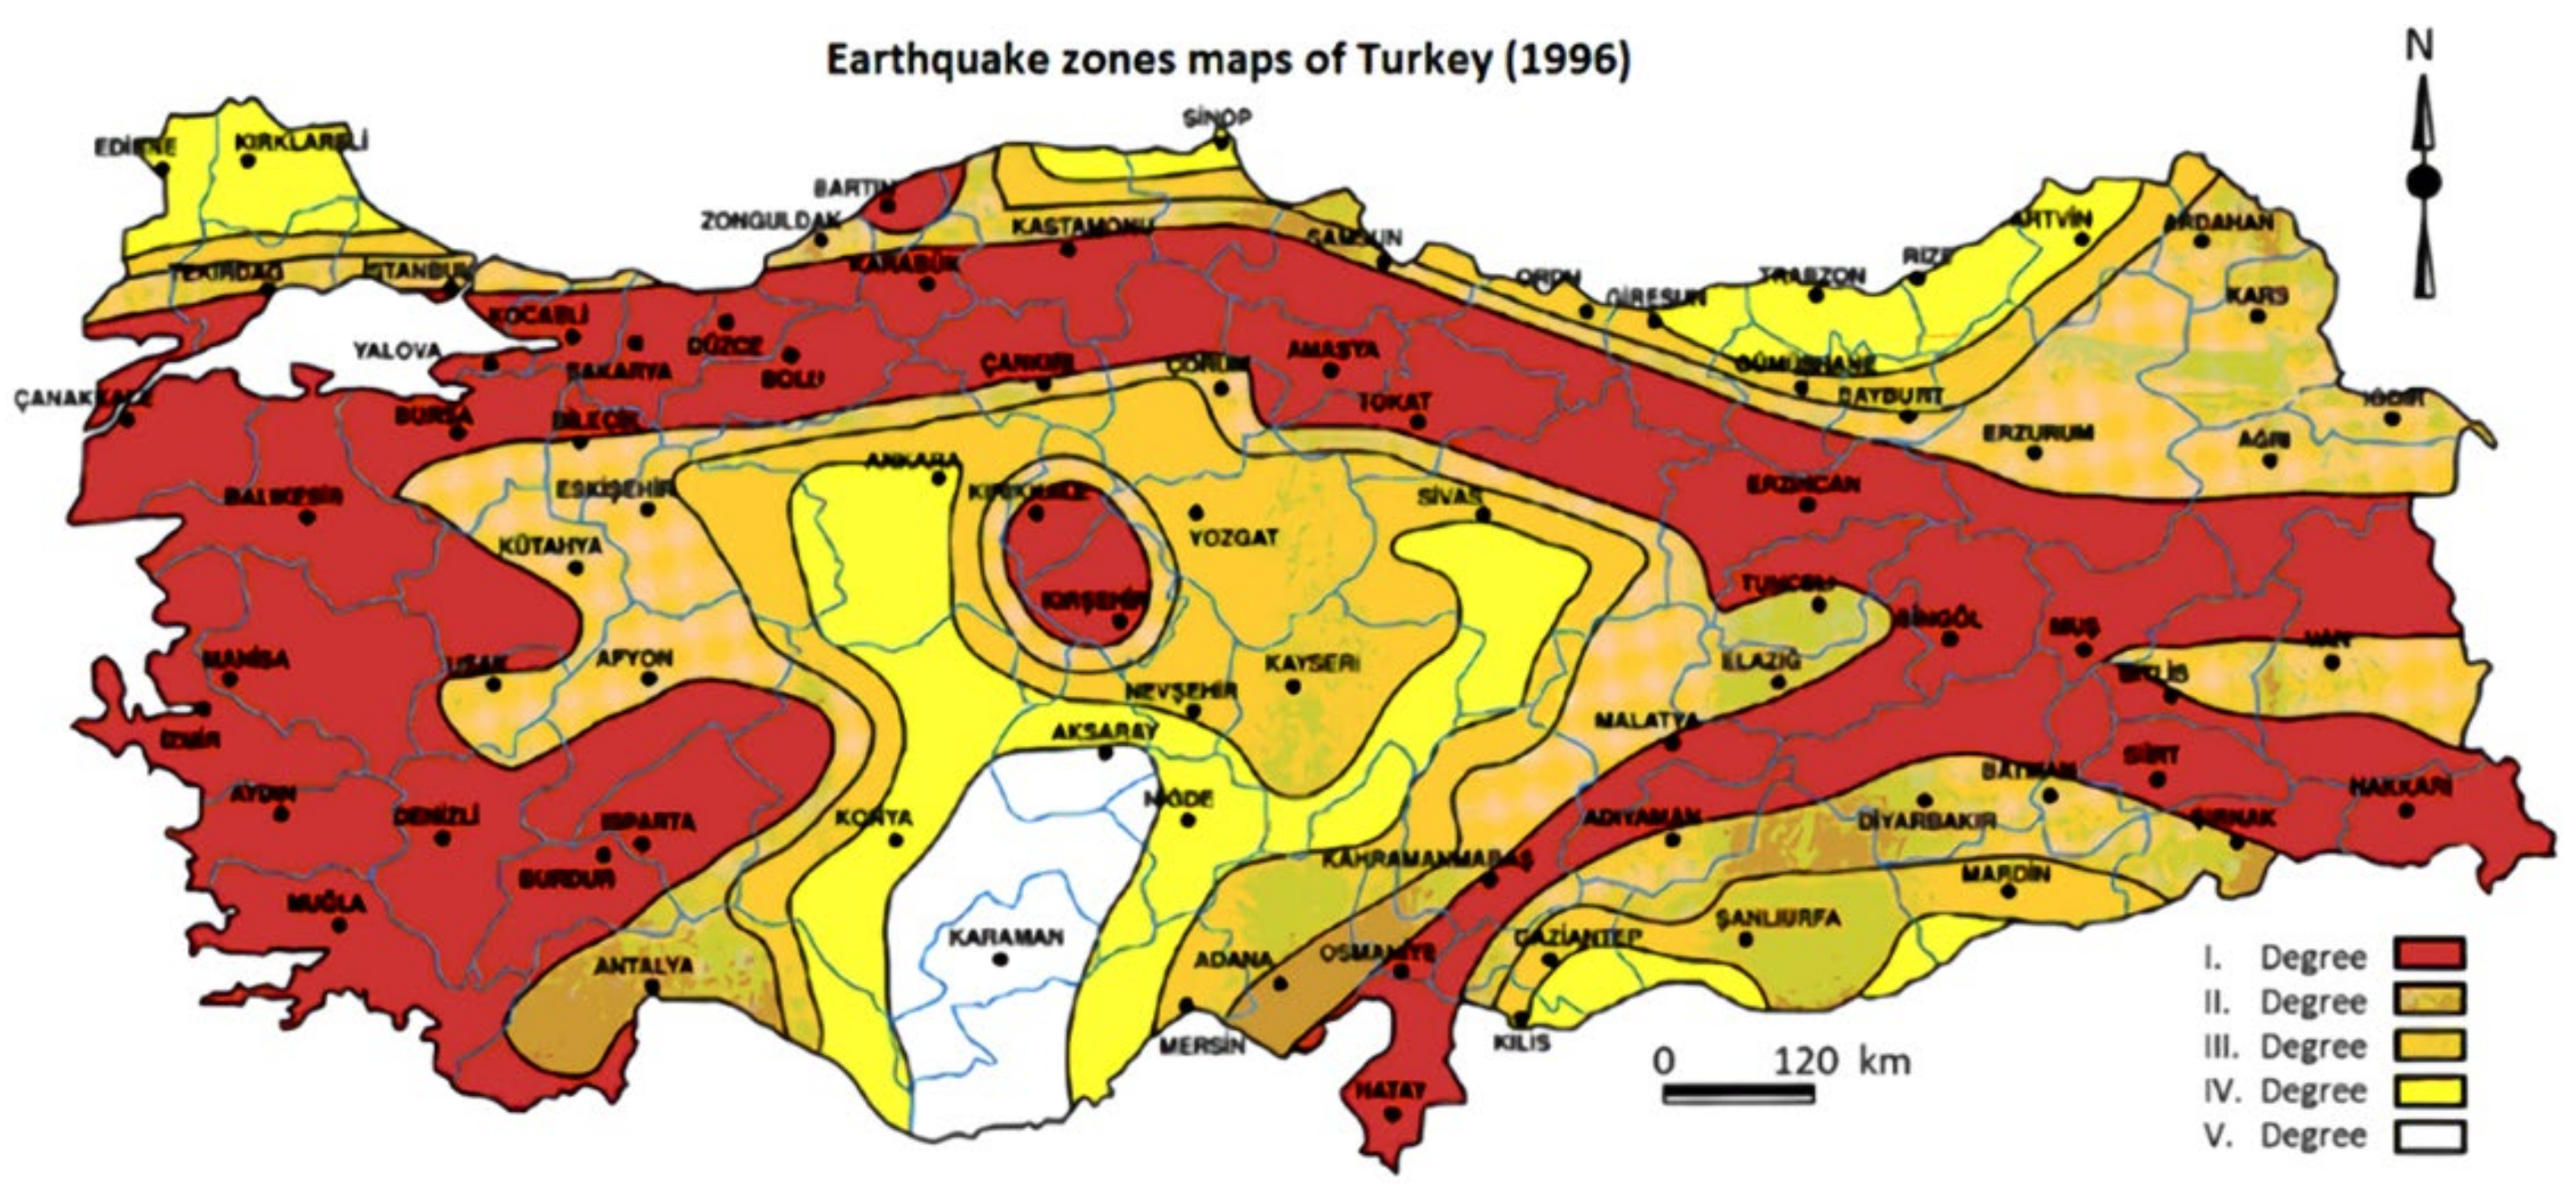
  • Seismicity of the region and local soil class
The structural system type is one of the parameters in this research. The type of structural system directly affects the behaviour of a building under a seismic event. The inclusion of RC shear walls increases the earthquake resistance significantly compared to the pure RC frame. This study considers two types of commonly used RC structures, namely RC frame (RCF) and RC frame + shear wall (RCFW). The structural system score (YSP) is obtained depending on the structural system type of the building, and takes into account the total number of stories. There is no contribution when it is RCF, and the YSP value is taken as zero in this case. However, if it is RCFW, a positive YSP is added depending on the total number of stories. The basic logic here is based on the positive contribution of the RC shear walls to the seismic behaviour of the building. The types of structural systems considered are given in Figure 1. In order to determine whether there are RC shear walls in any building, a decision is made by entering the building and making observations. If it cannot be determined exactly whether RC shear walls exist in the building, the structural system should be considered RCF.
The number of stories is the sum of all stories, including the foundation [71]. Studies conducted after previous earthquakes revealed that the damage to a building had a linear relationship with the number of stories [72]. The part with the most significant number of stories is considered in gradual structures. Figure 2 shows how to calculate the number of stories in the rapid assessment method considered in this study.
The strength of the materials that make up the building directly affects its seismic performance. The performance of workmanship and material quality during and after the construction process reveals the quality of the building [73,74,75]. The importance given to the quality of materials, workmanship, and the maintenance of the building is determined by the present condition and apparent quality. Therefore, it is classified as good, medium, and bad, respectively.
According to the ASCE-41 (American Society of Civil Engineers, 2017) [76], any story with a lateral stiffness less than 70% of its above story or less than 80% of the average stiffness of its immediate above stories is defined as a soft story. Given that the base floor is usually used for commercial purposes, the absence of sufficient stiffness in this floor compared to upper stories will result in a “soft story” in many buildings. In addition to the differences in stiffness and strength between stories, the variation in story height within a building is considered in the soft story/weak story parameter. Almost all earthquakes that occurred in Turkey have caused damage to structures with soft stories, and in case the structure did not have sufficient strength, total collapse of the structure and the soft story was induced [75,77,78,79]. Another parameter that has been taken into account to reflect the effect of the frame and changing story areas that do not continue vertically is the vertical irregularity. In other words, this phenomenon can be considered as the case of a substantial change in the stiffness, mass, and dimensions or interruption of vertical structural elements, such as columns, or lateral resisting systems, such as RC shear walls within the structure [62,77,80]. Some instances of vertical irregularity are depicted in Figure 3.
Another parameter is heavy overhangs, which indicate differences in story areas. Especially, heavy parapet balconies or overhangs made out of the frame systems of the buildings will create irregularity in the building mass. Buildings that are left towed on the ground story are also in the category of heavy overhangs. Therefore, it causes a change in the centre of mass of the buildings and increases the earthquake’s effect on the building [75,78,81]. Examples of heavy overhangs are shown in Figure 4.
For the plan (horizontal) irregularity/torsion effect parameter, irregularities that will cause torsion in the zoning plan are assumed. This parameter is decided by considering the external geometric features of the building. In structures with irregular geometry or out-of-plane discontinuity of the lateral resisting system [80,82], additional torsion occurs due to torsional effects, which force the structure to twist [83,84,85]. Examples of this case of irregularity are shown in Figure 5.
Filling RC frames with half-height infill walls, creating band windows, and using intermediate beams on stairwells are the foremost causes of short column formation. The main factors causing the formation of the short column can be counted as mezzanines, mechanical stories, sloping land, stepped foundations, spans adjacent to the column, and stair landings. This negativity parameter is one of the leading causes of earthquake damage [86,87]. Some examples of short columns are illustrated in Figure 6.
Another parameter is the hill/slope effect. If the building is clearly on a hill or on a slope with a high slope (more than 30°) it increases the effects of earthquakes to a certain extent. This situation, which can easily be observed from the street, should be taken into account when calculating the earthquake score of the building [71,88]. The relation of the building to the neighbouring structures has also been taken into account in this study. The location of adjacent buildings can affect seismic performance due to collision. The buildings located on the side are adversely affected by this situation, and, if the story levels of the adjacent building are different, this negativity increases even more. External observations will determine the situations where the collision effect is in question. For this parameter, first of all, the situation of the building with the neighbouring buildings should be determined (Figure 7).
After determining the position of the building relative to the adjacent buildings according to Figure 7, it should be decided whether the story levels in neighbouring buildings are the same or different, as sketched-up in Figure 8.
It is a known fact that the local conditions of the underlying soil will directly affect and change the characteristics of seismic waves and may cause damage to existing overlaying structures. Local soil groups and local site classes considered in this study are shown in Table 1 and Table 2, respectively. For the 329 RC buildings considered in this study, local soil classes were determined by considering the soil survey reports made by the relevant public institutions and organizations.
The seismicity of the region was also taken into account in this work. On the map shown in Figure 9, regions with ground accelerations of 0.40 g and greater are considered as the first-degree earthquake zone, regions with expected ground accelerations of 0.30–0.40 g are the second-degree earthquake zone, regions with expected ground accelerations of 0.20–0.30 g are the third-degree earthquake zone, regions with expected ground accelerations of 0.10–0.02 g represent the fourth-degree earthquake zone, and regions with expected ground accelerations of less than 0.10 g indicate the fifth-degree earthquake region [90,91].
The structural system type is taken into account as a positive base point. No additional score is given for buildings with the RCF system, but a positive base score (Op) is given for buildings with the RCFW structural system. The structural system and baseline scores are shown in Table 3.
While determining the danger zone for the examined building, the local soil classes and earthquake zones recommended in the previous earthquake code (TSDC-2007) are taken into account, and the selection is made according to Table 4. The danger zone is determined according to Table 4 by taking into account the local soil classes obtained from public institutions and the earthquake zone.
For all negative parameters, except the apparent quality, determinations will be made as “yes” or “no”. Negative parameter values (Oi) corresponding to these determinations will be taken as 1 and 0 for “yes” and “no” states, respectively. Suppose the apparent quality rating is “good”. In that case, the negativity parameter value (Oi) will be taken as 0; if it is “moderate”, 1 will be considered; and if it is “poor”, 2 will be taken. The negative coefficients corresponding to each parameter are shown in Table 5.
The suggested values for each parameter are shown in Table 6, and the selection is made according to the number of stories.
The building performance score (PP) is calculated according to Equation (1) after the total negativity score is determined by multiplying the negativity parameter values given in Table 3 by the negativity parameter points given in Table 4.
TP = PP + i = 1 n O i   x   OP i + YSP
Here, TP is the base score; YSP indicates the structural system score. The flowchart of the 2013 Turkish Rapid Screening Method (PDRB-2013) [71] has been presented in Figure 10.
Within the scope of this study, a total of 329 existing RC buildings in the province of Bitlis (Turkey) were taken into account. The distributions of RC buildings according to the considered parameters in this study are shown in Figure 11.
In this work, a hybrid model will be created based on ANN and GA approaches to determine the risk priorities of RC buildings. It is aimed that the intended hybrid structure will most successfully predict the structural system scores given in Figure 12, which are the performance scores obtained for the 329 buildings considered in this study.

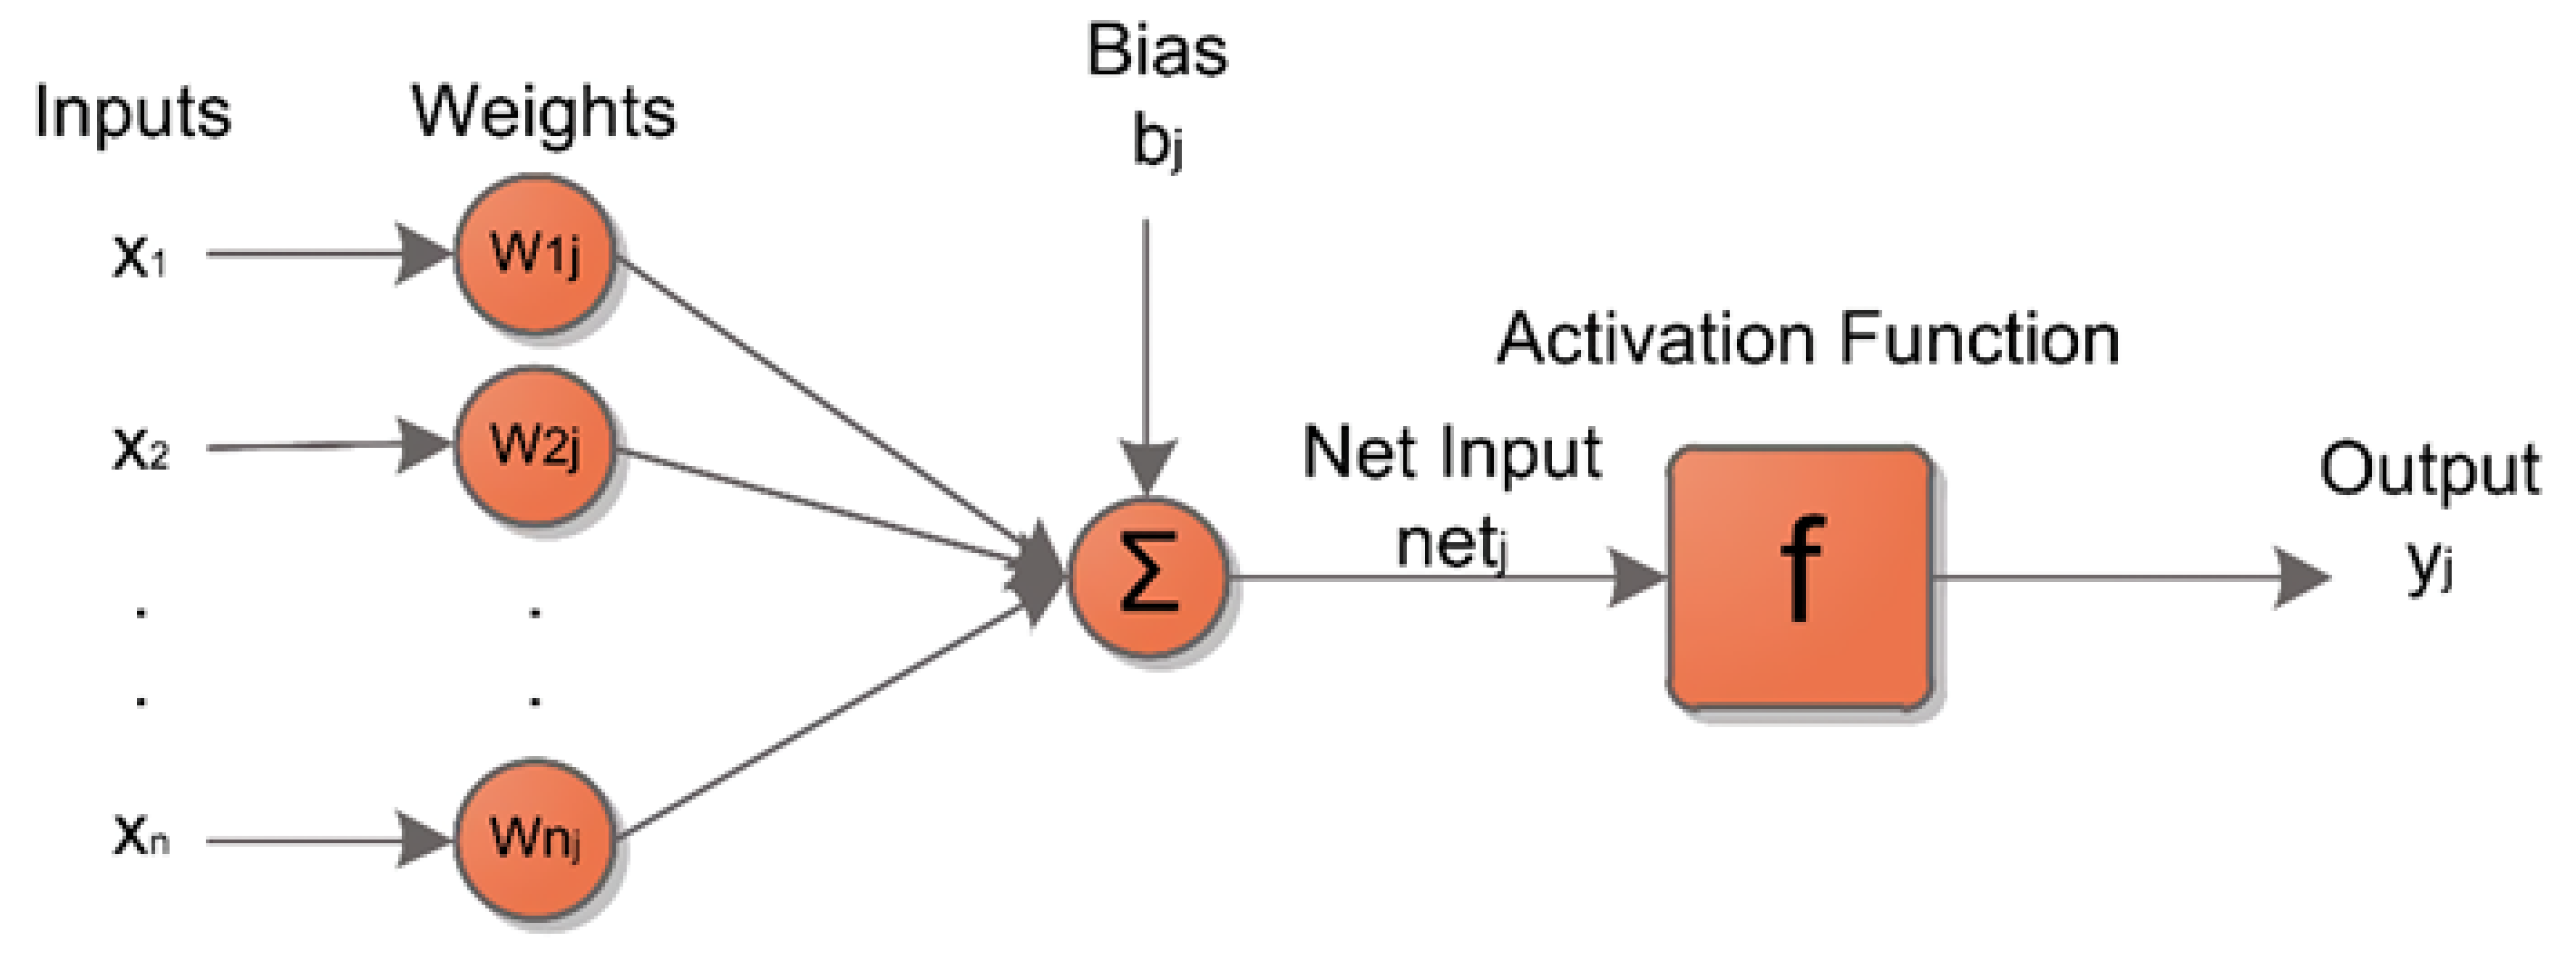
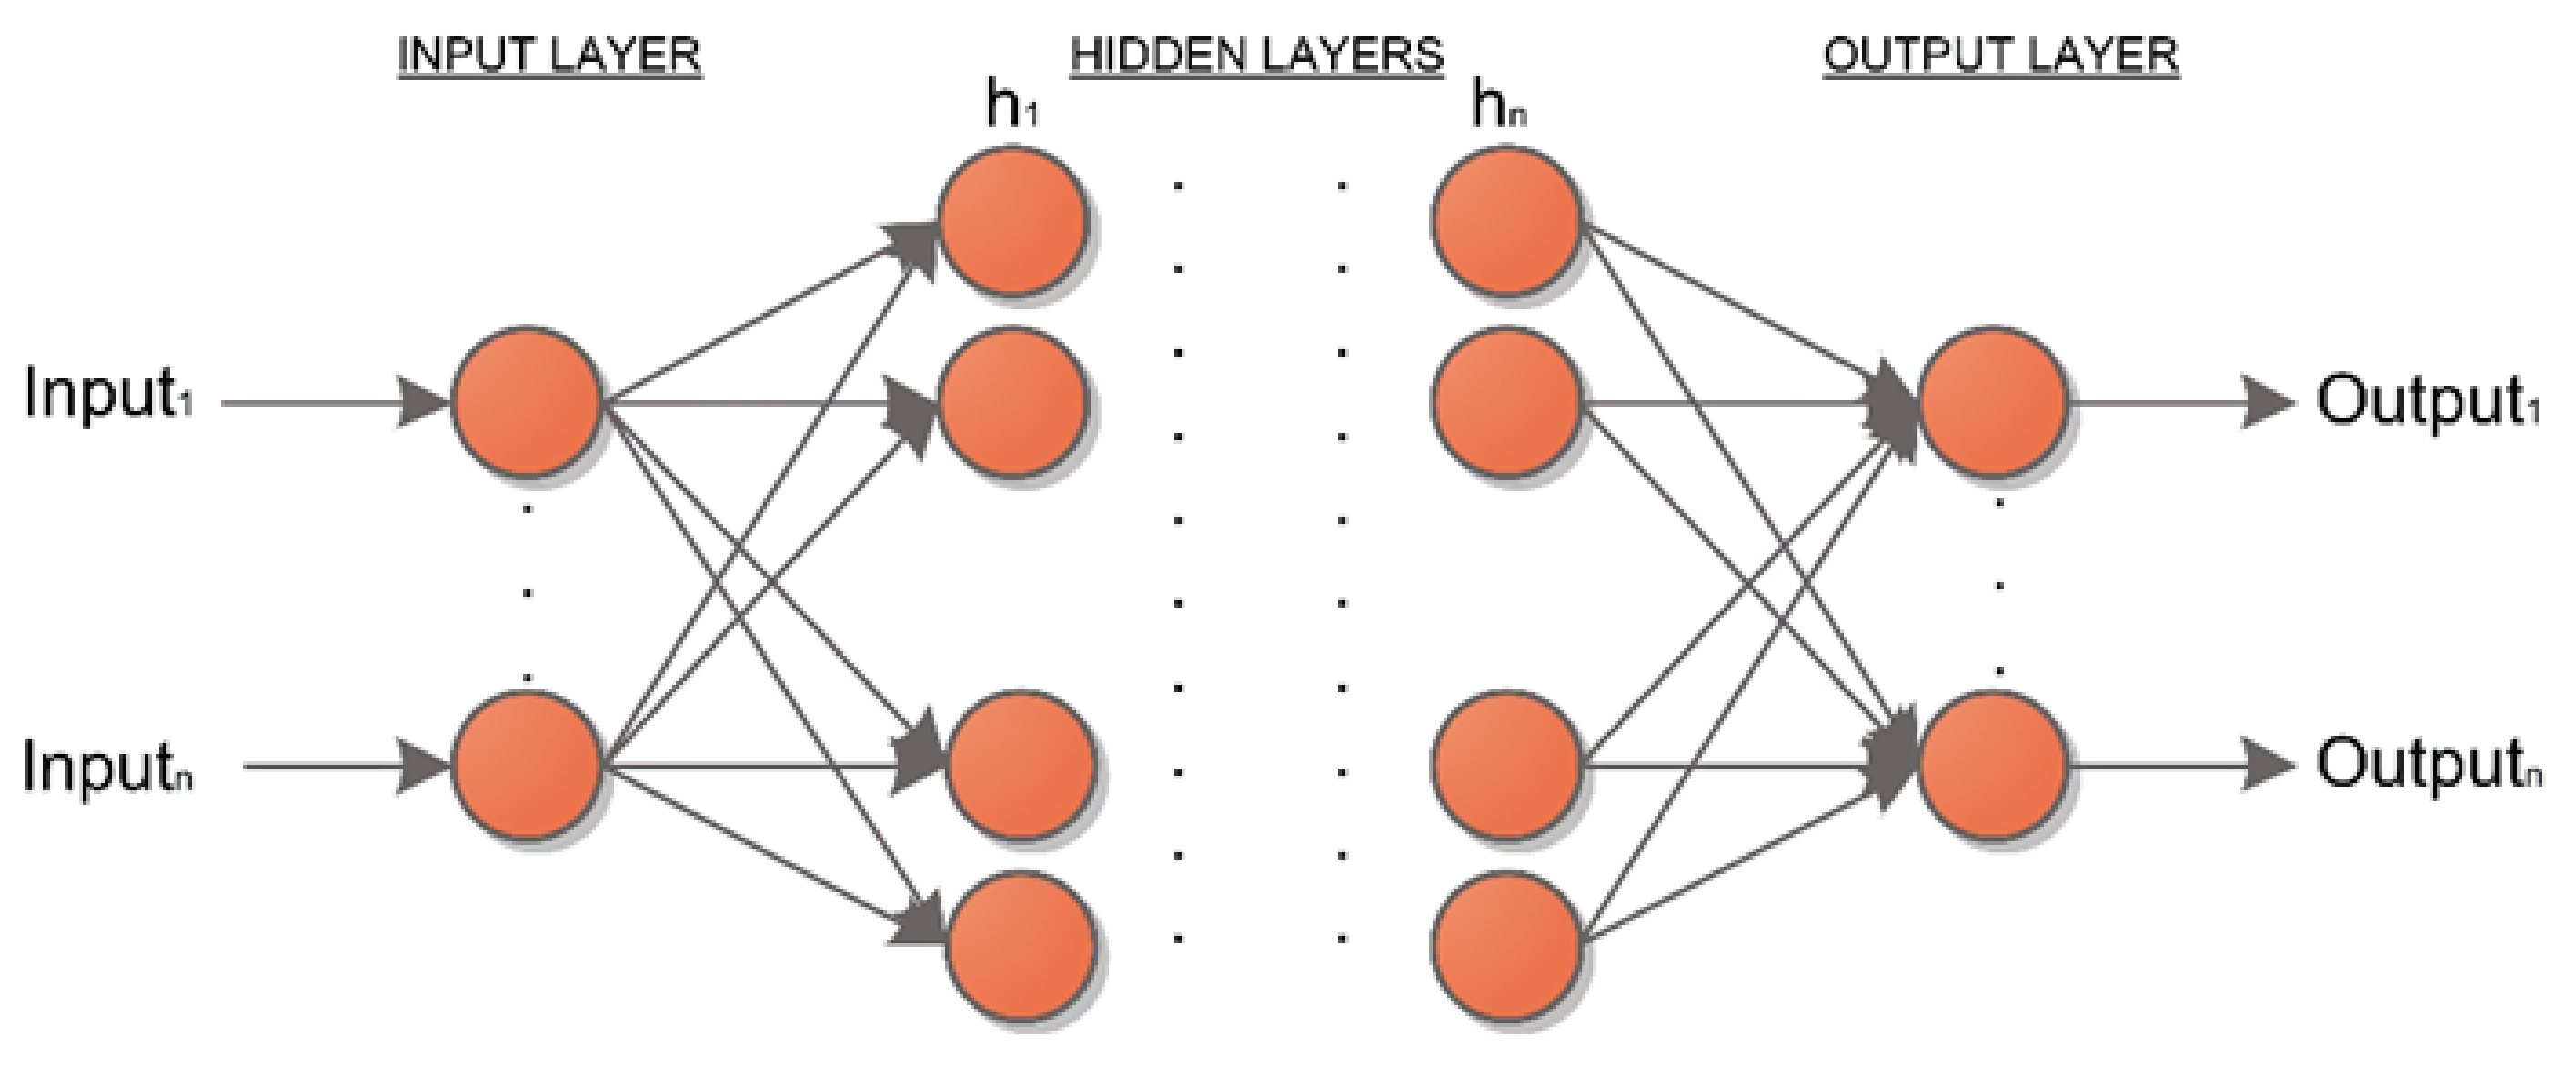
3. Artificial Neural Network (ANN)

ANN is a learning technique inspired by biological neurons in living organisms. A network of neurons is formed through many interconnected neurons. This network is capable of accomplishing complex tasks and processes with impeccable speed and accuracy [93]. The structure of each neuron cell in an ANN is shown in Figure 13.
In Figure 13, each input data generated for the network is multiplied by the weights determined by the network. The obtained results are sent to the addition function in the neuron. Here, the bias value is added to the values collected with each other. The bias value provides the translation of the activation function. A net input is obtained for the neuron by adding the bias value. The net input value obtained for the neuron is passed through the activation function and the net output for that neuron cell is obtained.
Neuron cells, whose structure is presented in Figure 13, come together to form the network structure in an ANN. In order to obtain the desired output information in the created network structures, the network must be trained with the input data presented to the network. In order to train the network, algorithms that are supervised and unsupervised have been applied in the literature [94]. A supervised learning algorithm is efficient for feedforward networks, but back-propagation algorithms can also be applied [95]. A feedforward back-propagation ANN structure is presented in Figure 14.
In the feedforward back-propagation network structure presented in Figure 14, the outputs obtained from each neuron cell are used as input information for the next neuron cell. Error detection for each output neuron is done in the last step. The latent weights between neurons are changed in the backward pass. For neurons, hidden layer errors are measured and are returned to them. In this study, a feedforward back-propagation ANN has been implemented to determine the risk priorities of RC buildings.

4. Genetic Algorithm

GA is an adaptive direct probability search optimization method inspired by the evolutionary theory and the genetic mechanism [96]. Better optimization results can often be achieved faster when solving more complex combinatorial optimization problems compared with traditional GA optimization algorithms [97]. The steps in performing a GA technique are as follows:
  • Step 1: Set initial parameters and create the initial population.
  • Step 2: Calculate the fitness value of each individual
  • Step 3: Perform selection of individuals
  • Step 4: Perform crossover operation on individuals
  • Step 5: Apply mutation operation to individuals
  • Step 6: Return to Step 2 until the stopping criterion is met
GA uses a random initial population of solutions found in the solution space. Each individual in the population is called a gene. In each generation, the individuals in the population are subjected to selection, crossover, and mutation processes to form new individuals. GA is a frequently used technique in the literature to solve multidisciplinary optimization problems [98,99].

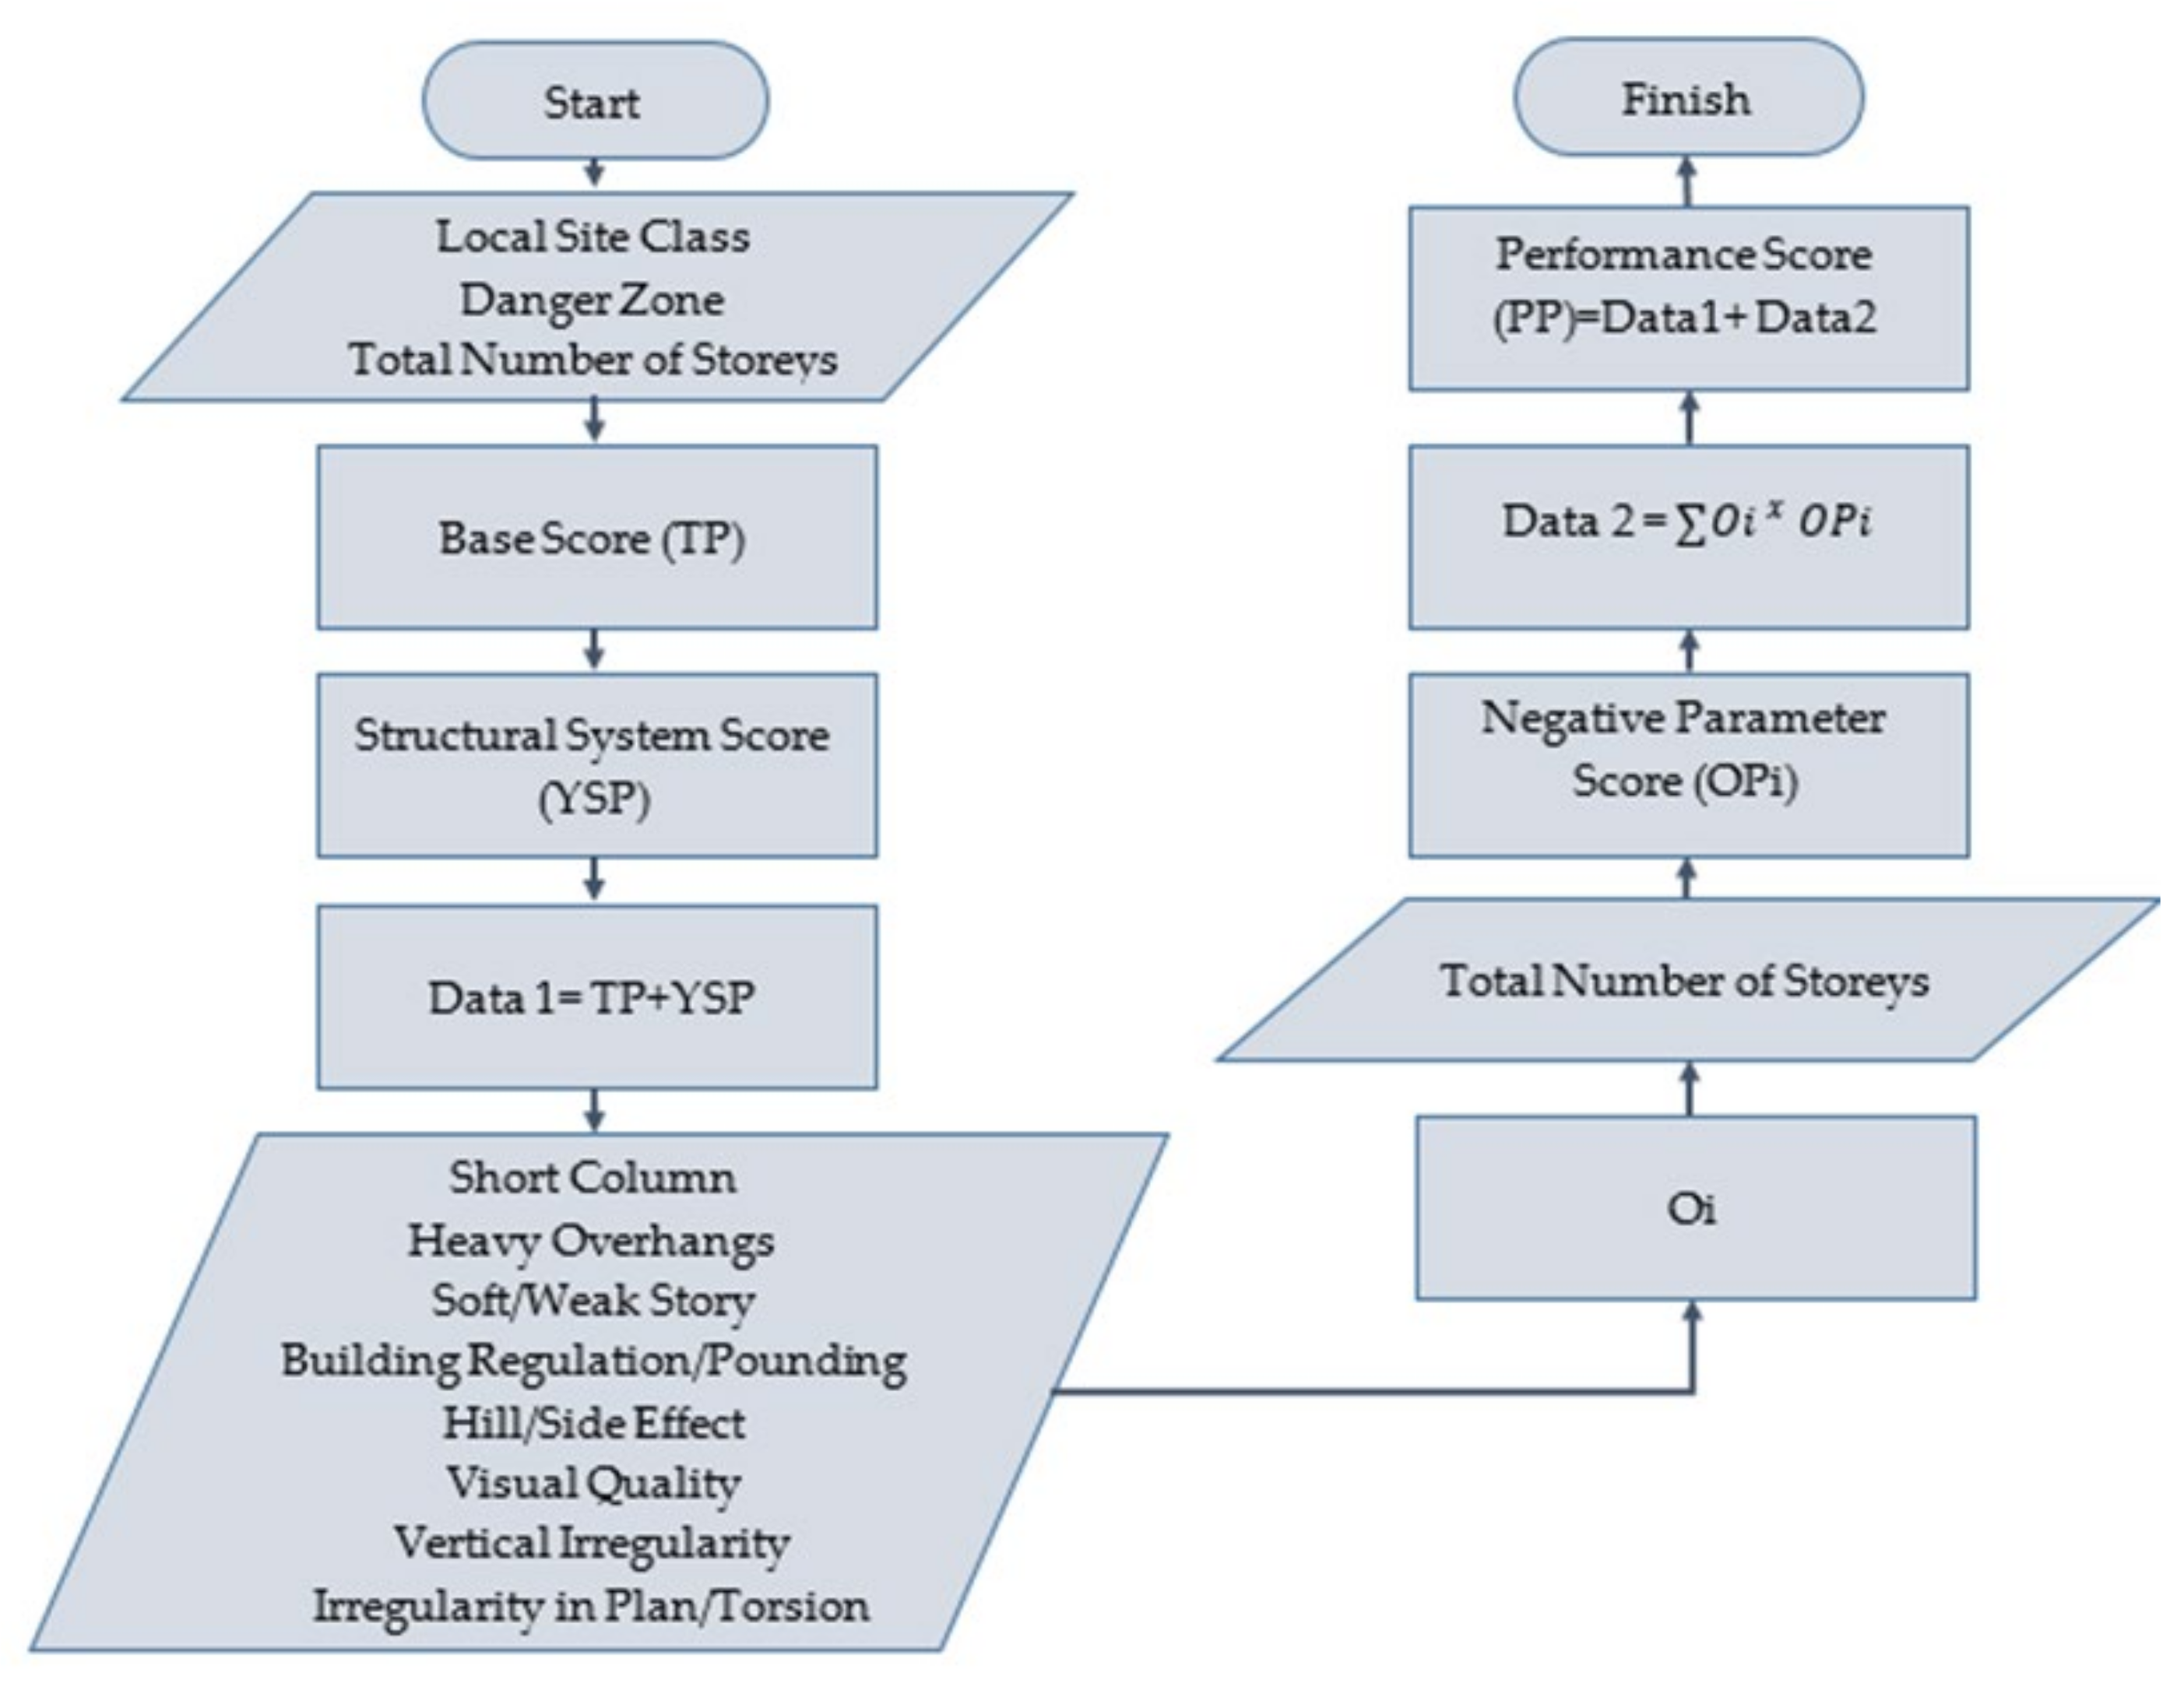
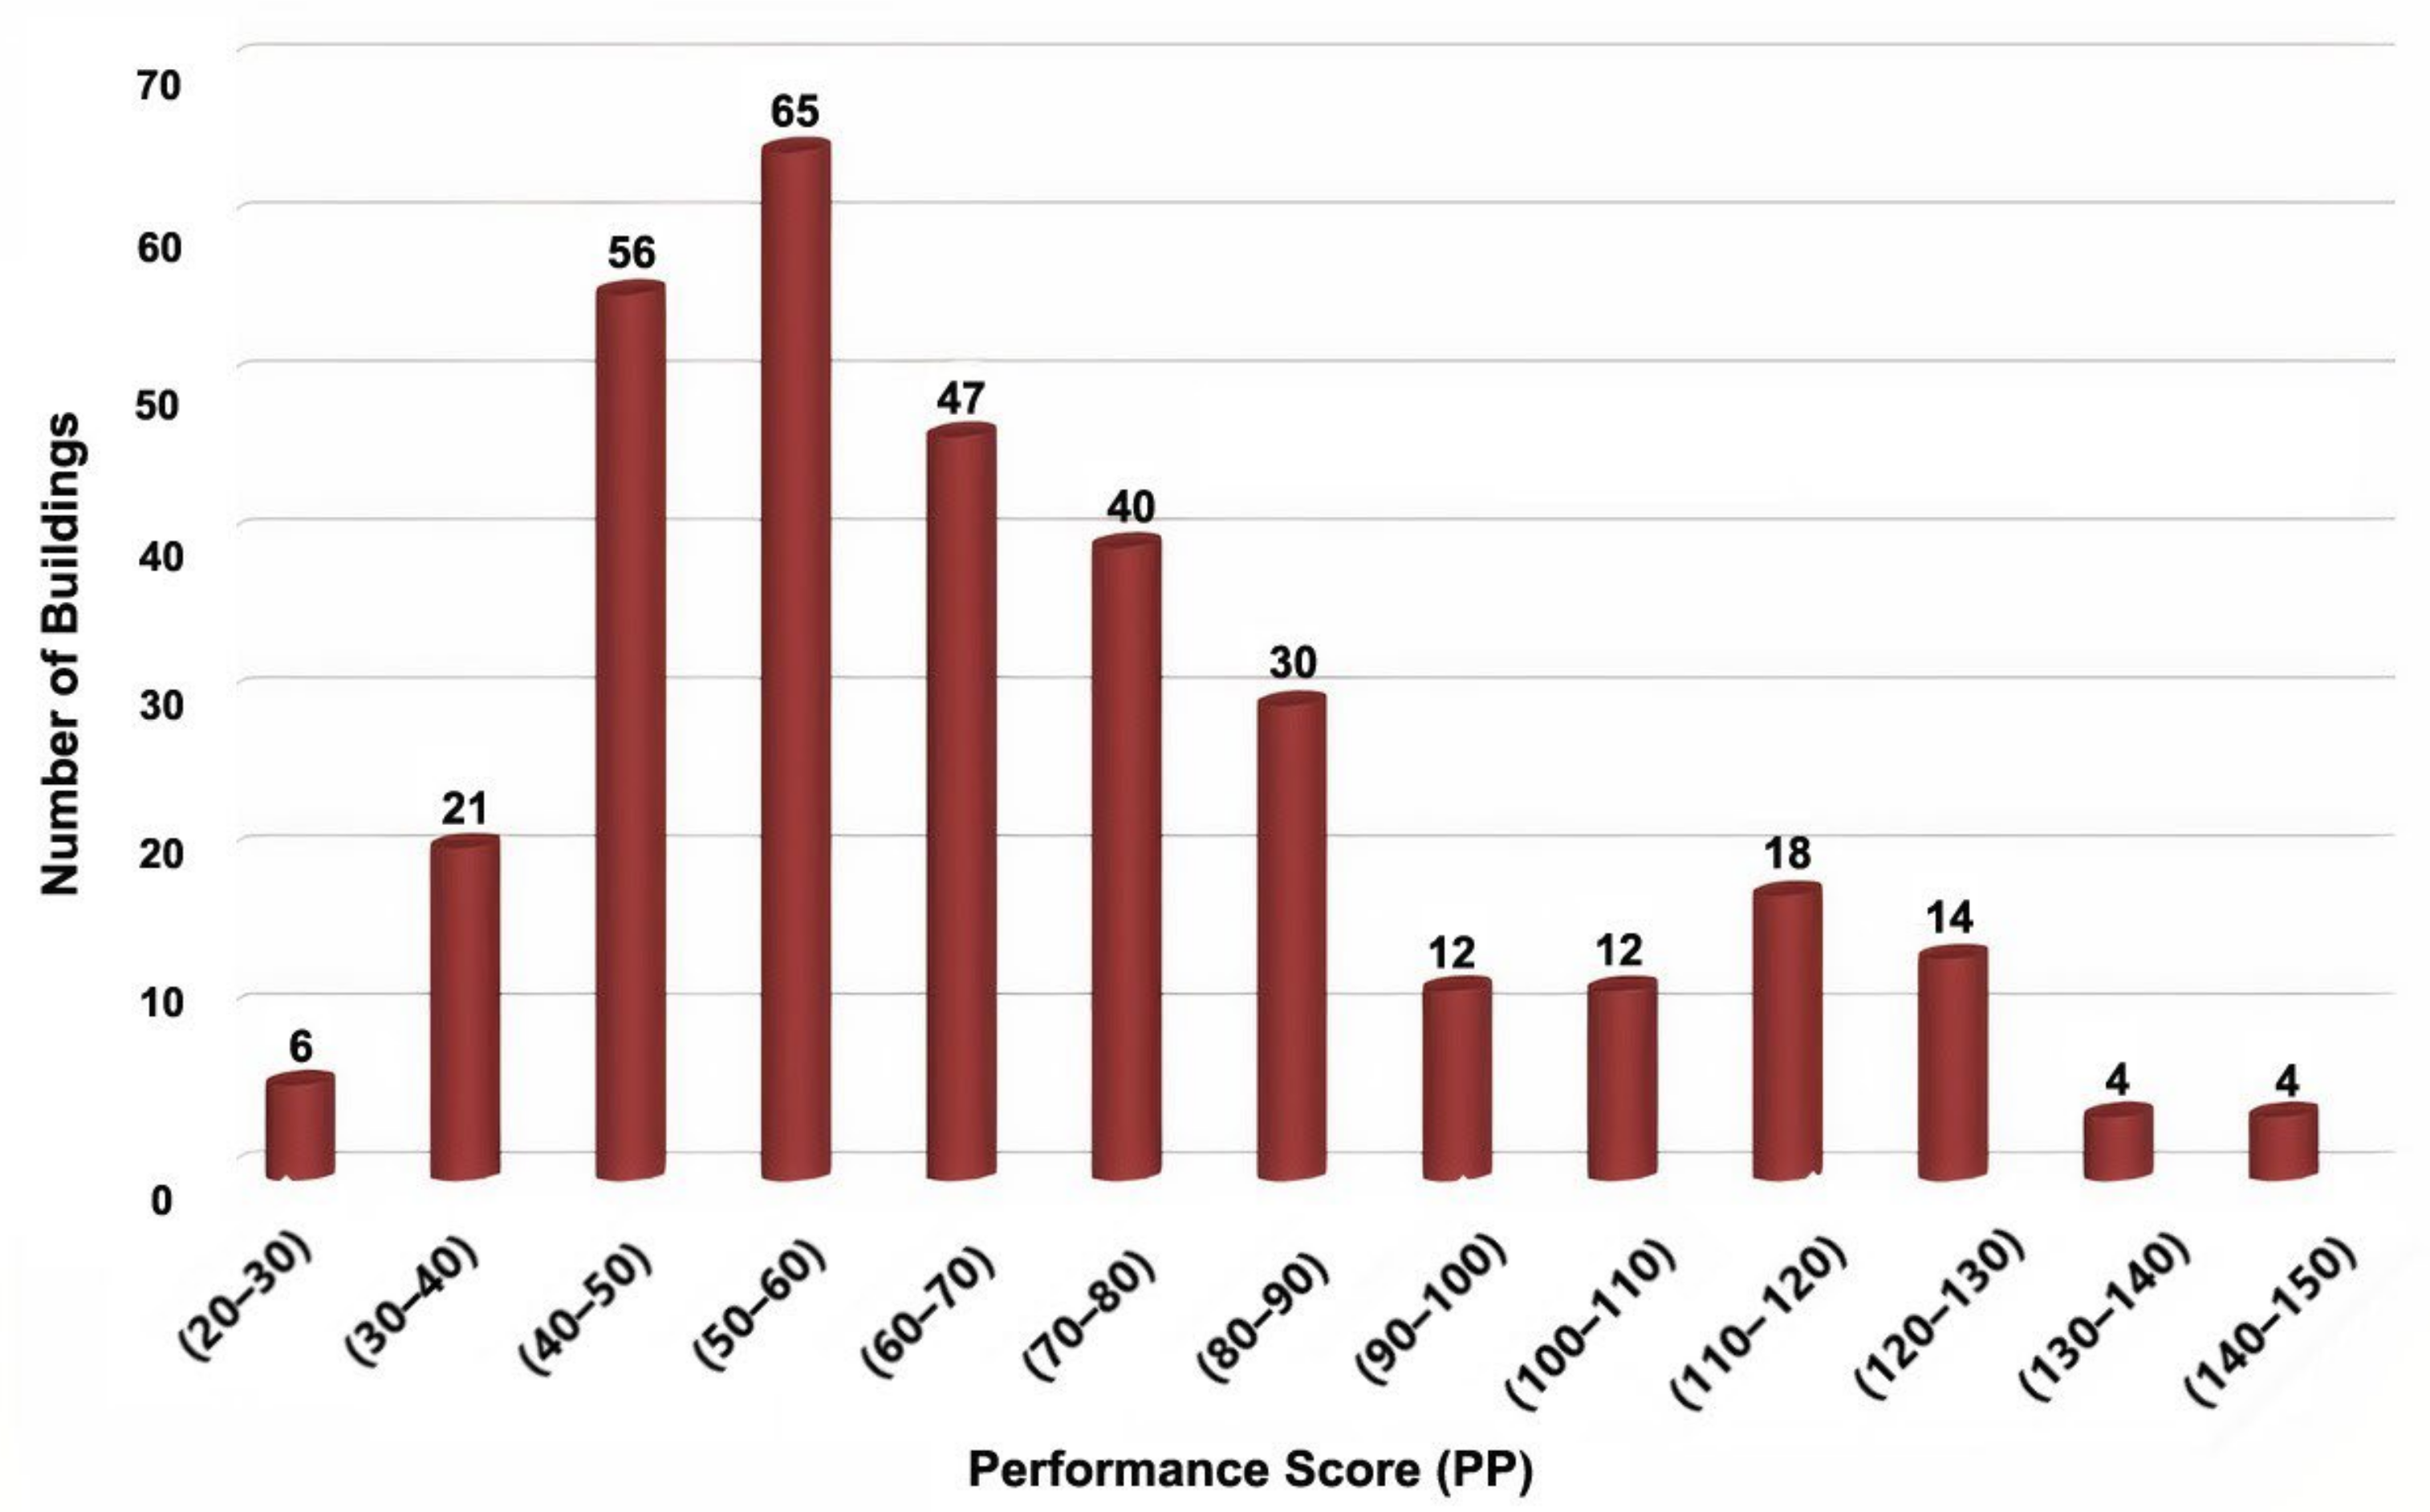
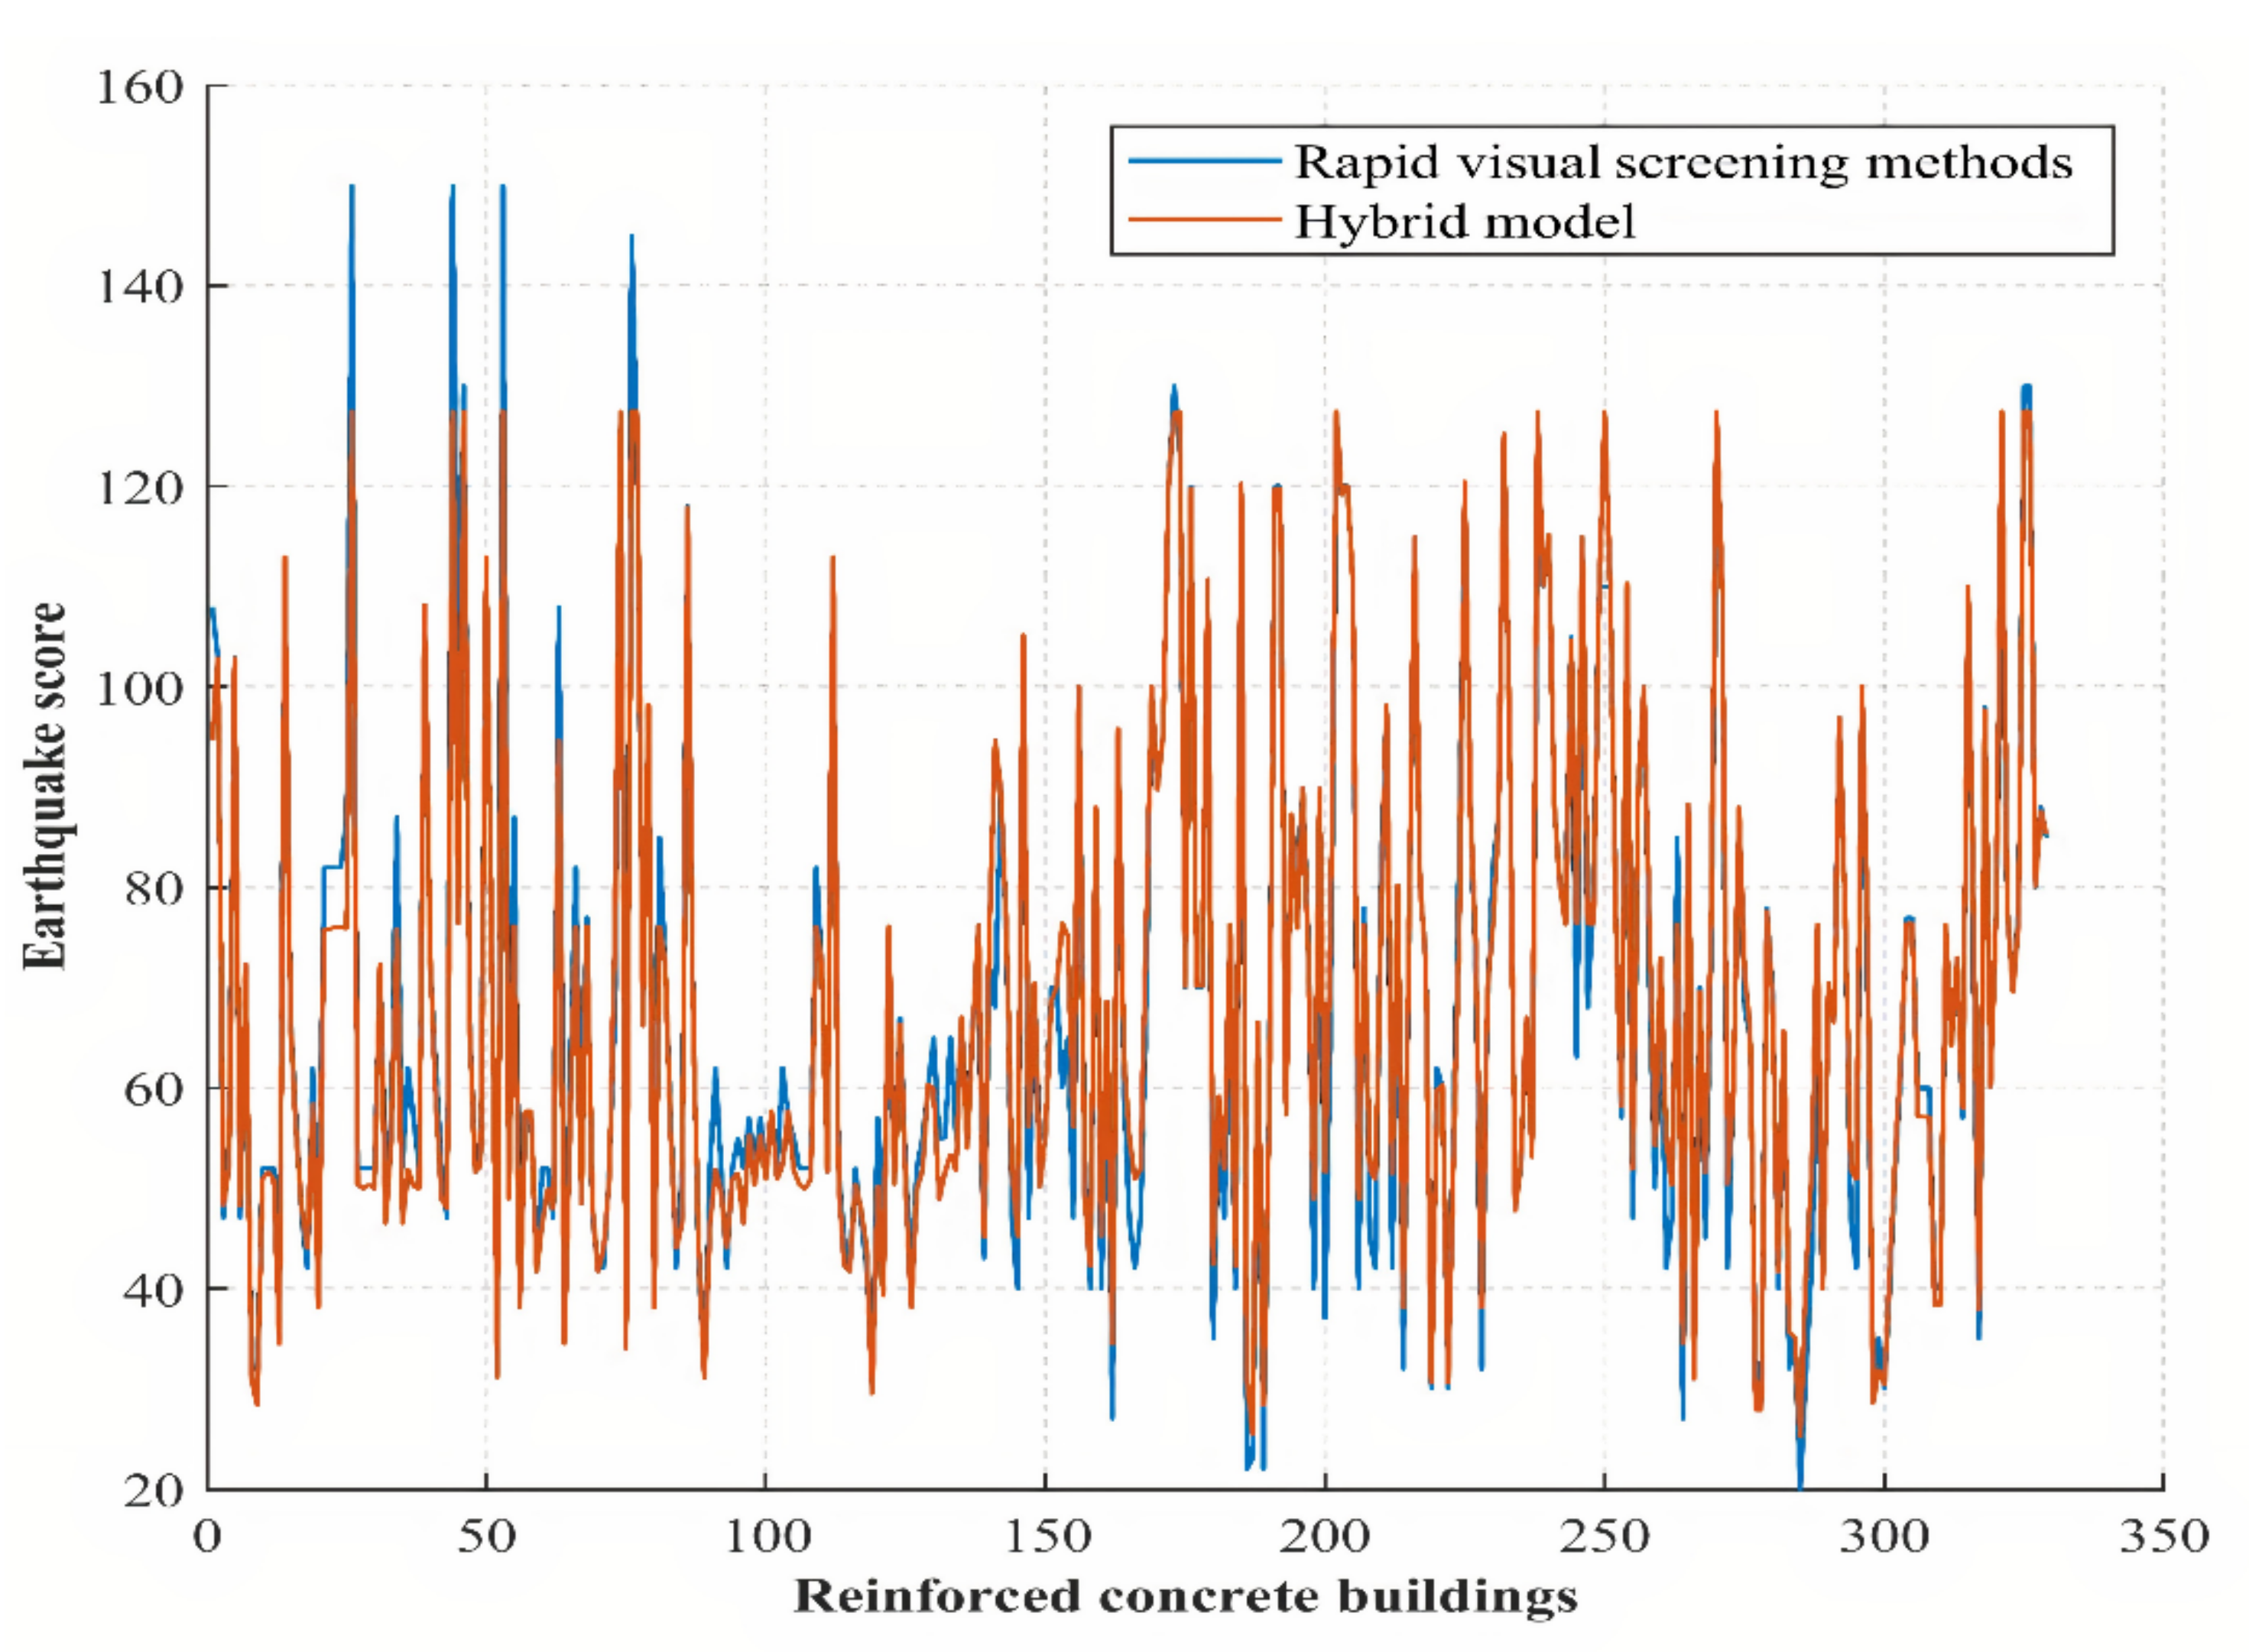
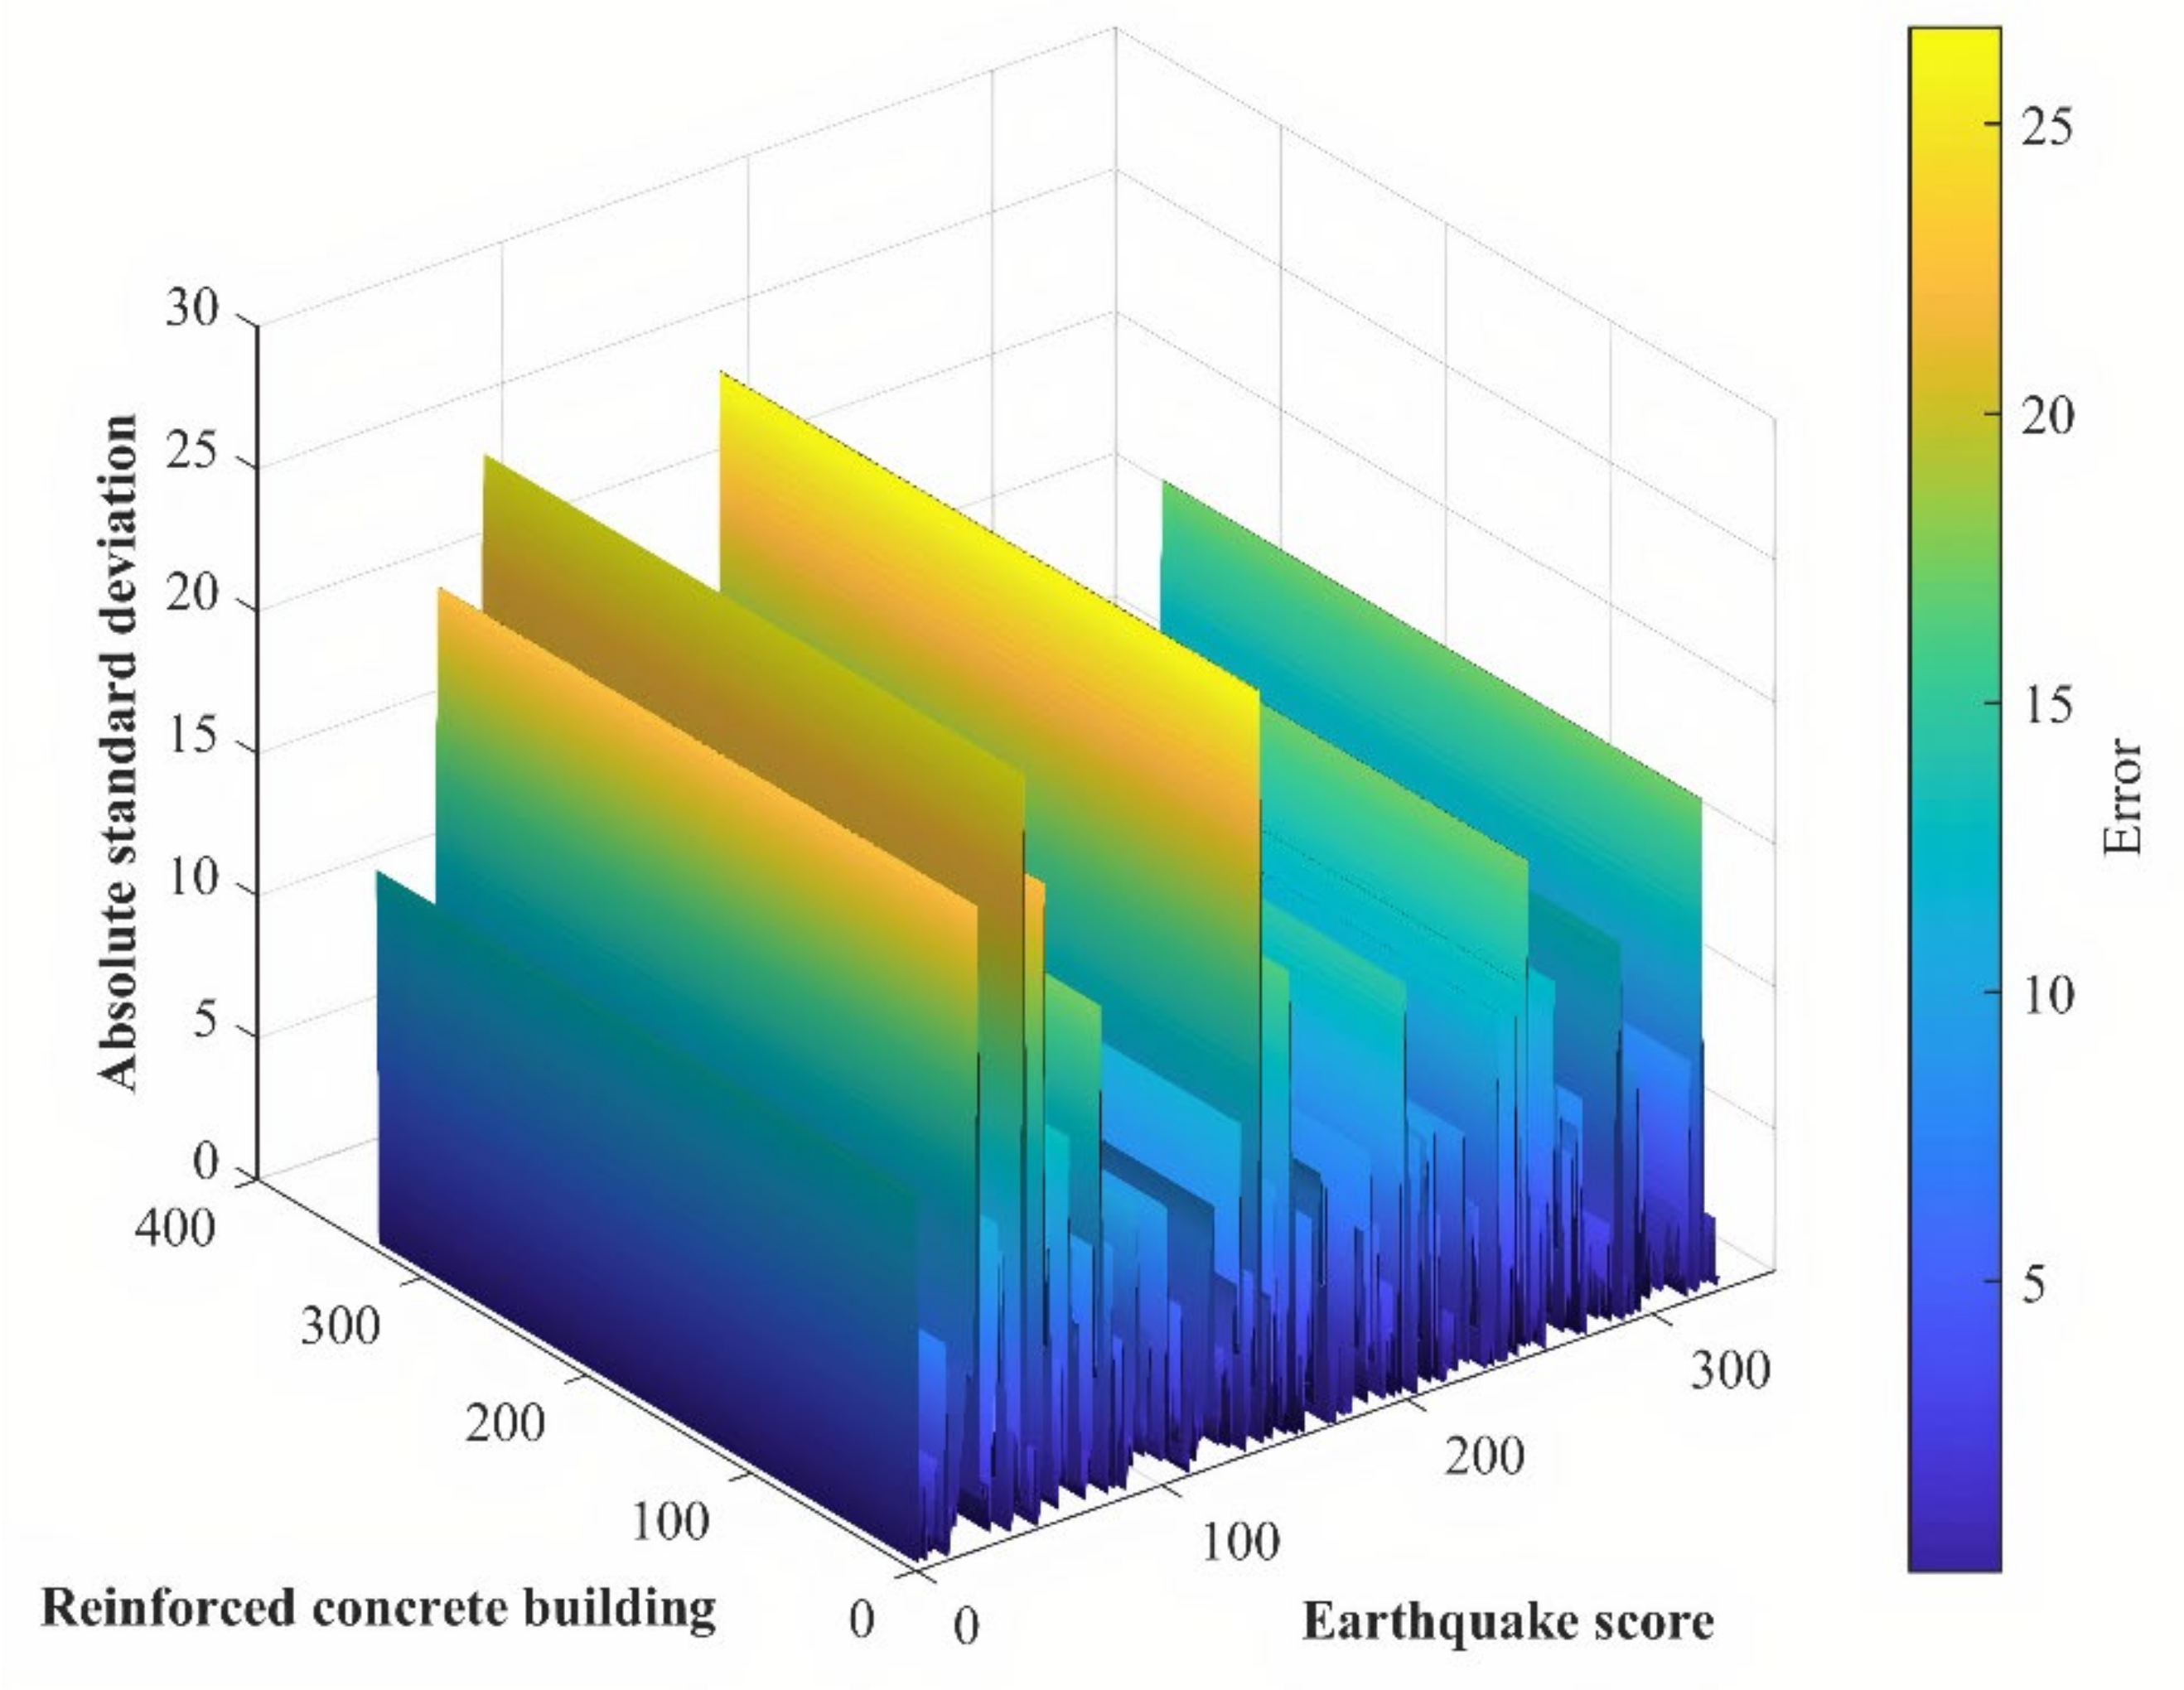
5. The Hybrid Model and Results

In this part of the study, a hybrid structure of the ANN model to evaluate RC buildings will be created using the GA, and the parameters in the model will be optimized. In a feedforward back-propagation ANN model, the outputs obtained from each neuron cell are used as input data for the neuron in the next layer. For this reason, the number of layers and the number of neuron cells in the network structure directly affect the network performance. At the same time, the activation functions and training algorithms used in neuron cells are other factors that affect the performance of the established network structure. In this framework, it is essential to create the most suitable structure for the problem when choosing the number of inputs in an ANN network structure, the number of hidden layers, the number of neurons in each layer, and the activation functions used in each layer, as well as the training algorithms. In many studies in the literature, network structures are determined by trial and error while establishing a certain success. In the network structures established by trial and error, it cannot be guaranteed that the established network is the most suitable or even close to it and is a successful network structure for the problem. Determining suitable structures according to the problems is almost impossible with classical methods. Even if it can be determined how well an artificial neural network has performed in experimental observations based on trial-and-error methods, determining a structure with the best performance is a separate optimization problem. The creation of the best network structure or a network structure close to the best one will only be possible by establishing a hybrid structure with optimization algorithms [65]. Validation data for the ANN network structure to train the network and obtain the optimum parameters for the suggested hybrid structure are the performance scores presented in Figure 12 that were obtained from 329 RC buildings in Bitlis, Turkey. A hybrid model was created with ANN and GA to determine the risk priorities of reinforced-concrete buildings. It is aimed that the created hybrid structure will most successfully predict the data set given in Figure 12. The flowchart of the hybrid model created for this purpose is given in Figure 15.
As the first step in the flowchart of the hybrid structure shown in Figure 15, the initial population for GA will be created. In GA, each individual will create an ANN network structure within itself. Here, each individual consists of network parameters that directly affect the performance of the ANN. Each gene structure contains the parameters shown in Figure 15. In the individual structures presented in Figure 15, IN is the number of inputs in the network structure that will occur in each individual, HLN is the number of hidden layers in the network structure in each individual, NL is the number of neurons in the hidden layers in the network structure in each individual, AF is the activation function to be used in each layer in the network structure, and TF represents the training function to be used in each network. In the proposed hybrid structure, the initial population will be created as the first step of the GA. While generating the initial population, the IN is randomly determined among the input values given in Equation (2) for the network structures in each individual.
IN = Number   of   stories ,   Short   column ,   Soft / weak   story ,   Heavy   overhang ,   Pounding   effect ,   Hill / slope   effect ,   Visual   quality
The HLN value for each gene (G) is determined randomly according to the restriction functions given in Equation (3) and the NL values in Equation (4).
G a HLN i x = 1 ,   x   <   1   x ,   1     x     10   10 ,   x   >   20
G a NL i k = 1 ,   k <   1   k ,   1     k     10   10 ,   k   >   10
Equation (3) represents the restriction function used to determine the HLN value of a gene in every iteration, while Equation (4) is the restriction function used to determine the NL value of a gene in every iteration. Both restriction functions given in Equations (3) and 4 are used for generating populations of the GA and mutation operations applied to the genes. AF values in the gene structure are randomly determined from Equation (5), and TF values are specified from Equation (6).
AF = trainb ,   trainbr ,   traincgb ,   traincgf ,   traincgp ,   traingd ,   traingda ,   traingdm , traingdx ,   trainoss ,   trainrp ,   trainscg ,   rainbfg ,   trainc ,   trainr
TF = tan sig ,   logsig ,   hardlim ,   hardlims ,   radbas ,   purelin
After the initial population was created, the initial parameters of the GA were determined, as presented in Table 7, as a result of the experimental studies. The network parameters in the ANN structure will be determined using the GA.
In the next step of the created hybrid model, the fitness value of each gene is calculated according to the fitness function given in Equation (7). Each gene creates an ANN within itself. The input parameters in the ANN network structure created for each gene, the number of hidden layers, the number of neurons in the hidden layers, the activation functions used in the neurons, and the learning algorithm of the network are determined by the GA to produce the most successful result in the solution space.
f G i = MSE (   ANN i   )
In Equation (7), the definitions are as follows: f G i : fitness value of the ith gene; MSE: Mean squared error; ANNi: Artificial neural network created for the ith gene.
The change in weights in the learning process in ANNs is directly related to the learning rate. A low learning rate value can cause slow and ineffective training, while a significant value causes the network to never converge to some weights [100]. Therefore, the learning rate in the network structures created for each gene was determined as 0.3. The network’s success created by each gene is measured according to the MSE value. The MSE value is determined by taking the average of the squares of the differences in the earthquake scores to be estimated and the values estimated by the network structures. Success in fitness values of each gene affects their chances of survival in the next selection step. The next step is the selection process. The roulette wheel method was chosen in the selection step because of its ability to select the appropriate parents in the formation of the new generation by calculating the probability values of the parents [101]. The success that genes have achieved according to the fitness value of each gene in the roulette wheel method increases the probability of survival of that gene.
Moving to the next step, i.e., the crossover process, the single-point crossover was used as the crossover method in the hybrid model. The crossover point between genes was determined randomly at each crossover. The next step is the mutation process. The restriction functions given in Equations (3) and (4) were used for the gene to be mutated in the mutation process. The created hybrid model was run with 50 iterations, as presented in Table 7. After completion of the iterations, the most successful gene was determined according to the fitness values. The parameters obtained by the most successful gene in the hybrid model are presented in Table 8.
The ANN network parameters presented in Table 8 have been determined using the applied GA in a five-dimensional solution space and have produced the most successful results.
Different inputs to the network structures, number of hidden layers, activation functions in the layers, and the parameters’ changes in the learning functions could affect the success of the proposed hybrid model in reaching the correct results from the same type of data. The network structure produced by the most successful gene obtained with the hybrid model is presented in Figure 16.
In the ANN model given in Figure 16, different inputs are given to the network. In the ANN model with six hidden layers, the activation functions used in the middle layers were determined as shown in Table 8. The performance of the ANN in the hybrid model that is determined by the most successful gene in terms of learning is shown in Figure 17.
Each gene in the population within the hybrid structure creates an ANN structure within itself. The success of the genes in the population is determined according to the MSE values of each network. The closer the MSE value of each gene is to zero, the higher the success of that network in learning. In Figure 17, the performance of the ANN structure created by the gene with the lowest MSE value in the population is presented. In the performance graph presented in Figure 17a, the network has learned from iteration zero to the 110th iteration. It can be said that the network switches to over-learning in later iterations. Since the target line and the fit line overlap in the regression graph presented in Figure 17b, and the data is concentrated in the target and the fit lines region, it can be said that the rate of estimation in the training process is high. Figure 17c shows the validation vectors used to stop the network training at the point set by the training algorithm in the network training graphs. The gradient and mu values indicate how the weight values of the neural network change during iteration [102]. The graphs presented in Figure 17c show that the network structure created with these outputs of the training process presents a successful situation. The performance score predicted by the most successful gene obtained with the hybrid model has been illustrated in Figure 18.
According to the real data, the network structure revealed by the hybrid model in Figure 18 has been estimated correctly with an average error of 0.04. The estimation success for each RC building is depicted in Figure 19.
The ANN structure obtained from the proposed hybrid model in this study has produced successful results in estimating the structural performance scoring that is calculated to determine regional earthquake risks in RC buildings.

6. Discussion and Conclusions

In the pre-disaster preparation phase of modern disaster management, one of the processes is to decide whether the seismic performance of the building stock in the region that might be affected by the earthquake is sufficient. In light of this information, it is necessary to determine the buildings with insufficient earthquake performance and decide on demolition and retrofitting when necessary. Many buildings in stock do not make detailed structural analyses for individual structures possible. Thus, simplified approaches are specified to minimize the number of buildings in large stock for further comprehensive, advanced analyses. For the first time in Turkey, risk prioritization of buildings has been defined under PDRB-2013 for different building types. This study used the rapid assessment method for RC structures in this regulation. One of the limitations of using this method is that RC structures are between 1–7 stories. This method is not used in RC structures with more than 7-stories. Within the scope of this study, 329 RC buildings in the province of Bitlis, located in the Lake Van Basin, which has a high seismic risk in Turkey, were considered. While selecting these buildings, each neighborhood in the city center of Bitlis was taken into account. In order to adequately represent the building stock in each neighborhood, an average of 25 RC buildings was selected where the method can be applied. The short column in 58%, soft/weak story in 63%, heavy overhang in 66%, collision effect in 69%, and hill-slope effect in 22% of the buildings has been examined. The existence of any or a combination of these negative features in structures will directly affect their seismic behavior. Since these parameters, which are taken into account in the rapid assessment method, are obtained using post-earthquake damage data, they provide information about the behavior of structures under the influence of possible earthquakes. Especially, the existence of soft story and heavy overhang damages are commonly observed in earthquakes. In addition, the quality of the building is also significant under the effect of earthquakes. The negativity score recommended for the soft story and overhang in this rapid evaluation method reveals the vulnerability of this negativity parameter. Another vulnerable parameter is the visual quality of the building. The presence of one of them alone increases the earthquake vulnerability and increases the risk priority. The presence of several of them together will increase the earthquake vulnerability even more. Therefore, it is necessary to avoid these parameters as much as possible during the building design phase. However, if making these negative parameters is necessary, the structural design should be done by taking the necessary precautions. Care should be taken to ensure that the criteria, such as sufficient strength, continuity, and ductility, are at the levels stipulated in earthquake regulations.
Risk priorities can be determined on a regional basis based on performance scores obtained for the buildings. Therefore, it helps to identify the necessary buildings and prioritize the detailed analysis. These performance score results can only be used to determine risk priorities for RC. Therefore, it cannot surely be decided whether the risky buildings comply with the earthquake regulations. This is just a rapid assessment, as stated in the earthquake code. Therefore, the final results of the structures are determined from a detailed analysis.
In line with the purpose of this study, the most optimal ANN model was created with a hybrid structure to quickly and easily calculate the structural result scores used in determining the regional earthquake risk priorities of RC buildings. A feedforward back-propagation ANN model was implemented to estimate the earthquake score within the created model. The network parameters in the ANN structure directly affect the network’s efficiency. The input parameters to the ANN structure are those which are applied in the Turkish rapid assessment method for determining the risk priorities of an existing RC building stock. In addition to input parameters, the number of hidden layers, the number of neurons in the hidden layers, the activation functions used in the neurons, and the learning algorithm parameters of the network were examined to produce the most successful result in the GA in the solution space. The proposed hybrid structure specified the most successful network parameters for this problem, which could not be found by a trial-and-error method. By establishing this hybrid ANN-GA model, besides determining the network parameters in the solution space, the input parameters to be used for this network structure are also optimized.
The earthquake score predictions of the hybrid model were verified with the actual data, and successful results were obtained. The presented model also determined the input parameters that should be applied for such a problem. In addition, the suggested hybrid structure could eliminate the calculations related to the classical methods and helps calculate the earthquake score of any RC building without the need for experts in this field. This model can be developed for rapid assessment methods used in different countries, and the general framework can be adapted to other types of structures (e.g., masonry buildings).

Author Contributions

Conceptualization, M.A.B., E.I., M.F.I. and E.H.; methodology, E.H., S.E.A.H., E.I., M.A.B. and E.H.; software, M.A.B. and M.F.I.; validation, E.H., M.A.B. and E.I.; formal analysis, E.I.; investigation, M.F.I. and S.E.A.H.; resources, E.H., M.A.B., E.I., S.E.A.H. and M.F.I.; data curation, E.I. and E.H.; writing—original draft preparation, E.H. and E.I.; writing—review and editing, S.E.A.H., M.F.I., E.I. and E.H.; visualization, E.H.; supervision, E.I. and E.H.; project administration, M.A.B.; funding acquisition, E.H and E.I. All authors have read and agreed to the published version of the manuscript.

Funding

This research received no external funding.

Data Availability Statement

Data sharing not applicable.

Conflicts of Interest

The authors declare no conflict of interest.

References

  1. Bilgin, H.; Shkodrani, N.; Hysenlliu, M.; Ozmen, H.B.; Isik, E.; Harirchian, E. Damage and performance evaluation of masonry buildings constructed in 1970s during the 2019 Albania earthquakes. Eng. Fail. Anal. 2022, 131, 105824. [Google Scholar] [CrossRef]
  2. Kassem, M.M.; Beddu, S.; Ooi, J.H.; Tan, C.G.; Mohamad El-Maissi, A.; Mohamed Nazri, F. Assessment of seismic building vulnerability using rapid visual screening method through web-based application for Malaysia. Buildings 2021, 11, 485. [Google Scholar] [CrossRef]
  3. Karakas, C.C.; Palanci, M.; Senel, S.M. Fragility based evaluation of different code based assessment approaches for the performance estimation of existing buildings. Bull. Earthq. Eng. 2022, 20, 1685–1716. [Google Scholar] [CrossRef]
  4. Pavić, G.; Hadzima-Nyarko, M.; Bulajić, B. A contribution to a UHS-based seismic risk assessment in Croatia a case study for the city of Osijek. Sustainability 2020, 12, 1796. [Google Scholar] [CrossRef] [Green Version]
  5. Ademović, N.; Šipoš, T.K.; Hadzima-Nyarko, M. Rapid assessment of earthquake risk for Bosnia and Herzegovina. Bull. Earthq. Eng. 2020, 18, 1835–1863. [Google Scholar] [CrossRef]
  6. Doğan, T.P.; Kızılkula, T.; Mohammadi, M.; Erkan, İ.H.; Kabaş, H.T.; Arslan, M.H. A comparative study on the rapid seismic evaluation methods of reinforced concrete buildings. Int. J. Dis. Risk Reduct. 2021, 56, 102143. [Google Scholar] [CrossRef]
  7. Isik, E. Consistency of the rapid assessment method for reinforced concrete buildings. Earthq. Struct. 2016, 11, 873–885. [Google Scholar] [CrossRef]
  8. Arslan, M.H. An evaluation of effective design parameters on earthquake performance of RC buildings using neural networks. Eng. Struct. 2010, 32, 1888–1898. [Google Scholar] [CrossRef]
  9. Yakut, A. Preliminary seismic performance assessment procedure for existing RC buildings. Eng. Struct. 2004, 26, 1447–1461. [Google Scholar] [CrossRef]
  10. Sucuoğlu, H.; Yazgan, U.; Yakut, A. A screening procedure for seismic risk assessment in urban building stocks. Earthq. Spectra 2007, 23, 441–458. [Google Scholar] [CrossRef]
  11. Işık, M.F.; Işık, E.; Bülbül, M.A. Application of iOS/Android based assessment and monitoring system for building inventory under seismic impact. Gradevinar 2018, 70, 1043–1056. [Google Scholar]
  12. Işık, E.; Kutanis, M. The evaluation of R/C buildings in Bitlis using P25 rapid screening method. J. Balıkesir Univ. Inst. Sci. Technol. 2013, 15, 21–29. [Google Scholar]
  13. Özkul, B.; Gülgeç, E. Betonarme bir okul binasının 4 farklı hızlı değerlendirme metodu ile deprem performansının karşılaştırması. J. Balıkesir Univ. Inst. Sci. Technol. 2022, 24, 152–171. [Google Scholar] [CrossRef]
  14. Šipoš, T.K.; Hadzima-Nyarko, M. Rapid seismic risk assessment. Int. J. Dis. Risk Reduct. 2017, 24, 348–360. [Google Scholar] [CrossRef]
  15. Jain, S.K.; Mitra, K.; Kumar, M.; Shah, M. A proposed rapid visual screening procedure for seismic evaluation of RC-frame buildings in India. Earthq. Spectra 2010, 26, 709–729. [Google Scholar] [CrossRef]
  16. Işık, E.; Karaşin, İ.B.; Demirci, A.; Büyüksaraç, A. Seismic risk priorities of site and mid-rise RC buildings in Turkey. Chall. J. Struct. Mech. 2020, 6, 191–203. [Google Scholar] [CrossRef]
  17. Işık, E.; Işık, M.F.; Bülbül, M.A. Web based evaluation of earthquake damages for reinforced concrete buildings. Earthq. Struct. 2017, 13, 423–432. [Google Scholar]
  18. Kapetana, P.; Dritsos, S. Seismic assessment οf buildings by rapid visual screening procedures. Earthq. Resist. Eng. Struct. VI 2007, 93, 409. [Google Scholar]
  19. Ozmen, H.B.; Inel, M. Effect of rapid screening parameters on seismic performance of RC buildings. Struct. Eng. Mech. 2017, 62, 391–399. [Google Scholar] [CrossRef]
  20. Işık, E. Calculation of performance score for a damaged rc building. Int. Anatolia Acad. Online J. Sci. 2015, 3, 47–52. [Google Scholar]
  21. Falcone, R.; Lima, C.; Martinelli, E. Soft computing techniques in structural and earthquake engineering: A literature review. Eng. Struct. 2020, 207, 110269. [Google Scholar] [CrossRef]
  22. Fan, W.; Chen, Y.; Li, J.; Sun, Y.; Feng, J.; Hassanin, H.; Sareh, P. Machine learning applied to the design and inspection of reinforced concrete bridges: Resilient methods and emerging applications. Structures 2021, 33, 3954–3963. [Google Scholar] [CrossRef]
  23. Harirchian, E.; Aghakouchaki Hosseini, S.E.; Jadhav, K.; Kumari, V.; Rasulzade, S.; Işık, E.; Wasif, M.; Lahmer, T. A review on application of soft computing techniques for the rapid visual safety evaluation and damage classification of existing buildings. J. Build. Eng. 2021, 43, 102536. [Google Scholar] [CrossRef]
  24. Thai, H.T. Machine learning for structural engineering: A state-of-the-art review. Structures 2022, 38, 448–491. [Google Scholar] [CrossRef]
  25. Zhang, Q.; Barri, K.; Jiao, P.; Salehi, H.; Alavi, A.H. Genetic programming in civil engineering: Advent, applications and future trends. Artif. Intell. Rev. 2020, 54, 1863–1885. [Google Scholar] [CrossRef]
  26. Da Silva, I.N.; Spatti, D.N.; Flauzino, R.A.; Liboni, L.H.B.; dos Reis Alves, S.F. Artificial Neural Networks; Springer: Cham, Switzerland, 2017; p. 39. Available online: https://link.springer.com/content/pdf/10.1007/978-3-319-43162-8.pdf (accessed on 22 February 2022).
  27. Chandwani, V.; Agrawal, V.; Nagar, R. Modeling slump of ready mix concrete using genetic algorithms assisted training of Artificial Neural Networks. Expert Syst. Appl. 2015, 42, 885–893. [Google Scholar] [CrossRef]
  28. Tao, J.; Lin, T.; Lin, X. A concrete mix proportion design algorithm based on artificial neural networks. Cem. Concr. Res. 2006, 36, 1399–1408. [Google Scholar]
  29. Lee, S.; Lee, C. Prediction of shear strength of FRP-reinforced concrete flexural members without stirrups using artificial neural networks. Eng. Struct. 2014, 61, 99–112. [Google Scholar] [CrossRef]
  30. Wu, N.J. Predicting the compressive strength of concrete using an RBF-ANN model. Appl. Sci. 2021, 11, 6382. [Google Scholar] [CrossRef]
  31. Aguilar, V.; Sandoval, C.; Adam, J.M.; Garzón-Roca, J.; Valdebenito, G. Prediction of the shear strength of reinforced masonry walls using a large experimental database and artificial neural networks. Struct. Infrastruct. Eng. 2016, 12, 1661–1674. [Google Scholar] [CrossRef]
  32. Ferreira, F.P.V.; Shamass, R.; Limbachiya, V.; Tsavdaridis, K.D.; Martins, C.H. Lateral–torsional buckling resistance prediction model for steel cellular beams generated by Artificial Neural Networks (ANN). Thin-Walled Struct. 2022, 170, 108592. [Google Scholar] [CrossRef]
  33. Ali, R.; Chuah, J.H.; Talip, M.S.A.; Mokhtar, N.; Shoaib, M.A. Structural crack detection using deep convolutional neural networks. Autom. Constr. 2022, 133, 103989. [Google Scholar] [CrossRef]
  34. Tran, V.L.; Thai, D.K.; Kim, S.E. Application of ANN in predicting ACC of SCFST column. Compos. Struct. 2019, 228, 111332. [Google Scholar] [CrossRef]
  35. Zarringol, M.; Thai, H.T.; Thai, S.; Patel, V. Application of ANN to the design of CFST columns. Structures 2020, 28, 2203–2220. [Google Scholar] [CrossRef]
  36. Prasad, B.K.R.; Eskandari, H.; Reddy, B.V.V. Prediction of compressive strength of SCC and HPC with high volume fly ash using ANN. Constr. Build. Mater. 2009, 23, 117–128. [Google Scholar] [CrossRef]
  37. Abdalla, K.M.; Stavroulakis, G.E. A backpropagation neural network model for semi-rigid steel connections. Comput.-Aided Civ. Inf. Eng. 1995, 10, 77–87. [Google Scholar] [CrossRef]
  38. Horton, T.A.; Hajirasouliha, I.; Davison, B.; Ozdemir, Z. Accurate prediction of cyclic hysteresis behaviour of RBS connections using deep learning neural networks. Eng. Struct. 2021, 247, 113156. [Google Scholar] [CrossRef]
  39. Jeyasehar, C.A.; Sumangala, K. Damage assessment of prestressed concrete beams using artificial neural network (ANN) approach. Comput. Struct. 2006, 84, 1709–1718. [Google Scholar] [CrossRef]
  40. Naser, M.; Abu-Lebdeh, G.; Hawileh, R. Analysis of RC T-beams strengthened with CFRP plates under fire loading using ANN. Constr. Build. Mater. 2012, 37, 301–309. [Google Scholar] [CrossRef]
  41. Neves, A.C.; González, I.; Leander, J.; Karoumi, R. Structural health monitoring of bridges: A model-free ANN-based approach to damage detection. J. Civ. Struct. Health Monit. 2017, 7, 689–702. [Google Scholar] [CrossRef] [Green Version]
  42. Weinstein, J.C.; Sanayei, M.; Brenner, B.R. Bridge Damage identification using artificial neural networks. J. Bridge Eng. 2018, 23, 04018084. [Google Scholar] [CrossRef] [Green Version]
  43. Morfidis, K.; Kostinakis, K. Approaches to the rapid seismic damage prediction of r/c buildings using artificial neural networks. Eng. Struct. 2018, 165, 120–141. [Google Scholar] [CrossRef]
  44. Kumari, V.; Harirchian, E.; Lahmer, T.; Rasulzade, S. Evaluation of Machine Learning and Web-Based Process for Damage Score Estimation of Existing Buildings. Buildings 2022, 12, 578. [Google Scholar] [CrossRef]
  45. Harirchian, E.; Jadhav, K.; Kumari, V.; Lahmer, T. ML-EHSAPP: A prototype for machine learning-based earthquake hazard safety assessment of structures by using a smartphone app. Eur. J. Environ. Civ. Eng. 2021, 1–21. [Google Scholar] [CrossRef]
  46. Morfidis, K.; Kostinakis, K. Use of artificial neural networks in the r/c buildings’ seismic vulnerabilty assessment: The practical point of view. In Proceedings of the 7th ECCOMAS Thematic Conference on Computational Methods in Structural Dynamics and Earthquake Engineering, Crete, Greece, 24–26 June 2019; Available online: https://www.academia.edu/download/60583743/Morfidis_Kostinakis_C19299_FINAL20190913-60173-19y71nt.pdf (accessed on 5 April 2022).
  47. Xu, Z.; Li, Z.; Wang, H. Neural Network Based Building Earthquake Damage. Available online: https://cs230.stanford.edu/projects_spring_2018/reports/8290433.pdf (accessed on 5 April 2022).
  48. Esteghamati, M.Z.; Flint, M.M. Developing data-driven surrogate models for holistic performance-based assessment of mid-rise rc frame buildings at early design. Eng. Struct. 2021, 245, 112971. [Google Scholar] [CrossRef]
  49. Abdollahi, A.; Amini, A.; Hariri-Ardebili, M.A. An uncertainty-aware dynamic shape optimization framework: Gravity dam design. Reliab. Eng. Syst. Saf. 2022, 222, 108402. [Google Scholar] [CrossRef]
  50. Omoya, M.; Ero, I.; Zaker Esteghamati, M.; Burton, H.V.; Brandenberg, S.; Sun, H.; Nweke, C.C. A relational database to support post-earthquake building damage and recovery assessment. Earthq. Spectra 2022, 38, 1549–1569. [Google Scholar] [CrossRef]
  51. Zaker Esteghamati, M.; Lee, J.; Musetich, M.; Flint, M.M. INSSEPT: An open-source relational database of seismic performance estimation to aid with early design of buildings. Earthq. Spectra 2020, 36, 2177–2197. [Google Scholar] [CrossRef]
  52. Ahmed, B.; Mangalathu, S.; Jeon, J.S. Seismic damage state predictions of reinforced concrete structures using stacked long short-term memory neural networks. J. Build. Eng. 2022, 46, 103737. [Google Scholar] [CrossRef]
  53. Yuan, X.; Chen, G.; Jiao, P.; Li, L.; Han, J.; Zhang, H. A neural network-based multivariate seismic classifier for simultaneous post-earthquake fragility estimation and damage classification. Eng. Struct. 2022, 255, 113918. [Google Scholar] [CrossRef]
  54. De-Miguel-Rodríguez, J.; Morales-Esteban, A.; Requena-García-Cruz, M.V.; Zapico-Blanco, B.; Segovia-Verjel, M.L.; Romero-Sánchez, E.; Carvalho-Estêvão, J.M. Fast seismic assessment of built urban areas with the accuracy of mechanical methods using a feedforward neural network. Sustainability 2022, 14, 5274. [Google Scholar] [CrossRef]
  55. Kim, M.; Song, J. Near-real-time identification of seismic damage using unsupervised deep neural network. J. Eng. Mech. 2022, 148, 04022006. [Google Scholar] [CrossRef]
  56. Chisari, C.; Bedon, C.; Amadio, C. Dynamic and static identification of base-isolated bridges using genetic algorithms. Eng. Struct. 2015, 102, 80–92. [Google Scholar] [CrossRef]
  57. Chisari, C.; Macorini, L.; Amadio, C.; Izzuddin, B.A. Optimal sensor placement for structural parameter identification. Struct. Multidiscipl. Optim. 2016, 55, 647–662. [Google Scholar] [CrossRef]
  58. Cha, Y.J.; Buyukozturk, O. Structural damage detection using modal strain energy and hybrid multi objective optimization. Comput. Aided Civ. Infrastruct. Eng. 2015, 30, 347–358. [Google Scholar] [CrossRef]
  59. Silva, M.; Santos, A.; Figueiredo, E.; Santos, R.; Sales, C.; Costa, J.C.W.A. A novel unsupervised approach based on a genetic algorithm for structural damage detection in bridges. Eng. Appl. Artif. Intell. 2016, 52, 168–180. [Google Scholar] [CrossRef]
  60. Kociecki, M.; Adeli, H. Two-phase genetic algorithm for topology optimization of free-form steel space-frame roof structures with complex curvatures. Eng. Appl. Artif. Intell. 2014, 32, 218–227. [Google Scholar] [CrossRef]
  61. Kociecki, M.; Adeli, H. Shape optimization of free-form steel space-frame roof structures with complex geometries using evolutionary computing. Eng. Appl. Artif. Intell. 2015, 38, 168–182. [Google Scholar] [CrossRef]
  62. Greco, R.; Marano, G.C. Multi-objective optimization of a dissipative connection for seismic protection of wall-frame structures. Soil Dyn. Earthq. Eng. 2016, 87, 151–163. [Google Scholar] [CrossRef]
  63. Allali, S.A.; Abed, M.; Mebarki, A. Post-earthquake assessment of buildings damage using fuzzy logic. Eng. Struct. 2018, 166, 117–127. [Google Scholar] [CrossRef]
  64. Kilicarslan, S.; Celik, M.; Sahin, Ş. Hybrid models based on genetic algorithm and deep learning algorithms for nutritional Anemia disease classification. Biomed. Signal Process. Control 2021, 63, 102231. [Google Scholar] [CrossRef]
  65. Bülbül, M.A.; Öztürk, C. Optimization, modeling and implementation of plant water consumption control using genetic algorithm and artificial neural network in a hybrid structure. Arab. J. Sci. Eng. 2022, 47, 2329–2343. [Google Scholar] [CrossRef]
  66. Platt, S.; Drinkwater, B.D. Post-earthquake decision making in Turkey: Studies of Van and İzmir. Int. J. Dis. Risk Reduct. 2016, 17, 220–237. [Google Scholar] [CrossRef]
  67. Bhalkikar, A.; Pradeep Kumar, R. A comparative study of different rapid visual survey methods used for seismic assessment of existing buildings. Structures 2021, 29, 1847–1860. [Google Scholar] [CrossRef]
  68. Ozcebe, G.; Yucemen, M.S.; Aydogan, V. Statistical seismic vulnerability assessment of existing reinforced concrete buildings in turkey on a regional scale. J. Earthq. Eng. 2004, 8, 749–773. [Google Scholar] [CrossRef]
  69. Sarmah, T.; Das, S. Earthquake vulnerability assessment for rcc buildings of Guwahati City using rapid visual screening. Procedia Eng. 2018, 212, 214–221. [Google Scholar] [CrossRef]
  70. Stefanini, L.; Badini, L.; Mochi, G.; Predari, G.; Ferrante, A. Neural networks for the rapid seismic assessment of existing moment-frame RC buildings. Int. J. Dis. Risk Reduct. 2022, 67, 102677. [Google Scholar] [CrossRef]
  71. PDRB. The Principles of Determining Risky Buildings; Turkey Ministry of Environment and Urbanization: Ankara, Turkey, 2013. [Google Scholar]
  72. Şengezer, B. 13 Mart 1992 Erzincan Depremi Hasar Analizi ve Türkiye’de Deprem Sorunu; Y.T.Ü. Basın Yayın Merkezi: Istanbul, Turkey, 1999. [Google Scholar]
  73. Su, N. Structural evaluations of reinforced concrete buildings damaged by Chi-Chi earthquake in Taiwan. Pract. Period. Struct. Des. Constr. 2001, 6, 119–128. [Google Scholar] [CrossRef]
  74. Işık, E.; Harirchian, E.; Bilgin, H.; Jadhav, K. The effect of material strength and discontinuity in RC structures according to different site-specific design spectra. Res. Eng. Struct. Mater. 2021, 7, 413–430. [Google Scholar] [CrossRef]
  75. Doǧangün, A. Performance of reinforced concrete buildings during the May 1, 2003 Bingöl Earthquake in Turkey. Eng. Struct. 2004, 26, 841–856. [Google Scholar] [CrossRef]
  76. American Society of Civil Engineers (ASCE). Seismic Evaluation and Retrofit of Existing Buildings; ASCE 41; American Society of Civil Engineers: Reston, VA, USA, 2014; ISBN1 9780784412855. Available online: https://books.google.com/books?id=Xv3vngEACAAJ (accessed on 8 April 2022)ISBN2 9780784412855.
  77. Tezcan, S.S.; Bal, I.E.; Gulay, F.G. P25 scoring method for the collapse vulnerability assessment of R/C buildings. J. Chin. Inst. Eng. 2011, 34, 769–781. [Google Scholar] [CrossRef]
  78. Bal, İ.E.; Gülay, F.G.; Tezcan, S.S. Use of analytical tools for calibration of parameters in P25 Preliminary Assessment Method. In Computational Methods in Earthquake Engineering; Springer: Dordrecht, The Netherlands, 2011; pp. 559–582. [Google Scholar]
  79. Arslan, M.H.; Korkmaz, H.H. What is to be learned from damage and failure of reinforced concrete structures during recent earthquakes in Turkey? Eng. Fail. Anal. 2007, 14, 1–22. [Google Scholar] [CrossRef]
  80. Mwafy, A.; Khalifa, S. Effect of vertical structural irregularity on seismic design of tall buildings. Struct. Des. Tall Spec. Build. 2017, 26, e1399. [Google Scholar] [CrossRef]
  81. Bilgin, H.; Uruçi, R. Effects of structural irregularities on low and mid-rise RC building response. Chall. J. Struct. Mech. 2018, 4, 33–44. [Google Scholar] [CrossRef]
  82. Işık, E.; Özdemir, M.; Karaşin, İ.B. Performance analysis of steel structures with A3 irregularities. Int. J. Steel Struct. 2018, 18, 1083–1094. [Google Scholar] [CrossRef]
  83. Varum, H.; Melo, J.; Furtado, A.; Lima, A. Irregularities in rc buildings: Perspectives in current seismic design codes, difficulties in their application and further research needs. In Seismic Behaviour and Design of Irregular and Complex Civil Structures IV; Springer: Cham, Switzerland, 2022; pp. 1–18. [Google Scholar]
  84. De Stefano, M.; Pintucchi, B. A review of research on seismic behaviour of irregular building structures since 2002. Bull. Earthq. Eng. 2008, 6, 285–308. [Google Scholar] [CrossRef] [Green Version]
  85. Homaioon Ebrahimi, A.; Martine-Vazquez, P.; Baniotopoulos, C.C. Numerical studies on the efect of plan irregularities in the progressive collapse of steel structures. Struct. Infrastruct. Eng. 2017, 13, 1576–1583. [Google Scholar] [CrossRef]
  86. Moretti, M.L.; Tassios, T.P. Design in shear of reinforced concrete short columns. Earthq. Struct. 2013, 4, 265–283. [Google Scholar] [CrossRef]
  87. Çağatay, İ.H.; Beklen, C. Investigation of short column effects in the planar frames. Çukurova Uni. J. Fac. Eng. Archit. 2009, 24, 91–97. [Google Scholar]
  88. Işık, E.; Karasin, İ.B.; Ulu, A.E. Investigation of earthquake behavior of reinforced-concrete buildings built on soil slope. Eur. J. Sci. Tech. 2020, 20, 162–170. [Google Scholar]
  89. Ministry of Public Works. Turkish Seismic Design Code (TSDC); Official Gazette; Ministry of Public Works: Ankara, Turkey, 2007. [Google Scholar]
  90. Özmen, B. Türkiye deprem bölgeleri haritalarının tarihsel gelişimi. Türkiye Jeol. Bülteni 2012, 55, 43–55. [Google Scholar]
  91. Işık, E. A comparative study on the structural performance of an RC building based on updated seismic design codes: Case of Turkey. Chall. J. Struct. Mech. 2021, 7, 123–134. [Google Scholar] [CrossRef]
  92. Gunes, O. Turkey’s grand challenge: Disaster-proof building inventory within 20 years. Case Stud. Constr. Mater. 2015, 2, 18–34. [Google Scholar] [CrossRef] [Green Version]
  93. Ogunsina, K.; Okolo, W.A. Artificial neural network modeling for airline disruption management. arXiv 2021, arXiv:2104.02032. [Google Scholar] [CrossRef]
  94. Nahavandi, D.; Alizadehsani, R.; Khosravi, A.; Acharya, U.R. Application of artificial intelligence in wearable devices: Opportunities and challenges. Comput. Meth. Progr. Biomed. 2022, 213, 106541. [Google Scholar] [CrossRef]
  95. Hasan, S.S.U.; Ghani, A.; Din, I.U.; Almogren, A.; Altameem, A. IoT devices authentication using artificial neural network. Comput. Mater. Contin. 2022, 70, 3701–3716. [Google Scholar] [CrossRef]
  96. He, Y.; Zhang, R.; Ye, N. Genetic algorithm-based reliability of computer communication network. IETE J. Res. 2022, 1–11. [Google Scholar] [CrossRef]
  97. Sun, B.; Zhou, Y. Bayesian network structure learning with improved genetic algorithm. Int. J. Intell. Syst. 2022. [Google Scholar] [CrossRef]
  98. He, X.; Hu, Z. Optimization design of fractional-order Chebyshev lowpass filters based on genetic algorithm. Int. J. Circuit Theory Appl. 2022, 50, 1420–1441. [Google Scholar] [CrossRef]
  99. Eisenmann, A.; Streubel, T.; Rudion, K. Power quality mitigation via smart demand-side management based on a genetic algorithm. Energies 2022, 15, 1492. [Google Scholar] [CrossRef]
  100. Stephan, P.; Stephan, T.; Kannan, R.; Abraham, A. A hybrid artificial bee colony with whale optimization algorithm for improved breast cancer diagnosis. Neural Comput. Appl. 2021, 33, 13667–13691. [Google Scholar] [CrossRef]
  101. Wahyuni, I.; Mahmudy, W.F. Rainfall prediction in Tengger, Indonesia using hybrid tsukamoto FIS and genetic algorithm method. J. ICT Res. Appl. 2017, 11, 38–55. [Google Scholar] [CrossRef] [Green Version]
  102. Lopes, J.; Gonçalves, A.; Carvalho, J.; Fujimoto, R. Fish disease diagnosis using artificial neural networks. Int. J. Comput. Sci. Issues 2011, 8, 68–74. [Google Scholar]
Figure 1. Structural system type (A) RC Frame (RCF) and (B) RC Frame with Shear Walls (RCFW).
Applsci 12 05138 g001
Figure 2. Determination of the number of stories (ns).
Applsci 12 05138 g002
Figure 3. Instances of vertical irregularity.
Applsci 12 05138 g003
Figure 4. Examples of overhangs (A) with overhang, (B) no overhangs, and (C) balcony with no overhangs.
Applsci 12 05138 g004
Figure 5. Samples of regular and irregular plans of the buildings.
Applsci 12 05138 g005
Figure 6. Samples of short column.
Applsci 12 05138 g006
Figure 7. The location of a sample building relative to the neighbouring buildings.
Applsci 12 05138 g007
Figure 8. Story levels in neighbouring buildings.
Applsci 12 05138 g008
Figure 9. Earthquake zones map of Turkey [92].
Applsci 12 05138 g009
Figure 10. The flowchart of Turkish Rapid Screening Method (PDRB-2013).
Applsci 12 05138 g010
Figure 11. Distributions of the buildings.
Applsci 12 05138 g011
Figure 12. Distribution of performance scores.
Applsci 12 05138 g012
Figure 13. Neuron cell structure.
Applsci 12 05138 g013
Figure 14. Structure of a feedforward back-propagation ANN.
Applsci 12 05138 g014
Figure 15. GA-ANN hybrid model.
Applsci 12 05138 g015
Figure 16. ANN network structure generated by the most successful gene.
Applsci 12 05138 g016
Figure 17. Performance of the ANN in the hybrid model generated by the most successful gene in terms of training. (a) Performance, (b) Regression, (c) Network training graphs.
Applsci 12 05138 g017
Figure 18. Performance scores of RC buildings.
Applsci 12 05138 g018
Figure 19. Standard deviation performance of ANN formed by the most successful gene.
Applsci 12 05138 g019
Table 1. Local soil groups [89].
Soil GroupDescription of
Soil Group
Standard Penetration (N/30)Relative Density (%)Unconfined. Compressive Strength (kPa)Drift Wave Velocity (m/s)
A1. Massive volcanic rocks,
non-weathered sound
metamorphic rocks, stiff
cemented sedimentary rocks
>1000>1000
2. Very dense sand, gravel>5085–100>700
3. Hard clay and silty clay>32>400>700
B1. Soft volcanic rocks such as
tuff and agglomerate,
weathered cemented
sedimentary rocks with
planes of discontinuity.
500–1000700–1000
2. Dense sand, gravel.30–5065–85400–700
3. Very stiff clay, silty clay16–32200–400300–700
C1. Highly weathered soft
metamorphic rocks and
cemented sedimentary rocks
with planes of discontinuity
˂500400–700
2. Medium dense sand and
gravel.
10–3035–65200–400
3. Stiff clay and silty clay8–16100–200200–300
D1. Soft, deep alluvial layers
with high ground water level
˂200
2. Loose sand.˂10˂35˂200
3. Soft clay and silty clay˂8˂100˂200
Table 2. Local site classes [89].
Local Site ClassSoil Group According to Table 1 and Topmost Soil Layer
Thickness (h1)
Z1Group (A) soils
Group (B) soils with h1 ≤ 15 m
Z2Group (B) soils with h1 > 15 m
Group (C) soils with h1 ≤ 15 m
Z3Group (C) soils with 15 m < h1 ≤ 50 m
Group (D) soils with h1 ≤ 10 m
Z4Group (C) soils with h1 > 50 m
Group (D) soils with h1 > 10 m
Table 3. Base and structural system scores [71].
Total Number of StoriesBase ScoreStructural System Score (YSP)
Structural System
Danger ZoneRCFRCFW
IIIIIIIV
1 and 2901201601950100
380100140170085
47090130160075
56080110135065
6 and 7506590110055
Table 4. Earthquake zones determined according to TSDC-2007 [71].
Danger ZoneEarthquake Zone According to
TSDC-2007
Soil Class According to TSDC-2007
I1Z3/Z4
II1Z1/Z2
2Z3/Z4
III2Z1/Z2
3Z3/Z4
IV3Z1/Z2
4All soil types
Table 5. Negative parameter values (Oi) [71].
Negativity
Parameter
Case 1Case 2
Parameter DetectionParameter ValueParameter
Detection
Parameter Value
Soft storyNone0Available1
Heavy overhangsNone0Available1
Apparent qualityGood0Moderate (bad)1 (2)
Short columnNone0Available1
Hill/slope effectNone0Available1
Irregularity in planNone0Available1
Table 6. Negativity parameter score (OPi) [71].
Total Number of
Stories
Negativity Parameter Scores (OP)
Soft StoreyApparent QualityHeavy OverhangsStorey Level/Building StatusVertical
Irregularity
Irregularity/Torsion Effect in PlanShort ColumnHill/Slope Effect
SameSameDifferentDifferent
MiddleCornerCornerMiddle
1, 2−10−10−100−10−5−15−5−5−5−3
3−20−10−200−10−5−15−10−10−5−3
4−30−15−300−10−5−15−15−10−5−3
5−30−25−300−10−5−15−15−10−5−3
6, 7−30−30−300−10−5−15−15−10−5−3
Table 7. GA parameter and values.
GA ParametersValues
Population Number (n)20
Solution Space (D)5
Selection Rate (c)0.9
Mutation Rate (m)0.03
Iteration Number (T)50
Table 8. Network parameters and values created with the most successful gene.
Network ParametersValues
InputNumber of stories, short column, soft/weak story, heavy overhang, pounding effect, hill-slope effect, visual quality
Number of hidden layers6
Number of neurons in hidden layers8-5-1-10-8-4
Activation functions in hidden layersTansig-logsig-purelin-tansig-purelin-logsig
Number of neurons in the output layer1
Activation function in the output layerpurelin
Training functiontrainbr
MSE15, 35
Publisher’s Note: MDPI stays neutral with regard to jurisdictional claims in published maps and institutional affiliations.

