Article

A Mathematical Modeling of Evaluating China’s Construction Safety for Occupational Accident Analysis

by
Qianwei Ma
1,*,
Jeffrey Wills Lusk
1,
Fabian Hadipriono Tan
1,
Michael Edward Parke
2,†,
Hanouf Mohammad Alhumaidi
3 and
Jordan Douglas Clark
1
1
Department of Civil, Environmental and Geodetic Engineering, The Ohio State University, 2070 Neil Avenue, Columbus, OH 43210, USA
2
Department of Engineering Education, The Ohio State University, 2070 Neil Avenue, Columbus, OH 43210, USA
3
College of Engineering and Petroleum, Kuwait University, Safat 13060, Kuwait
*
Author to whom correspondence should be addressed.
Michael Edward Parke passed away.
Appl. Sci. 2022, 12(10), 5054; https://doi.org/10.3390/app12105054
Submission received: 8 April 2022 / Revised: 9 May 2022 / Accepted: 16 May 2022 / Published: 17 May 2022
(This article belongs to the Topic Advances in Construction and Project Management)

Abstract

:
China has seen a rapid increase in its construction industry in recent years; however, safety conditions of their workers have not improved owing to low education levels and increasing age trend of construction personnel. This study analyzed construction occupations in China from 2010 to 2018 using descriptive analysis, ANOVA and factor analysis. The results showed May, July and August as the deadliest months during the peak of construction activities in the year. No particular day was established as having a higher risk than other days in the week. The most vulnerable times of the day are from 9 AM to 10 AM and 2 PM to 4 PM. A mathematic modeling based on factor analysis, which is the construction safety evaluation score equation, was developed to illustrate regional distribution, and Qinghai Province ranked the worst in construction safety in China. Problems such as poor labor and environment safety management procedures and false reporting or concealed reporting of construction accidents were revealed. Suggestions for improving China’s construction safety were also generated. This study enriched statistical analysis results of construction accidents in China and evaluation modeling with an abundant database will serve as a reference for stakeholders and researchers to improve the construction safety situation in China.

1. Introduction

Construction is a labor-intensive industry based on manual labor [1,2] and therefore, the education and skill level of the workforce mainly determine the safety and quality of its products. However, the average annual salary of these workers was 60,501 yuan (approximately USD 9300) in 2018, which was less than the average annual salary of China’s total workforce [3]. It is hard to attract a younger, more educated workforce with high technical skill to consider construction as a vocation. The education level of 87.1% of construction workers was equal or lower than senior high school [3]. Additionally, according to the China Construction Industry Association, the average age of construction workers increased by ten years from 2007 (33.2 years) to 2017 (43.1 years). The low skill level [4], low educational level [4,5] and increased age trends of construction workers in China increase the likelihood of accidents as compared to those of workers with the same trends in other industries. In addition, characteristics of complexity [6,7], dynamic workplace [8], staff mobility [8,9] and external weather effects [2,10] that exist in the construction industry also increase the risk of accidents that construction workers encounter. Specifically, there were 5255 construction accidents and 6392 worker deaths in China during the period from 2010 to 2018, reported by the annual construction accident report from the Ministry of Housing and Urban-Rural Development of the People’s Republic of China (MHUOURD) [11]. Therefore, it is urgent to evaluate construction safety in China, which will contribute significantly to reduce death and financial loss due to construction accidents.
Statistical analysis and mathematical modeling, which depicted abundant information regarding safety and risk level [12], such as assessment and prediction of injuries and fatalities in construction, have been applied to civil engineering [13,14]. Im et al. studied 10,276 fatal occupational injuries’ characteristics in Korea through several statistical analyses and offered suggestions to reduce death due to the most frequent accident types, such as falling, structural collapse and electric shock in Korea’s construction industry [15]. Cheng et al. carried out correlation coefficient analysis and ANOVA on 1546 occupational accidents for small construction enterprises in Taiwan and suggested occupational accident occurrence was highly related to age, profession, unsafe acts by workers and unsafe conditions [16]. Wangberg et al. used linear regression to test the null hypothesis that there is no statistical relationship between quality performance indicators and safety performance indicators and found strong positive correlations between injury and rework and first aid rate and defects [17]. Winge and Albrechtsen used incident concentration analysis (similar to descriptive epidemiology) to identify clusters with common characteristics of 176 construction accidents in Norway. It was reported that work type, hazard and energy difference in energy models contributed together to the difference in the distribution of accident types [18]. The studies mentioned above demonstrated the feasibility of using statistical analysis and mathematical modeling in estimating and assuming safety performance in construction engineering.
Studies have also been carried out on construction accidents in mainland China for construction accident prevention. Tam et al. conducted a questionnaire survey among 200 construction firms in China to examine construction safety in China and revealed defects of safety management including lack of provision of PPE, regular meetings and safety training [4]. Zhang et al. compared usability and validity of four accident causation models (STAMP, AcciMap, HFACS and 2-4 Model) when analyzing a construction accident case in China and recommended the 2-4 Model for construction accident analysis owing to its characteristic of connecting accident causes, management and safety culture [5]. Guo et al. formed a Bayesian network (BN) model based on 287 construction accident cases in China to reveal that unsafe behaviors greatly contributed to certain accident types in critical groups. The importance of safety training for both workers and managers/engineers was also suggested [19]. Xu et al. devised an approach to extract typical safety risk factors using text mining (TM) technology from construction accident reports and applied it to a case study reporting critical safety risk factors in China including surrounding environment, safety management, construction technology, construction personnel, materials and equipment [20]. However, sample sizes in current research were not large, and some of them were outdated since fresh data are updated. Although some studies have illustrated construction accident patterns in China based on abundant new database, a more comprehensive study with more information is required rather than investigating construction fields merely because China is a huge country with different developmental levels and safety climates in different regions.
This study aimed at overcoming deficiencies of limited sample size in current research for time scales and building a standard construction accident evaluation model by combing indices of construction safety, finance, labor and building construction scale for different regions in China. Data for construction accidents in China during the period from 2010 to 2018 were collected from MOHURD [11] and local websites in Henan Province [21]. Frequency analysis and analysis of variance (ANOVA) were used to explore time distribution characteristics for construction accidents in time scales regarding year, month, day of week and hour of day. Then, factor analysis was conducted to combine various indices into two factors and build a standard construction accident evaluation model for different regions in China. Finally, suggestions for improvement of construction safety were generated for local government and companies regarding results of the time-regional distribution of construction accidents.

2. Data and Methods

2.1. Data Source

MOHURD collects and publishes construction accident information monthly, quarterly and annually. Construction accident reports can be accessed by entering the document library of MOHURD [11], then filtering parameters by clicking “Department of supervision on construction quality & safety” (relevant department of construction accident) and “Statistical data” (relevant document type). Construction accident number and worker death toll per year, month, region and accident cause can be obtained. However, these reports contain little information and more detailed description of each accident is needed for further study. There was an accident bulletin board in MOHURD which displayed more specific time and accident types of worker fatalities for relevant stakeholders of numerous construction accidents, but it is no longer available as of 2019. Thanks to a local website in Henan Province [21] which collected and recorded reports from the accident bulletin board. Construction accident number and worker death toll per day of week and hour of day were obtained through extracting key information from reports on the accident bulletin board. Note that although there might be some deviation of data owing to concealment or delay of reporting from some local authorities to MOHURD or updates of data over time, analysis results in this study can still reveal patterns of construction accidents in China and serve as a reference which contributes to improving construction safety in China. Building areas under construction, construction gross domestic product (GDP) and construction employee population in each region were collected from annual China Statistical Yearbooks (for example, [22]).
Data from MOHURD are relevant to building and civil construction accidents. According to the work safety commission office of the State Council of China [23], the scope of building and civil construction is defined in Table 1.

2.2. ANOVA

Analysis of variance (ANOVA) is a test statistic to test the hypothesis that the p distributions from which the samples were drawn are actually the same [24]. Two hypotheses are supposed as follows:
H0: 
There is no significant diversity between observations among different samples.
H1: 
The hypothesis H0 is not true.
Variation between n observations can be partitioned into two smaller sums of squares: sum of squares will measure variation between the p different samples ( S R e s i d 2 ), and the other sum of squares will measure the variation between observations within each of the samples ( S B e t w 2 ). These two sums of squares are defined as follows:
S R e s i d 2 = i = 1 p j 1 n i X i j X ¯ i + 2 ,
S B e t w 2 = i = 1 p n i X ¯ i + X ¯ + + 2 ,
In which,
X ¯ + + = 1 n i = 1 p j = 1 n i X i j = 1 n i = 1 p n i X ¯ i +
A test statistic that will tend to be larger if H1 is true than if H0 is true. Supposing H0 is true, the ratio of two sums of squares (U2) will have the F distribution with p − 1 and np degrees of freedom. Therefore, whether or not observations come from the same sample can be identified through comparing significant values of U2 with critical values. U2 is defined Equation (4):
U 2 = S B e t w 2 / p 1 S R e s i d 2 / n p

2.3. Factor Analysis

Factor analysis is utilized to represent the underlying information of a set of variables using a smaller number of variables [25]. An indices system was built and principal component analysis (PCA) was carried out to extract information from the original data sets regarding construction accidents, finance, labor and building construction scale and combine them into two composite indices called factors. A score function and a mathematical model based on the result of factor analysis were built. Statistical Product Service Solutions (SPSS 23.0) was utilized for completing factor analysis, ANOVA and other statistical functions.

3. Results

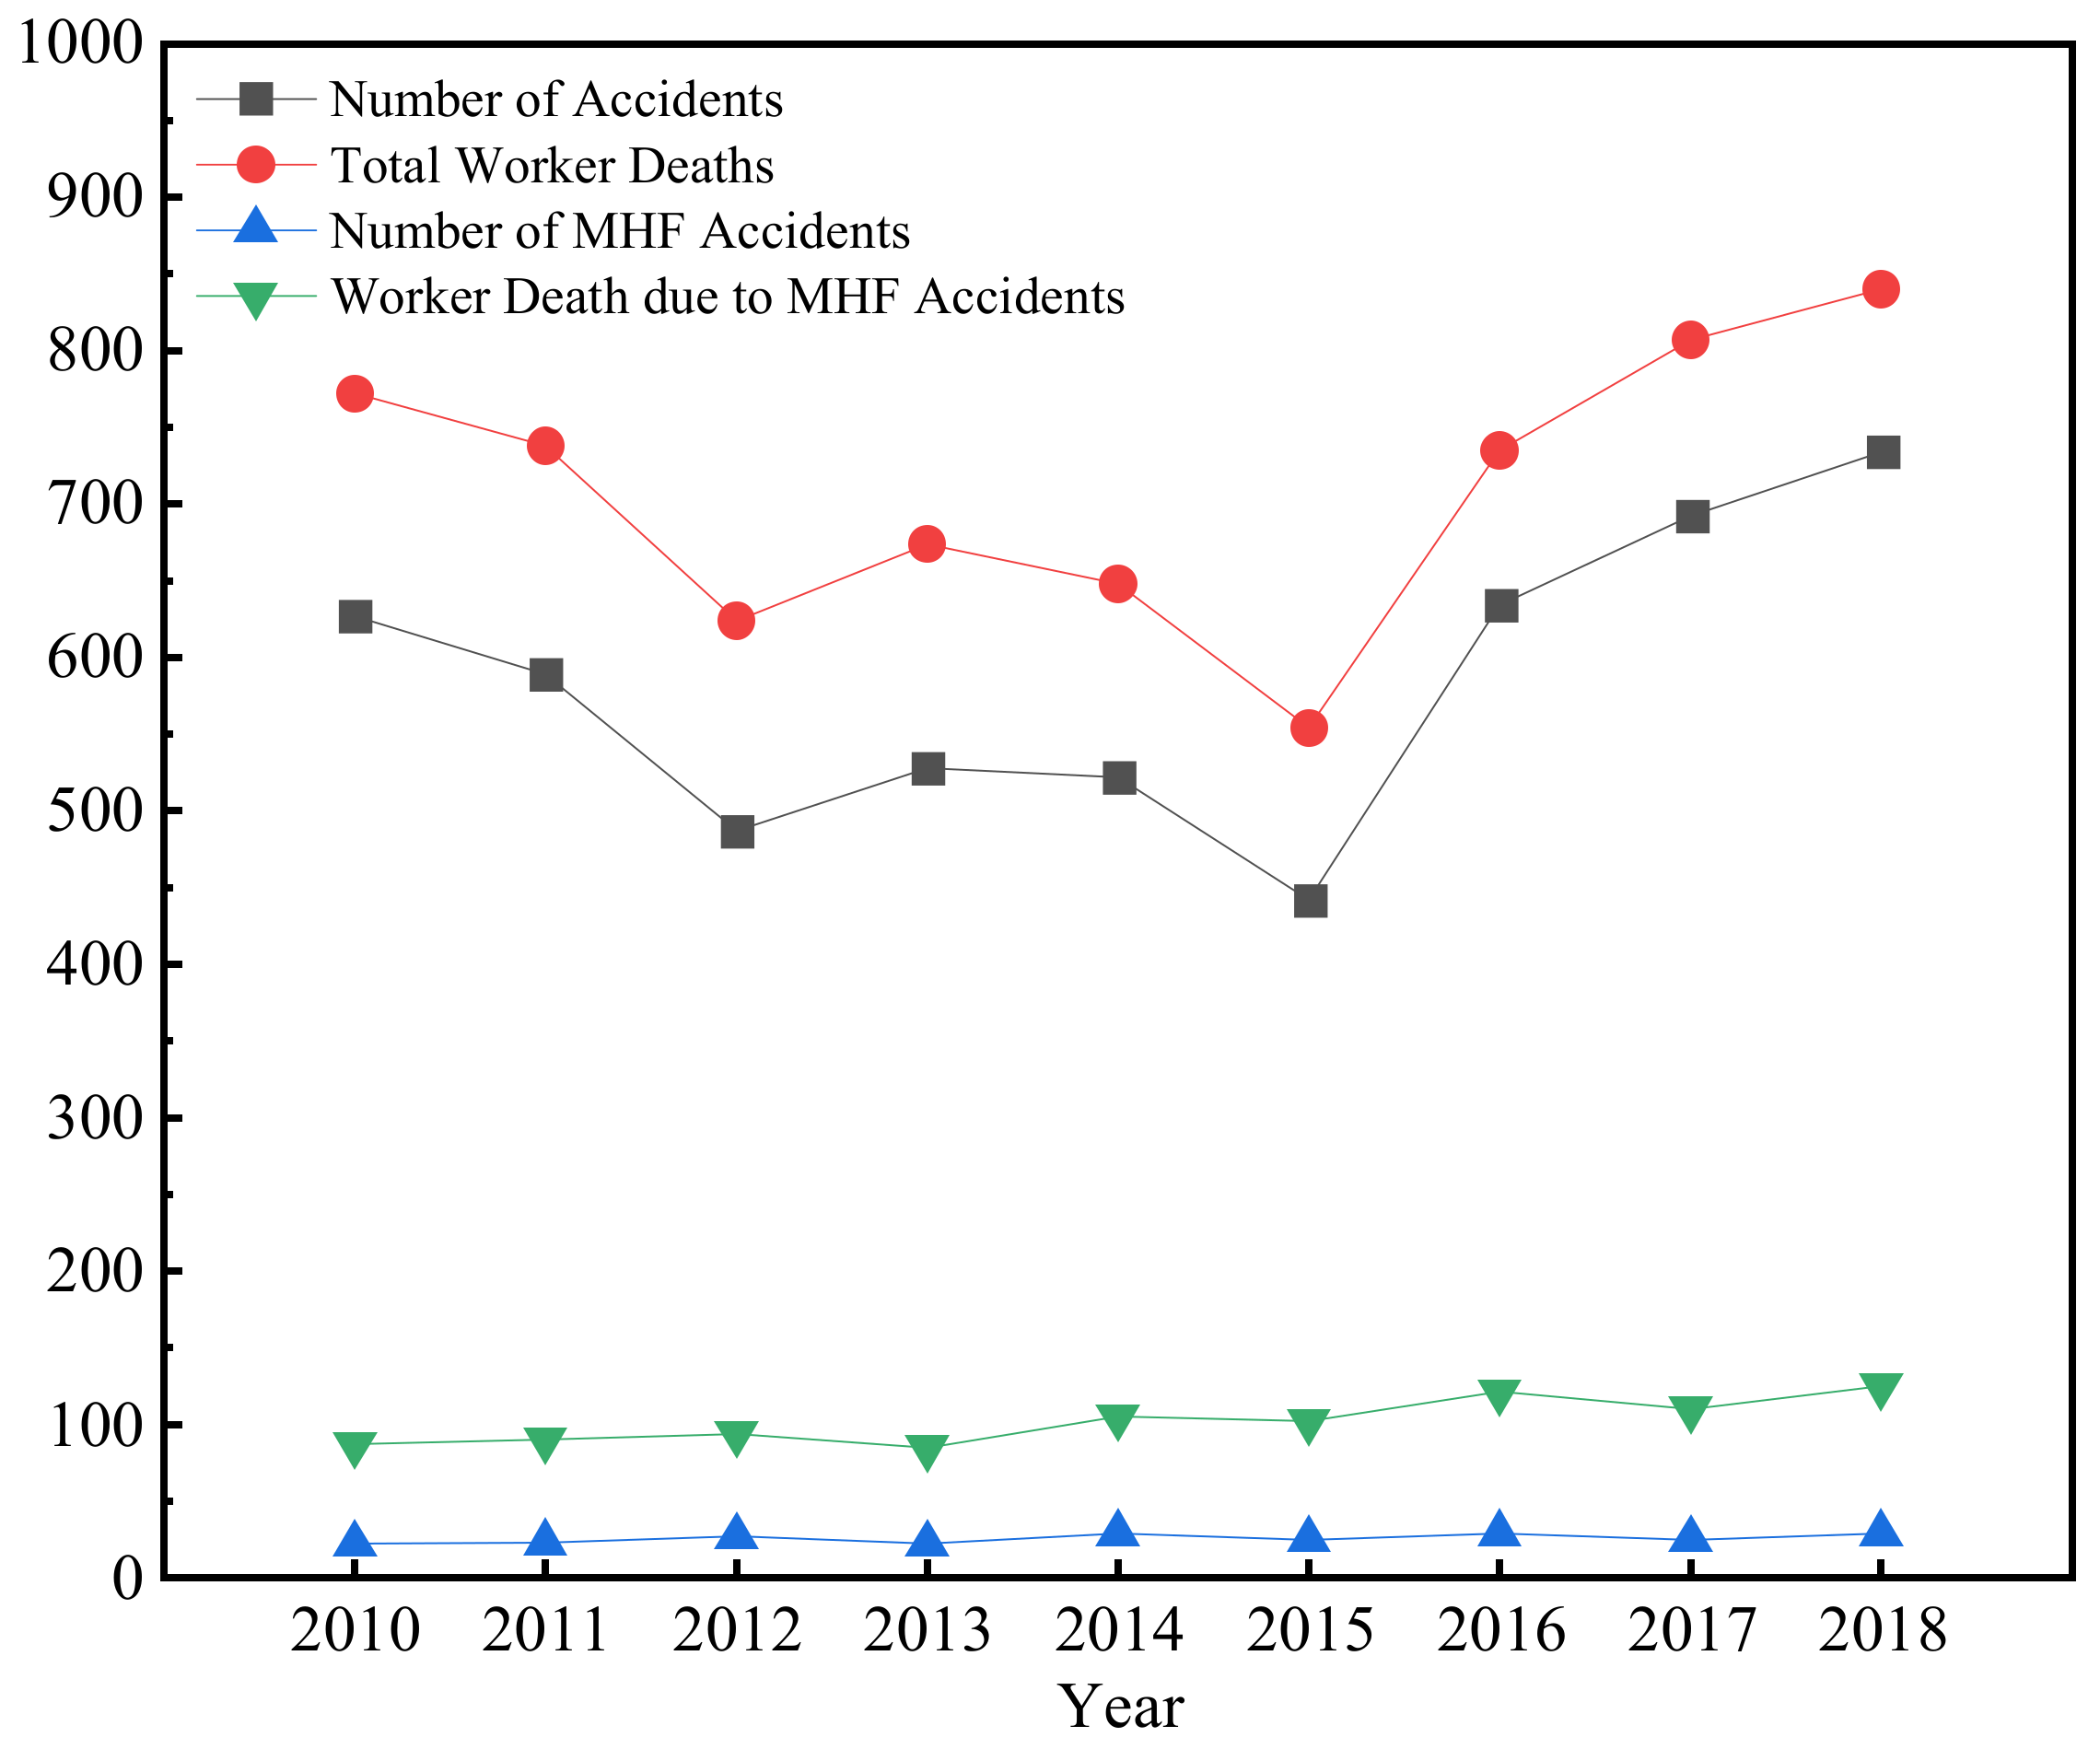
3.1. Descriptive Analysis

Data from the annual construction accident report in MOHURD [11] suggest that the number of building and civil construction accidents decreased during the period from 2010 to 2015 and increased during the period from 2015 to 2018 (see Figure 1). The fewest accidents were 442 in 2015. The corresponding worker deaths exhibited the same pattern. The State Council of the People’s Republic of China categorizes four levels of accidents based on the number of fatalities per accident [26]. Accidents that result in less than three worker deaths are regarded as low. These levels rise with the increased number of fatalities to medium (3–10), high (10–30) and very high (30+). In the following sections, moderate- to high-fatality (MHF) accidents refer to accidents that result in no fewer than three worker deaths (medium, high and very high number of fatalities). Therefore, the number of worker deaths is greater than that of construction accidents annually in Figure 1 due to the occurrences of multiple fatalities associated with the MHF accidents.
Change in construction industry gross domestic product (GDP) in China is a primary factor leading to patterns of construction accidents in Figure 1. China’s construction industry has played an important role in the process of the country’s economic growth and is a major contributor to China’s GDP. According to the annual China Statistic Yearbooks (for example, [22]), the construction industry increased its contribution to GDP from 3.8% in 1978 to 6.9% in 2018, and 7.2% of China’s workforce were construction workers in 2018. Figure 2 displays the number of construction accidents and construction industry GDP in China during the period from 2010 to 2018. Note that the dip in the number of building and civil construction accidents in Figure 2 is due to the decrease in the growth rate of construction industry GDP during the period from 2010 to 2015 (2.29% in 2015). Therefore, lower construction activity in 2015 resulted in fewer accidents. Then, from 2015 to 2018, construction accidents began to increase. The dip in construction accidents can also be explained by the change in the total number of construction contracts and building construction areas (see Figure 2). Both lines also exhibit the same pattern as the number of construction accidents. The above-mentioned information establishes a relationship between cost, investment, profit and safety within the construction industry. The period from 2011 to 2015 was the 12th Five-Year Plan of China, during which China expected a shift to a consumption-driven economy [27]. Therefore, China’s economic structure was adjusted, and the development model changed from 2010 to 2015, leading to the deceleration of the construction industry. In this case, the number of construction accidents decreased as well.
Construction industry profit improved after 2015 and construction accidents accordingly increased during that period. Additionally, MOHURD published a notification to local authorities prohibiting delay in reporting or concealment of construction accidents in 2015 [28], which also contributed to the increase in accidents after 2015. Number of construction employees increased every year except for 2011 (for example, [22]). Despite the increased number of workers, a decrease in construction accidents indicates that safety improved during that period. Therefore, a combination of economic conditions and safety measures could explain the construction accident change.
Figure 3 illustrates total number of construction accidents (during the period from 2010 to 2018) among 31 regions in China (excluding Hong Kong, Macao and Taiwan). Regions with higher GDP, such as Jiangsu Province, Zhejiang Province and Guangdong Province, have the most accidents. Additionally, relatively underdeveloped regions such as Shanxi Province, Ningxia Province and Tibet Autonomous Region have the fewest accidents. Figure 4 depicts a scatter plot between the total construction accident number and the total construction industry GDP of different regions, from which a positive linear relationship can be observed. The Pearson’s Correlation Coefficient of 0.777 (−1 to +1 range) indicates that there is a high positive correlation between these two indices [24].
Regarding accident causations, approximately 51.6% of total construction accidents were due to “falls”, 13.8% were “struck by objects”, 12.46% were “struck by objects” and 12.46% were “collapsed structures”. “Falls” are China’s predominant cause of construction accidents (the same as for many other parts of the world) [6,15,18].

3.2. Time Distribution of Construction Accidents

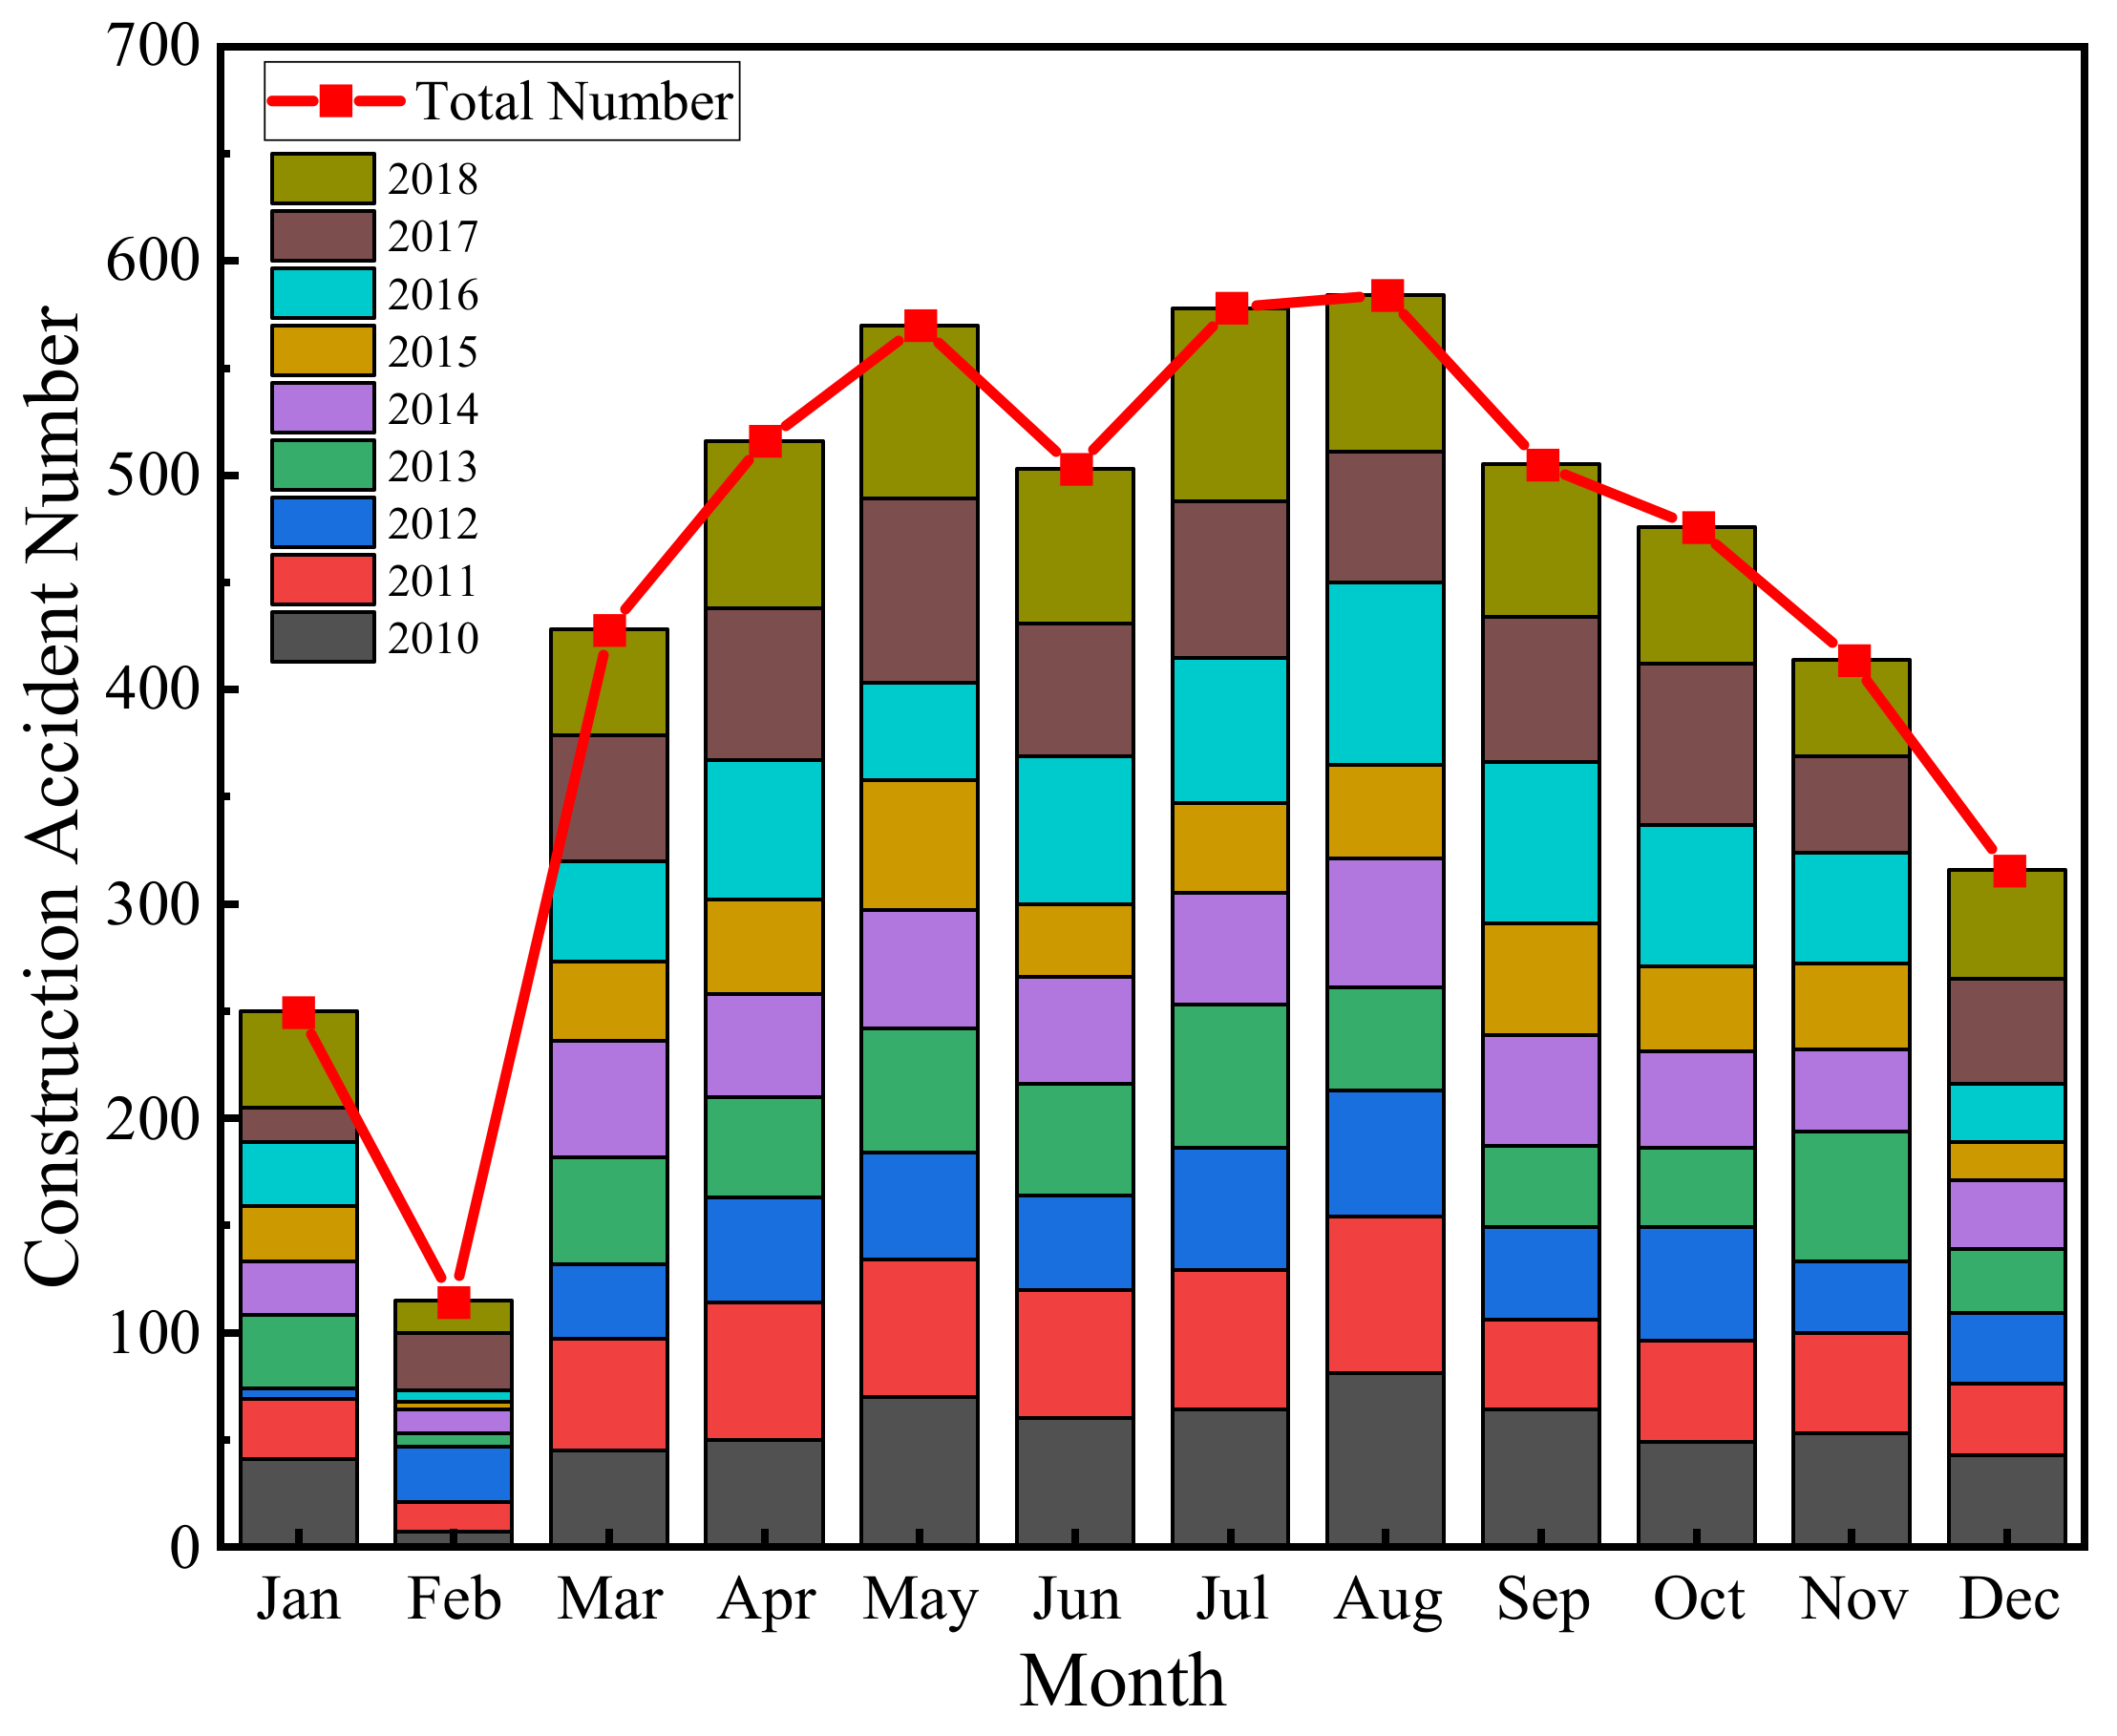
3.2.1. Construction Accident Number per Month

Figure 5 depicts the number of construction accidents per month from 2010 to 2018. A similar change of accident number in each month within every year can be observed. ANOVA was employed to test if there is a correlation between number of construction accidents and the month in which they occur. Two hypotheses (not significant and significant) were established and data in Figure 5 were tabulated into 12 groups by month of the year. The significance value from the ANOVA table is 0.000 (<0.05), suggesting there is a significant diversity between construction accident number in different months. Therefore, correlation between these two variables was identified.
The most frequent occurrences of construction accidents take place in May and from July to August, and the least from January to February (see Figure 5). The Chinese New Year is in February during this period and most construction workers are on vacation. Therefore, the number of accidents in February is less than the other months. In March, as construction workers return to work, the number of accidents starts to increase. Although this number reaches a peak in May, it decreases in June. Two reasons could account for this as follows: first, an activity known as Safety Production Month of China is held by MOHURD in June every year. During this month, construction companies conduct safety training programs for workers and construction managers; this will improve safety aspects during construction operations. Second, most labor forces in the construction industry are from rural areas owing to urbanization in China [29,30,31], and most workers return home to engage in farming activities in June, which is the summer harvest in China. In July and August, to prevent potential delay caused by the summer harvest, managers may add workloads to workers [31]. Thus, construction workers will work overtime or extended hours. However, in July and August, during the summer season, bad weather including high temperatures and heavy rain (especially in south regions) may cause poor working conditions for construction and increase work intensity for construction workers. In this case, there is a negative impact on the physical and mental state of workers [32,33]. Thus, accident number reaches another peak in July and August. In autumn, i.e., in September and October, the weather becomes moderate, leading to a weakening of thermal impact on construction workers. Additionally, after the completion of construction projects, several construction activities cease, and a decrease in construction accident number is observed owing to combination of these two facts. In November and December, the weather starts to become colder. Winter construction is difficult, especially for construction involving concrete. Some construction companies in China’s northern regions begin to stop working, and others work indoors. At this time, most construction jobs are related to lighter work, such as wall plastering and ceiling work, leading to a decrease in construction accidents.

3.2.2. Construction Accident Number per Day of Week

Correlation between the number of accidents and the day of the week was tested using ANOVA using data for accidents per day of the week. To establish correlation between day of the week and the number of accidents, accident data were tabulated into seven groups by day of the week. ANOVA testing was performed to establish the significance of the day of week as a factor of time to the number of construction accidents. However, a significant value of 0.767 (greater than 0.05) was obtained, indicating that there is no correlation between the day of week and the number of accidents. Figure 6 shows a scatter plot between day of week and construction accident number, in which points are distributed discretely and there is no linear correlation between the two variables.
Although previous studies have proposed a theory of “Monday effect” in which more occupational accidents occur on Monday since it is hard for workers to pay attention to hazard in work on the first day after finishing weekend breaks [34], a different result based on collected data was found. This may be explained by the working habits of construction workers. Generally, some construction workers in China may work on weekends because current construction activities in China still rely on manual labor. According to annual reports of the National Bureau of Statistics (for example [35]), the average working days per month for rural migrant workers are approximately 25.2 (more than 20) during the period from 2013 to 2016. Interviews that were conducted with ten construction employees who worked in construction companies in different regions in China revealed that these construction companies allow their workers to work seven days per week. Furthermore, the daily workload for them is constant. These working conditions might have affected their behavior, where they would have been exhausted and losing focus on the safety aspects of construction operations. This might have led to the occurrence of construction accidents on any day of the week. Therefore, no correlation is observed between the day of week and the number of accidents, and there is no significant day of the week that points to a higher risk for construction accidents.

3.2.3. Construction Accident Number per Hour of Day

The final step in this section is to identify the correlation between the hour of day and the number of accidents. Figure 7 displays number of construction accidents by hour. Time of accident for each year was divided into 24 groups, in which each group contained the same hours (from 0 to 23). The outcome of ANOVA yields a rejection of hypothesis that diversity between construction accident number among different months is not significant. Therefore, a strong correlation between construction accident number and the hour of day is identified. A double-hump distribution with 12 o’clock axis of symmetry is obtained in Figure 7, and most accidents took place from 7 AM to 10 AM and 2 PM to 5 PM. In China, construction workers start working at 7 AM and continue with their work until noon. Accidents happened frequently during this time period, reaching a peak at around 10 AM. Then they had a one-hour lunch break. At 1 PM, when the temperature is the highest in the day, workers returned to work. In the afternoon, most accidents occurred from 2 PM to 5 PM, reaching their peak at around 3 PM. Most workers finish working at 6 PM, leaving only a few workers on duty at night. The number of accidents is low during nighttime and nearly zero around midnight.
Note that an abnormally high number of accidents were reported between 0:00 to 0:59 AM, as evidenced in Figure 7. Only the year 2012 saw a high number of accidents occurring at midnight (marked with rectangular box), accounting for more than 50% of the total accidents at that time from 2012 to 2018. The number of accidents in the evening (5 PM to 11 PM) and midnight (1 AM to 5 AM) hours are low. Therefore, this high number can be regarded as a virtual peak which is attributed to the fact of false reporting or concealed reporting of accidents [36]. Frequently, when a construction worker dies because of an accident, some construction managers would first contact their family and pay them to compensate for their loss. If the family was satisfied with the amount of compensation for the loss, this accident would be concealed. Although the Chinese government requires that the accident should be reported to local government within one hour [37], some construction managers did not report accidents in order to avoid penalty. However, if they failed to reach a settlement with the worker’s family, they were required to report the accident to local government, which delayed the report for several days after the accident. By then, no witnesses remembered the accurate time of the accident and simply picked 0:00 as the time of death in the report, leading to the virtual peak at midnight.

3.3. Regional Distribution of Construction Accidents

3.3.1. Indices

In this section, a construction safety performance evaluation index system is introduced with six indices: accident number (X1), worker deaths (X2), death rate per 1,000,000 m2 (X3), death rate per 100,000,000 yuan (X4), death rate per 100,000 employees (X5) and moderate- to high-fatality (MHF) accident rate (X6).
Note that the first and second indices are the two intuitive indices from MOHURD as a foundation for the others. According to requirement regarding occupational safety work of Chinese government, death rate per million tons is an index for safety evaluation in the coal mining industry [38]. Similarly, death rate per 100,000 m2 describes a relationship between worker deaths and workload in the construction industry, which have been used in past studies. Death rate per 100,000,000 yuan (approximately USD 15 million) and death rate per 100,000 employees are indices for occupational fatal accidents suggested by the Chinese government [38]. MHF accident rate is also considered in this study since it reveals the damage level to the construction industry owing to its higher fatality level characteristics. In the U.S., the commonly used index is hour-based rates. According to the U.S. Bureau of Labor Statistics [39], hour-based rates measure fatal injury risk per standardized length of exposure and are generally considered more accurate than employment-based rates. For example, fatal injury rate per 100,000 full-time workers is a typical rate used in the U.S. However, working-hour data in China is not currently available. Therefore, the hour-based rate will not be used in this system and a construction accident evaluation index system was built based on six indices described above.

3.3.2. Construction Safety Performance Evaluation

Values of each of the six indices for 31 regions in China (excluding Hong Kong, Macao and Taiwan) were compiled and tabulated in Table 2.
Data from Table 2 is employed in the SPSS program to implement the factor analysis. The KMO (Kaiser–Meyer–Olkin) test for sampling adequacy reveals a value of 0.623, which is higher than 0.500, indicating that there are sufficient partial correlations among these variables. The independence of these variables (indices) was rejected, leading to sufficient correlations among them. On this condition, these six variables satisfy the requirements of factor analysis. Principal component analysis (PCA) (one method to extract the factors) was performed in this study to reduce the dimensionality of a large data set of variables to a smaller one that still contains the practical information of the original data set. Two factors are extracted from the six indices in the index system. The rotation sums of the squared loadings approach were employed to establish the contribution rate of a factor to other principal components. The variance contribution rate of the first factor (F1) to all others is 48.735% while the rate of the second factor (F2) is 39.053%. Cumulative variance contribution rate of these two factors yields 87.788% (more than 80%), which means they are sufficient to describe the construction accidents of the 31 regions in China.
A subsequent analysis involves the evaluation of construction accidents in 31 regions in China. A prediction model for the first factor is shown as follows:
F 1 = 0.020 X 1 0.045 X 2 + 0.330 X 3 + 0.343 X 4 + 0.344 X 5 0.178 X 6
where F1 is the response variable that represents the impact score of the first factor and X16 are the dependent variables representing the six components. The equation for the second factor yields:
F 2 = 0.396 X 1 + 0.378 X 2 + 0.031 X 3 + 0.061 X 4 + 0.019 X 5 0.369 X 6
where F2 is the response variable that represents the impact score of the second factor and X16 are the dependent variables representing the six components. The equation of final impact score was created based on variance contribution rates of these two factors, which yielded the following:
F = 45.729 45.729 + 39.256 × F 1 + 39.256 45.729 + 39.256 × F 2
After substituting index values of each region into the equations the final score results were obtained and tabulated in Table 3. A score map displayed in Figure 8 was created to visualize the result, which shows Qinghai, Hainan and Heilongjiang as provinces have the highest scores. Since all these indices are reversed, construction accidents in places with higher scores are the worst. One can see that from all the regions in China, these three provinces call for immediate attention to improve construction-related safety issues. This construction safety evaluation score can serve as a reference for stakeholders to assess risk of construction in different regions in China.
Table 3 shows that Qinghai Province ranked first in construction accidents in the period from 2010 to 2018. Thus, in this paper, construction practices in this province are elaborated upon. The construction industry in this province mostly involved residential and infrastructure construction. The annual China Building Industry Yearbook (for example, [40]) suggested that affordable housing under construction increased steadily every year during the period from 2010 to 2016. Approximately 55% of accidents happened in this building category involving local construction companies.
Geographically, Qinghai Province is located in a higher-elevation region with lower oxygen levels and lower temperatures. Such conditions may have an influence on the performance of labor and equipment. Specifically, the altitude stress may have affected the physical and mental state of workers and thus decreased productivity. In these conditions, the likelihood of accidents is increased [41,42]. Additionally, the capacity and productivity of engine/equipment is decreased at high altitudes because of inadequate combustion [43]. Lack of management and technical skills are also important issues for Qinghai Province. For example, the China Building Industry Yearbook reported that there were 144,900 employees in Qinghai Province in 2016, but only 16,500 (11.4%) possessed technician skill level [40]. Qinghai is an underdeveloped province where transportation is often an issue because of high altitude. Therefore, it is difficult to attract skilled managers and technicians to work there. The main force of construction workers in Qinghai Province is migrant workers from rural areas who often encounter management issues. For example, workers are likely to ignore contractual obligations, and the labor relation between workers and management is loose [44], which will contribute to the cause of accidents. Such a loose labor relation allows companies to save money on insurance and safety training, especially combined with the absence of contracts with workers. Migrant workers in Qinghai Province tend not to be controlled by the company by not signing a contract with the company so they would have more freedom of mobility. The problem is that when an accident occurred, workers would not have financial and medical support.

4. Discussion

In this study, ANOVA analysis revealed the time distribution of construction accidents in China. From time distribution results, a problem of poor construction environment management was revealed. Specifically, natural conditions such as exceedingly high temperatures and heavy rain in summer increased construction accident numbers significantly. Increased workloads led to exhaustion of construction workers, which in turn contributed to a higher risk of construction accidents. Since there are interactive relationships between person, environment and behavior [45], providing a safe environment is necessary to ensure the safe behavior of construction workers. A safety plan developed by carefully examining project activities and preventing associated hazards is a tool for facilitating such a task [46]. For example, regular inspections and audits to identify hazards, reduction of workload for workers when natural condition is poor and avoidance of overtime works. Additionally, no evidence existed to support any day of the week being more dangerous than any other days, which is not consistent with the “Monday effect” theory [34]. However, the finding was built on existing data and similar results that workers may work continuously can also be found in the past study [31]. An improved labor manage plan should be conducted; for example, scheduling an adequate number of workers on construction sites during high workload hours. For accident number per hour, the virtual peak of accidents at midnight revealed cases in which some construction managers concealed the accidents and did not immediately report them to the local authority [36]. In this case, polices regarding monitor of accidents reporting should be generated by the Chinese government to prompt construction companies to improve safety management. Questionary [46,47] would be a good method for supervision and inspection of safety situations on site.
A mathematical modeling based on factor analysis, which is the construction safety evaluation score equation, was developed to illustrate regional distribution of construction accidents in China. Qinghai Province ranked the worst in construction safety because of hazards of construction in high-altitude regions [41,42,43]. The low education/skill level of construction workers in Qinghai Province also contributed to the bad safety performance since the workers may ignore contractual obligations and exhibit lack of safety awareness. When construction workers become more aware of their responsibilities for hazard prevention, they will exhibit more interest in maintaining a safe and healthy work site [47]. Thus, construction safety and health training for construction workers should be conducted to improve construction safety in Qinghai Province [48,49]. Virtual and Augmented Reality (VR/AR) have been suggested by past studies [50,51] for such a training. Through creating forgiving environments for visualizing complex workplace situations, building up risk-preventive knowledge and undergoing training, hazard perception skills of construction workers will be improved. For example, VR/AR can be introduced in Qinghai Province to stimulate natural working conditions for construction workers to enhance their cognitive abilities, such as decision-making, attention, reaction time, contrast sensitivity and visual pursuit [52]. Since traditional measurement of safety is after-the-fact measurement, which means evaluations always took place after the fatal or injured accidents occurred, it has the problem of lagging indicators [46,53]. Therefore, this modeling is able to reflect current construction safety situation among different regions in China, which will serve as a reference for the government to create regulations to prevent demonstrated hazards in the future. Additionally, this model will exhibit economic benefit for stakeholders such as the owner and construction manager. They can increase investment and carry out construction activities in regions with higher construction safety to reduce the likelihood of financial loss because of construction accidents. Finally, researchers in other nations can use this model to explore native construction safety situations to help reduce accidents.
Based on the analysis above, suggestions for the government to improve construction safety in China are as follows: first, increase supervision of construction companies lacking a contractual agreement between workers and companies and mandatory reporting of accidents. Second, instead of merely introducing Safety Production Month activity in June, the government should consider conducting safety production activities more frequently and encourage enterprises to improve the safety awareness of construction workers, especially during time intervals with bad weather conditions and high workloads. Finally, the government should consider creating policies to attract technicians to work in the construction industry (for example, increased salary, rental allowance or education for migrants’ children), especially in underdeveloped regions such as Qinghai, and to improve the safety and health of construction employees and their families.
For China’s construction companies: first, generation of a safe plan to indicate hazards on site to mitigate construction risks. Second, implementation of a labor management plan, especially with respect to the deadliest time intervals during extreme weather conditions and high workload periods. Finally, improvement of their competitiveness by enhancing their technology and incorporating advanced construction equipment to overcome local environmental and climate issues (for example, higher elevation in Qinghai Province).

5. Conclusions

Construction jobs remained one of the most hazardous occupations. This study revealed time distribution and regional distribution of construction accidents in China based on fatal construction accidents. Close correlation between construction industry GDP in China and construction accidents is also observed. A mathematical modeling based on factor analysis, which is the construction safety evaluation score equation, is built to serve as a reference for suggestions regarding improvement of construction safety in China.

Author Contributions

Conceptualization, Q.M. and J.W.L.; methodology, Q.M.; software, Q.M.; validation, Q.M., F.H.T., M.E.P. and H.M.A.; formal analysis, Q.M.; investigation, Q.M.; resources, Q.M.; data curation, Q.M.; writing—original draft preparation, Q.M.; writing—review and editing, J.W.L. and F.H.T.; visualization, Q.M.; supervision, J.D.C.; project administration, F.H.T. All authors have read and agreed to the published version of the manuscript.

Funding

This research received no external funding.

Institutional Review Board Statement

Not applicable.

Informed Consent Statement

Not applicable.

Data Availability Statement

Data used in this study are available within this article.

Acknowledgments

The authors wish to acknowledge Jianwei Zang and many other construction employees from numerous construction companies in China, whose comments have contributed greatly to the study in this paper. Participants of the weekly seminars in the construction program at The Ohio State University, Fei Yang, Omar Algonaian, Yanting Chen, Guowei Du, Taylor Cooper and Aziz Al-Zugair provided valuable comments and suggestions for this study.

Conflicts of Interest

The authors declare no conflict of interest.

References

  1. Perttula, P.; Korhonen, P.; Lehtelä, J.; Rasa, P.; Kitinoja, J.; Mäkimattila, S.; Leskinen, T. Improving the safety and efficiency of materials transfer at a construction site by using an elevator. J. Constr. Eng. Manag. 2006, 132, 836–843. [Google Scholar] [CrossRef]
  2. Ye, G.; Jin, Z.; Xia, B.; Skitmore, M. Analyzing causes for reworks in construction projects in China. J. Manag. Eng. 2015, 31, 04014097. [Google Scholar] [CrossRef]
  3. National Bureau of Statistics of China. China Labor Statistical Yearbook; China Statistics Press: Beijing, China, 2019. (In Chinese)
  4. Tam, C.M.; Zeng, S.X.; Deng, Z.M. Identifying elements of poor construction safety management in China. J. Saf. Res. 2004, 42, 569–586. [Google Scholar] [CrossRef]
  5. Zhang, J.; Zhang, W.; Xu, P.; Chen, N. Applicability of accident analysis methods to Chinese construction accidents. J. Saf. Res. 2019, 68, 187–196. [Google Scholar] [CrossRef] [PubMed]
  6. Al-Humaidi, H.M.; Tan, F.H. Construction safety in Kuwait. J. Perform. Constr. Facil. 2010, 24, 70–77. [Google Scholar] [CrossRef]
  7. Siu, M.F.; Leung, W.J.; Chan, W.D. A data-driven approach to identify-quantify-analyse construction risk for Hong Kong NEC projects. J. Civ. Eng. Manag. 2018, 24, 592–606. [Google Scholar] [CrossRef]
  8. Liao, C.; Perng, Y. Data mining for occupational injuries in Taiwan construction industry. Saf. Sci. 2008, 46, 1091–1102. [Google Scholar] [CrossRef]
  9. Liu, Q.; Xu, N.; Jiang, H.; Wang, S. Psychological driving mechanism of safety citizenship behaviors of construction workers: Application of the theory of planned behavior and norm activation model. J. Constr. Eng. Manag. 2020, 146, 04020027. [Google Scholar] [CrossRef]
  10. Kang, K.; Ryu, H. Predicting types of occupational accidents at construction sites in Korea using random forest model. Saf. Sci. 2019, 120, 226–236. [Google Scholar] [CrossRef]
  11. Document Library in Ministry of Housing and Urban-Rural Development of People’s Republic of China. Available online: https://www.mohurd.gov.cn/document/file (accessed on 27 December 2021).
  12. Kvaløy, J.T.; Aven, T. An alternative approach to trend analysis in accident data. Reliab. Eng. Syst. Saf. 2005, 90, 75–82. [Google Scholar] [CrossRef]
  13. Duan, W.; Congress, S.S.C.; Cai, G.; Liu, S.; Dong, X.; Chen, R.; Liu, X. A hybrid GMDH neural network and logistic regression framework for state parameter–based liquefaction evaluation. Can. Geotech. J. 2021, 99, 1801–1811. [Google Scholar] [CrossRef]
  14. Zhao, Z.; Duan, W.; Cai, G. A novel PSO-KELM based soil liquefaction potential evaluation system using CPT and Vs measurements. Soil Dyn. Earthq. Eng. 2021, 150, 106930. [Google Scholar] [CrossRef]
  15. Im, H.; Kwon, Y.; Kim, S.; Kim, Y.; Ju, Y.; Lee, H. The characteristics of fatal occupational injuries in Korea’s construction industry, 1997–2004. Saf. Sci. 2009, 47, 1159–1162. [Google Scholar] [CrossRef]
  16. Cheng, C.; Leu, S.; Lin, C.; Fan, C. Characteristic analysis of occupational accidents at small construction enterprises. Saf. Sci. 2010, 48, 698–707. [Google Scholar] [CrossRef]
  17. Wanberg, J.; Harper, C.; Hallowell, M.; Rajendran, S. Relationship between construction safety and quality performance. J. Constr. Eng. Manag. 2013, 139, 04013003. [Google Scholar] [CrossRef] [Green Version]
  18. Winge, S.; Albrechtsen, E. Accident types and barrier failures in the construction industry. Saf. Sci. 2018, 105, 158–166. [Google Scholar] [CrossRef]
  19. Guo, S.; He, J.; Li, J.; Tang, B. Exploring the impact of unsafe behaviors on building construction accidents using a Bayesian Network. Int. J. Environ. Res. Public Health 2020, 17, 221. [Google Scholar] [CrossRef] [Green Version]
  20. Xu, N.; Ma, L.; Liu, Q.; Wang, L.; Deng, Y. An improved text mining approach to extract safety risk factors from construction accident reports. Saf. Sci. 2021, 138, 105216. [Google Scholar] [CrossRef]
  21. Construction Engineering Information of Henan Province. Available online: http://www.hngcjs.cn/shigu/ (accessed on 15 August 2021).
  22. National Bureau of Statistics of China. China Statistical Yearbook; China Statistics Press: Beijing, China, 2011. (In Chinese)
  23. Work Safety Commission Office of State Council of China. A Reply to Questions Concerning the Scope of Building and Civil Construction in the 2006 Production Safety Control Index; No. 45; Work Safety Commission Office of State Council of China: Beijing, China, 2006. (In Chinese)
  24. DeGroot, M.H.; Schervish, M.J. Probability and Statistics, 4th ed.; Pearson Education: Boston, MA, USA, 2012; pp. 251, 754–761; [Google Scholar]
  25. Kim, J.; Mueller, C.W. Introduction to Factor Analysis; SAGE Publications Inc.: Beverly Hills, CA, USA, 1978; pp. 9, 57. [Google Scholar]
  26. The State Council of People’s Republic of China. Production Accident Report and Investigation and Handling Regulations; No. 493; The State Council of People’s Republic of China: Beijing, China, 2007. (In Chinese)
  27. Casey, J.; Koleski, K. Backgrounder: China’s 12th Five-Year Plan; US-China Economic and Security Review Commission: Washington, DC, USA, 2011.
  28. Ministry of Housing and Urban-Rural Development of People’s Republic of China. A Notification Regarding Further Improvement on Reporting Building and Civil Engineering Construction Accidents; No. 23; Ministry of Housing and Urban-Rural Development of People’s Republic of China: Beijing, China, 2015. (In Chinese)
  29. Fang, D.P.; Xie, F.; Huang, X.Y.; Li, H. Factor analysis-based studies on construction workplace safety management in China. Int. J. Proj. Manag. 2004, 22, 43–49. [Google Scholar] [CrossRef]
  30. Fan, J.; Zhang, Y.; Wang, B. The impact of urbanization on residential energy consumption in China: An aggregated and disaggregated analysis. Renew. Sustain. Energy Rev. 2017, 75, 220–233. [Google Scholar] [CrossRef]
  31. Liu, Y.; Jarvamardi, A.; Zhang, Y.; Liu, M.; Hsiang, S.M.; Yang, S.; Yu, X.; Jiang, Z. Comparative study on perception of causes for construction task delay in China and the United States. J. Constr. Eng. Manag. 2021, 147, 04020176. [Google Scholar] [CrossRef]
  32. Yasmeen, S.; Liu, H.; Wu, Y.; Li, B. Physiological responses of acclimatized construction workers during different work patterns in a hot and humid subtropical area of China. J. Build. Eng. 2020, 30, 101281. [Google Scholar] [CrossRef]
  33. Fang, Z.; Tang, T.; Zheng, Z.; Zhou, X.; Liu, W.; Zhang, Y. Thermal responses of workers during summer: An outdoor investigation of construction sites in South China. Sustain. Cities Soc. 2021, 66, 102705. [Google Scholar] [CrossRef]
  34. Barlas, B. Shipyard fatalities in Turkey. Saf. Sci. 2012, 50, 1247–1252. [Google Scholar] [CrossRef]
  35. National Bureau of Statistics of the People’s Republic of China. Monitoring Survey Report of Rural Migrant Workers in 2016. 2017. Available online: http://www.stats.gov.cn/tjsj/zxfb/201704/t20170428_1489334.html (accessed on 10 January 2022). (In Chinese)
  36. Shao, B.; Hu, Z.; Liu, Q.; Chen, S.; He, W. Fatal accident patterns of building construction activities in China. Saf. Sci. 2019, 111, 253–263. [Google Scholar] [CrossRef]
  37. Ministry of Emergency Management of the People’s Republic of China. Production Safety Accident Report and Investigation and Handling Regulations. 2007. Available online: https://www.mem.gov.cn/gk/gwgg/agwzlfl/zjl_01/200704/t20070420_233735.shtml (accessed on 11 January 2022). (In Chinese)
  38. State Council of People’s Republic of China. Decision Regarding Further Improvement on Safety Production Work. 2008. Available online: http://www.gov.cn/zhengce/content/2008-03/28/content_4437.htm (accessed on 12 January 2022). (In Chinese)
  39. U.S. Bureau of Labor Statistics. Census of Fatal Occupational Injuries—Hours-Based Rates; U.S. Bureau of Labor Statistics: Washington, DC, USA, 2020.
  40. China Construction Industry Association. China Building Industry Yearbook; China Building Industry Year-Book Journal Limited Company: Beijing, China, 2017. (In Chinese) [Google Scholar]
  41. Huey, R.B.; Eguskitza, X. Limits of human performance: Elevated risks on high mountains. J. Exp. Biol. 2001, 204, 3115–3119. [Google Scholar] [CrossRef] [PubMed]
  42. Schoene, R.B. Limits of human lung function at high altitude. J. Exp. Biol. 2001, 204, 3121–3127. [Google Scholar] [CrossRef]
  43. Shannak, B.A.; Alhasan, M. Effect of atmospheric altitude on engine performance. Forsch. Ing. 2002, 67, 157–160. [Google Scholar] [CrossRef]
  44. Ling, F.Y.Y.; Dulaimi, M.F.; Chua, M. Strategies for managing migrant construction workers from China, India, and the Philippines. J. Prof. Issues Eng. Educ. Pract. 2013, 139, 19–26. [Google Scholar] [CrossRef] [Green Version]
  45. Cooper, M.D. Towards a model of safety culture. Saf. Sci. 2000, 36, 111–136. [Google Scholar] [CrossRef]
  46. Choudhry, R.M.; Fang, D.; Mohamed, S. Developing a model of construction safety culture. J. Manag. Eng. 2007, 23, 207–212. [Google Scholar] [CrossRef]
  47. Yiu, N.S.; Chan, D.W.; Shan, M.; Sze, N.N. Implementation of safety management system in managing construction projects: Benefits and obstacles. Saf. Sci. 2019, 117, 23–32. [Google Scholar] [CrossRef]
  48. Choudhry, R.M.; Fang, D.; Mohamed, S. The nature of safety culture: A survey of the state-of-the-art. Saf. Sci. 2007, 45, 993–1012. [Google Scholar] [CrossRef]
  49. Akinlolu, M.; Haupt, T.C.; Edwards, D.J.; Simpeh, F. A bibliometric review of the status and emerging research trends in construction safety management technologies. Int. J. Constr. Manag. 2020, 23, 1–13. [Google Scholar] [CrossRef]
  50. Sacks, R.; Perlman, A.; Barak, R. Construction safety training using immersive virtual reality. Constr. Manag. Econ. 2013, 31, 1005–1017. [Google Scholar] [CrossRef]
  51. Li, X.; Yi, W.; Chi, H.L.; Wang, X.; Chan, A.P. A critical review of virtual and augmented reality (VR/AR) applications in construction safety. Autom. Constr. 2018, 86, 150–162. [Google Scholar] [CrossRef]
  52. Horswill, M.S.; Marrington, S.A.; McCullough, C.M.; Wood, J.; Pachana, N.A.; McWilliam, J.; Raikos, M.K. The hazard perception ability of older drivers. J. Gerontol. Ser. B Psychol. Sci. Soc. Sci. 2008, 63, 212–218. [Google Scholar] [CrossRef] [Green Version]
  53. Carder, B.; Ragan, P.W. A survey-based system for safety measurement and improvement. J. Saf. Res. 2003, 34, 157–165. [Google Scholar] [CrossRef]
Figure 1. Building and civil construction accidents.
Applsci 12 05054 g001
Figure 2. Comparison between number of accidents and other indices.
Applsci 12 05054 g002
Figure 3. Total construction accidents in 31 regions of China.
Applsci 12 05054 g003
Figure 4. Scatter plot of construction accidents and construction industry GDP.
Applsci 12 05054 g004
Figure 5. Number of construction accidents per month.
Applsci 12 05054 g005
Figure 6. Scatter plot between day of week and construction accident number.
Applsci 12 05054 g006
Figure 7. Number of construction accidents per hour of day.
Applsci 12 05054 g007
Figure 8. Construction accident evaluation score of 31 regions in China.
Applsci 12 05054 g008
Table 1. Scope of building and civil construction.
CategorySubcategory
Building constructionResidential buildings
Commercial buildings
Hotels, restaurants and apartments
Offices
Schools and hospitals
Passenger waiting rooms at airports, wharves, railway stations and bus stations
Indoor stadiums and entertainment venues
Workshops and warehouses
Civil engineering
construction
Subway, light rail and tramcar subgrade track laying
Urban municipal and ordinary highways
Urban roads, streets, sidewalks, overpasses, underpasses, squares, parks and traffic barriers
Subway and municipal road tunnels
Municipal road bridges and urban flyovers
Waterworks and sewage treatment works
Water treatment system installation
Gas and heat supply facilities
Solid waste treatment works
Urban landscapes, greenbelts and street lighting
Urban pipelines and transfer stations
Mechanical installationElectric wiring, lighting and electric equipment
Signal appliances
Telecommunication lines and equipment
Water pipes and equipment
Gas supply lines and equipment
Heating pipelines and equipment
Air conditioning equipment
Fire detection devices
Anti-theft devices
Insulation and fireproof devices
Elevators
Architectural components installationDoors, windows and glass
Floor treatment
Wall and ceiling treatment and whitewash
Paint
Indoor woodworking and metalworking services
Building repair and maintenance
OthersPreparation
Construction equipment and operator service
Table 2. Construction accident indices in 31 Regions.
RegionAccident
Number
Worker
Deaths
Construction GDP/
100 Million Yuan
Death Rate/
1,000,000
m2
Death Rate/
100 Million
Yuan
Death Rate/
100,000
Employees
MHF
Accident Rate (%)
Beijing17821263,348.590.040.0035.222.81
Tianjin12113529,896.040.100.0053.372.48
Hebei8512040,455.190.030.0031.2010.59
Shanxi558324,245.960.050.0031.499.09
Inner Mongolia1131519869.410.160.0155.818.85
Liaoning11115842,773.410.040.0041.4210.81
Jilin15918816,514.940.170.0114.993.77
Heilongjiang18420914,186.720.310.0476.323.26
Shanghai24927343,339.150.080.0063.892.41
Jiangsu590660182,534.480.030.0041.132.71
Zhejiang335372174,241.970.020.0020.661.19
Anhui25830643,196.300.080.0072.303.10
Fujian16018256,282.130.030.0030.813.13
Jiangxi15719234,527.970.070.0061.835.10
Shandong13118672,807.820.020.0030.809.92
Henan12617862,468.140.030.0030.909.52
Hubei20425779,593.160.040.0041.606.37
Hunan15118050,221.890.040.0041.233.97
Guangdong30837267,939.100.070.0062.215.52
Guangxi18920923,095.610.110.0092.803.70
Hainan73792266.130.380.03513.411.37
Chongqing30732344,896.360.120.0072.251.30
Sichuan17521467,523.550.040.0030.976.86
Guizhou13818615,156.000.120.0024.287.97
Yunnan20924126,707.860.160.0093.052.87
Tibet816891.800.320.0185.8412.50
Shaanxi607938,106.770.030.0020.8910.00
Gansu13615512,865.920.170.0123.602.21
Qinghai881023055.061.090.03312.094.55
Ningxia50664070.990.170.0167.758.00
Xinjiang14716915,749.770.150.0116.135.44
Table 3. Construction Accidents in 31 Regions (2010 to 2018).
RegionF1F2FScore Ranking
Qinghai3.36−0.171.731
Hainan2.58−0.031.372
Heilongjiang1.900.581.293
Jiangsu−0.713.201.094
Chongqing−0.091.320.565
Zhejiang−0.611.530.386
Shanghai−0.050.830.367
Yunnan0.090.560.308
Anhui−0.240.880.289
Jilin0.360.140.2510
Gansu0.340.120.2411
Guangdong−0.460.990.2112
Xinjiang0.37−0.150.1313
Beijing−0.050.320.1214
Guangxi−0.050.280.1015
Tianjin−0.03−0.08−0.0516
Ningxia0.66−1.07−0.1417
Inner Mongolia0.31−0.69−0.1518
Jiangxi−0.38−0.07−0.2419
Hubei−0.630.20−0.2520
Fujian−0.550.10−0.2521
Hunan−0.50−0.02−0.2822
Guizhou−0.31−0.48−0.3923
Sichuan−0.73−0.16−0.4724
Tibet0.54−1.85−0.5625
Henan−0.88−0.75−0.8226
Shandong−0.93−0.75−0.8527
Liaoning−0.83−1.00−0.9128
Shanxi−0.71−1.25−0.9629
Hebei−0.87−1.20−1.0230
Shaanxi−0.89−1.36−1.1031
Publisher’s Note: MDPI stays neutral with regard to jurisdictional claims in published maps and institutional affiliations.

