
IoT Intrusion Detection Using Machine Learning with a Novel High Performing Feature Selection Method

 ,
,  , , and
Abstract
:1. Introduction
1.1. Feature Selection
1.2. Our Contributions
- Present a filter-based method to optimize the FS process using the IG and GR methods that use various techniques to obtain only the most essential features.
- Employ the concept of mathematical sets (intersection and union theory) to generate a hybrid feature selection approach (i.e., called hybrid here since we have combined two filter-based feature ranking approaches, IG and GR; to extract the minimum and maximum of the best relevant features). The proposed process consists of two feature selection modules. The first module uses the intersection rule to select the most relevant features from the former phase. The second module plays the same role as the first but instead uses the union rule. The result of these modules is to have the best relevant features selected, which are then fed to ML classifiers in the next phase for the ensemble and singular classifiers. In this way, our hybrid introduces a simple, practical in the context of IoT, and efficient yet effective methodology that requires less training time still better performance compared to other techniques.
- Employ diverse ML algorithms and ensemble ML algorithms with a majority voting to create an intelligent IDS scoring a maximum detection accuracy of 99.98% for our ML ensemble-based hybrid feature selection that employs (i) IMF: Intersection Mathematical set theory FS inspired by the intersection theory concept, and (ii) UMF: Union Mathematical set theory FS is inspired by the union theory concept. The method works in a systematic way that has not been published elsewhere in the literature to the best of our knowledge.
- Providing extensive experimental results to gain insights into the proposed approach as an effective and general IoT ecosystem IDS solution methodology.
1.3. Paper Organization
2. Related Work

| Reference | Feature Selection Approach | Number of Features | Detection Model | Environment | Datasets | Performance Metrics |
|---|---|---|---|---|---|---|
| [23] | FMIFS | Candidate Features Selected | LS-SVM | IoT system | KDD Cup 99 d, NSL-KDD, Kyoto 2006+ | DR, FPR, Accuracy |
| [24] | MMIFS | Candidate Features Selected | SVM | Discrete, Continuous environment | KDD Cup 99 | Falsepositve rate (FPR), false detection rate (DR), Accuracy |
| [25] | - | Candidate Features Selected | SVM, ANN | Continuous environment | DARPA | Accurecy, False positive rate, False negative rate |
| [32] | mRMR, wrappers, Max, MaxRel | Candidate Features Selected | NB, SVM, LDA | Discrete and continuous environment | HDR, ARR, NCI, LYM | Lowest Error Rate |
| [48] | PCA | 6 and 19 | KNN with K-means, CANN | Continuous environment | KDD Cup 99 | Accuracy, Detection rate, False alarm |
| [49] | Wrapper, GA, LR | 15, 16, 17, 18, 20, 22 | logistic regression, a genetic algorithm, decision tree | IoT system | KDD Cup 99 | Accuracy, Recall, DR, FAR |
| [50] | Correlation (CR), (IG) | 25 | ANN | IoT system | NSL-KDD | Confusion matrix, Recall, Precision, FPR, TPR, Accuracy |
| [51] | Wrapper, GA | 11, 9, 16, 20, 22, 36, 34, 41 | random tree, decision stump, naive Bayes, C4.5, random forest, and representative tree | Continuous environment | KDD Cup 99 | TP Rate, FP Rate, Precision, Recall, F-Measure |
| [52] | Wrapper, RHMC | Candidate Features Selected | SVM | IoT system | KDD Cup 99 | False positive rate |
| [53] | Shapiro-Wilk | Candidate Features Selected | SVM, Gaussian NB, LDA, LR, Descion Tree, Random forest (RF), Ensemble | IoT system | IoTID20 | Accurecy, presion, Recall, F score |
| [54] | - | - | SVM, Gradient Descent (SGD), LR, NB, SLFN, oversampling | IoT system | IoTID20 | Accuracy, Precision, Recall, G-mean |
| [55] | - | - | lightGBM, OASW | IoT system | IoTID20, NSL-KDD | Accuracy, Precision, Recall |
Identified Literature Gaps and Open Challenges
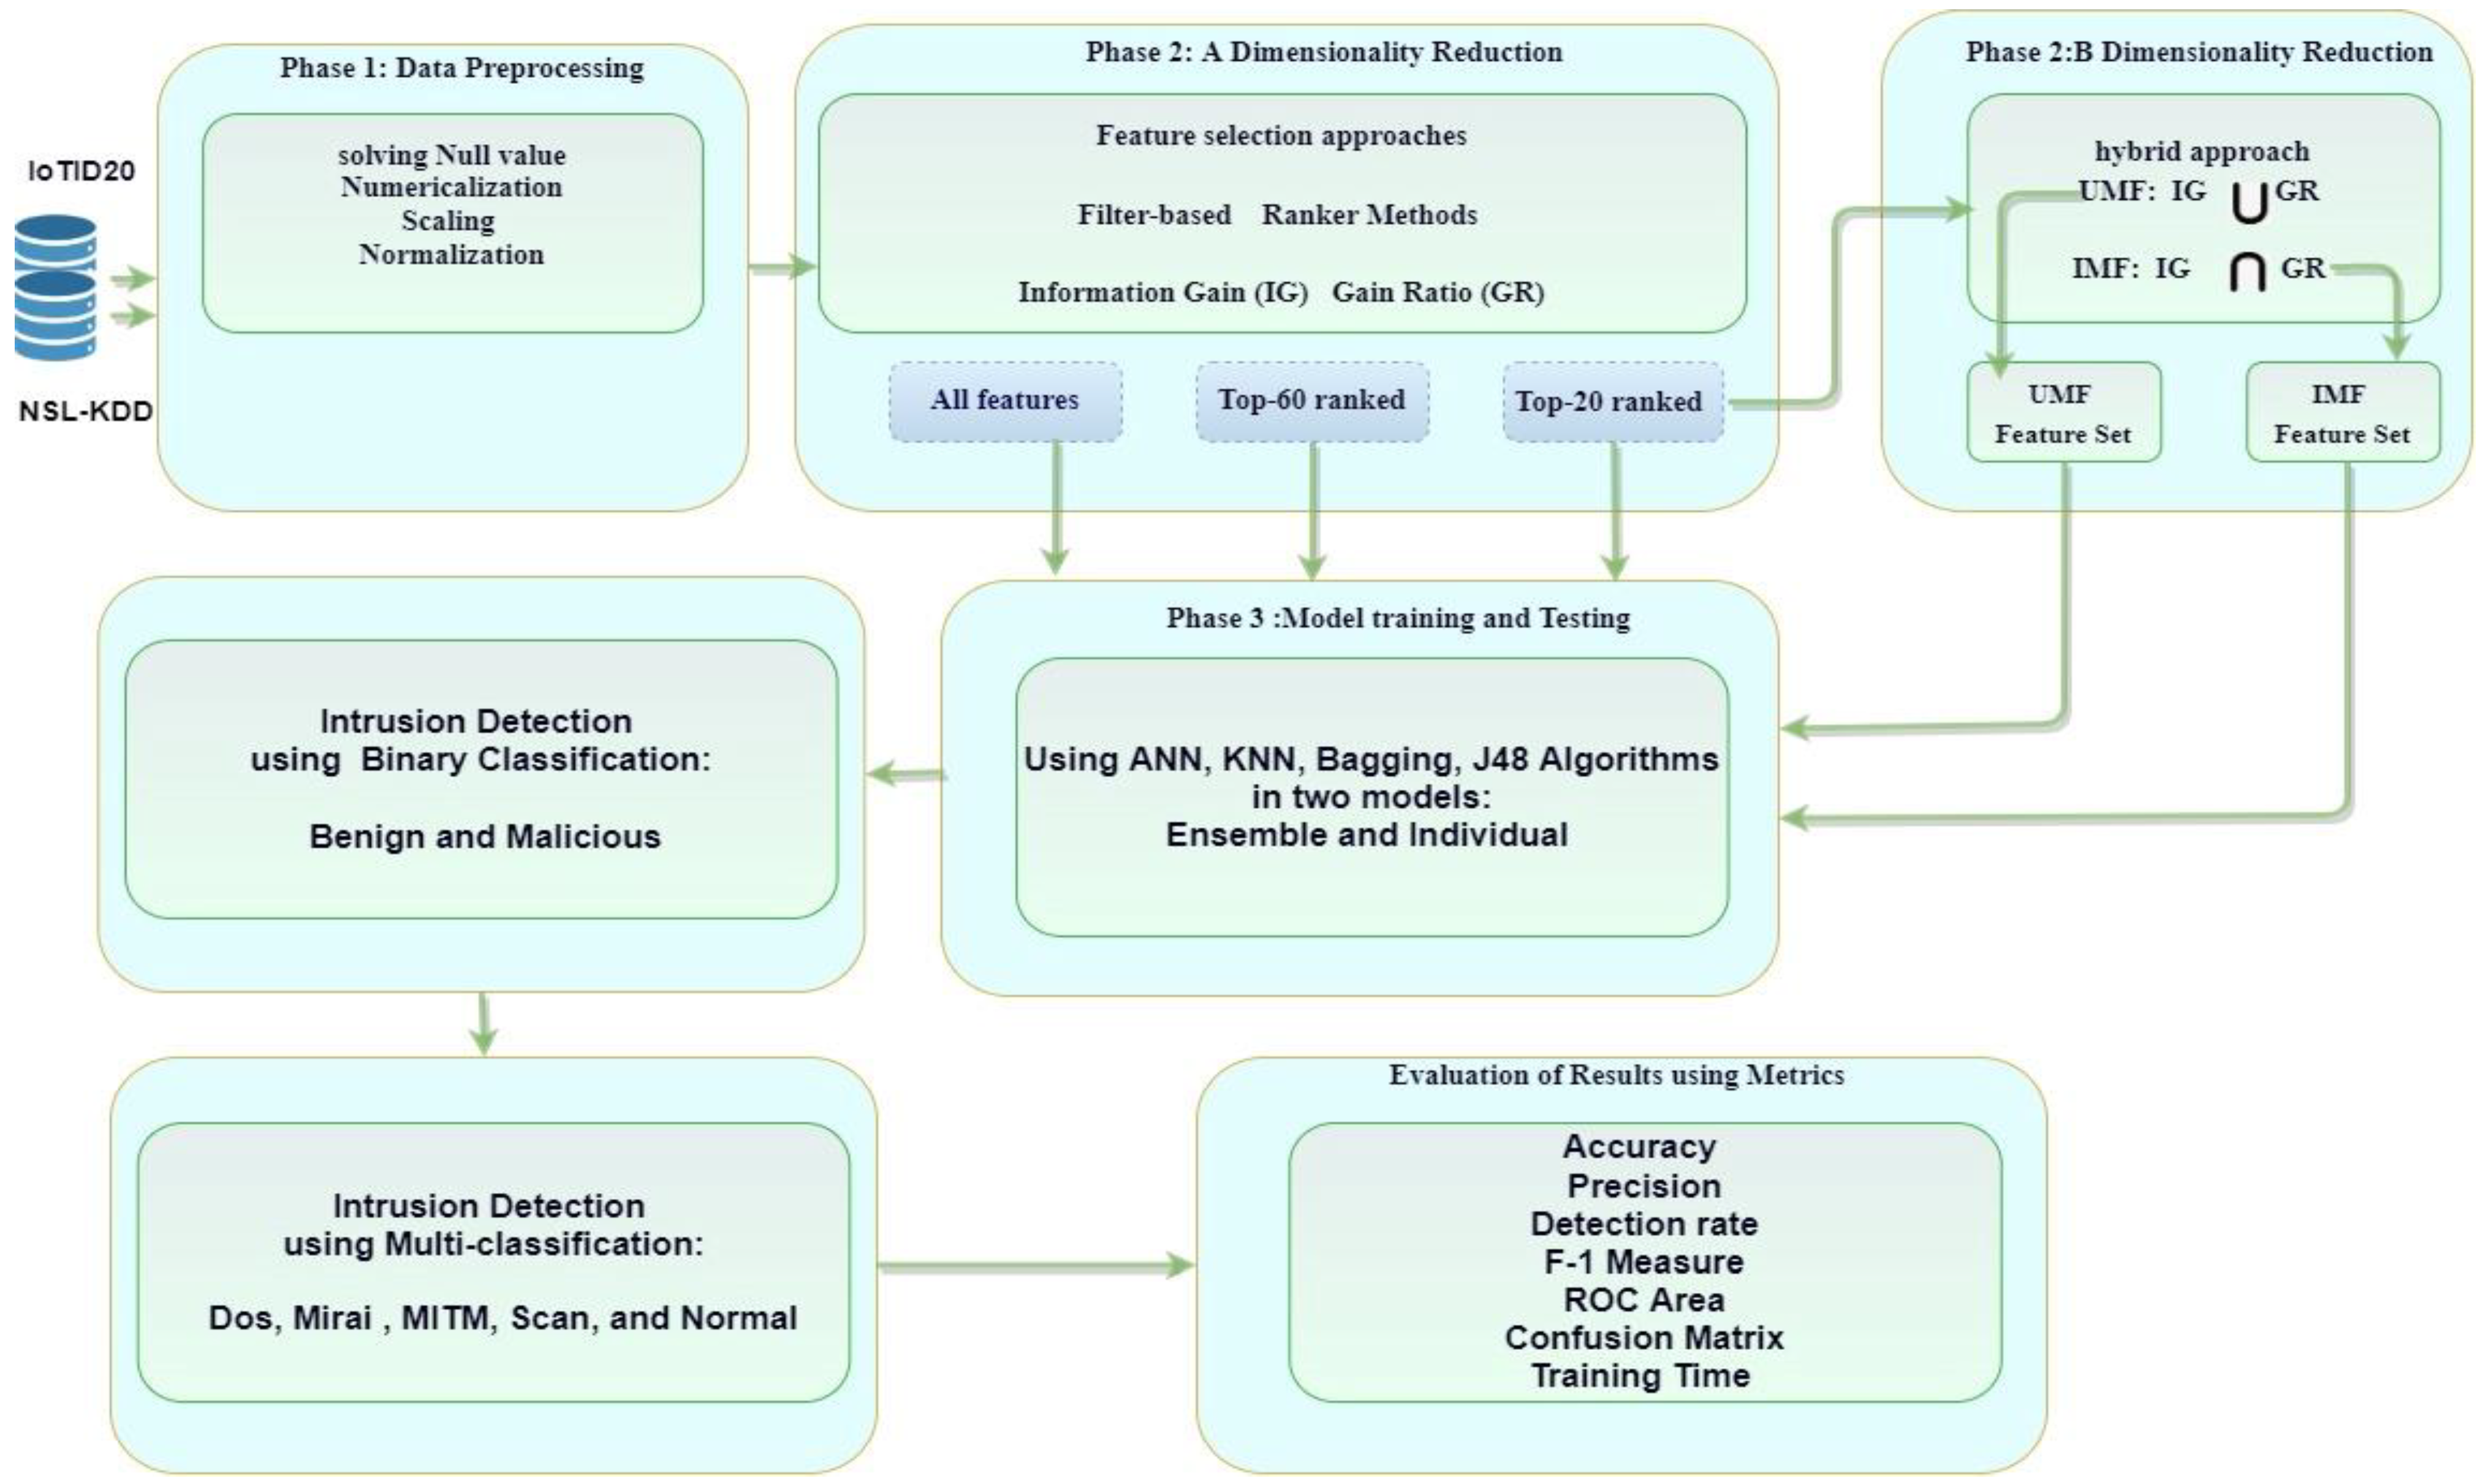
3. Proposed Anomaly-Based IDS for IoT Ecosystem
3.1. IoT Network Traffic Apposite
3.2. Data Pre-Processing
3.3. Dimensionality Reduction
3.4. Validation Phase
3.5. Hybrid Approach
3.6. Model Training
- ANN (called MLP in the Weka tool) stands for artificial neural network and is a set of neuron nodes arranged in hidden layers designed to recognize patterns imitating the human brain.
- kNN (called IBk or instance-based learner in the Weka Tool) stands for the k-nearest neighbor and is a simplified supervised machine learning algorithm that can be used to address classification or regression tasks. kNN depends on deriving the distance metric between a predicted sample and k-stored samples to provide the classification decision based on the maximum value of the distance of nearest neighbors.
- C4.5 (called J48 in the Weka tool) is an ML algorithm that is used to generate a decision tree. C4.5 is an extension of the ID3 (iterative dichotomies 3) algorithm. It implements the model to consist of a root node, branch nodes, and leaf nodes. C4.5 has some advantages over ID3, including handling both continuous and discrete attributes, handling missing values without human intervention, handling attributes with various costs (i.e., loss function), and providing an optional task to prune the tree after creation.
- Bagging (bootstrap aggregating) fits well for an imbalanced dataset. It reduces variance which helps to avoid overfitting. It can be applied to a different domain. Bagging is a type of ensemble algorithm.
- Ensemble Method: The ensemble method aims to select the final best decision by using majority voting on the outputs from individual classifiers (ANN, kNN, C4.5, and Bagging). With six feature-reduced sets, we established six ensemble methods to construct the final anomaly-based IDS.
4. Experimental Results and Discussion
4.1. The Datasets
4.2. Evaluation Metrics
- The confusion matrix that is used to report the number of correctly predicted samples (represented in two factors TP and TN) and the number of incorrectly predicted samples (represented as FP and FN). The predicted values can be described as positive and negative values, whereas the actual values can be described as true and false values. The two-class confusion matrix is shown in Figure 5.
- The accuracy indicates the model’s power to classify the result of benign instances correctly, as shown in Equation (9):
- The recall is known as sensitivity or detection rate and indicates the model’s power to correctly identify attacks (the actual values) as shown in Equation (10):
- The precision indicates the model’s power to be correctly predictive, which means how many positive predictions (attacks) are predicted correctly, as shown in Equation (11):
- The F1-measure plays a trade-off between recall and precision in all instances to improve contradiction of recall and precision, as shown in Equation (12):
- The False Positive Rate (FPR) indicates the model’s power to calculate the percentage of misclassified attack instances as normal. This is represented as follows in Equation (13):
- Receiver operating characteristics area under the curve (ROC AUC) which is used as a measure of the usefulness of a test in general at various threshold settings. The greater area the more useful test (ranges from 0.0% to 100%).
- Training Time is the amount of time duration measured in seconds (s) that the ML model takes to train the model using a specific dataset.
4.3. Experimental Results and Analysis
4.4. Comparison Analysis of Results
5. Summary and Conclusions
Author Contributions
Funding
Institutional Review Board Statement
Informed Consent Statement
Acknowledgments
Conflicts of Interest
References
- Turton, W.; Mehrotra, K. Hackers breached colonial pipeline using compromised password. Available online: https://www.bloomberg.com/news/articles/2021-06-04/hackers-breached-colonial-pipeline-using-compromised-password (accessed on 1 October 2021).
- Smadi, A.A.; Ajao, B.T.; Johnson, B.K.; Lei, H.; Chakhchoukh, Y.; Al-Haija, Q.A. A Comprehensive Survey on Cyber-Physical Smart Grid Testbed Architectures: Requirements and Challenges. Electronics 2021, 10, 1043. [Google Scholar] [CrossRef]
- Albulayhi, K.; Smadi, A.A.; Sheldon, F.T.; Abercrombie, R.K. IoT Intrusion Detection Taxonomy, Reference Architecture, and Analyses. Sensors 2021, 21, 6432. [Google Scholar] [CrossRef]
- Farooq, M.U.; Waseem, M.; Mazhar, S.; Khairi, A.; Kamal, T. A review on internet of things (IoT). Int. J. Comput. Appl. 2015, 113, 1–7. [Google Scholar]
- Aborujilah, A.; Nassr, R.M.; Al-Hadhrami, T.; Husen, M.N.; Ali, N.A.; Al-Othmani, A.; Syahela, N.; Ochiai, H. Security Assessment Model to Analysis DOS Attacks in WSN. In International Conference of Reliable Information and Communication Technology; Springer: Berlin/Heidelberg, Germany, 2019. [Google Scholar]
- Agrawal, K.; Kamboj, N. Smart agriculture using IOT: A futuristic approach. Int. J. Inf. Dissem.Technol. 2019, 9, 186–190. [Google Scholar] [CrossRef]
- Pawar, P.; Trivedi, A. Device-to-device communication based IoT system: Benefits and challenges. IETE Tech. Rev. 2019, 36, 362–374. [Google Scholar] [CrossRef]
- CISOMAG. IoT Connections to Reach 83 Billion by 2024: Report. Available online: https://cisomag.eccouncil.org/iot-connections-to-reach-83-billion-by-2024-report/ (accessed on 12 July 2021).
- Kumar, S.; Solanki, V.K.; Choudhary, S.K.; Selamat, A.; González Crespo, R. Comparative Study on Ant Colony Optimization (ACO) and K-Means Clustering Approaches for Jobs Scheduling and Energy Optimization Model in Internet of Things (IoT). Int. J. Interact. Multimed. Artif. Intell. 2020, 6, 107–116. [Google Scholar] [CrossRef]
- Nimbalkar, P.; Kshirsagar, D. Feature selection for intrusion detection system in Internet-of-Things (IoT). ICT Express 2021, 7, 177–181. [Google Scholar] [CrossRef]
- Albulayhi, K.; Sheldon, F.T. An Adaptive Deep-Ensemble Anomaly-Based Intrusion Detection System for the Internet of Things. In Proceedings of the 2021 IEEE World AI IoT Congress (AIIoT), Seattle, WA, USA, 10–13 May 2021. [Google Scholar]
- Eskandari, M.; Janjua, Z.H.; Vecchio, M.; Antonelli, F. Passban IDS: An Intelligent Anomaly-Based Intrusion Detection System for IoT Edge Devices. IEEE Internet Things J. 2020, 7, 6882–6897. [Google Scholar] [CrossRef]
- Abraham, A.; Grosan, C.; Martin-Vide, C. Evolutionary design of intrusion detection programs. Int. J. Netw. Secur. 2007, 4, 328–339. [Google Scholar]
- Ilgun, K.; Ustat, A. A Real-Time Intrusion Detection System for Unix. Master’s Thesis, University of California Santa Barbara, Santa Barbara, CA, USA, 1992. [Google Scholar]
- Verma, A.; Ranga, V. Machine learning based intrusion detection systems for IoT applications. Wirel. Pers. Commun. 2020, 111, 2287–2310. [Google Scholar] [CrossRef]
- Sarker, I.H. Deep Learning: A Comprehensive Overview on Techniques, Taxonomy, Applications and Research Directions. SN Comput. Sci. 2021, 2, 1–20. [Google Scholar] [CrossRef]
- Siddiqi, M.A.; Pak, W. An Agile Approach to Identify Single and Hybrid Normalization for Enhancing Machine Learning-Based Network Intrusion Detection. IEEE Access 2021, 9, 137494–137513. [Google Scholar] [CrossRef]
- Latif, S.; Zou, Z.; Idrees, Z.; Ahmad, J. A Novel Attack Detection Scheme for the Industrial Internet of Things Using a Lightweight Random Neural Network. IEEE Access 2020, 8, 89337–89350. [Google Scholar] [CrossRef]
- Heigl, M.; Weigelt, E.; Fiala, D.; Schramm, M. Unsupervised Feature Selection for Outlier Detection on Streaming Data to Enhance Network Security. Appl. Sci. 2021, 11, 12073. [Google Scholar] [CrossRef]
- Sarker, I.H. Deep Cybersecurity: A Comprehensive Overview from Neural Network and Deep Learning Perspective. SN Comput. Sci. 2021, 2, 1–16. [Google Scholar] [CrossRef]
- Balogh, S.; Gallo, O.; Ploszek, R.; Špaček, P.; Zajac, P. IoT Security Challenges: Cloud and Blockchain, Postquantum Cryptography, and Evolutionary Techniques. Electronics 2021, 10, 2647. [Google Scholar] [CrossRef]
- Alrubayyi, H.; Goteng, G.; Jaber, M.; Kelly, J. Challenges of Malware Detection in the IoT and a Review of Artificial Immune System Approaches. J. Sens. Actuator Networks 2021, 10, 61. [Google Scholar] [CrossRef]
- Ambusaidi, M.A.; He, X.; Nanda, P.; Tan, Z. Building an Intrusion Detection System Using a Filter-Based Feature Selection Algorithm. IEEE Trans. Comput. 2016, 65, 2986–2998. [Google Scholar] [CrossRef] [Green Version]
- Amiri, F.; Yousefi, M.R.; Lucas, C.; Shakery, A.; Yazdani, N. Mutual information-based feature selection for intrusion detection systems. J. Netw. Comput. Appl. 2011, 34, 1184–1199. [Google Scholar] [CrossRef]
- Sung, A.H.; Mukkamala, S. Identifying important features for intrusion detection using support vector machines and neural networks. In Proceedings of the 2003 Symposium on Applications and the Internet, Orlando, FL, USA, 27–31 January 2003. [Google Scholar]
- Jose, S.; Malathi, D.; Reddy, B.; Jayaseeli, D. A Survey on anomaly-based host intrusion detection system. In Journal of Physics: Conference Series; IOP Publishing: Bristol, UK, 2018. [Google Scholar]
- Khraisat, A.; Gondal, I.; Vamplew, P.; Kamruzzaman, J. Survey of intrusion detection systems: Techniques, datasets and challenges. Cybersecurity 2019, 2, 1–22. [Google Scholar] [CrossRef]
- Biesiada, J.; Duch, W. Feature Selection for High-Dimensional Data—A Pearson Redundancy Based Filter, in Computer Recognition Systems 2; Springer: Berlin/Heidelberg, Germany, 2007; pp. 242–249. [Google Scholar]
- Jin, X.; Xu, A.; Bie, R.; Guo, P. Machine learning techniques and chi-square feature selection for cancer classification using SAGE gene expression profiles. In International Workshop on Data Mining for Biomedical Application; Springer: Berlin/Heidelberg, Germany, 2006. [Google Scholar]
- Thang, N.D.; Lee, Y.-K. An improved maximum relevance and minimum redundancy feature selection algorithm based on normalized mutual information. In Proceedings of the 2010 10th IEEE/IPSJ International Symposium on Applications and the Internet, Seoul, Korea, 19–23 July 2010. [Google Scholar]
- Estévez, P.A.; Tesmer, M.; Perez, C.A.; Zurada, J.M. Normalized Mutual Information Feature Selection. IEEE Trans. Neural Networks 2009, 20, 189–201. [Google Scholar] [CrossRef] [PubMed] [Green Version]
- Peng, H.; Long, F.; Ding, C. Feature selection based on mutual information criteria of max-dependency, max-relevance, and min-redundancy. IEEE Trans. Pattern Anal. Mach. Intell. 2005, 27, 1226–1238. [Google Scholar] [CrossRef] [PubMed]
- Kwak, N.; Choi, C.-H. Input feature selection by mutual information based on Parzen window. IEEE Trans. Pattern Anal. Mach. Intell. 2002, 24, 1667–1671. [Google Scholar] [CrossRef] [Green Version]
- Kohavi, R.; John, G.H. Wrappers for feature subset selection. Artif. Intell. 1997, 97, 273–324. [Google Scholar] [CrossRef] [Green Version]
- Osman, H.; Ghafari, M.; Nierstrasz, O. Automatic feature selection by regularization to improve bug prediction accuracy. In Proceedings of the 2017 IEEE Workshop on Machine Learning Techniques for Software Quality Evaluation (MaLTeSQuE), Klagenfurt, Austria, 21 February 2017. [Google Scholar]
- Quinlan, J.R. Induction of decision trees. Mach. Learn. 1986, 1, 81–106. [Google Scholar] [CrossRef] [Green Version]
- Han, J.; Pei, J.; Kamber, M. Data Mining: Concepts and Techniques; Elsevier: Amsterdam, The Netherlands, 2011. [Google Scholar]
- Abu Al-Haija, Q.; Zein-Sabatto, S. An Efficient Deep-Learning-Based Detection and Classification System for Cyber-Attacks in IoT Communication Networks. Electronics 2020, 9, 2152. [Google Scholar] [CrossRef]
- Bendiab, G.; Shiaeles, S.; Alruban, A.; Kolokotronis, N. IoT Malware Network Traffic Classification using Visual Representation and Deep Learning. In Proceedings of the 2020 6th IEEE Conference on Network Softwarization (NetSoft), Ghent, Belgium, 29–31 July 2020. [Google Scholar]
- AAbu Al-Haija, Q.; McCurry, C.D.; Zein-Sabatto, S. Intelligent Self-reliant Cyber-Attacks Detection and Classification System for IoT Communication Using Deep Convolutional Neural Network. In Selected Papers from the 12th International Networking Conference, Rhodes, Greece, 19–21 September 2020; Springer: Cham, Switzerland, 2021. [Google Scholar]
- Taher, K.A.; Jisan, B.M.Y.; Rahman, M. Network intrusion detection using supervised machine learning technique with feature selection. In Proceedings of the 2019 International Conference on Robotics, Electrical and Signal Processing Techniques (ICREST), Dhaka, Bangladesh, 10–12 January 2019. [Google Scholar]
- Gao, X.; Shan, C.; Hu, C.; Niu, Z.; Liu, Z. An Adaptive Ensemble Machine Learning Model for Intrusion Detection. IEEE Access 2019, 7, 82512–82521. [Google Scholar] [CrossRef]
- Sapre, S.; Ahmadi, P.; Islam, K. A robust comparison of the KDDCup99 and NSL-KDD IoT network intrusion detection datasets through various machine learning algorithms. arXiv 2019, arXiv:1912.13204. [Google Scholar]
- Chowdhury MM, U.; Hammond, F.; Konowicz, G.; Xin, C.; Wu, H.; Li, J. A few-shot deep learning approach for improved intrusion detection. In Proceedings of the 2017 IEEE 8th Annual Ubiquitous Computing, Electronics and Mobile Communication Conference (UEMCON), New York, NY, USA, 19–21 October 2017. [Google Scholar]
- Javaid, A.; Niyaz, Q.; Sun, W.; Alam, M. A Deep Learning Approach for Network Intrusion Detection System. In In Proceedings of the 9th EAI International Conference on Bio-inspired Information and Communications Technologies (formerly BIONETICS), New York, NY, USA, 3–5 December 2015. [Google Scholar]
- Imamverdiyev, Y.; Sukhostat, L. Anomaly detection in network traffic using extreme learning machine. In Proceedings of the 2016 IEEE 10th International Conference on Application of Information and Communication Technologies (AICT), Baku, Azerbaijan, 12–14 October 2016. [Google Scholar]
- Al-Haijaa, Q.A.; Ishtaiwia, A. Machine Learning Based Model to Identify Firewall Decisions to Improve Cyber-Defense. Int. J. Adv.Sci. Eng. Inf. Technol. 2021, 11, 1688–1695. [Google Scholar] [CrossRef]
- Lin, W.-C.; Ke, S.-W.; Tsai, C.-F. CANN: An intrusion detection system based on combining cluster centers and nearest neighbors. Knowledge-Based Syst. 2015, 78, 13–21. [Google Scholar] [CrossRef]
- Khammassi, C.; Krichen, S. A GA-LR wrapper approach for feature selection in network intrusion detection. Comput. Secur. 2017, 70, 255–277. [Google Scholar] [CrossRef]
- Manzoor, I.; Kumar, N. A feature reduced intrusion detection system using ANN classifier. Expert Syst. Appl. 2017, 88, 249–257. [Google Scholar]
- Sindhu, S.S.S.; Geetha, S.; Kannan, A. Decision tree based light weight intrusion detection using a wrapper approach. Expert Syst. Appl. 2012, 39, 129–141. [Google Scholar] [CrossRef]
- Li, Y.; Wang, J.L.; Tian, Z.H.; Lu, T.B.; Young, C. Building lightweight intrusion detection system using wrapper-based feature selection mechanisms. Comput. Secur. 2009, 28, 466–475. [Google Scholar] [CrossRef]
- Ullah, I.; Mahmoud, Q.H. A Scheme for Generating a Dataset for Anomalous Activity Detection in IoT Networks; Springer International Publishing: Berlin/Heidelberg, Germany, 2020. [Google Scholar]
- Qaddoura, R.; Al-Zoubi, A.M.; Almomani, I.; Faris, H. A Multi-Stage Classification Approach for IoT Intrusion Detection Based on Clustering with Oversampling. Appl. Sci. 2021, 11, 3022. [Google Scholar] [CrossRef]
- Yang, L.; Shami, A. A Lightweight Concept Drift Detection and Adaptation Framework for IoT Data Streams. IEEE Internet Things Mag. 2021, 4, 96–101. [Google Scholar] [CrossRef]
- Krishnan, S.; Neyaz, A.; Liu, Q. IoT Network Attack Detection using Supervised Machine Learning. Int. J. Artif. Intell. Expert Syst. 2021, 10, 18–32. [Google Scholar]
- Abe, N.; Kudo, M. Entropy criterion for classifier-independent feature selection. In International Conference on Knowledge-Based and Intelligent Information and Engineering System; Springer: Berlin/Heidelberg, Germany, 2005. [Google Scholar]
- Ukil, A.; Sen, J.; Koilakonda, S. Embedded security for Internet of Things. In Proceedings of the 2011 2nd National Conference on Emerging Trends and Applications in Computer Science, Shillong, India, 4–5 March 2011. [Google Scholar]
- Soldatos, J. A 360-Degree View of IoT Technologies; Artech House: New York, NY, USA, 2020. [Google Scholar]
- Siddiqi, M.A.; Pak, W. Optimizing Filter-Based Feature Selection Method Flow for Intrusion Detection System. Electronics 2020, 9, 2114. [Google Scholar] [CrossRef]
- Cybersecurity, C.I.f. Available online: https://www.unb.ca/cic/datasets/nsl.html (accessed on 21 April 2022).
- Kang, H.; Ahn, D.H.; Lee, G.M.; Yoo, J.D.; Park, K.H.; Kim, H.K. IOT Network Intrusion Dataset. 2019. Available online: https://ieee-dataport.org/open-access/iot-network-intrusion-dataset (accessed on 2 February 2022).
- Witten, I.H.; Frank, E. Data mining: Practical machine learning tools and techniques with Java implementations. SIGMOD Rec. 2002, 31, 76–77. [Google Scholar] [CrossRef]
- Chu, W.-L.; Lin, C.-J.; Chang, K.-N. Detection and Classification of Advanced Persistent Threats and Attacks Using the Support Vector Machine. Appl. Sci. 2019, 9, 4579. [Google Scholar] [CrossRef] [Green Version]
- Soleymanzadeh, R.; Aljasim, M.; Qadeer, M.W.; Kashef, R. Cyberattack and Fraud Detection Using Ensemble Stacking. AI 2022, 3, 22–36. [Google Scholar] [CrossRef]
- Carrera, F.; Dentamaro, V.; Galantucci, S.; Iannacone, A.; Impedovo, D.; Pirlo, G. Combining Unsupervised Approaches for Near Real-Time Network Traffic Anomaly Detection. Appl. Sci. 2022, 12, 1759. [Google Scholar] [CrossRef]
- Iliyasu, A.S.; Abdurrahman, U.A.; Zheng, L. Few-Shot Network Intrusion Detection Using Discriminative Representation Learning with Supervised Autoencoder. Appl. Sci. 2022, 12, 2351. [Google Scholar] [CrossRef]
- Cao, B.; Li, C.; Song, Y.; Qin, Y.; Chen, C. Network Intrusion Detection Model Based on CNN and GRU. Appl. Sci. 2022, 12, 4184. [Google Scholar] [CrossRef]
- Fu, Y.; Du, Y.; Cao, Z.; Li, Q.; Xiang, W. A Deep Learning Model for Network Intrusion Detection with Imbalanced Data. Electronics 2022, 11, 898. [Google Scholar] [CrossRef]
- Kareem, S.S.; Mostafa, R.R.; Hashim, F.A.; El-Bakry, H.M. An Effective Feature Selection Model Using Hybrid Metaheuristic Algorithms for IoT Intrusion Detection. Sensors 2022, 22, 1396. [Google Scholar] [CrossRef]
- Wisanwanichthan, T.; Thammawichai, M. A Double-Layered Hybrid Approach for Network Intrusion Detection System Using Combined Naive Bayes and SVM. IEEE Access 2021, 9, 138432–138450. [Google Scholar] [CrossRef]
- Imrana, Y.; Xiang, Y.; Ali, L.; Abdul-Rauf, Z.; Hu, Y.C.; Kadry, S.; Lim, S. χ 2-BidLSTM: A Feature Driven Intrusion Detection System Based on χ 2 Statistical Model and Bidirectional LSTM. Sensors 2022, 22, 2018. [Google Scholar] [CrossRef]
- Pervez, M.S.; Farid, D.M. Feature selection and intrusion classification in NSL-KDD cup 99 dataset employing SVMs. In Proceedings of the 8th International Conference on Software, Knowledge, Information Management and Applications (SKIMA 2014), Dhaka, Bangladesh, 18–20 December 2014. [Google Scholar]
- Ingre, B.; Yadav, A. Performance analysis of NSL-KDD dataset using ANN. In Proceedings of the 2015 international conference on signal processing and communication engineering systems, Vijayawada, India, 2–3 January 2015. [Google Scholar]
- Qaddoura, R.; Al-Zoubi, M.; Faris, H.; Almomani, I. A Multi-Layer Classification Approach for Intrusion Detection in IoT Networks Based on Deep Learning. Sensors 2021, 21, 2987. [Google Scholar] [CrossRef]
- Song, Y.; Hyun, S.; Cheong, Y.-G. Analysis of Autoencoders for Network Intrusion Detection. Sensors 2021, 21, 4294. [Google Scholar] [CrossRef]
- Hussein, A.Y.; Falcarin, P.; Sadiq, A.T. Enhancement performance of random forest algorithm via one hot encoding for IoT IDS. Period. Eng. Nat. Sci. 2021, 9, 579–591. [Google Scholar] [CrossRef]
- De Souza, C.A.; Westphall, C.B.; Machado, R.B. Two-step ensemble approach for intrusion detection and identification in IoT and fog computing environments. Comput. Electr. Eng. 2022, 98, 107694. [Google Scholar] [CrossRef]


| Approach | # Features | Extracted Features |
|---|---|---|
| IG | 20 | 7, 1, 5, 3, 8, 82, 25, 22, 73, 71, 12, 69, 11, 60, 15, 80, 13, 59, 23, 44: 20 |
| IG | 60 | 7, 1, 5, 3, 8, 82, 25, 22, 73, 71, 12, 69, 11, 60, 15, 80, 13, 59, 23, 44, 14, 47, 4, 61, 19, 83, 18, 26, 32, 42, 46, 17, 45, 43, 35, 41, 48, 49, 54, 2, 33, 21, 16, 24, 81, 27, 6, 36, 28, 30, 31, 34, 20, 29, 70, 10, 51, 74, 9, 68 |
| GR | 20 | 16, 34, 5, 3, 54, 8, 22, 13, 35, 15, 60, 73, 14, 49, 48, 69, 11, 6, 25, 32 |
| GR | 60 | 16, 34, 5, 3, 54, 8, 22, 13, 35, 15, 60, 73, 14, 49, 48, 69, 11, 6, 25, 32, 82, 1, 83, 12, 71, 7, 26, 23, 4, 80, 42, 19, 61, 59, 47, 33, 18, 27, 44, 46, 81, 28, 24, 17, 41, 36, 30, 45, 43, 20, 51, 29, 31, 76, 79, 78, 2, 21, 77, 10 |
| 11 | 5, 8, 25, 22, 73, 69, 11, 60, 15, 13, 3 | |
| 28 | 7, 1, 5, 3, 82, 25, 22, 73, 71, 12, 69, 11, 60, 15, 80, 13, 59, 23, 44, 16, 34, 54, 35, 14, 49, 48, 6, 32 |
| Approach | # Features | Extracted Features |
|---|---|---|
| - | 41 | All Feaure |
| IG | 20 | 1, 3, 4, 5, 6, 12, 23, 25, 26, 29, 30, 31, 33, 34, 35, 36, 37, 38, 39, 40 |
| GR | 20 | 2, 3, 4, 5, 6, 8, 10, 11, 12, 13, 23, 25, 26, 29, 30, 33, 34, 37, 38, 39 |
| 15 | 3, 4, 5, 6, 12, 23, 25, 26, 29, 30, 33, 34, 37, 38, 39 |
| Metrics | Classifier | IG_60 | GR_60 | IG_20 | GR_20 | IMF_11 | UMF_28 |
|---|---|---|---|---|---|---|---|
| Accuracy (%) | ANN | 99.39 | 98.83 | 99.57 | 99.08 | 99.07 | 99.07 |
| C4.5 | 99.88 | 99.85 | 99.80 | 99.90 | 99.80 | 99.91 | |
| Bagging | 99.89 | 99.88 | 99.90 | 99.89 | 99.90 | 99.91 | |
| kNN | 99.65 | 99.65 | 99.64 | 99.70 | 99.80 | 99.66 | |
| Ensemble | 99.81 | 99.74 | 99.73 | 99.56 | 99.98 | 99.98 | |
| False Positive Rate (%) | ANN | 0.076 | 0.113 | 0.157 | 0.148 | 0.134 | 0.134 |
| C4.5 | 0.014 | 0.016 | 0.013 | 0.015 | 0.013 | 0.011 | |
| Bagging | 0.013 | 0.015 | 0.013 | 0.014 | 0.013 | 0.012 | |
| kNN | 0.030 | 0.030 | 0.024 | 0.023 | 0.015 | 0.027 | |
| Ensemble | 0.027 | 0.038 | 0.039 | 0.040 | 0.008 | 0.008 | |
| Precision (%) | ANN | 99.40 | 98.80 | 99.60 | 99.10 | 99.10 | 99.10 |
| C4.5 | 99.90 | 99.90 | 99.90 | 99.90 | 99.90 | 99.90 | |
| Bagging | 99.90 | 99.90 | 99.90 | 99.90 | 99.90 | 99.90 | |
| kNN | 99.70 | 99.60 | 99.60 | 99.70 | 99.80 | 99.70 | |
| Ensemble | 99.80 | 99.70 | 99.70 | 99.60 | 99.90 | 99.90 | |
| Recall (%) | ANN | 99.40 | 98.80 | 99.60 | 99.10 | 99.10 | 99.10 |
| C4.5 | 99.90 | 99.90 | 99.90 | 99.90 | 99.90 | 99.90 | |
| Bagging | 99.90 | 99.90 | 99.90 | 99.90 | 99.90 | 99.90 | |
| kNN | 99.70 | 99.70 | 99.60 | 99.70 | 99.80 | 99.70 | |
| Ensemble | 99.80 | 99.70 | 99.70 | 99.60 | 99.90 | 99.90 | |
| F1-Measure (%) | ANN | 99.40 | 98.80 | 99.60 | 99.00 | 99.00 | 99.00 |
| C4.5 | 99.90 | 99.90 | 99.90 | 99.90 | 99.90 | 99.90 | |
| Bagging | 99.90 | 99.90 | 99.90 | 99.90 | 99.90 | 99.90 | |
| kNN | 99.70 | 99.70 | 99.60 | 99.70 | 99.80 | 99.70 | |
| Ensemble | 99.80 | 99.70 | 99.70 | 99.60 | 99.90 | 99.90 | |
| AUC (%) | ANN | 98.40 | 98.60 | 98.20 | 93.90 | 90.80 | 90.80 |
| C4.5 | 99.60 | 99.50 | 99.60 | 99.60 | 99.60 | 99.80 | |
| Bagging | 99.90 | 99.90 | 99.90 | 99.90 | 99.90 | 99.90 | |
| kNN | 97.10 | 98.60 | 98.60 | 99.20 | 99.50 | 99.00 | |
| Ensemble | 98.50 | 98.00 | 97.90 | 96.50 | 99.90 | 99.90 | |
| Training Time (s) | ANN | 870.23 | 920.53 | 295.16 | 310.50 | 42.40 | 42.40 |
| C4.5 | 350.19 | 360.61 | 150.15 | 153.72 | 44.15 | 44.18 | |
| Bagging | 360.22 | 370.18 | 155.28 | 154.99 | 50.28 | 50.28 | |
| kNN | 240.02 | 240.01 | 80.05 | 80.03 | 30.02 | 30.03 | |
| Ensemble | 919.91 | 940.07 | 309.86 | 322.40 | 56.75 | 56.75 |
| Metrics | Classifier | All Features | IG_20 | GR_20 | IMF_15 | UMF_25 |
|---|---|---|---|---|---|---|
| Accuracy (%) | ANN | 99.37 | 97.60 | 96.56 | 97.69 | 97.79 |
| C4.5 | 99.40 | 99.59 | 99.44 | 99.30 | 99.70 | |
| Bagging | 99.39 | 99.79 | 99.83 | 99.79 | 99.79 | |
| kNN | 99.20 | 99.39 | 98.90 | 99.20 | 99.68 | |
| Ensemble | 99.66 | 99.56 | 99.56 | 99.80 | 99.84 | |
| False Positive Rate (%) | ANN | 0.007 | 0.025 | 0.038 | 0.025 | 0.024 |
| C4.5 | 0.006 | 0.004 | 0.006 | 0.007 | 0.003 | |
| Bagging | 0.006 | 0.002 | 0.002 | 0.002 | 0.002 | |
| kNN | 0.008 | 0.006 | 0.011 | 0.008 | 0.003 | |
| Ensemble | 0.004 | 0.005 | 0.005 | 0.002 | 0.002 | |
| Precision (%) | ANN | 99.4 | 97.6 | 96.7 | 97.7 | 97.8 |
| C4.5 | 99.4 | 99.6 | 99.4 | 99.2 | 99.7 | |
| Bagging | 99.4 | 99.8 | 99.8 | 99.8 | 99.8 | |
| kNN | 99.2 | 99.4 | 98.9 | 99.3 | 99.7 | |
| Ensemble | 99.7 | 99.6 | 99.6 | 99.8 | 99.8 | |
| Recall (%) | ANN | 99.4 | 97.6 | 96.6 | 97.7 | 97.8 |
| C4.5 | 99.4 | 99.6 | 99.4 | 99.3 | 99.7 | |
| Bagging | 99.4 | 99.7 | 99.8 | 99.8 | 99.8 | |
| kNN | 99.2 | 99.4 | 98.9 | 99.2 | 99.7 | |
| Ensemble | 99.7 | 99.6 | 99.6 | 99.8 | 99.8 | |
| F1-Measure (%) | ANN | 99.4 | 97.6 | 96.6 | 97.7 | 97.8 |
| C4.5 | 99.4 | 99.6 | 98.9 | 99.3 | 99.4 | |
| Bagging | 98.8 | 99.8 | 99.8 | 99.8 | 99.7 | |
| kNN | 99.2 | 98.8 | 98.9 | 99.2 | 99.4 | |
| Ensemble | 99.7 | 99.6 | 99.1 | 99.8 | 99.8 | |
| AUC (%) | ANN | 99.8 | 99.0 | 98.8 | 97.9 | 98.6 |
| C4.5 | 99.6 | 99.8 | 99.8 | 99.8 | 99.8 | |
| Bagging | 99.2 | 100 | 100 | 100 | 100 | |
| kNN | 99.3 | 99.2 | 98.9 | 99.4 | 99.8 | |
| Ensemble | 99.6 | 99.6 | 100 | 1 | 1.00 | |
| Training Time (s) | ANN | 814 | 300 | 280 | 90 | 210 |
| C4.5 | 180 | 200 | 180 | 40 | 110 | |
| Bagging | 190 | 160 | 160 | 50 | 150 | |
| kNN | 150 | 90 | 90 | 40 | 90 | |
| Ensemble | 550 | 350 | 285 | 60 | 200 |
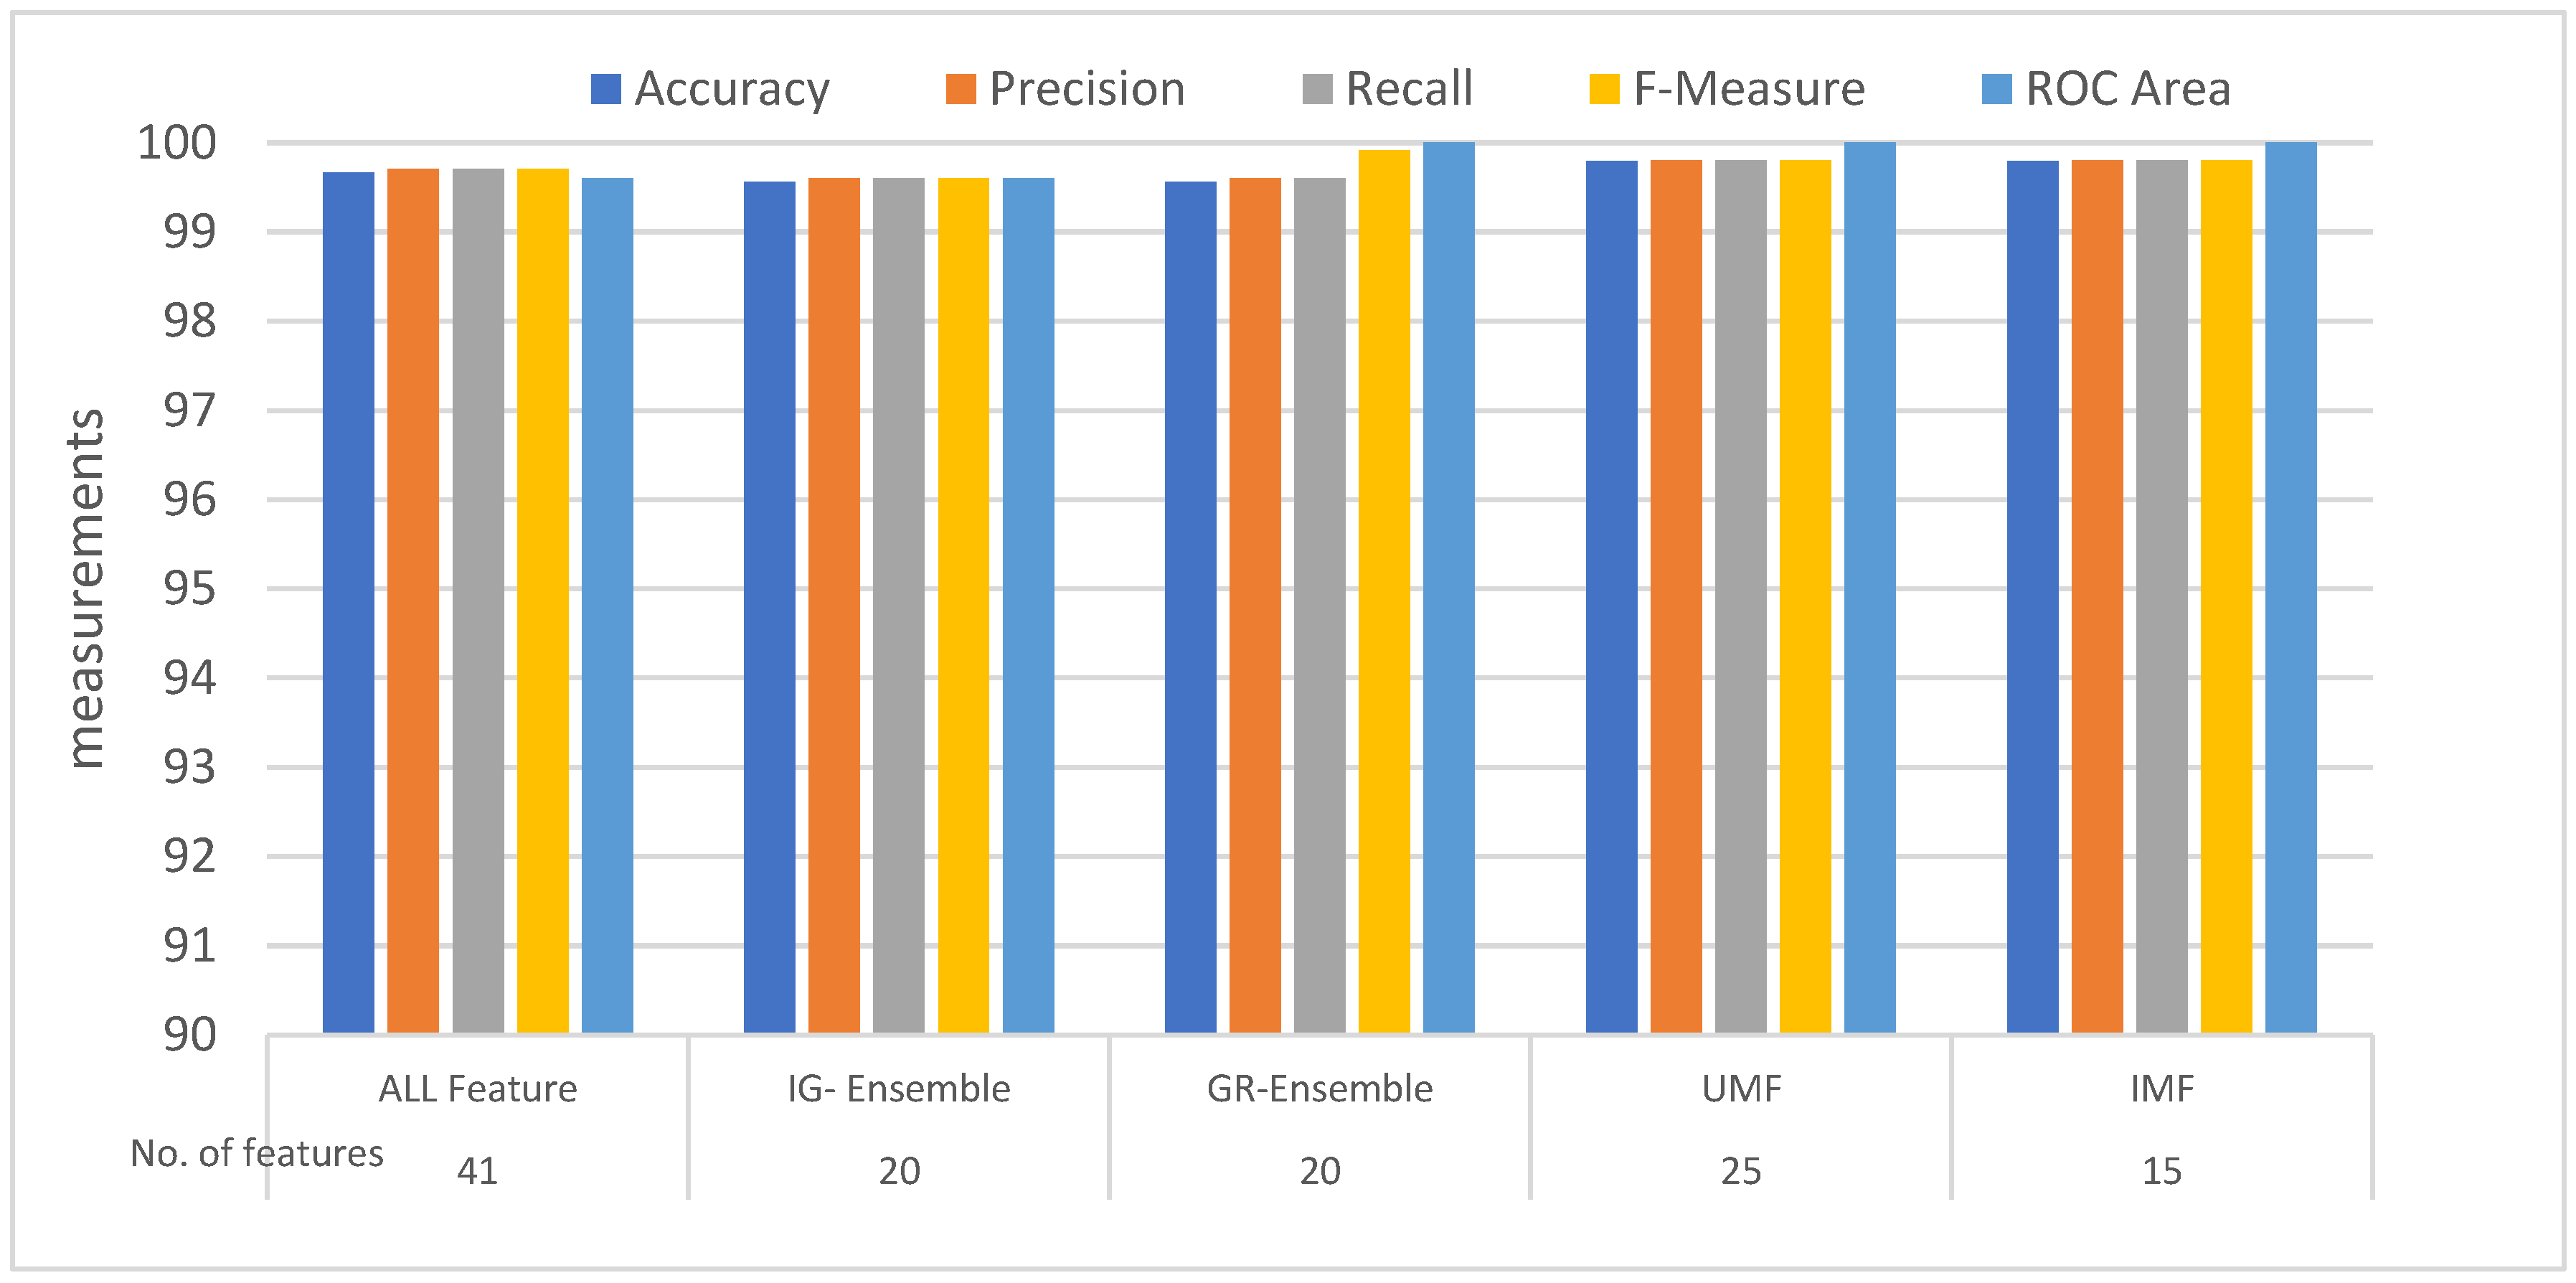
| Feature | Approach | Accuracy (%) | Precision (%) | Recall (%) | F1-Measure (%) | ROC Area (%) |
|---|---|---|---|---|---|---|
| 60 | IG-Ensemble | 99.81 | 99.80 | 99.80 | 99.80 | 98.50 |
| 60 | GR-Ensemble | 99.74 | 99.70 | 99.70 | 99.70 | 98.00 |
| 20 | IG-Ensemble | 99.73 | 99.70 | 99.70 | 99.70 | 97.90 |
| 20 | GR-Ensemble | 99.56 | 99.60 | 99.60 | 99.60 | 96.50 |
| 28 | UMF | 99.98 | 99.90 | 99.90 | 99.90 | 99.90 |
| 11 | IMF | 99.98 | 99.90 | 99.90 | 99.90 | 99.90 |
| Feature | Approach | Accuracy (%) | Precision (%) | Recall (%) | F1-Measure (%) | ROC Area (%) |
|---|---|---|---|---|---|---|
| 41 | ALL Feature | 99.66 | 99.7 | 99.7 | 99.7 | 99.6 |
| 20 | IG-Ensemble | 99.56 | 99.6 | 99.6 | 99.6 | 99.6 |
| 20 | GR-Ensemble | 99.56 | 99.6 | 99.6 | 99.91 | 100 |
| 25 | UMF | 99.80 | 99.8 | 99.8 | 99.8 | 100 |
| 15 | IMF | 99.80 | 99.8 | 99.8 | 99.8 | 100 |
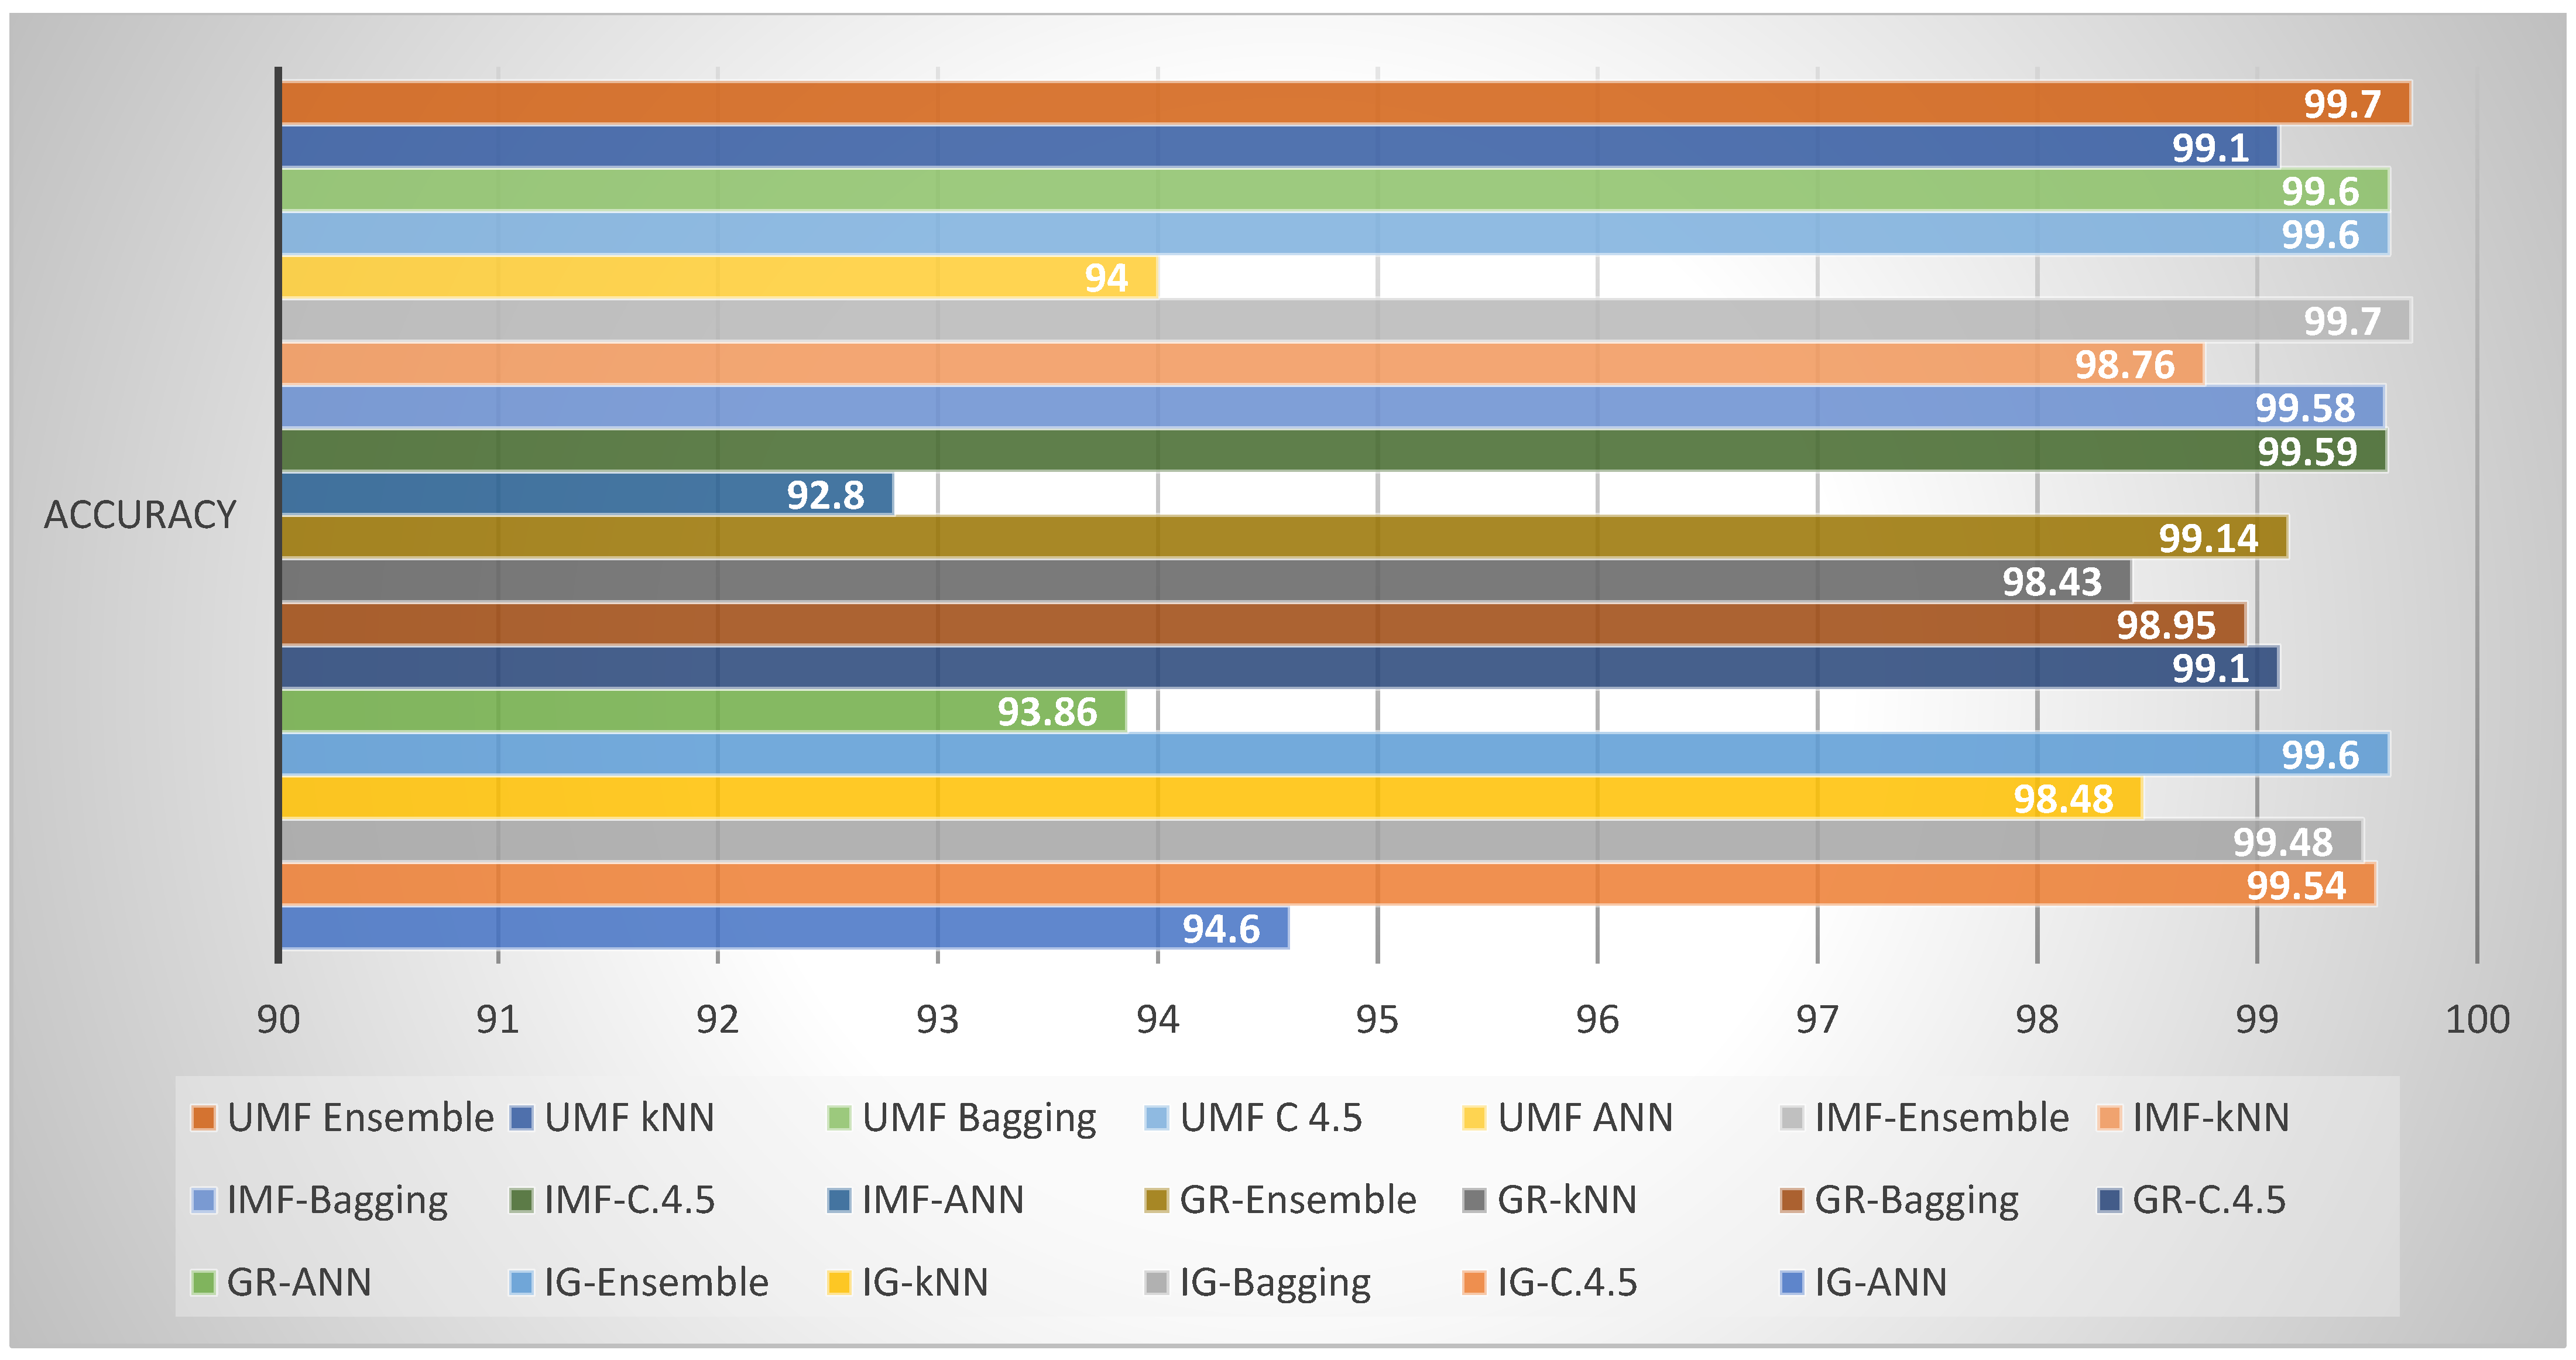
| Classifiers | Accuracy | Classifiers | Accuracy | Classifiers | Accuracy | Classifiers | Accuracy | |
|---|---|---|---|---|---|---|---|---|
| FS Approach Name | Information Gain | # | Gain Ratio | # | Intersection | # | Union | # |
| Model | IG-ANN | 94.60 | GR-ANN | 93.86 | IMF-ANN | 92.80 | ANN UMF | 94.00 |
| IG-C.4.5 | 99.54 | GR-C.4.5 | 99.10 | IMF-C.4.5 | 99.59 | C 4.5 UMF | 99.60 | |
| IG-Bagging | 99.48 | GR-Bagging | 98.95 | IMF-Bagging | 99.58 | Bagging UMF | 99.60 | |
| IG-kNN | 98.48 | GR-kNN | 98.43 | IMF-kNN | 98.76 | kNN UMK | 99.10 | |
| IG-Ensemble | 99.60 | GR-Ensemble | 99.14 | IMF-Ensemble | 99.70 | Ensemble UMF | 99.70 |
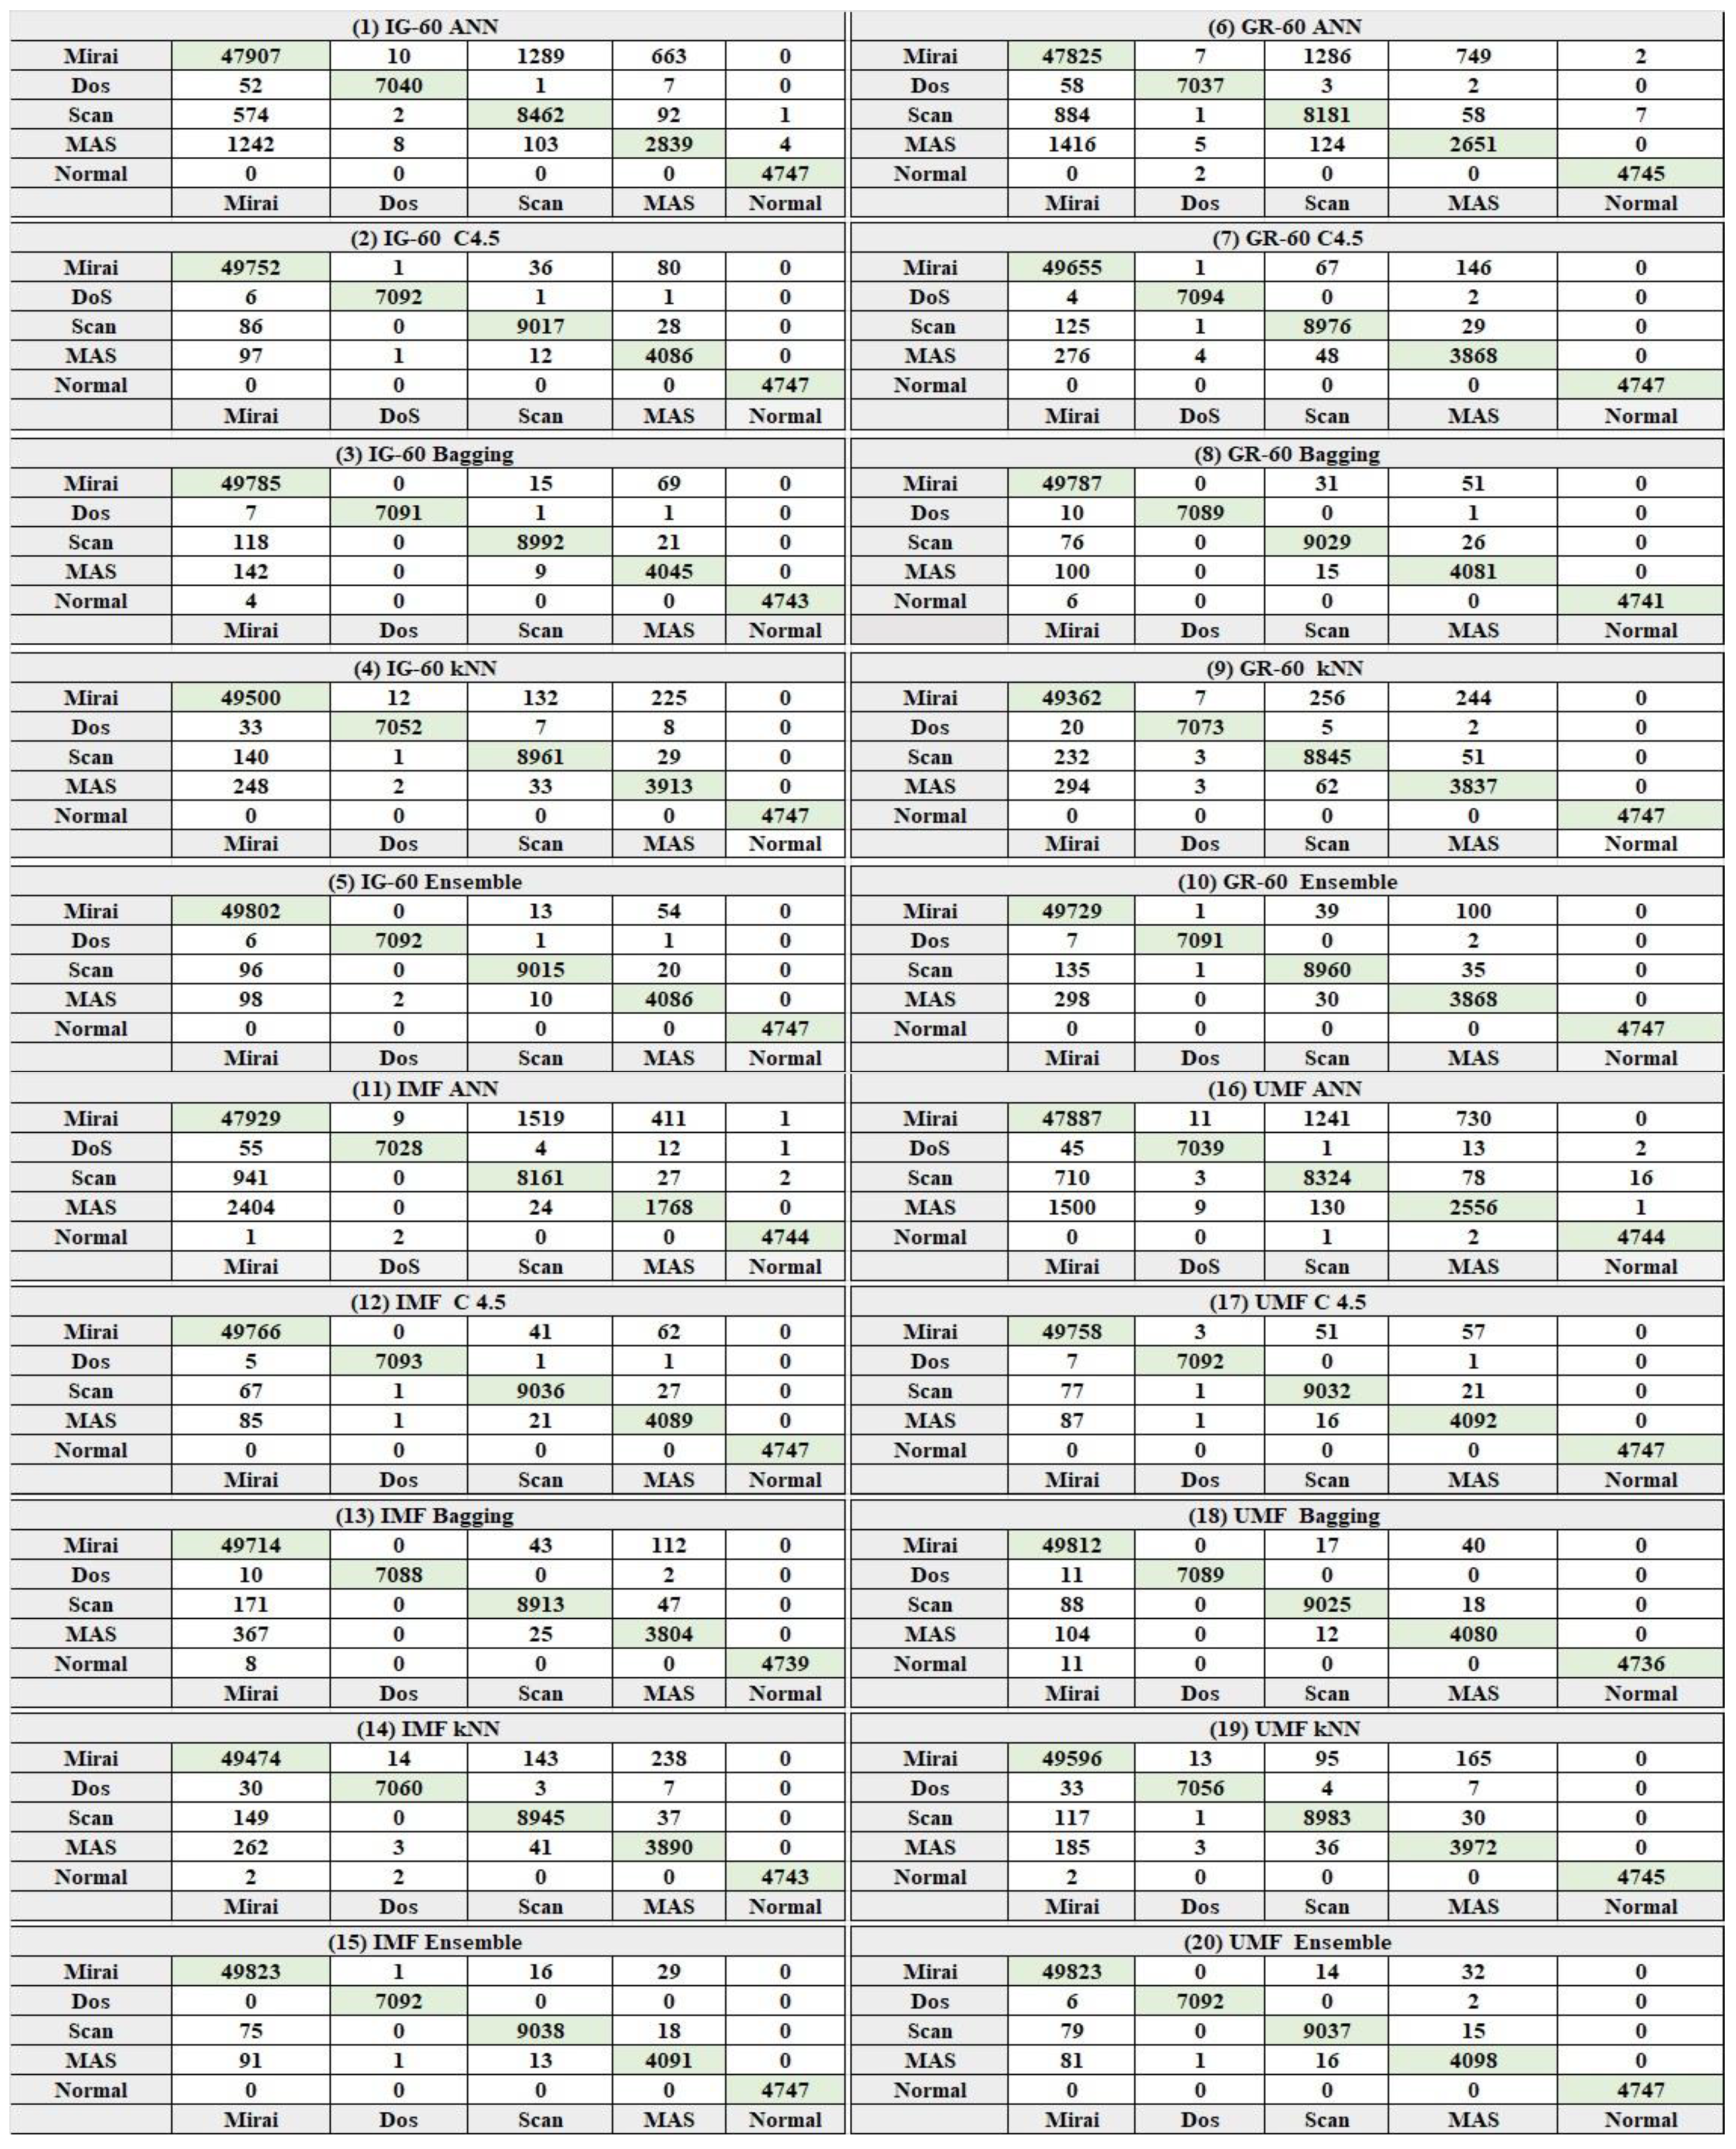
| (A) IG-ANN 60 | (C) IG-Bagging 60 | (E) IG-Ensemble 60 | |||||||||||||||
|---|---|---|---|---|---|---|---|---|---|---|---|---|---|---|---|---|---|
| Parameters | Mirai | Dos | Scan | MAS | Normal | Parameters | Mirai | Dos | Scan | MAS | Normal | Parameters | Mirai | Dos | Scan | MAS | Normal |
| FP Rate | 0.074 | 0 | 0.21 | 0.011 | 0 | FP Rate | 0.011 | 0 | 0 | 0 | 0 | FP Rate | 0.008 | 0 | 0 | 0.001 | 0 |
| Precision | 96.2 | 99.7 | 85.9 | 78.8 | 99.9 | Precision | 99.5 | 100 | 99.7 | 97.8 | 100 | Precision | 99.6 | 100 | 99.7 | 98.2 | 100 |
| Recall | 96.1 | 99.2 | 92.7 | 67.7 | 100 | Recall | 99.8 | 99.9 | 98.5 | 96.4 | 99.9 | Recall | 99.9 | 99.9 | 98.7 | 97.4 | 100 |
| F-Measure | 96.2 | 99.4 | 89.1 | 72.8 | 99.9 | F-Measure | 99.6 | 99.9 | 99.1 | 97.1 | 100 | F-Measure | 99.7 | 99.9 | 99.2 | 97.8 | 100 |
| ROC Area | 97.8 | 99.8 | 96.9 | 75 | 100 | ROC Area | 100 | 100 | 99.9 | 100 | 100 | ROC Area | 99.5 | 99.9 | 99.3 | 98.6 | 100 |
| Accuracy | 96.2 | 99.5 | 89.3 | 73.3 | 100 | Accuracy | 99.7 | 100 | 99.1 | 97.1 | 100 | Accuracy | 99.8 | 100 | 99.2 | 97.8 | 100 |
| (B) IG-C4.5 60 | (D) IG-kNN 60 | ||||||||||||||||
| Parameters | Mirai | Dos | Scan | MAS | Normal | Parameters | Mirai | Dos | Scan | MAS | Normal | ||||||
| FP Rate | 0.008 | 0 | 0.001 | 0.002 | 0 | FP Rate | 0.017 | 0 | 0.003 | 0 | 0 | ||||||
| Precision | 99.6 | 100 | 99.5 | 97.4 | 100 | Precision | 99.2 | 99.8 | 98.1 | 93.7 | 100 | ||||||
| Recall | 99.8 | 99.9 | 98.8 | 97.4 | 100 | Recall | 99.3 | 99.3 | 98.1 | 93.3 | 100 | ||||||
| F-Measure | 99.7 | 99.9 | 99.1 | 97.4 | 100 | F-Measure | 99.2 | 99.6 | 98.1 | 93.5 | 100 | ||||||
| ROC Area | 99.7 | 99.9 | 99.6 | 99.3 | 100 | ROC Area | 98.9 | 99.7 | 99.1 | 96.7 | 100 | ||||||
| Accuracy | 99.7 | 100 | 99.2 | 97.4 | 100 | Accuracy | 99.3 | 99.6 | 98.1 | 93.5 | 100 | ||||||
| (A) GR-ANN 60 | (C) GR-bagging 60 | (E) GR-Ensemble 60 | |||||||||||||||
|---|---|---|---|---|---|---|---|---|---|---|---|---|---|---|---|---|---|
| Parameters | Mirai | Dos | Scan | MAS | Normal | Parameters | Mirai | Dos | Scan | MAS | Normal | Parameters | Mirai | Dos | Scan | MAS | Normal |
| FP Rate | 0.094 | 0 | 0.021 | 0.011 | 0 | FP Rate | 0.022 | 0 | 0.001 | 0 | 0 | FP Rate | 0.017 | 0 | 0 | 0.002 | 0 |
| Precision | 95.3 | 99.8 | 85.3 | 76.6 | 99.8 | Precision | 98.9 | 100 | 99.2 | 95.9 | 100 | Precision | 99.1 | 1 | 99.2 | 96.6 | 100 |
| Recall | 95.9 | 99.1 | 89.6 | 63.2 | 100 | Recall | 99.7 | 99.8 | 97.6 | 90.7 | 99.8 | Recall | 99.7 | 99.9 | 98.1 | 92.2 | 100 |
| F-Measure | 95.6 | 99.4 | 87.4 | 69.3 | 99.9 | F-Measure | 99.3 | 99.9 | 98.4 | 93.2 | 99.9 | F-Measure | 99.4 | 99.9 | 98.7 | 94.3 | 100 |
| ROC Area | 98.2 | 99.4 | 96.9 | 95.7 | 100 | ROC Area | 97.9 | 100 | 99.9 | 99.8 | 100 | ROC Area | 99 | 99.9 | 99 | 96 | 100 |
| Accuracy | 95.6 | 99.5 | 87.5 | 69.9 | 99.9 | Accuracy | 99.3 | 99.9 | 98.4 | 93.3 | 99.9 | Accuracy | 99.4 | 50.5 | 98.7 | 94.4 | 100 |
| (B) GR-C4.5 60 | (D) GR-kNN 60 | ||||||||||||||||
| Parameters | Mirai | Dos | Scan | MAS | Normal | Parameters | Mirai | Dos | Scan | MAS | Normal | ||||||
| FP Rate | 0.016 | 0 | 0.002 | 0.002 | 0 | FP Rate | 0.022 | 0 | 0.005 | 0 | 0 | ||||||
| Precision | 99.2 | 99.9 | 98.7 | 95.6 | 100 | Precision | 98.9 | 99.8 | 96.5 | 92.8 | 100 | ||||||
| Recall | 99.6 | 99.9 | 98.3 | 92.2 | 100 | Recall | 99 | 99.6 | 96.9 | 91.4 | 100 | ||||||
| F-Measure | 99.4 | 99.9 | 98.5 | 93.9 | 100 | F-Measure | 98.9 | 99.7 | 96.7 | 92.1 | 100 | ||||||
| ROC Area | 99.6 | 100 | 99.6 | 98.7 | 100 | ROC Area | 99 | 99.8 | 98.8 | 97.3 | 100 | ||||||
| Accuracy | 99.4 | 99.9 | 98.5 | 93.9 | 100 | Accuracy | 99 | 99.7 | 96.7 | 92.1 | 100 | ||||||
| (A) IMF ANN | (C) IMF Bagging | (E) IMF Ensemble | |||||||||||||||
|---|---|---|---|---|---|---|---|---|---|---|---|---|---|---|---|---|---|
| Parameters | Mirai | Dos | Scan | MAS | Normal | Parameters | Mirai | Dos | Scan | MAS | Normal | Parameters | Mirai | Dos | Scan | MAS | Normal |
| FP Rate | 0.135 | 0 | 0.023 | 0.006 | 0 | FP Rate | 0.008 | 0 | 0.001 | 0 | 0 | FP Rate | 0.007 | 0 | 0 | 0.001 | 0 |
| Precision | 93.4 | 99.8 | 84.1 | 79.7 | 99.9 | Precision | 99.6 | 100 | 99.5 | 98.1 | 100 | Precision | 99.7 | 100 | 99.7 | 98.9 | 100 |
| Recall | 96.1 | 99 | 89.4 | 42.1 | 99.9 | Recall | 99.8 | 99.8 | 98.9 | 97.3 | 99.9 | Recall | 99.9 | 99.9 | 99 | 97.5 | 100 |
| F-Measure | 94.7 | 99.4 | 86.6 | 55.1 | 99.9 | F-Measure | 99.7 | 99.9 | 99.2 | 0.98 | 99.9 | F-Measure | 99.8 | 99.9 | 99.3 | 98.2 | 100 |
| ROC Area | 97.1 | 99.8 | 97.1 | 89.9 | 100 | ROC Area | 100 | 100 | 100 | 99.9 | 100 | ROC Area | 100 | 100 | 100 | 99.9 | 100 |
| Accuracy | 99.8 | 99.9 | 99.3 | 97.9 | 99.9 | Accuracy | 99.4 | 99.6 | 98.5 | 95 | 100 | Accuracy | 99.8 | 100 | 99.4 | 98.2 | 100 |
| (B) IMF C4.5 | (D) IMF kNN | ||||||||||||||||
| Parameters | Mirai | Dos | Scan | MAS | Normal | Parameters | Mirai | Dos | Scan | MAS | Normal | ||||||
| FP Rate | 0.006 | 0 | 0.001 | 0.001 | 0 | FP Rate | 0.018 | 0 | 0.003 | 0 | 0 | ||||||
| Precision | 99.7 | 100 | 99.3 | 97.8 | 100 | Precision | 99.1 | 99.7 | 98 | 93.2 | 100 | ||||||
| Recall | 99.8 | 99.9 | 99 | 97.4 | 100 | Recall | 99.2 | 99.4 | 98 | 92.7 | 99.9 | ||||||
| F-Measure | 99.7 | 99.9 | 99.1 | 97.6 | 100 | F-Measure | 99.2 | 99.6 | 98 | 93 | 100 | ||||||
| ROC Area | 99.8 | 100 | 99.7 | 99.2 | 100 | ROC Area | 98.9 | 99.7 | 99 | 96.4 | 100 | ||||||
| Accuracy | 99.8 | 100 | 99.2 | 97.6 | 100 | Accuracy | 99.2 | 99.6 | 98 | 93 | 100 | ||||||
| (A) UMF ANN | (C) UMF bagging | (E) UMF Ensemble | |||||||||||||||
|---|---|---|---|---|---|---|---|---|---|---|---|---|---|---|---|---|---|
| Parameters | Mirai | Dos | Scan | MAS | Normal | Parameters | Mirai | Dos | Scan | MAS | Normal | Parameters | Mirai | Dos | Scan | MAS | Normal |
| FP Rate | 0.09 | 0 | 0.021 | 0.012 | 0 | FP Rate | 0.009 | 0 | 0 | 0 | 0 | FP Rate | 0.007 | 0 | 0 | 0.001 | 0 |
| Precision | 95.5 | 99.7 | 85.8 | 75.6 | 99.6 | Precision | 99.6 | 100 | 99.7 | 98.6 | 100 | Precision | 99.7 | 100 | 99.7 | 98.8 | 100 |
| Recall | 96 | 99.1 | 91.2 | 60.9 | 99.9 | Recall | 99.9 | 99.8 | 98.8 | 97.2 | 99.8 | Recall | 99.9 | 99.9 | 99 | 97.7 | 100 |
| F-Measure | 95.8 | 99.4 | 88.4 | 67.5 | 99.8 | F-Measure | 99.7 | 99.9 | 99.3 | 97.9 | 99.9 | F-Measure | 99.8 | 99.9 | 99.3 | 98.2 | 100 |
| ROC Area | 98.2 | 99.7 | 97 | 95.9 | 100 | ROC Area | 100 | 100 | 100 | 97.8 | 100 | ROC Area | 100 | 100 | 100 | 99.9 | 100 |
| Accuracy | 95.8 | 99.4 | 88.5 | 68.3 | 99.8 | Accuracy | 99.8 | 99.9 | 99.3 | 97.9 | 99.9 | Accuracy | 99.8 | 100 | 99.4 | 98.3 | 100 |
| (B) UMF C4.5 | (D) UMF kNN | ||||||||||||||||
| Parameters | Mirai | Dos | Scan | MAS | Normal | Parameters | Mirai | Dos | Scan | MAS | Normal | ||||||
| FP Rate | 0.009 | 0 | 0 | 0.001 | 0 | FP Rate | 0.013 | 0 | 0.002 | 0 | 0 | ||||||
| Precision | 99.6 | 100 | 99.7 | 98.6 | 100 | Precision | 99.3 | 99.8 | 98.5 | 95.2 | 100 | ||||||
| Recall | 99.9 | 99.8 | 98.8 | 97.2 | 99.8 | Recall | 99.5 | 99.4 | 98.4 | 94.7 | 100 | ||||||
| F-Measure | 99.7 | 99.9 | 99.3 | 97.9 | 99.9 | F-Measure | 99.4 | 99.6 | 98.4 | 94.9 | 100 | ||||||
| ROC Area | 100 | 100 | 100 | 99.9 | 100 | ROC Area | 99.2 | 99.7 | 99.2 | 97.4 | 100 | ||||||
| Accuracy | 99.8 | 99.9 | 99.3 | 97.9 | 99.9 | Accuracy | 99.4 | 99.6 | 98.5 | 95 | 100 | ||||||
| Reference | Model | Accuracy (%) | Precision (%) | Recall (%) | F1-Measure (%) |
|---|---|---|---|---|---|
| [53] | SVM | 40 | 55 | 37 | 16 |
| [53] | Ensemble | 87 | 87 | 87 | 87 |
| [54] | SVM | 97 | - | - | - |
| [54] | Ensemble | 94 | - | - | - |
| [54] | SLFN | 98 | - | - | - |
| [56] | XGBoost | 99.79 | - | 98 | 1 |
| [56] | SVM | 98.76 | - | 98.00 | 98.00 |
| Proposed | UMF | 99.98 | 99.90 | 99.90 | 99.90 |
| Proposed | IMF | 99.98 | 99.90 | 99.90 | 99.90 |
| Reference | Model | Accuracy (%) |
|---|---|---|
| [64] | SVM-RBF | 97.2 |
| [64] | MLP-AS | 97.8 |
| [65] | Ensemble Stacking | 81.2 |
| [66] | DAGMM | 88.5 |
| [66] | DAGMM-EIF | 90.5 |
| [68] | GRU | 98.7 |
| [69] | DLNID | 90.7 |
| [70] | GTO-BSA | 95.6 |
| [71] | DLHA | 87.5 |
| [42] | adaptive Ensemble | 85.2 |
| [72] | Standard LSTM | 87.2 |
| [72] | BidLSTM | 91.4 |
| [73] | SVM | 82.4 |
| [74] | ANN | 81.2 |
| Proposed | UMF | 99.8 |
| Proposed | IMF | 99.8 |
| Reference | Model | Accuracy (%) |
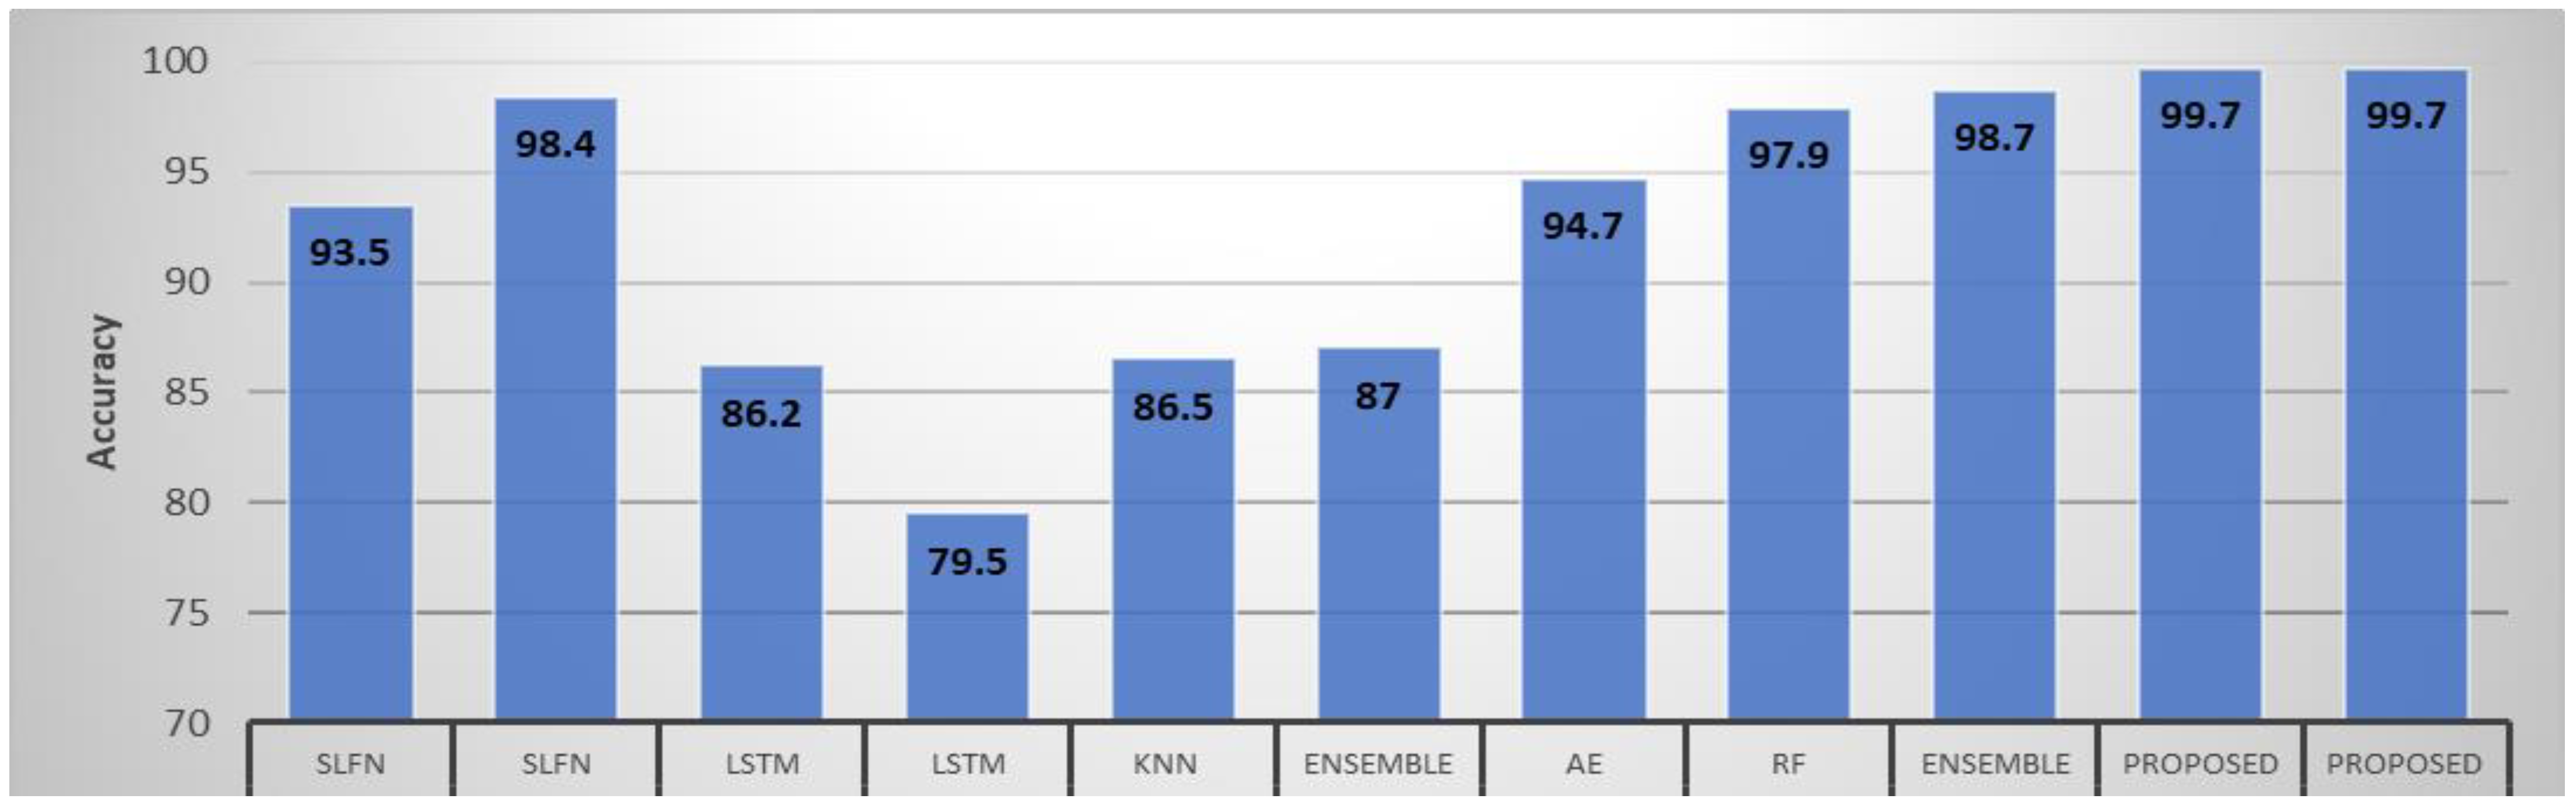
|---|---|---|
| [54] | SLFN-SVM-SMOTE | 93.5 |
| [54] | SLFN | 98.4 |
| [75] | SMOTE + LSTM | 86.2 |
| [75] | LSTM | 79.5 |
| [75] | kNN | 86.5 |
| [53] | Ensemble | 87 |
| [76] | Autoencoder | 94.7 |
| [77] | RF | 97.9 |
| [78] | ensemble | 98.7 |
| Proposed | UMF | 99.7 |
| Proposed | IMF | 99.7 |
Publisher’s Note: MDPI stays neutral with regard to jurisdictional claims in published maps and institutional affiliations. |
© 2022 by the authors. Licensee MDPI, Basel, Switzerland. This article is an open access article distributed under the terms and conditions of the Creative Commons Attribution (CC BY) license (https://creativecommons.org/licenses/by/4.0/).
Share and Cite
Albulayhi, K.; Abu Al-Haija, Q.; Alsuhibany, S.A.; Jillepalli, A.A.; Ashrafuzzaman, M.; Sheldon, F.T. IoT Intrusion Detection Using Machine Learning with a Novel High Performing Feature Selection Method. Appl. Sci. 2022, 12, 5015. https://doi.org/10.3390/app12105015
Albulayhi K, Abu Al-Haija Q, Alsuhibany SA, Jillepalli AA, Ashrafuzzaman M, Sheldon FT. IoT Intrusion Detection Using Machine Learning with a Novel High Performing Feature Selection Method. Applied Sciences. 2022; 12(10):5015. https://doi.org/10.3390/app12105015
Chicago/Turabian StyleAlbulayhi, Khalid, Qasem Abu Al-Haija, Suliman A. Alsuhibany, Ananth A. Jillepalli, Mohammad Ashrafuzzaman, and Frederick T. Sheldon. 2022. "IoT Intrusion Detection Using Machine Learning with a Novel High Performing Feature Selection Method" Applied Sciences 12, no. 10: 5015. https://doi.org/10.3390/app12105015