1. Introduction
Breast cancer is one of the most common types of cancer in women and the second leading cause of death worldwide [
1]. As the causes of breast cancer are not determined yet, the key factor in reducing mortality is detecting and diagnosing signs and symptoms at an early stage through clinical examination. Medical ultrasound imaging is the most effective and convenient clinical modality for detecting and differentiating abnormalities in breast tumors because it is safe, non-invasive, non-ionizing, cost-effective, and has real-time displays. Many countries have performed breast ultrasound (BUS) for screening and diagnosing breast cancer in women of appropriate ages.
However, despite its many advantages, BUS has a few drawbacks, such as (1) relatively low imaging quality and contrast compared to other medical imaging modalities, (2) poor reproducibility, and (3) inter-observer variability [
2]. Computer-aided diagnosis (CAD) systems have been proposed to improve the analysis accuracy and overcome the operator dependency in breast cancer detection and classification. In conventional CAD systems, various handcrafted features of a B-mode image, such as the size, shape, position, dimension, and texture pattern, are first extracted through signal processing techniques and then used to classify tumors or mass lesions into pre-defined groups, such as benign and malignant classes. However, the low image quality, contrast, and signal-to-noise ratio owing to speckle noise make these visual features in a B-mode image ambiguous and unclear. Therefore, image analysis in the time (or spatial) domain becomes a challenging task for clinical applications. Thus, quantitative ultrasound (QUS) is studied to understand the different aspects of ultrasonic properties in the spectral domain using ultrasound radiofrequency (RF) signals, which are closely related to the frequency characteristics of soft tissue [
3,
4]. The early-stage CAD systems using machine learning techniques also utilized the abovementioned heuristic and handcrafted features to classify BUS images [
5,
6,
7].
Deep convolutional neural networks (CNNs), which can automatically learn various features from images via a training process with many datasets, have been widely utilized in CAD systems. CNN techniques are beneficial for performing two main clinical tasks in BUS: classification and segmentation [
8,
9,
10]. However, because the number of datasets in BUS images is limited and their sizes are relatively smaller than the general natural image datasets, convolutional deep learning approaches for medical ultrasound applications have difficulties achieving acceptable performance in real clinical analysis.
Data augmentation is used to compensate for the dataset size while avoiding overfitting [
11,
12]. Although image transformation techniques, such as rotating, resizing, flipping, cropping, and adjusting image contrast, are commonly applied to increase the volume of training data, these artificially inflating data are similar to oversampling in signal processing and unable to provide a solution for the limitation of datasets for BUS images. Further, transfer learning with fine-tuning techniques is also adapted for medical imaging areas to compensate for the shortcomings of datasets [
13]. Although many deep neural networks pre-trained with large natural image datasets such as ImageNet [
14] achieve acceptable performance for gray-scale BUS images, more accurate object analysis is necessary for real clinical applications. The low image quality due to speckle noise, ill-defined boundaries of breast masses, and image distortions caused by shadowing or enhancement effects of B-mode images make CNN-based deep learning approaches challenging.
In this study, we proposed an end-to-end CNN framework for BUS image analysis using multiple parametric images generated from ultrasound RF signals. We believe that the main obstacles to deep learning techniques for BUS analysis are the low quality of B-mode images and the limitations of the training datasets. Although the virtue of deep learning techniques is an automatic abstraction or extraction of features from raw data (or signal) through the training process, it is challenging to learn some features directly from raw data that are not represented clearly in their original forms because of either the image quality or the size of the training datasets. Therefore, in addition to B-mode images, various other images (called parametric images) generated from raw ultrasound RF signals in the time and spectral domains, which carry information concerning scanned tissue, are applied to the CNN as inputs in the proposed framework.
The multiple parametric images generated from RF signals are (1) entropy image, (2) phase image, (3) traditional B-mode image in the time domain, and (4) attenuation image estimated in the frequency domain. While the entropy and phase images, generated in the time domain, represent microstructural features and anatomical information, respectively, attenuation images provide spectral characteristics of tissue that do not directly appear in a B-mode image but are closely related to the pathological status. Because the idea of multiple parametric images is an extension of data augmentation in a broad sense, it releases the limitation of dataset sizes in medical ultrasound applications while providing complementary information concerning distinct aspects of soft tissue in both the time and spectral domains.
As one set of RF signals scanned from one patient creates multiple parametric images, the proposed end-to-end framework of a deep learning network adapts an ensemble learning scheme for multiple inputs to determine the final decision. Four well-known CNN models, namely VGG-16, ResNet-50, DenseNet-201, and EfficientNetV2-L, were selected as backbone networks. The experimental results of the traditional CNN-based deep learning network using only B-mode images were compared to those of the proposed ensemble architecture with multiple parametric images. Each backbone network is validated using a five-fold cross-validation method owing to the small size of the dataset.
The remainder of this paper is as follows: The following section provides a brief explanation of the dataset and describes its properties. In addition, it presents the signal processing techniques for multiple parametric images (i.e., entropy, phase, and attenuation images) and their properties.
Section 3 describes the proposed end-to-end CNN framework and the training parameters.
Section 4 and
Section 5 present and discuss the experimental results, respectively. Finally,
Section 6 presents the conclusions and future works.
2. Materials and Methods
2.1. OASBUD Dataset
The open access series of breast ultrasonic data (OASBUD) dataset is a publicly available raw RF ultrasonic echo dataset for malignant and benign breast lesions [
15]. Data were collected from 52 malignant and 48 benign lesions in 78 women aged 24–75 years between 2013 and 2015 at the Institute of Oncology in Warsaw, Poland. Each breast lesion provided two orthogonal scans of longitudinal and transversal planes in MATLAB file format.
Data were acquired with Ultrasonix SonixTouch Research ultrasound scanner using an L14-5/38 linear array transducer with a central frequency of 10 MHz. Each scan was composed of 510 echo lines in the lateral direction and used single-focus beamforming. The signal sampling frequency was 40 MHz, and the penetration depth in the axial direction was within 3–5 cm. All malignant lesions were histologically examined using core needle biopsy and breast imaging reporting and data system (BI-RADS) categories, and classes of lesions were provided in addition to the ROI mask of each scan plane.
Figure 1 shows the sample B-mode images obtained from the RF signals of the OASBUD dataset [
16].
2.2. Parametric Images from Radiofrequency Signals
Ultrasound is a ubiquitous medical imaging modality that provides cross-sectional information about the human body. Acoustic waves, insonified by a carrier frequency in the ultrasonic range, are reflected or scattered from the organ boundary or microstructure of the soft tissue, respectively. The received sound waves, known as RF signals, carry information about the scanned body along the axial direction. Several display modes, such as the A-mode, B-mode, and M-mode, represent information according to clinical applications. B-mode imaging is the most common imaging mode that takes envelopes of analytic signals generated from a set of received RF signals and provides anatomical and microstructural information about the scanning area, which is closely related to the echogenicity of the tissue.
Although B-mode imaging visualizes the ultrasound echogenic properties inside the human body, it is challenging to directly analyze and diagnose pathological status from a B-mode image owing to low image quality and artifacts. Recently, CAD systems using CNN-based deep learning techniques have been applied to discriminate breast masses and have achieved good performance compared to experienced sonographers in BUS applications [
17,
18,
19]. However, the size of the available training datasets and the low quality of the B-mode image are the main obstacles for CNN-based deep learning methods in real clinical ultrasound applications. Although the virtue of deep learning is the automatic feature abstraction of input images by itself, there needs to be a breakthrough for relieving the limitation of datasets and image quality in clinical BUS.
The B-mode image generally consists of strong reflections from the organ boundary and relatively weak echo scattering inside the soft tissue. Because a B-mode image is generated from the envelopes of RF signals (the envelopes of the magnitude of analytic signals calculated from RF signals), strong reflections appear as edges or boundaries of tumors showing anatomical information, and weak echoes appear as textual patterns by the interference of scattered waves, which are related to the microstructure of soft tissue in a B-mode image. This is a significant feature of breast US images for differentiating tumors or masses. However, the issue is that the size of the training datasets and ultrasound image quality is not sufficient for deep learning networks to extract meaningful features automatically from given B-mode images alone.
Therefore, in this study, we proposed the use of additional parametric images that represent the distinct properties of soft tissue to diagnose the pathological status from ultrasound RF signals. Because a received RF signal contains rich information about the scanned region along the propagating path, including both the signal amplitude and instantaneous phase information, it can calculate or estimate various useful images (usually called feature maps or parametric images in the research field of medical ultrasound) that carry different tissue properties. If these additional parametric images emphasize or well-represent meaningful properties of soft tissue, such as boundaries, textual patterns, or QUS parameters, they could provide additional information to the deep learning network as extra inputs in addition to traditional B-mode images. In this study, entropy and phase images were utilized to represent visual properties in the time domain and attenuation images to show frequency-dependent characteristics, which is a significant QUS parameter in the spectral domain. The entropy image shows the properties of the textual pattern from the microstructure in a small region, whereas the phase image shows the morphological information, such as the edges and boundaries of a B-mode image, representing anatomical structures. Images representing ultrasound parameters quantitatively, such as an attenuation image, can be called the Q-mode image. The idea of multiple parametric images from raw RF signals for deep learning approaches can be extended to data augmentation in a broad sense and compensates for both limitations of datasets and low image quality simultaneously in medical ultrasound applications.
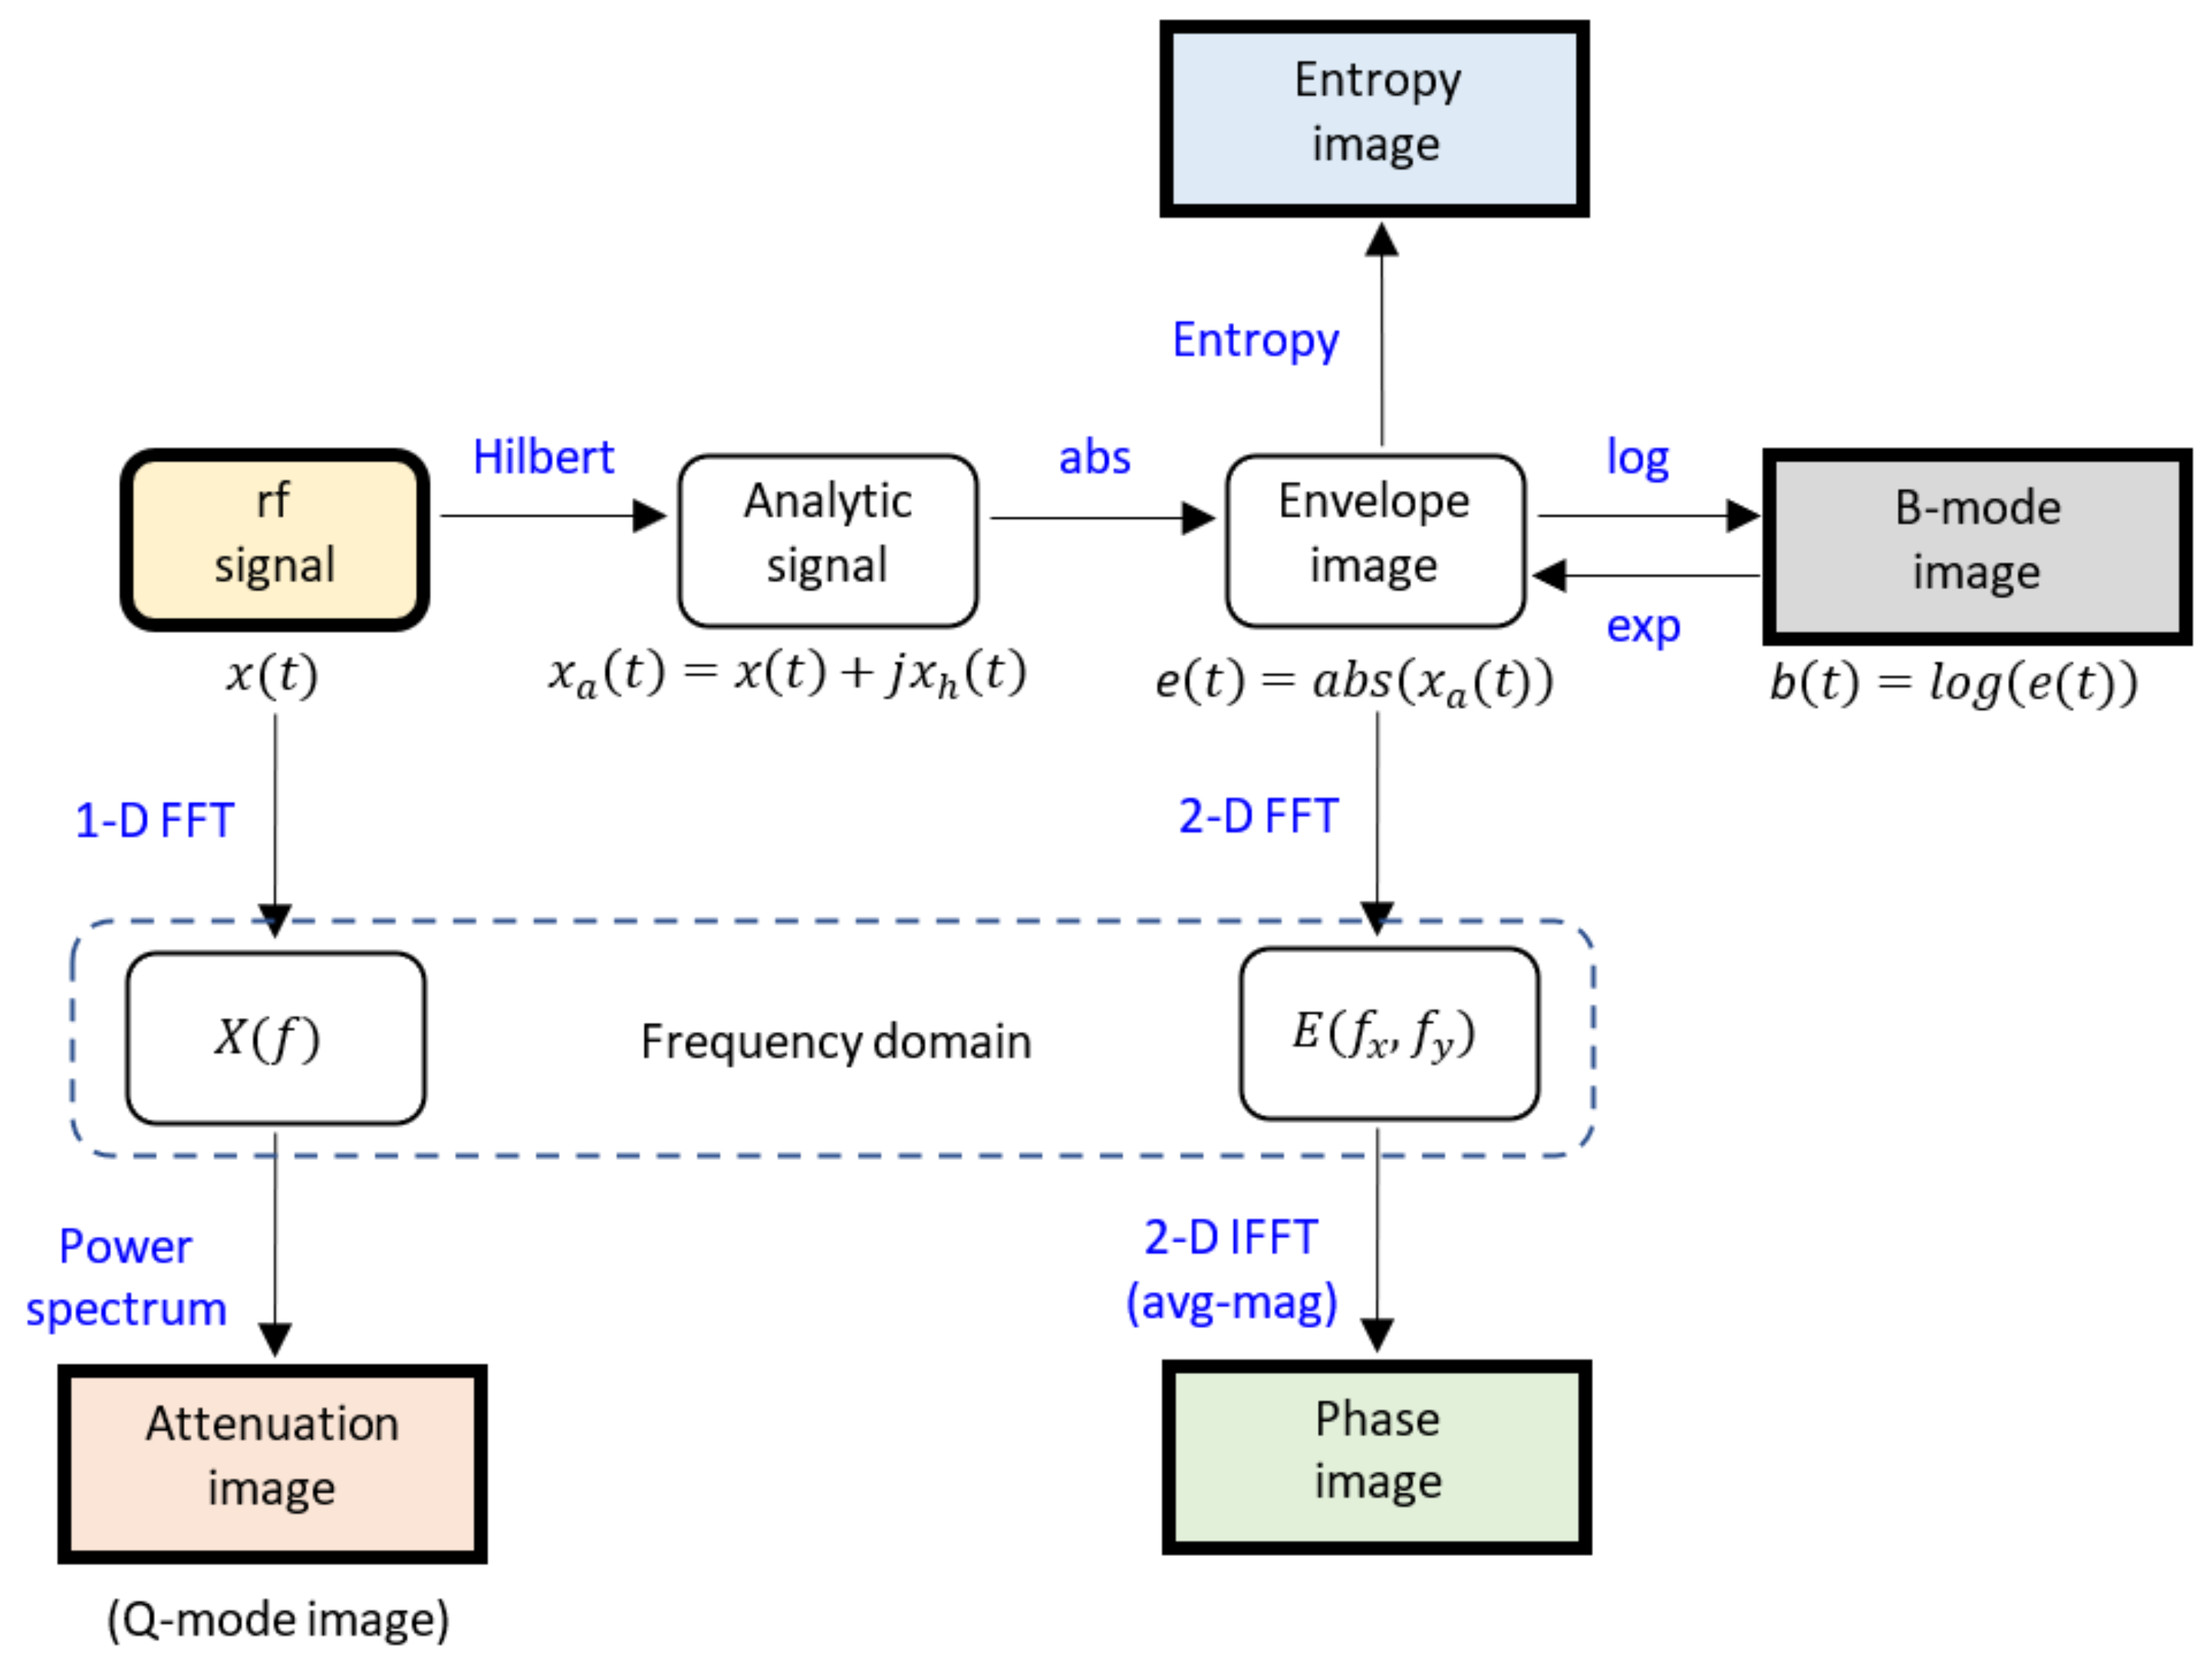
Figure 2 shows the overall signal processing procedures for computing multiple parametric images from the RF signals. While B-mode images are conventionally generated from IQ data, they are also computed from RF signals by taking the Hilbert transform and absolute value followed by log compression. The envelope image before log compression to adjust the wide dynamic range, is an intermediate image that represents the echogenicity of the scanned region by taking only the magnitude of the received RF signals (i.e., ignoring phase information). Using this envelope image, two meaningful parametric images, entropy and phase images, can be obtained by signal processing and transformation techniques. In addition, attenuation images are estimated from raw RF signals through FFT and power spectrum analysis and applied to a deep learning network as an input representing a spectral feature in the frequency domain.
The idea of “multiple parametric images” can be extended to other types of feature maps or parametric images, such as Nakagami images in either time (or spatial) or frequency domains, according to the purpose of clinical application. The detailed methods for each parametric image are described in the subsections that follow.
2.2.1. Entropy Image
Entropy is considered a measure of the average uncertainty of a signal in information theory and is defined as a negative summation of the probability of a given signal multiplied by its base 2 logarithm [
20]. Shannon entropy is used widely as a similarity measure in signal processing applications. Hughes first applied Shannon entropy to analyze ultrasound signals [
21]. The Shannon entropy of a discrete random variable
with possible values
is defined as follows:
where
represents the probability distribution function.
In this study, an entropy image was calculated using an envelope image by moving a small window through the entire image area. All pixel values in the square window were used to establish the probability density function, and the entropy was calculated at the center of the window using Equation (1). This procedure was repeated in both the axial and lateral directions, with a fixed overlap ratio. The size of the window was set to three times the pulse length to obtain a stable statistical parameter of entropy [
22], and the overlap ratio of the window was set to one-tenth of the axial length to obtain fine spatial resolution. The entropy image represents the characteristics of the textual patterns inside a small region, which is closely related to the local microstructure of the scanning area.
Figure 3a,b show the sample B-mode and entropy images generated from the RF signals.
2.2.2. Phase Image
The spectral representation of data generally provides distinct characteristics of the information carried by a signal in a different domain instead of a time (or spatial) domain. Fourier transformation is the most widely utilized technique to represent a time-varying signal in the frequency domain and provides information about the magnitude and phase in every frequency component. While the magnitude of the Fourier transformation contains the overall properties of the time-varying signal’s behavior, the phase information preserves other significant features, including the instantaneous change in signal behavior. Oppenheim and Lim first addressed the importance of phase information [
23], and Ni and Huo also proved the characteristics of phase information from a statistical perspective [
24]. The phase information of an incident wave in particular carries spatial information, such as edges or boundaries, which is preserved for phase-only reconstruction.
In this study, a phase image was obtained from the same envelope image as an entropy image, which is technically the phase-only reconstructed image. It was reconstructed by taking the inverse FFT with the original phase information of the individual envelope image and the average magnitude information of the entire dataset. Because the individual RF signals in the dataset used in this experiment had the same lateral size but different axial sizes, the FFT was performed with a sufficiently large data point first, and further, the reconstructed image was re-sampled to its original size after inverse FFT. Entropy and phase images are also calculated from a B-mode image instead of an envelope image. However, we utilized the envelope image to obtain two parametric images because an envelope image is undistorted by log compression for human visualization.
Figure 3c shows the sample phase image generated from the RF signals.
2.2.3. Attenuation Image
QUS in soft tissue deals with various ultrasonic parameters estimated from reflected RF signals, including backscatterer size [
25], distribution of integrated backscatterers [
26], and speed of sound [
27]. Attenuation is one of the most significant features of soft tissues and provides beneficial diagnostic information related to the pathological status of the scanned tissue. Because attenuation in soft tissues generally demonstrates a linear frequency dependence [
28,
29], many estimation methods have been developed using this assumption through linear fitting techniques for the center frequency changes along the axial direction.
For time-domain approaches, the measurement of zero crossing of the received RF signals [
30] and the entropy difference between two adjacent segments of narrowband echo signals [
31] were utilized to estimate the attenuation properties. In the frequency domain, spectral difference approaches [
32,
33] calculate the amplitude decay of the backscattered RF signals, while spectral shift approaches [
34,
35] estimate the downshift of the center frequency from a normalized power spectrum along with the propagation depth. To compensate for the diffraction of focused acoustic waves, the hybrid method was proposed that used the reference phantom to leverage the advantages of the spectral difference and spectral shift algorithms [
36].
In this study, attenuation images were estimated by downshifting the center frequencies of small regions along the propagation path. The entire RF signal is divided into small 2-D overlapping blocks to calculate the power spectrum. The window size should be large enough to satisfy the stationary assumption of the attenuation property and small enough to provide sufficient spatial resolution for the final attenuation image. In this experiment, the window size was set as 5 mm × 5 mm and an overlap ratio of 50% was applied to estimate the attenuation image. Each windowed RF signal segment was gated by a Hanning window to diminish the spectral artifacts on both boundaries, and the short-time Fourier analysis [
37] was applied to calculate the block power spectrum. The frequency smoothing method, where adjacent estimated frequencies were averaged using a moving average window, was also utilized to further reduce spectral noises in the block power spectrum.
Because the reference signals for compensating the diffraction effects were not available in the dataset used, the finally estimated attenuation coefficients were not real attenuation coefficients. However, the estimated attenuation features provided meaningful information for the classification task because all data were estimated under the same conditions.
Figure 3d shows the sample attenuation image generated from the RF signals.
2.3. Overall Signal Processing Scheme of RF Signals
In the proposed architecture, one set of RF signals scanned from a single patient generates four parametric images, namely B-mode, entropy, phase, and attenuation images, representing distinct tissue characteristics in either the time or frequency domains.
Figure 4 shows the overall scheme of the multiple parametric images generated from the raw RF signals. The B-mode image is the most common image that provides the echogenicity of the scanned region of the soft tissue and is obtained directly from a set of envelope signals. While the entropy image expresses the local texture patterns related to the microstructural information of the tissue, the phase image shows the morphological information about the anatomical structure of the scanned area. The attenuation image is an example of the Q-mode image used in this work and represents the spectral property of tissue that is not easily visible in the time-domain representation. All the parametric images generated from RF signals represent complementary tissue information and provide rich information to the CNN-based deep learning network in terms of image enhancement and data augmentation.
3. Techniques for CNN-Based BUS Classification Framework
In this section, the techniques of the CNN-based BUS classification framework are explained in detail. First, the specifications of the dataset, including the preprocessing and training methods used in our experiment, are presented. Next, an end-to-end deep learning framework with multiple parametric images is proposed, and the four CNN models used in our experiment are explained. Brief definitions of the performance metrics to compare the prediction results with the traditional CNN-based deep learning network are also summarized.
3.1. Data Preprocessing
Four parametric images, including B-mode, entropy, phase, and attenuation images, were generated from a single set of RF data scanned from one patient. An envelope image (more precisely, envelopes of the magnitude of analytic signals calculated from RF signals shown in
Figure 2) is an important representation of time-domain RF data that produces three distinct parametric images. An attenuation image (which is an example of a Q-mode image) is directly generated from RF signals through the Fourier transform technique to express the spectral properties of soft tissue.
Because the scanning depths in the axial direction of individual RF signals are different, while lateral sizes are the same for all RF data used, all parametric images were resized to 224 × 224 to match the original input size of the CNN backbone networks. To maintain the real aspect ratio of a scanned image, the resized images of smaller axial depths were centered in the axial direction, and black backgrounds were added in the upper and bottom areas. In addition, the grayscale parametric images were duplicated for RGB channels (i.e., 224 × 224 × 3) to avoid modifying the CNN backbone models that are publicly available.
Because the OASBUD dataset consisted of only 200 RF signals, the 5-fold cross-validation method, which divided 80% of the dataset for training and the rest for validation, was used to prevent overfitting. In addition, we shuffled the order of the data to reduce the variances of the experimental results for each fold, while each fold contained the same proportion of malignant and benign data.
The overall algorithm of data preprocessing is shown in Algorithm 1.
| Algorithm 1 Data Preprocessing |
| 1: | Input |
| 2: | Output 5 sets of multiple parametric images |
| 3: | Calculate |
| 4: | for i = 0 to Nsignal − 1 |
| 5: | Generate B-mode image:
|
| 6: | Generate Attenuation image:
|
| 7: | Generate Phase image:
|
| 8: | Generate Entropy image
|
| 9: | Resize all image to (224 × 224 × 3) |
| 10: | Shuffle the order of image |
| 11: | Divide the image into 5 sets, keep the original proportion of each category. |
3.2. CNN-Based Network Architecture
CNN-based deep learning approaches for BUS classifications have been studied widely in recent times. However, our study primarily addressed the use of multiple parametric images generated from single RF data to improve classification performance. Therefore, we selected four popular and well-known CNN models as the backbone network in our experiment: VGG-16, ResNet-50, DenseNet-201, and EfficientNetV2-L, which have already verified their prediction performances using the ImageNet dataset.
VGG-16 [
38] is a variant of the VGG series network with 16 layers. It stacks 3 × 3 convolution layers to increase the nonlinearity and decrease the number of parameters. The increased nonlinearity improves the performance of the decision function. ResNet-50 [
39] is a variant of the ResNet series network with 50 layers. Because there is a vanishing problem of previous layer information in deeper networks, ResNet has a special block called a residual block, which transfers shortcuts from the previous layer to the second layer. With residual blocks, the problem of vanishing gradients for deeper networks has been solved. DenseNet-201 [
40] is a variant of DenseNet series networks, and its layers are connected to all previous layers. Using the dense connection to all layers, DenseNet can improve the feature propagation and reduce the number of parameters while solving the vanishing gradient problem. EfficientNetV2-L [
41] is a variant of the EfficientNetV2 series network. It replaces depth-wise convolutions in the early stage to remove bottlenecks and improve the training speed. These networks achieved top-1 accuracies of 74.4%, 77.15%, 77.42%, and 85.7% when classifying the ImageNet dataset.
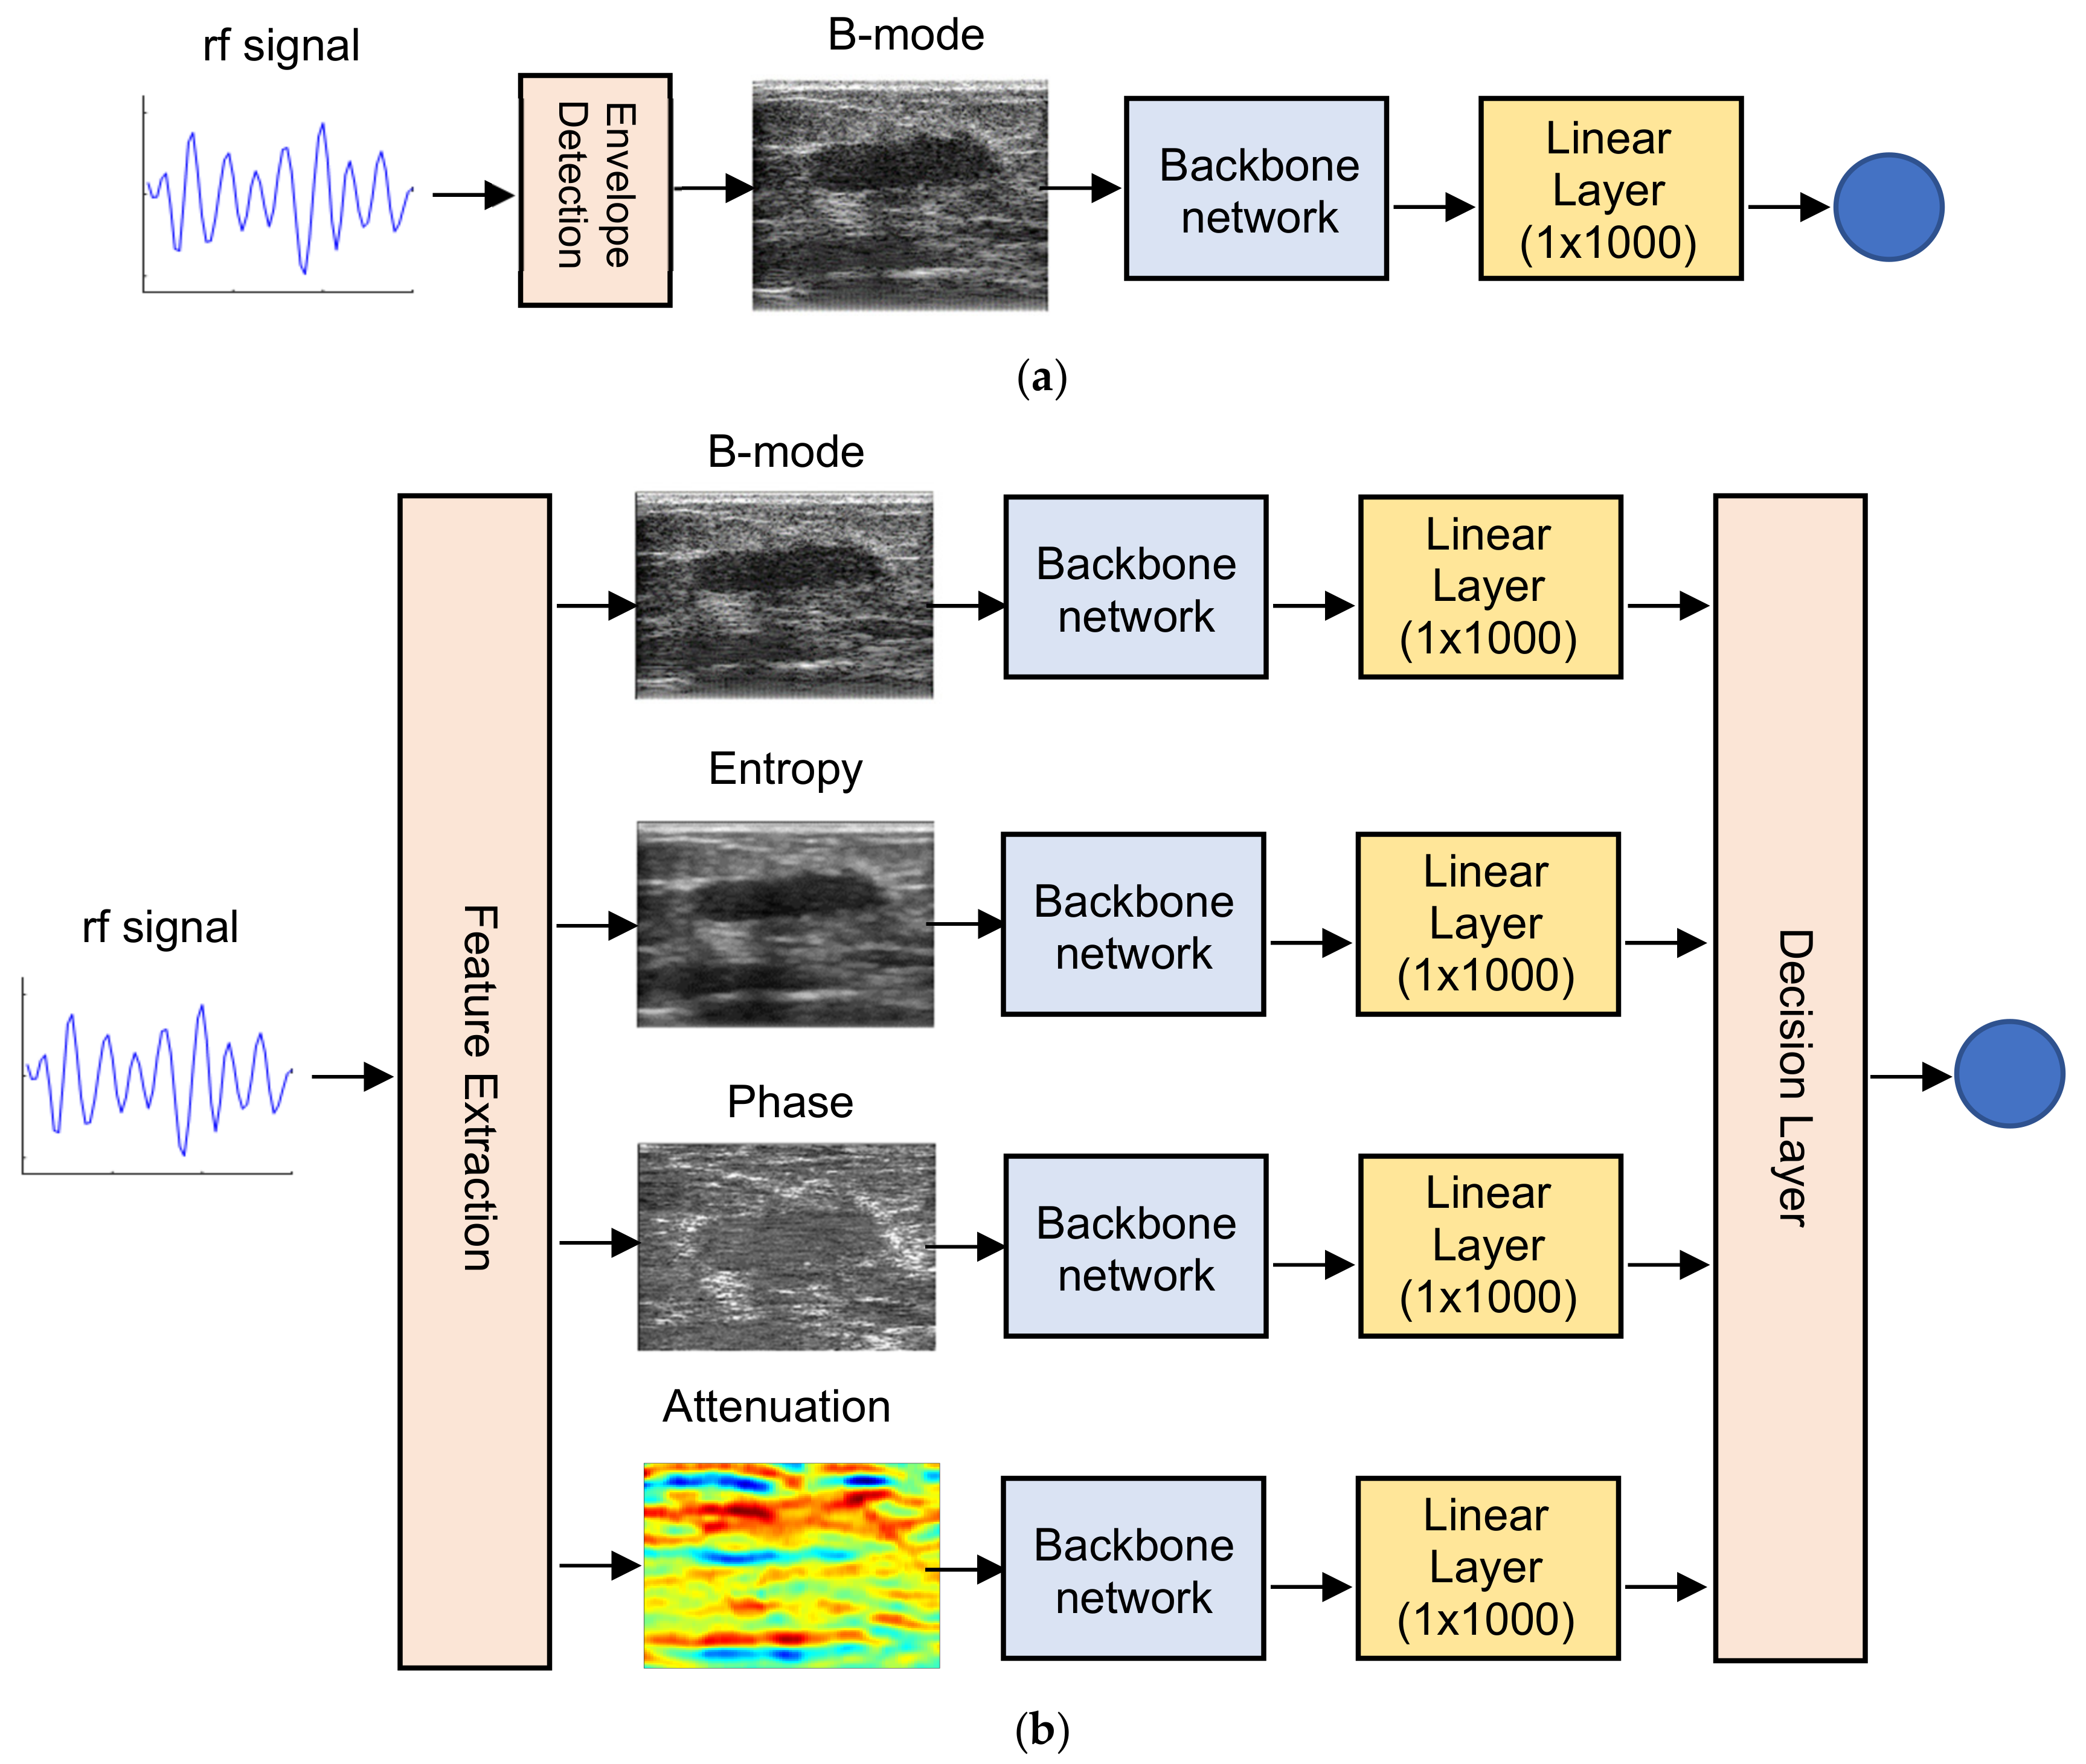
The traditional CNN-based deep learning network and proposed ensemble architecture with multiple parametric images are shown in
Figure 5. For the traditional network using B-mode images, shown in
Figure 5a, one prediction layer was added to the original CNN backbone network for the binary decision between benign and malignant. It is possible to modify the last fully connected (FC) layer of the backbone network to 1 × 2 for binary prediction. However, this could mean losing the advantages of the FC layer owing to the removal of neurons and weights.
The proposed end-to-end architecture of the ensemble network with four parametric images is illustrated in
Figure 5b. Each parametric image had its own CNN backbone network and was trained separately using only one type of parametric image. Each linear layer produced a feature vector of size 1 × 1000, and all four feature vectors were combined in the decision layer to predict the final result. The decision layer used two voting algorithms: uniform and weighted soft voting. While uniform soft voting simply averaged all confidences of individual backbones (or parametric images), weighted soft voting performed a weighted average according to the prediction results in the training process. The weight of each backbone was calculated using the Bayesian optimization method [
42] for the training set of data.
3.3. Training and Evaluation
For the experiment, we used NVIDIA(NVIDIA Corporation, Santa Clara, CA, USA) Tesla P100 and Tesla T4 over the cloud to train and test the convolution networks. Although the GPUs were different, they did not affect the results of CNN classification. However, they affected the training and inference speed of the network. TensorFlow2 (v2.8.0, Google Inc., Mountain View, CA, USA) and Python 3.9 (v3.9.0, Python Software Foundation, Beaverton, OR, USA) were used for implementing the backbone and the proposed networks.
Individual CNN backbones were trained for 30 epochs with a batch size of 8. The Adam optimizer and sigmoid function were used to optimize and predict binary results, respectively. Because we had only two classes, benign or malignant, the binary cross-entropy (BCE) was used as the loss function.
where
represents the correct category of input image and estimated result from the binary classifier, which is the output of the sigmoid function, respectively.
The learning rates of the backbones varied according to the network model owing to their different structures. Training started with initialization of networks randomly. In each fold, we train 30 epochs then validate once. During the training process, the best validation accuracy weights of each fold were saved for later use in inference and voting procedures. Algorithm 2 presents the training procedure of our networks.
| Algorithm 2 Training Procedure |
| 1: | Input 5 sets of multiple parametric images S0, S1, …, S5 |
| 2: | for i = 1 to 4 |
| 3: | Validation set = Si |
| 4: | Training set = S0, S1, …, Si-1, Si+1, …, S4 |
| 5: | Training 30 epochs using training set |
| 6: | Validate using validation set |
| 7: | If validation accuracy is better than before, save model |
After training each backbone network using parametric images, all weights were determined using the Bayesian optimization method [
43] shown in Algorithm 3.
| Algorithm 3 Bayesian Optimization for Weights of Each Domain |
| 1: | Input correct answer y, estimated result of training set , number of iterations N |
| 2: | Output weight vector of classifier |
| 3: | |
| 4: | for i = 1 to N |
| 5: | by optimizing acquisition function over gaussian process:
|
| 6: | Calculate accuracy of weighted voting result a using . |
| 7: | > accuracy of then |
| 8: | and update gaussian process |
We iterated this process 160 times to find the optimal weights for each backbone network, and the final prediction result was calculated using uniform and weighted soft voting in the decision layer. The formulas of two voting methods are as follows:
where
denotes estimated result of each parametric image,
denotes determined weights for estimated result of each parametric images, and N represents number of classifiers.
The performance metrics chosen for this study were accuracy, recall, precision, F1-score, and area under the curve (AUC). These metrics were calculated using true positive (TP), true negative (TN), false positive (FP), and false negative (FN) as variables.
in the AUC equation represents the receiver operating characteristic curve of each model. The formulas for the performance metrics are as follows:
For medical applications, recall and precision scores are as important as accuracy because high FNs may lead patients to a fatal state, while a high FP would make patients useless for further inspections.
4. Results
We first compared the classification performances of the backbone networks, i.e., VGG-16, ResNet-50, DenseNet-201, and EfficientNetV2-L, using individual parametric images separately.
Table 1 shows the results of the accuracy, recall, precision, F1-score, and AUC for various CNN models in terms of parametric images. The best scores of each performance metric are marked in bold for comparison. In this study, we primarily focused on comparing the classification performances in terms of individual parametric images rather than backbone models because the CNN models used in our experiment were not modified or optimized for BUS images.
For the overall behavior, the entropy images exhibited the best classification performance in all network models, and the B-mode images showed the second-best results. Because the B-mode image was generated from an envelope image through log compression to reduce the dynamic range for human vision (as shown in
Figure 2), the original information carried in the RF signals might be lost or distorted in the B-mode image. The entropy image, however, was directly calculated from an envelope image without log compression. Therefore, the reflective properties of the soft tissue were well-preserved for classification.
The phase images showed the best performance in terms of recall scores for all backbone networks, while the accuracies were relatively low. Among TP, FP, TN, and FN, a relatively low FN resulted in a high recall score. Because the high FP and the low TN for the phase images produce low accuracy and precision scores, all performance metrics should be considered to evaluate the classification performance for each parametric image.
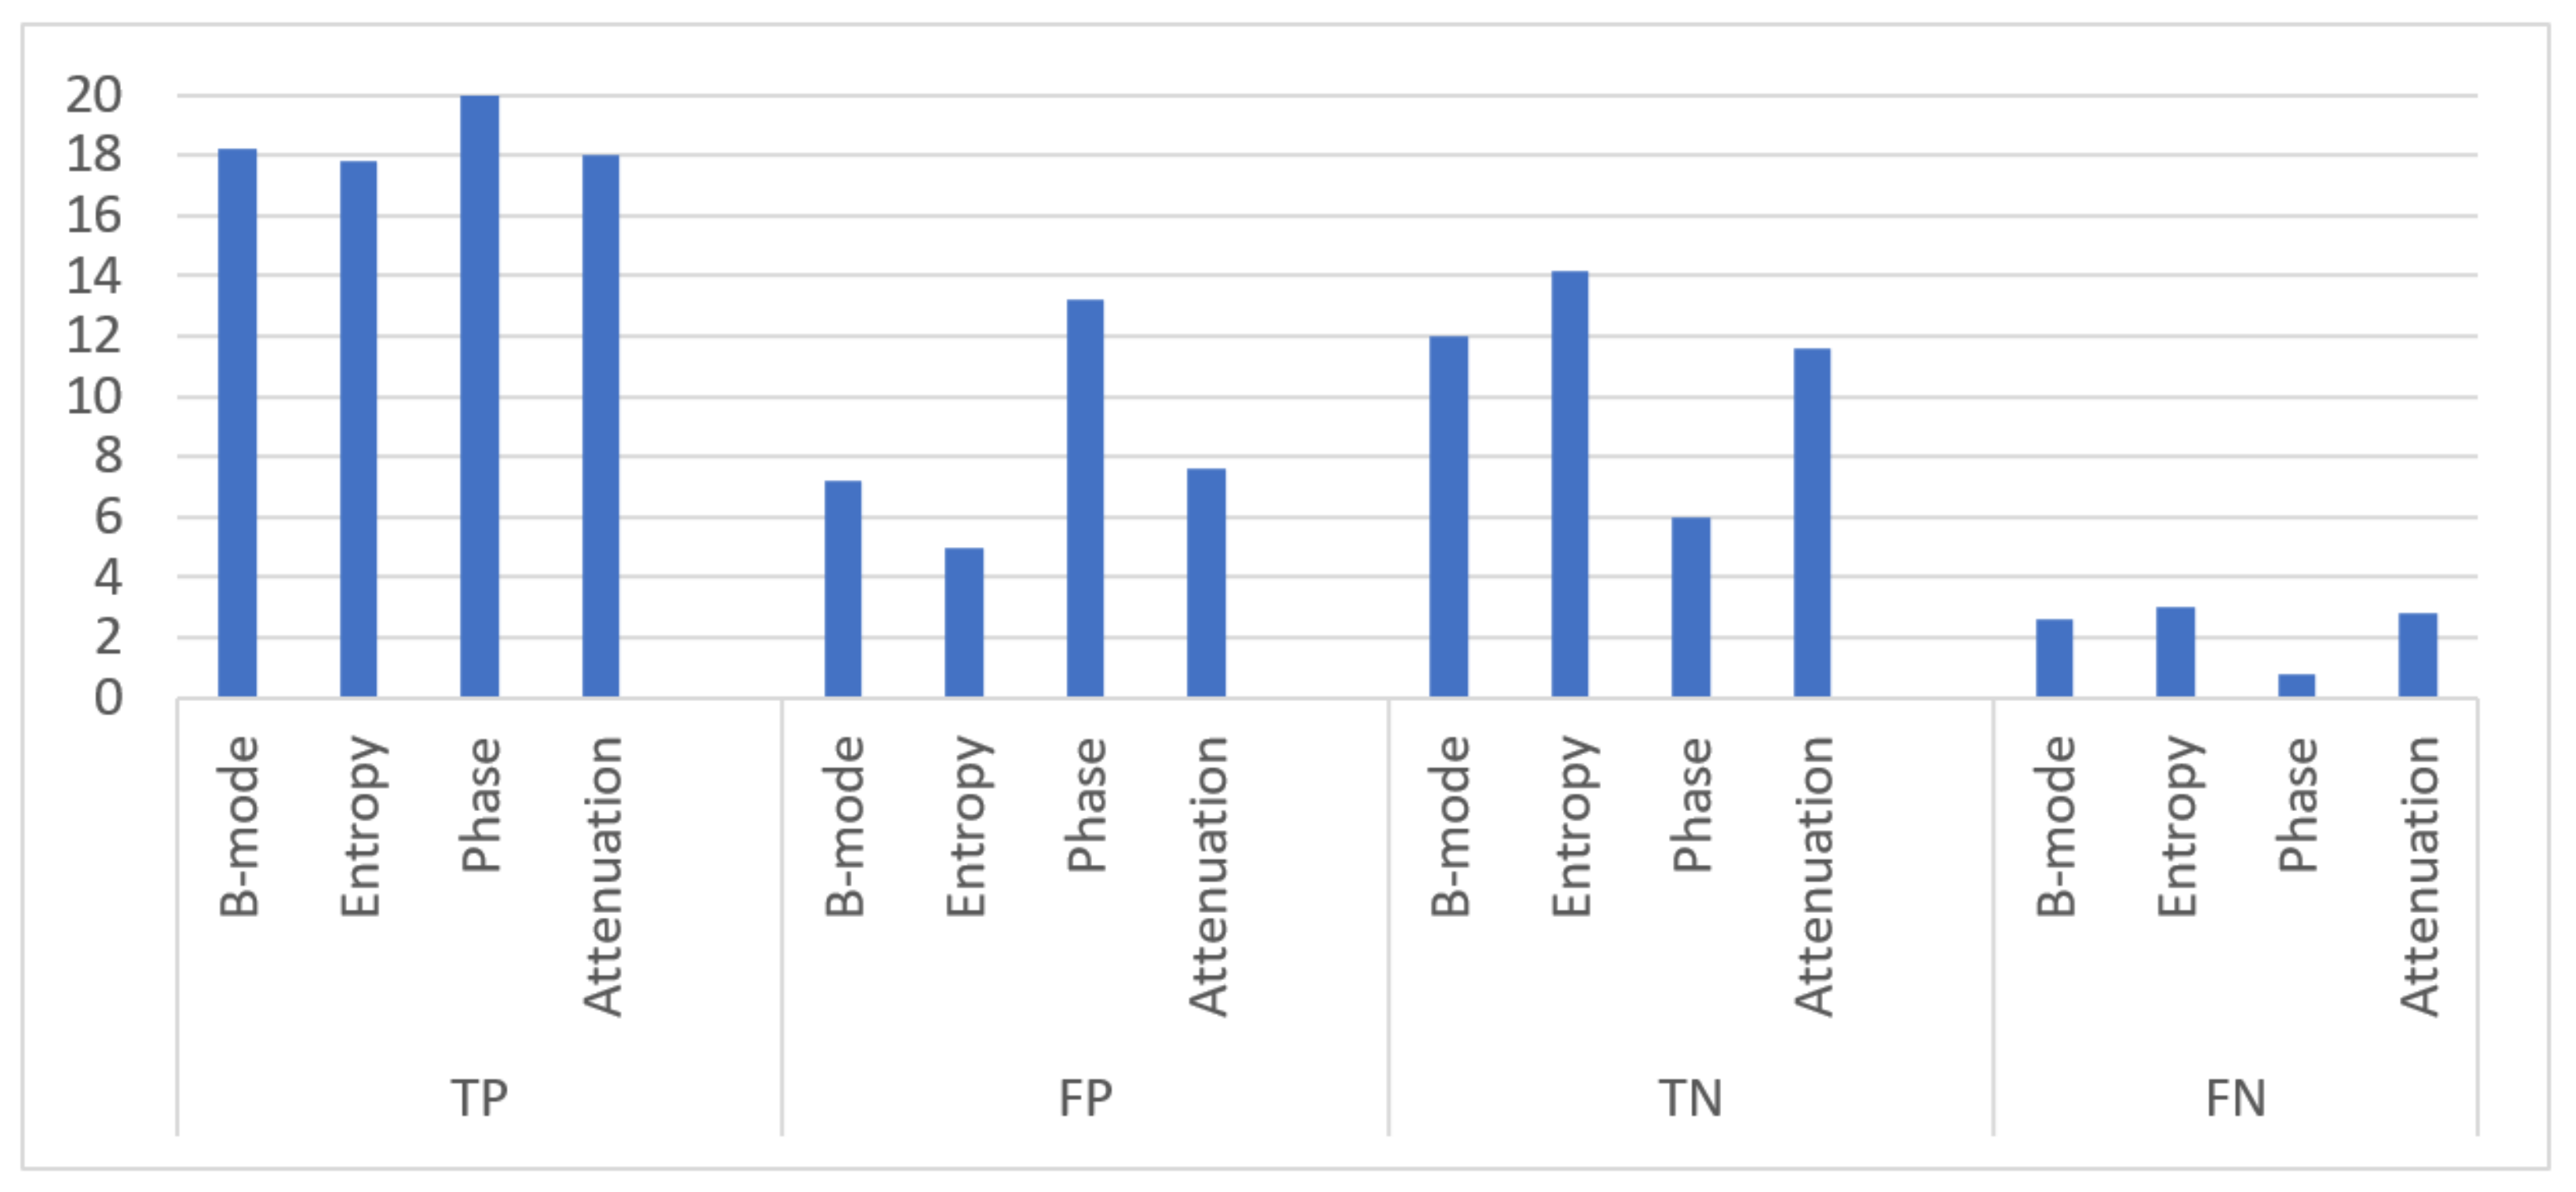
Figure 6 shows the average scores of five-fold experiments using the VGG-16 backbone network. Owing to the extremely low FN score for phase images, the recall score was 96.14%. However, scores of accuracies and precision showed extremely low prediction results with high FP and low TN. Although phase images emphasize the boundaries of organs, the phase-only reconstruction technique with average magnitude, described in
Section 2.2.2, requires further study to improve the classification performance for the use of phase images.
To improve the classification performance, we experimented with the ensemble architecture, shown in
Figure 5b, using multiple parametric images. Two voting methods, namely uniform and weighted soft voting, were applied in the decision layer, and the same performance metrics as in
Table 1 were used.
Table 2 presents the classification results for the two voting methods of the proposed architecture and the results of the B-mode images for comparison purposes.
The proposed ensemble CNN architecture exhibited a better classification performance for all backbone networks than the traditional architecture with B-mode images only. Because other parametric images, such as entropy, phase, and attenuation images, except for the B-mode image, could compensate for a false prediction of the B-mode image alone, the ensemble framework with multiple images generally improved the classification performance in terms of all metrics. The proposed ensemble learning method showed up to 5.5% higher accuracy and 11.6% higher recall scores than the traditional B-mode only method. While the precision scores of the traditional network were slightly better than those of the proposed network, the overall classification performances were improved for both voting algorithms. Regarding the performance differences between the two voting algorithms, both showed similar and comparable prediction results because of the small size of the dataset used. However, the weighted voting method performed better than the uniform voting method because the weights were determined to maximize the prediction results using the Bayesian optimization technique if a larger dataset was available.
5. Discussion
While a set of RF data obtained from a single patient produces various parametric images representing the distinct characteristics of the scanned tissue, no single parametric or B-mode image can provide an outstanding result for the classification task. Therefore, ensemble architecture is significant for improving classification performance. One of the key factors for obtaining better prediction results is the optimal selection of a CNN model for each parametric image. For example, as shown in
Table 1, the DenseNet-201 model exhibited the best accuracy in B-mode images, whereas the VGG-16 model exhibited the best accuracy in entropy images. Because the size of our dataset is diminutive, it is difficult to determine the best CNN model for parametric images in our experiment. However, different CNN models for a specific parametric image might show better performance because each parametric image represents the distinct characteristics of the scanned tissue. Therefore, the ensemble architecture with optimal CNN models for various parametric images could be the next deep learning method for ultrasound analysis.
The ensemble deep learning approaches using multiple inputs have been widely utilized to improve the overall prediction performance in various applications. Spatial and frequency domain models, including three-channel color images and one-hot encoded DCT coefficients, were applied the CNN architecture for steganography classification [
44]. Ensemble deep learning architecture using a deep belief network was proposed for forecasting the load demand time series and exhibited better performance [
45]. The proposed end-to-end ensemble architecture using multiple parametric images in time and spectral domains could be extended to the 1-D time series classification for individual RF signals. This modification not only provides another aspect of the quantitative ultrasound analysis for representing echogenicity along the propagation path, but also generates abundant data for training of deep neural network to prevent overfitting problems.
Another factor for improving the classification performance in an ensemble architecture is the voting algorithm for each prediction result of a parametric image. Hard voting (also known as majority voting) is simple and easy to implement. However, the final prediction is acceptable only when the individual classifier results are relatively comparable. In our experiment, because the accuracies of the B-mode and entropy images were higher than those of the phase and attenuation images, hard voting did not provide better classification performance owing to an imbalance of accuracies. Uniform or weighted soft voting methods are suitable for the classification of BUS, and further studies are required to determine the optimal weights for the combination of parametric images and CNN models. If larger datasets are available, these voting weights are updated in the training process to improve the classification performance of the proposed ensemble architecture.
For the parametric images, the entropy and phase images could be used for data augmentation in a broad sense and utilized by the ensemble CNN architecture as one of the multiple inputs. While ultrasound RF signals for BUS are hardly available, various B-mode images are relatively easy to access from several datasets. The entropy and phase images primarily represent the textual and morphological properties, respectively. Therefore, they can be generated from B-mode images. As explained in the previous section, while B-mode images are visually optimized for humans through log compression, the entropy and phase images from a B-mode image provide meaningful information in the time domain for the classification task. Attenuation images, however, cannot be estimated from a B-mode image. Therefore, further effort is required to collect medical RF datasets in the future to improve the rich analysis of ultrasound information carried by original signals.
6. Conclusions
The recent successes of CNN-based deep learning methods have provided a breakthrough for various areas of medical image analysis including BUS. The low quality of B-mode images and the small size of available training datasets are considered the main obstacles to improving the performances of deep neural network approaches. In this study, we proposed the end-to-end CNN architecture for BUS analysis using multiple parametric images calculated directly from RF signals in both the time (or spatial) and frequency domains. The entropy, phase, and conventional B-mode images were time-domain representations of the reflected RF signals from the scanning region and were closely related to the tissue microstructure, morphology, and echogenicity, respectively. In addition, the attenuation image estimated in the frequency domain exhibited important spectral properties that are difficult to discriminate in a B-mode image.
Multiple parametric images provided a larger training dataset in terms of data augmentation while representing distinct aspects of tissue information carried by RF signals to compensate for low ultrasound image quality. The experimental results showed that the accuracy and recall of the proposed ensemble network using multiple parametric images improved by 5.5% and 11.6%, respectively. In addition, other performance metrics, which are important factors for medical ultrasound applications, were improved. The proposed end-to-end CNN framework can be extended using other parametric images in both the time and frequency domains to improve the performance of the BUS analysis.


