Article

Extraction of Antioxidants from Grape and Apple Pomace: Solvent Selection and Process Kinetics

by
Jorge Garcia-Montalvo
,
Alberto Garcia-Martín
,
Jon Ibañez Bujan
,
Victoria E. Santos Mazorra
,
Pedro Yustos Cuesta
,
Juan M. Bolivar
and
Miguel Ladero
*
FQPIMA Group, Materials and Chemical Engineering Department, Chemical Science School, Complutense University of Madrid, 28040 Madrid, Spain
*
Author to whom correspondence should be addressed.
These authors contributed equally to this work.
Appl. Sci. 2022, 12(10), 4901; https://doi.org/10.3390/app12104901
Submission received: 22 February 2022 / Revised: 5 May 2022 / Accepted: 10 May 2022 / Published: 12 May 2022
(This article belongs to the Special Issue Biowaste Treatment and Valorization)

Abstract

:

Featured Application

Several promising aqueous mixtures are selected for the fast extraction of functional antioxidant mixtures from apple and grape pomaces.

Abstract

Polyphenols have become a research target due to their antioxidant, anti-inflammatory and antimicrobial activity. Obtention via extraction from natural sources includes the revalorization of food wastes such as grape pomace (GP) or apple pomace (AP). In this work, GP and AP were submitted to a liquid–solid extraction using different solvents of industrial interest. Process kinetics were studied measuring the total phenolic content (TPC) and antioxidant capacity (AC), while the extraction liquor composition was analyzed employing chromatographic methods. Extraction processes using water-solvent mixtures stood out as the better options, with a particular preference for water 30%–ethanol 70% (v/v) at 90 °C, a mixture that quickly extracts up to 68.46 mg GAE/gds (Gallic Acid Equivalent per gram dry solid) and 122.67 TEAC/gds (TROLOX equivalent antioxidant capacity per gram dry solid) in case of GP, while ethylene water 10%–ethylene glycol 90% (v/v) at 70 °C allows to reach 27.19 mg GAE/gds and 27.45 TEAC/gds, in the case of AP. These extraction processes can be well-described by a second-order kinetic model that includes a solubility-related parameter for the first and fast-washing and two parameters for the slow mass transfer controlled second extraction phase. AP liquors were found to be rich in quercetin with different sugar moieties and GP extracts highlighted flavonols, cinnamic acids, and anthocyanins. Therefore, using identical extraction conditions for AP and GP and a comparative kinetic analysis of TPC and AC results for the first time, we concluded that ethanol/water mixtures are adequate solvents for polyphenols extraction due to their high efficiency and environmentally benign nature.

1. Introduction

Nowadays, with the growth of the population, the scarcity of natural resources and the necessity of their reuse is one of the main concerns for society and, therefore, for scientists and engineers [1]. This problem is reflected in the United Nations Sustainable Development Goals from Agenda 2030. It can be applied in the first goal, which targets poverty, the second one aiming at zero hunger, and the third one worried about good health and well-being. In addition, the quantity of agro-industrial waste is increasing considerably in recent years, meaning more than 90 million tons of food waste created in the EU each year. This issue is generating an increasing problem of waste management and means a notable inefficiency in terms of water, energy, and food loss [2]. However, those residues, especially agro-food wastes, possess high industrial potential due to the presence of different polysaccharides (cellulose, hemicellulose, and pectin), polymers (lignin, proteins), antioxidant compounds, essential oils, etc. [3]. In the present work, we paid attention to two types of residues of importance in the agro-food sector: grape (GP) and apple pomaces (AP).
Cider production produces a waste called apple pomace. A mixture of pulp, peels, pips, and stems of the whole apple, which is produced in the peeling, slicing, and pressing operations in the production of cider. AP is rich in sugars and in certain types of phenolics such as quercetin. So, although the residue is not very rich in phenolics, the phenolics from AP have high industrial interest. Furthermore, in 2020, worldwide apple production accounted for 86.4 million of tons of waste. However, compared to other fruit wastes such as citrus peels, around 30% of the initial weight is lost in their processing in the case of apples. However, from the total apple production only 30–40% of them are processed for different purposes, principally for juice obtention prior to cider production. In Spain, the annual production in 2020 was of 522,000 metric tons according to FAO statistics [4]. If the aforementioned estimations are considered, apple waste production amounted to 156,000 tons in Spain in that year, which were used for animal feeding and compost production. Additionally, AP has a valuable composition of other polymeric compounds that are the main constituents: cellulose, hemicellulose, pectin, and lignin [5]. These relatively poor added value applications are a waste in the sense of the potential of this biomass as a source of sugars, polysaccharides, and antioxidant molecules. In any case, the recovery of the aforementioned chemicals requires the development of processes that respond to the needs of economical optimisation [6]. AP is, in particular, a natural source of interesting antioxidant molecules and, more specifically, phenolics. In these fruit residues, some examples of the different families of natural phenolics are found: hydroxybenzoic acids, cinnamic acids, and the group of flavonoids. Despite the variety of this kinds of molecules, apple-derived wastes are enriched in particular classes. Flavanols, for instance, catechin and epicatechin and their polymeric derivatives, as well as other abundant flavonoids belong to the flavonols group, which consists mainly of quercetin and its glucosides [7].
In the case of grape residues, they are created during the production of wine. The winemaking industry is the principal beverage industry worldwide according to FAO, reaching a production of 77.8 Mt [4], especially in Italy, Spain, and France [8]. Nearly half of grape production is destined for the winemaking process, predicted to reach 258 million hectoliters in 2020, according to the Organization of Vine and Wine (OIV) [8]. The vinification process is composed of different stages, so a wide variety of residues are produced like grape pomace (GP), grape stalks (GK), grape seeds (GS), wastewater and wine lees (WL), among others. Traditionally, grape-derived byproducts have been employed as dyes or fertilizers, or in the food industry. However, those residues have a higher potential, as all of those residues are rich in added value products such as oils, phenolic acids, and polymers such as cellulose, hemicellulose, or lignin. GP is a residue very rich in antioxidants as it comes from grapes, a natural source of these compounds. This residue is produced after vinification, a fermentation process where a partial extraction process takes place (around 40% of phenolics are extracted from grapes during vinification [9]). Thus, there is still a notable amount of remaining antioxidants in GP. Anthocyanins, flavonols, flavonoids, phenolic acids, and stilbenes are the most important phenolic compounds found in this residue [3].
Polyphenols are secondary metabolites produced by plants as a mechanism of defense with potential applications in the pharmaceutical, cosmetic, and food industries. The particularity of those molecules is their antioxidant activity that provides beneficial actions in human health, as they are able to reduce oxidative stress by donating hydrogen atoms or electrons, preventing atherosclerosis, cardiovascular diseases, acute hypertension, and diverse types of cancer. Those polyphenols are classified in carotenoids and phenolic compounds. The latter are classified in phenolic acids, flavonoids (that includes anthocyanins, flavanols, flavanones, and isoflavones), stilbenes, lignans, and tannins [10].
Polyphenols are obtained via extraction of different plant materials and plant-derived materials and phases, both solid and liquid. Most common methods are solid–liquid extraction, Soxhlet extraction, liquid–liquid extraction or maceration. However, those methods have some drawbacks such as requiring a large volume of extraction, low efficiency, and environmental problems due to the use of organic solvents. To avoid those disadvantages, unconventional methods have been developed: for instance, microwave-assisted extraction, ultrasound assisted extraction, and enzyme-assisted extraction, among others. In this case, the advantages are lower solvent requirements, higher yields, less extraction time, and better reproducibility. Still, unconventional methods have generally a higher cost and more complex operation conditions [6,11].
The aim of this work was to develop fast and efficient extraction processes for both wastes (AP and GP), leading to rich antioxidant liquors, by screening different solvents and conditions and to understand process efficiency by a comparative kinetic analysis of the total phenolic content (TPC) and antioxidant capacity evolution with extraction time. Furthermore, a compositional study was performed with the liquors obtained in the best conditions.

2. Materials and Methods

2.1. Chemicals

Diverse solvents were used as extractants: ethanol, acetone, ethylene glycol, propylene glycol, and choline chloride, all from analytical grade. Other reagents employed include Folin–Ciocalteu’s phenol reagent (analytical grade, Chemical Lab, Belgium), 2,2-diphenyl 1 picrylhydrazyl radical (DPPH) (Analytical grade, Scharlab, Barcelona, Spain), gallic acid (Analytical grade, Sigma-Aldrich, St Louis, MO, USA), Rutin 97% (Acros, Waltham, MA, USA), and sodium carbonate anhydrous (Panreac, Barcelona, Spain). Additionally, formic acid (Scharlab, Barcelona, Spain) and Acetonitrile gradient 240 nM, Far UV (Scharlab, Barcelona, Spain) were employed as mobile phases.

2.2. Residues

Apple pomace (AP) residue from Reineta and Fuji varieties was provided by Covillasa S.A, Zaragoza, Spain. The AP was frozen and stored at −20 °C and thawed for the extraction process.
Grape pomace residue from Vitis vinifera was kindly provided by Pago de Carraovejas (Valladolid, Spain) coming from the 2019 harvest. At the time of reception, the grape samples were frozen at −20 °C and were subsequently freeze-dried using freeze-dryer Virtis Benchtop Pro Dried (Omnitronic, Perth, Australia). Then, samples were crushed using a blender, Moulinex hv2 (Moulinex, Paris, France), and grape seeds were separated. The remaining grape skin and flesh (GP) was ground and sieved, selecting the <1 mm fraction for the extraction experiments, which was subsequently stored at −20 °C.
Before each extraction process, the moisture of the residues was measured employing a moisture analyzer, Kern MLB 50-3N (Kern, Frankfurt am Main, Germany).

2.3. DES Preparation

Choline chloride: EG, a classical deep eutectic solvent (DES) was prepared in a relation molar 1:4 according to Ozturk et al. [12]. Briefly, the appropriate mass of choline chloride (hydrogen acceptor) was weighed and left at 80 °C for 16 h to dry the solid. The ethylene glycol (hydrogen donor) necessary was weighed and heated to 80 °C and the choline chloride was added and mixed until complete dissolution. Finally, the solution was maintained at 80 °C overnight and cooled down afterwards. When the temperature decreased to 30 °C, a 10% (w/w) of water was added to stabilize the solution.

2.4. Extraction Process

In this work, a batch solid–liquid extraction method was employed using different solvents and temperatures. These experiments were carried out in 250 mL round bottom flasks with continuous stirring at 500 r.p.m. and a solid/solvent ratio of 1/40 in the case of GP and 1/20 in the case of AP. The kinetics of the process were followed for one hour. After extraction, the samples were centrifuged at 13,000× g for 5 min and the supernatants were stored at −20 °C in darkness until analysis. All experiments were performed in duplicate.

2.5. Determination of Total Phenolic Content (TPC)

TPC was measured in triplicate according to the Folin–Ciocalteu method as described by Ribeiro et al. [13]. Briefly, 30 µL of the sample’s appropriate dilution was mixed with 1500 µL of MilliQ water and 150 µL of the Folin–Ciocalteu’s reagent. Then, 450 µL of 15% sodium carbonate and 870 µL of MilliQ water were added. The mixture was incubated in the dark at room temperature for 2 h. Afterwards, the absorbance was measured at 765 nm using an UV-vis spectrophotometer V600 Jasco (Tokyo, Japan). Results were expressed as gallic acid equivalents per gram of dry solid (GAE/gds) using a calibration curve between 0 and 500 mg/L of gallic acid. Controls of the different solvents were prepared for each experiment.

2.6. Antioxidant Capacity Determination

Antioxidant capacity was determined employing the DPPH method as described by Ozturk et al. [12] (three times each sample). In this assay, 0.2 mL of each sample was mixed with 3.8 mL of 0.1 mM DPPH diluted in 96% (v/v) ethanol and shaken vigorously. The homogenized mixture was incubated in the dark for 1 h at room temperature. Later, the absorbance was measured at 517 nm using an UV-vis spectrophotometer V600 Jasco (Japan). Solvent controls were prepared for each extraction. Results were expressed in total equivalent antioxidant capacity per gram of dry solid. Standard curves were prepared between 0 and 500 mg/L employing TROLOX diluted in ethanol 70% (v/v) as standard, and the antioxidant activity was expressed as TROLOX equivalent antioxidant capacity per gram dry solid (TEAC/gds).

2.7. Phenolic Compositional Analysis

The chromatographic analysis (HPLC) was performed employing a reversed phase C18 column, 250 mm × 4.6 mm × 0.5 µm (Fortis, Liverpool, UK) using a Jasco series 2000 HPLC modular system, employing a diode array detector (MD-2010). As a mobile phase, a mixture of formic acid 1.5 % (v/v) (phase A) and acetonitrile (phase B) was used while employing a gradient to improve peak separation. The gradient used in the case of AP samples was as follows: From 0 min to 10 min, 98% of A and 2% of B; from 10 min until 55 min, the gradient decreased to 60% of phase A and 40% of phase B; and from 55 min to 65 min there was a gradient decrease until 40% of phase A and 60% of phase B was applied. Finally, from 65 min to 80 min, the mobile phase was composed of 98% of phase A and 2% of phase B to stabilize the column for the next sample.
In the case of GP, the gradient applied was as follows: From 0 min to 5 min, the mobile phase composition was 98% of A and 2% of B; from 5 min to 60 min, there was a gradient decrease until 60% of A and 40% of B was applied; and between 60 min and 70 min, the gradient employed was 20% of A and 80% of B. Again, to stabilize the column, from 70 min to 85 min, a 98% A and 2% B was employed as mobile phase.
For determining the phenolic composition of the most relevant extraction liquors, a LC/MS-MS analysis was performed using a LC-ESI-QTOF (Impact, Bruker, Billerica, MA, USA) and measuring m/z between 100 and 1200, under the chromatographic conditions described for the previous HPLC method.

2.8. Kinetics of Solid–Liquid Extraction

The extraction process kinetics were fitted to an empirical adsorption/desorption model based on the Langmuir adsorption concept as developed by Islam et al. [14]. This second-order model contains three parameters: q0 represents the concentration of adsorbate at zero time, thus showing the effect of waste washing (a very fast dynamic phenomenon due to the dissolution of compounds on or very near to the surface of the waste particles); q1 indicates the concentration of adsorbate liberated in the slow phase, which can be controlled by surface and/or mass transfer phenomena in the pores; and kd, which is the kinetic constant of desorption. Finally, qe represents the concentration of adsorbate in equilibrium in the liquid–solid suspension.
q l = q 0 + q 1 b · t 1 + b 1 · t       being   b = k d · q 1   and   q e = q 0 + q 1  
OriginLab 2019® (OriginLab Corporation, Northampton, MA, USA) was the software employed to perform fitting to this hyperbolic model. Nonlinear fitting was performed employing the Levenberg–Marquardt algorithm [15].
All the results are shown as mean value and standard deviation (SD), being that this last parameter was evaluated by Student’s t-test at 95% confidence. The R-squared parameter was used to evaluate the goodness-of-fit in all cases. A p-value below 0.05 was considered significant [16].

3. Results and Discussion

3.1. Kinetic Study of Extraction Processes

The first step was to perform solid–liquid extractions of the selected residues with different solvents of industrial interest: ethanol, acetone, ethylene glycol, propylene glycol, water, and water:solvent mixtures, as well as a known deep eutectic solvent (choline chloride-ethylene glycol -ChCl:EG- with a molar ratio of 1:4). After the extraction process, the TPC and antioxidant capacity of the samples were measured. The results from the AP extraction are shown in Figure 1, Figure 2, Figure 3, Figure 4, Figure 5 and Figure 6 while the extraction results from the GP extraction are displayed in Figure 7, Figure 8, Figure 9 and Figure 10. In these figures, experimental data is shown as points while the fitting of the empirical second-order kinetic model is displayed as lines.
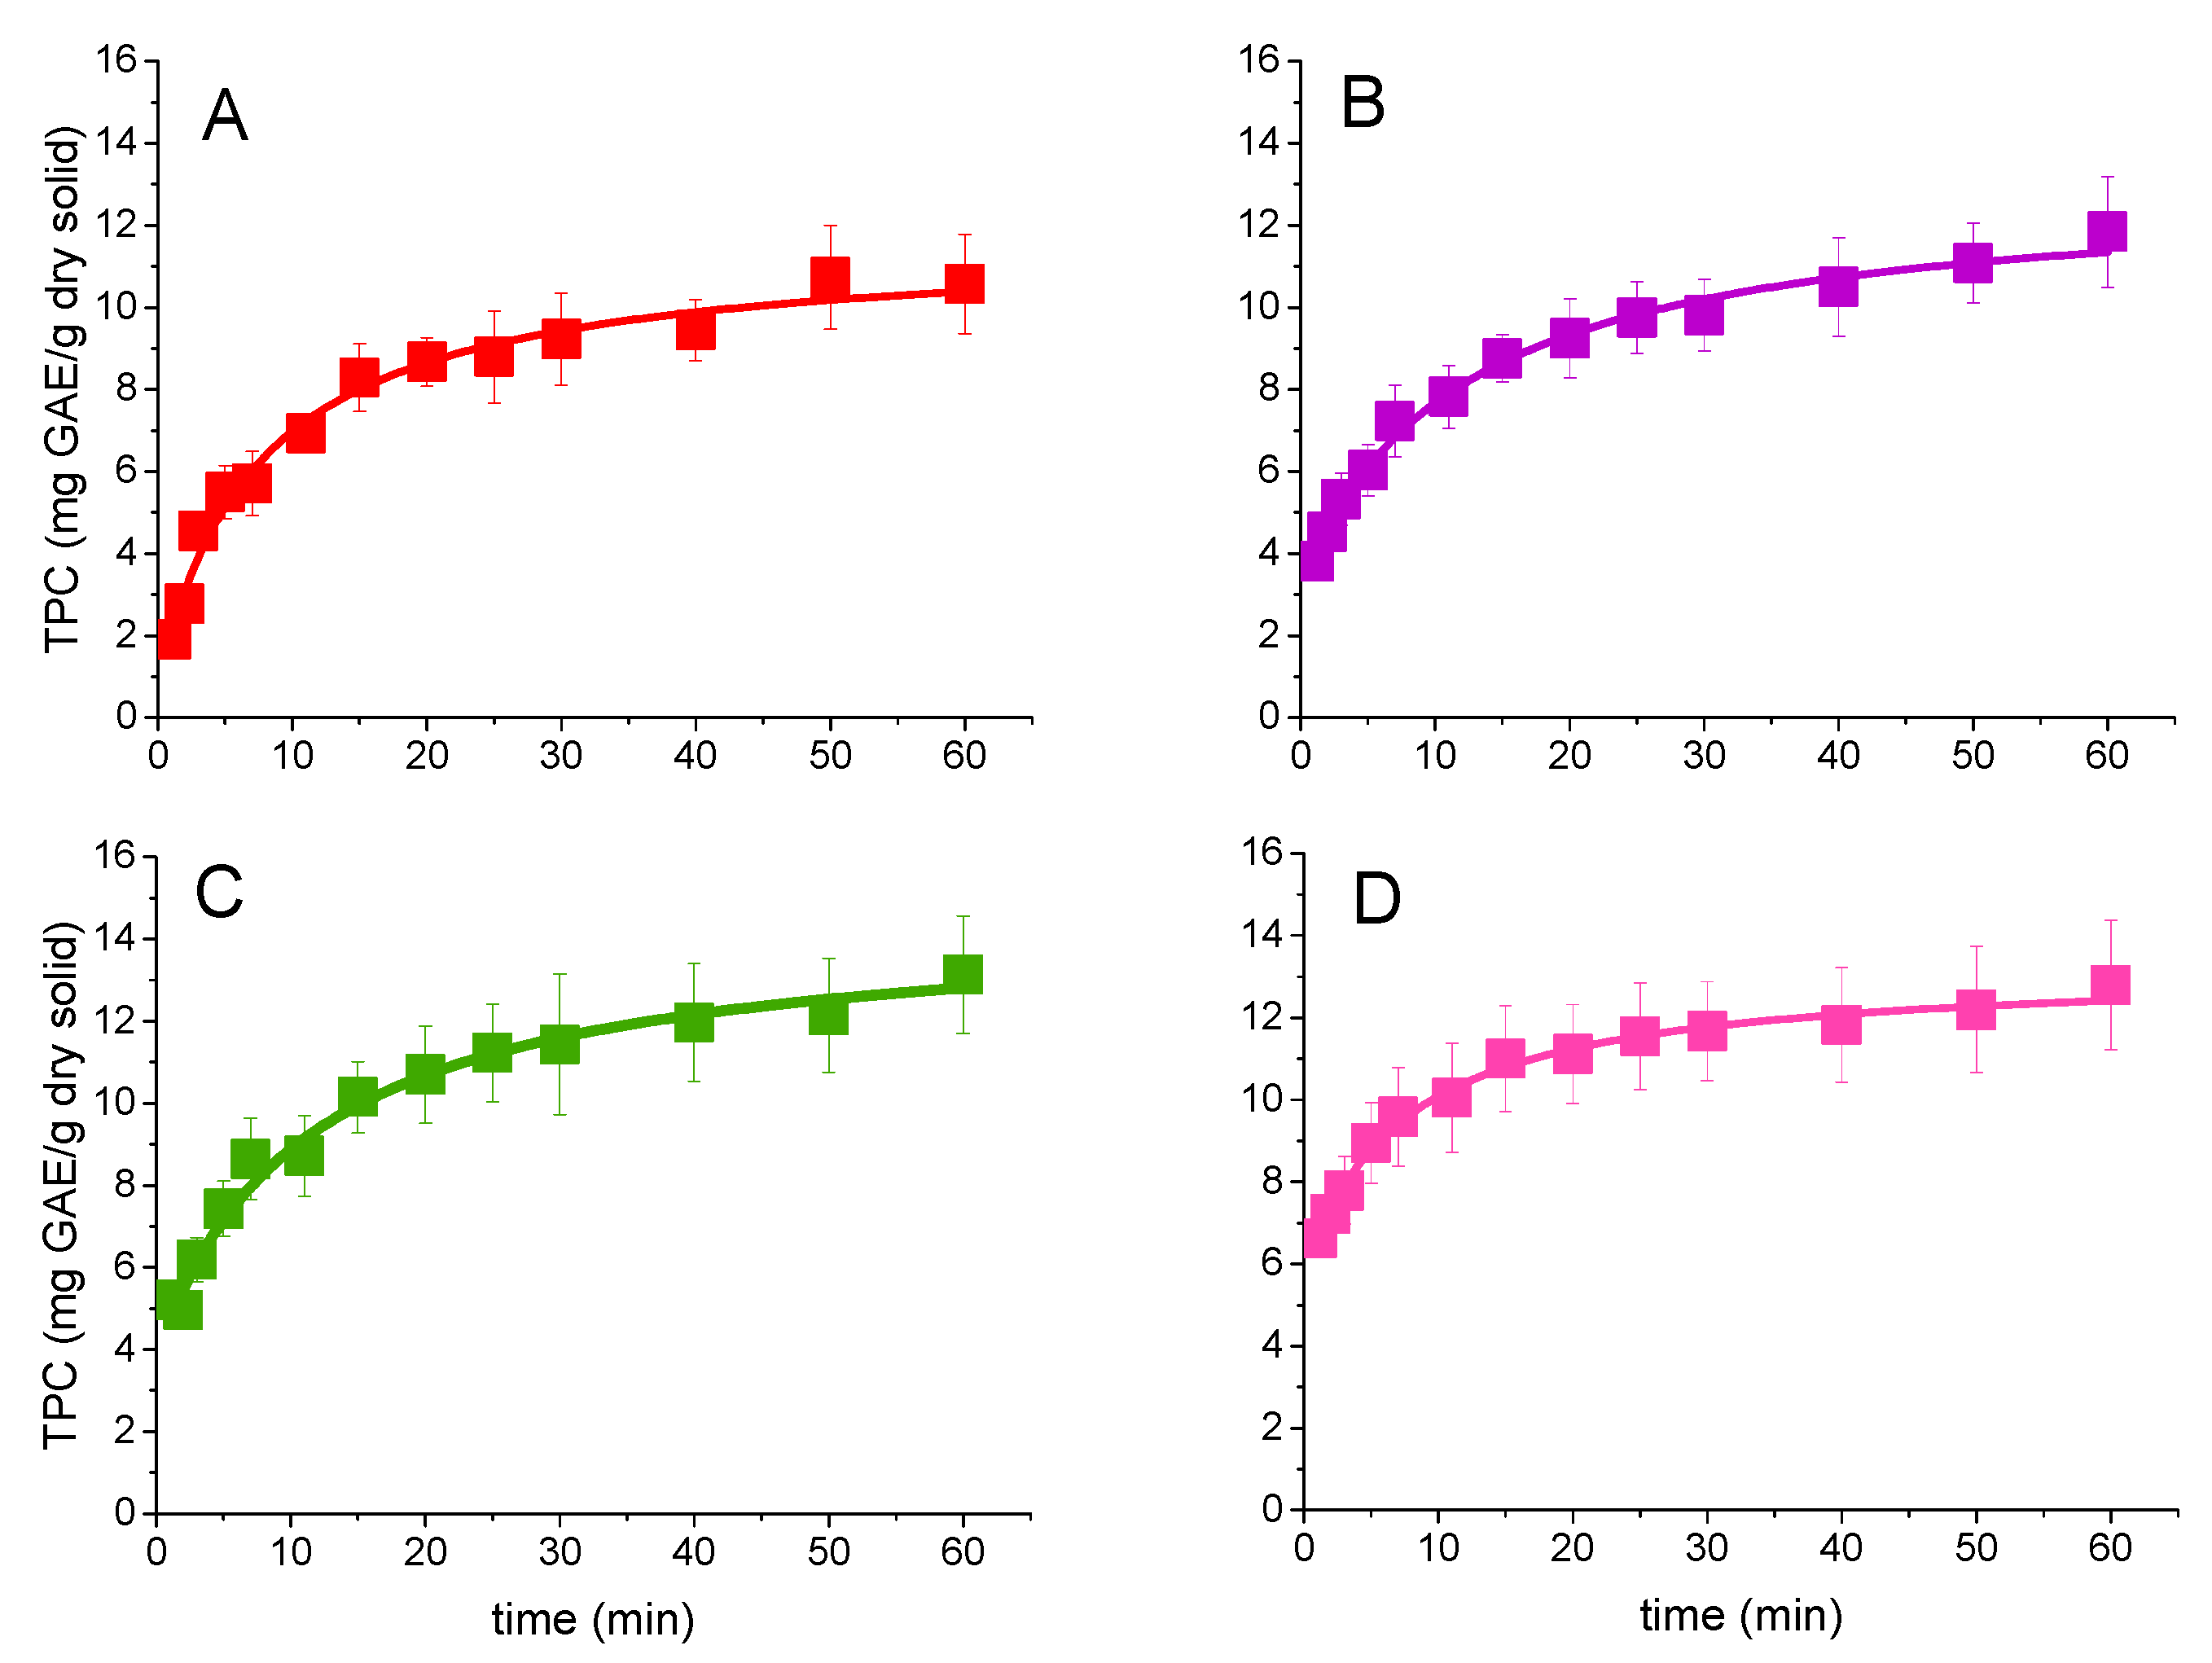
When referring to results for the AP extraction using ethanol 70% (v/v) extraction at several temperatures (Figure 1), final TPC values increase with temperature from 10.57 ± 1.21 mg GAE/gds at the final extraction point (60 min) at 25 °C to 13.13 ± 1.43 mg GAE/g gds at 70 °C, a value that is very similar to the one obtained at 90 °C. The effect of the temperature is also perceived in the initial extraction rate, thus a fast washing of the residue in the first minute leads to 1.8 mg GAE/gds at 25 °C, 3.0 at 50 °C, 4.3 at 70 °C, and 5.7 mg GAE/gds at 90 °C. Considering the analytical method here performed, sampling at particular time values followed by a subsequent spectrophotometric analysis, the dissolution of readily available material on or near the surface of waste particles was so fast that it cannot be followed, thus leading to an apparent value at zero time, as reflected by q0 in the kinetic model or, more visibly, by a perceived TPC value at zero time in Figure 1 (and for this parameter and the antioxidant activity in all other figures). In this case of AP extraction with hydroalcoholic solutions at several temperatures, the increment in TPC at zero time indicates a sharp increase in phenolic solubility with temperature. In fact, this increment is slightly exponential—TPC = 1.18·exp(0.0177·T[°C]); R2 = 0.995, a phenomenon that is also observed for (+)-catechin solubility in water and water–ethanol mixtures in similar temperature intervals [17]. After this fast solubilization, a progressive extraction occurs, reaching values that are maximal at 70 °C. The subsequent reduction in final TPC values observed at higher temperature could be ascribed to pore collapse by dehydration or a similar phenomenon that hinders mass transfer of phenolics out of the porous structure, as an increase in temperature always favors the desorption of the compounds out of the pore inner surface. Alternatively, phenolics degradation due to a relative high temperature usually happens, and affects TPC measurement, as indicated by Sólyom et al. [18]. According to these authors, in the case of grape marc or pomace, polyphenol oxidase can reduce TPC values during the first hour of extraction at temperatures of 80 °C or higher. This deactivation is evident for raw grape marc but does not happen in the case of filtered extracts, suggesting that the phenolic composition is key to the behavior of phenolics under oxidizing conditions at mild–high temperatures.
Figure 1. Results of total phenolic content (TPC) during extraction processes using AP and ethanol/water 70/30 (% v/v) at different temperatures: (A) 25 °C, (B) 50 °C, (C) 70 °C, and (D) 90 °C. Data were obtained by the Folin–Ciocalteu method. Kinetic analysis corresponding to the second-order kinetic model is displayed as lines.
Applsci 12 04901 g001
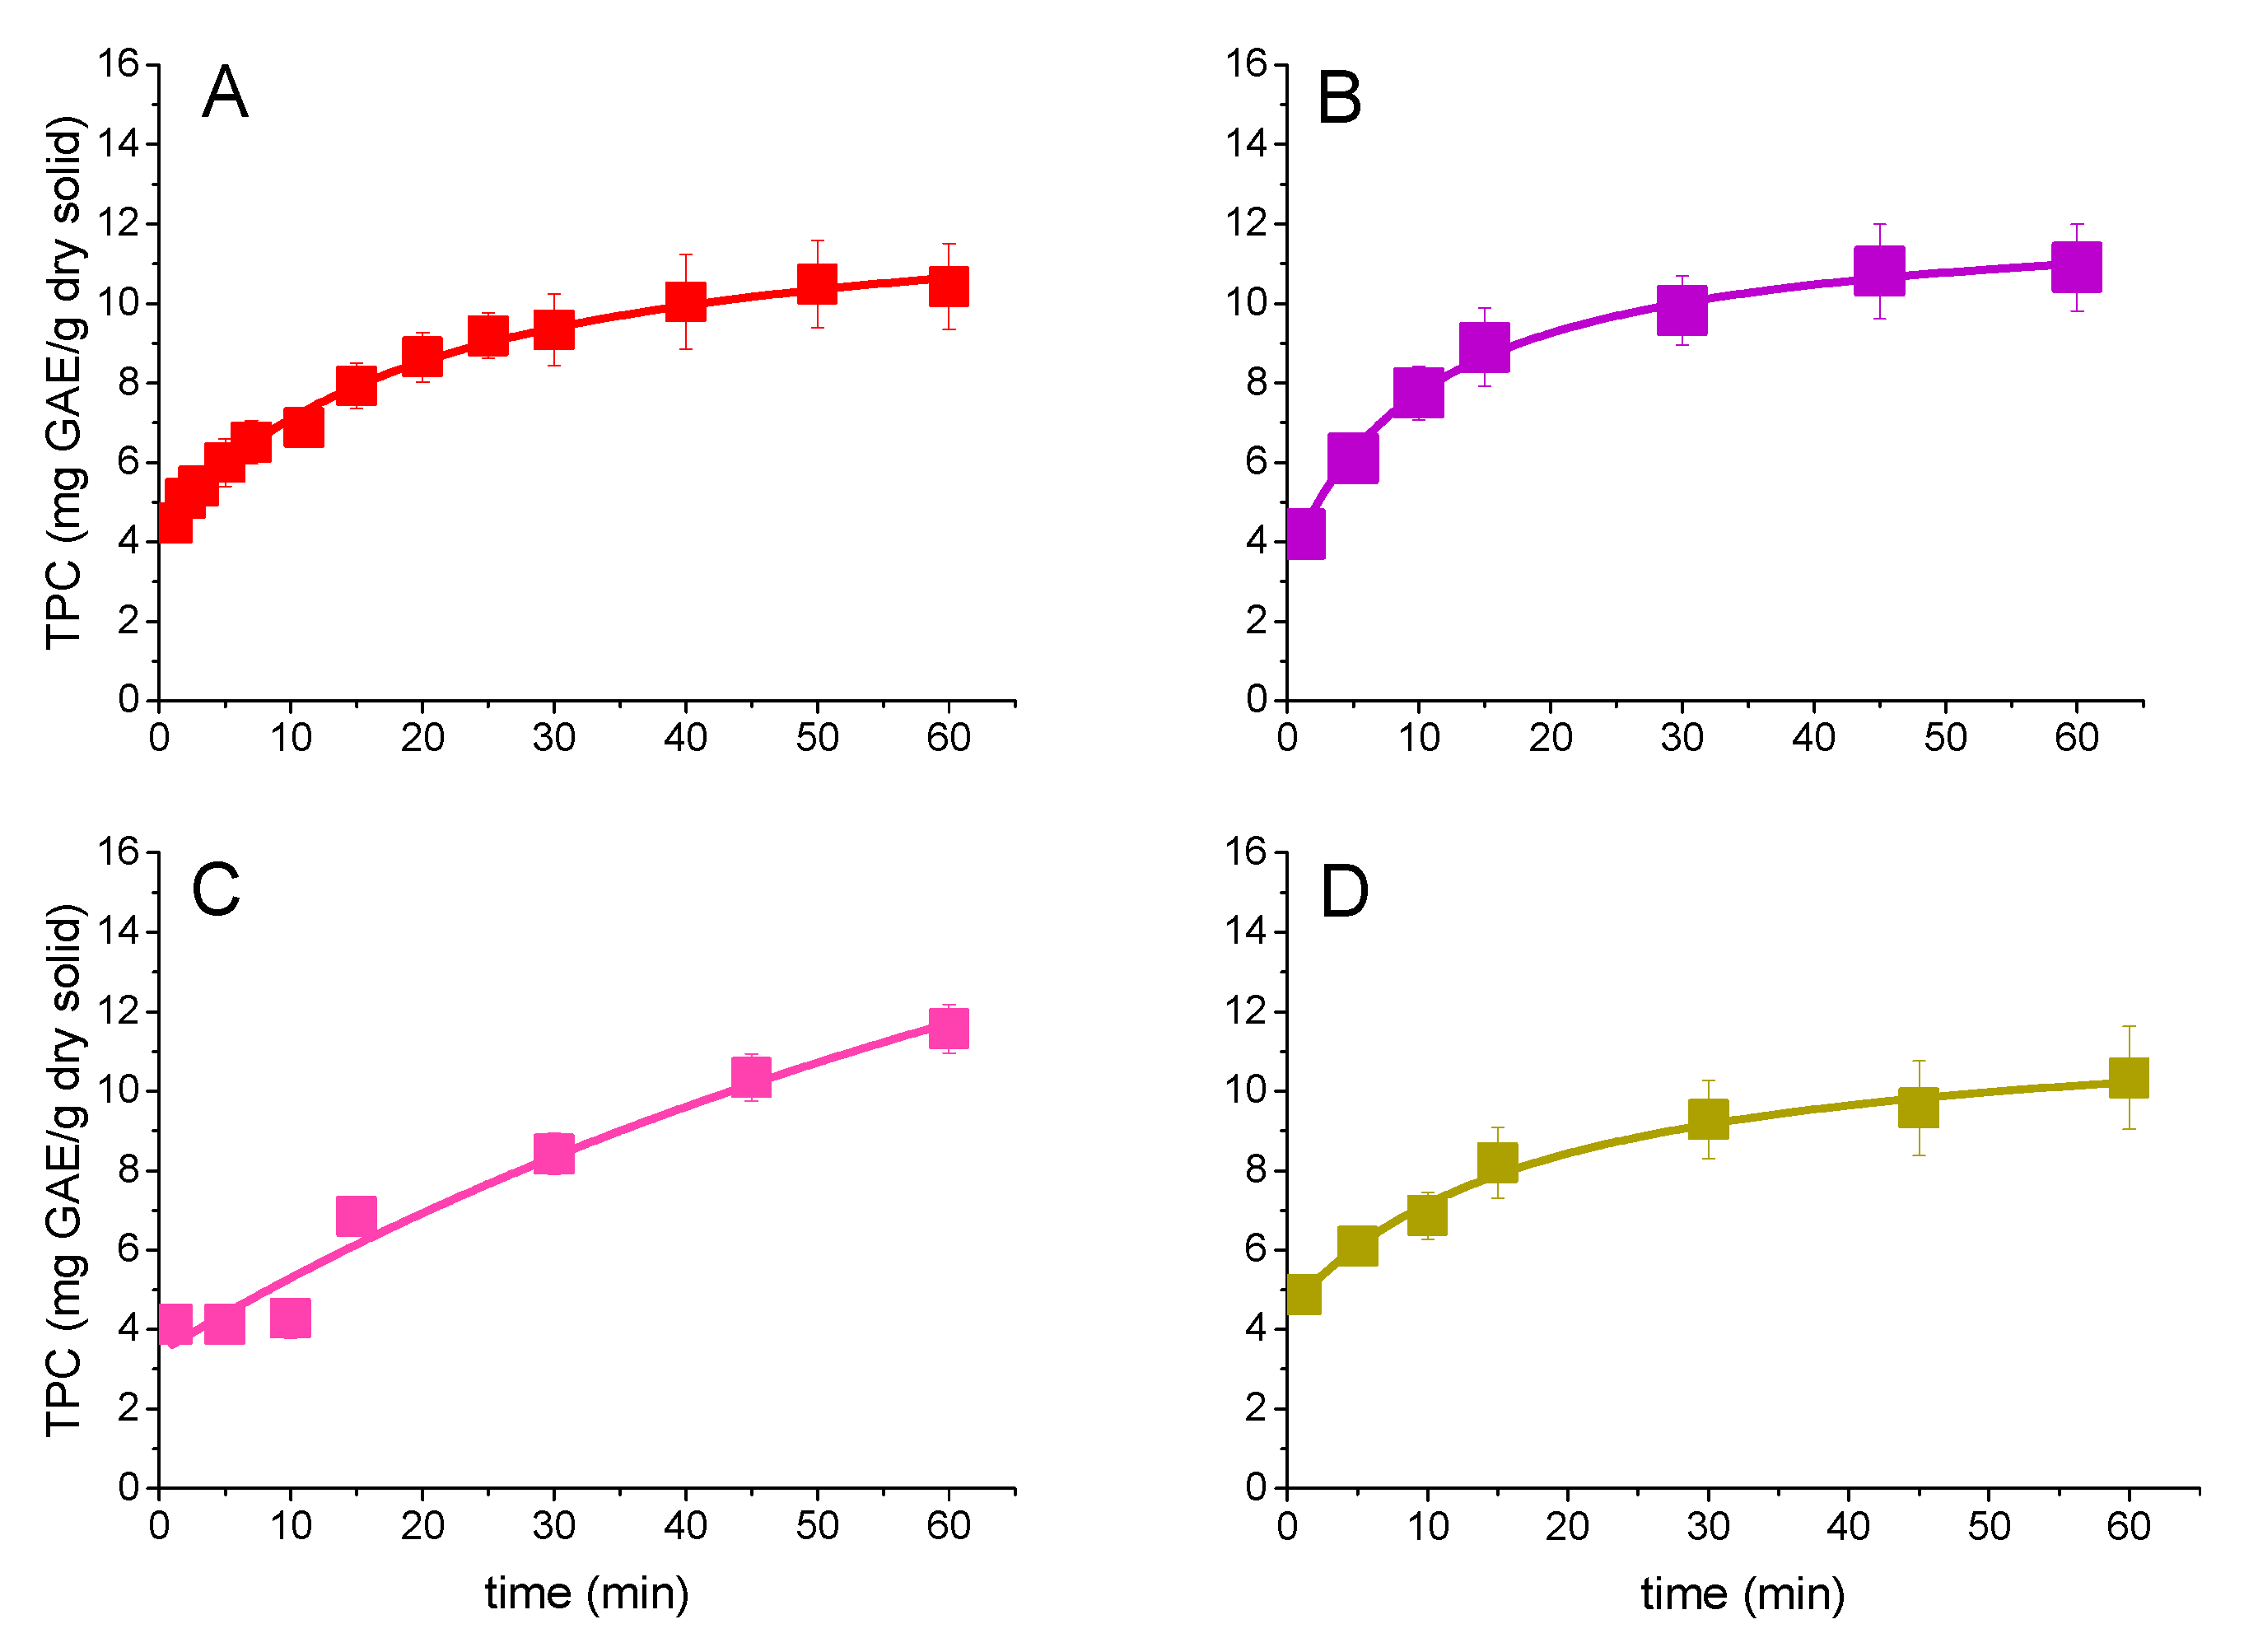
A solvent comparison is shown in Figure 2 where the effect of water in the solvent mixture was studied. Water extraction presents a final yield for TPC in the case of AP, 11.56 ± 0.61 mg GAE/gds, which is similar to those obtained with a hydroalcoholic mixture containing 70% ethanol and 30% v/v water. In the case of acetone and acetone 80%/water 20% AP extraction, the results are also similar (10.42 ± 1.08 and 10.90 ± 1.09 mg GAE/gds, respectively), so, in the extraction of AP, water content seems not relevant for this process. This could be attributed to the fact that as AP is not a dry solid (AP here used had a dry solid content of 33.5 ± 0.9%), the residue confers a local content of water to the mixture that is relevant to equalize, at pore scale, the amount of water irrespective of the percentage of water in the solvent, thus making an extraction without water not feasible. Ethanol 96% extraction is similar to acetone: the final solvent will be a mixture of water contained in the residue and ethanol, so the final yield (10.33 ± 1.29 mg GAE/gds) was similar to the one obtained in the ethanol 70% extraction.
Figure 2. Kinetic analysis of the extraction processes of AP employing (A) acetone at 25 °C, (B) acetone 80% at 25 °C, (C) water at 25 °C, and (D) ethanol 96% (v/v) at 70 °C obtained by the Folin–Ciocalteu method. Fitting lines correspond to the second-order kinetic model shown in Equation (1).
Applsci 12 04901 g002
The effect of water can be observed in the slower initial extraction rate. This can be attributed to the effect of the high polarity of water with yields at 5 min in the range of 4 mg GAE/gds in comparison to 5, 6, and 7 for aqueous mixtures of ethanol 70% and acetone 80%, and pure acetone, respectively. The difference between solvents may also be due, in part, to the viscosity at 25 °C for the solvents under comparison: 0.91 cP (water), 1.07 cP (ethanol), and 0.31 cP (acetone). One should keep in mind that, according to the Einstein–Stokes equation, and most empirical equations for the calculation of molecular diffusivities in liquids’ diffusivity, and, thus, according to the first Fick law on diffusional mass transfer, mass flow rates are inversely proportional to viscosity. Acetone has, most evidently, the lowest viscosity. In the case of an almost pure ethanol (96%) at 70 °C, viscosity equals 0.5231 cP and cannot explain the low extraction rate (6 mg GAE/gds) achieved in the first 5 min, a fact that is further supported by a relatively low final yield slightly over 10 mg GAE/gds. Thus, the water content in hydroalcoholic mixtures seems critical to achieve high extraction yields, improving solvation power of the mixture in comparison to pure ethanol, while medium to high temperatures will result (Figure 1) in fast to very fast extraction processes. Possibly, in view of the results of acetone:water and ethanol:water mixtures, this observation can be extended to acetone:water mixtures applied at medium-high temperature and pressure-values.
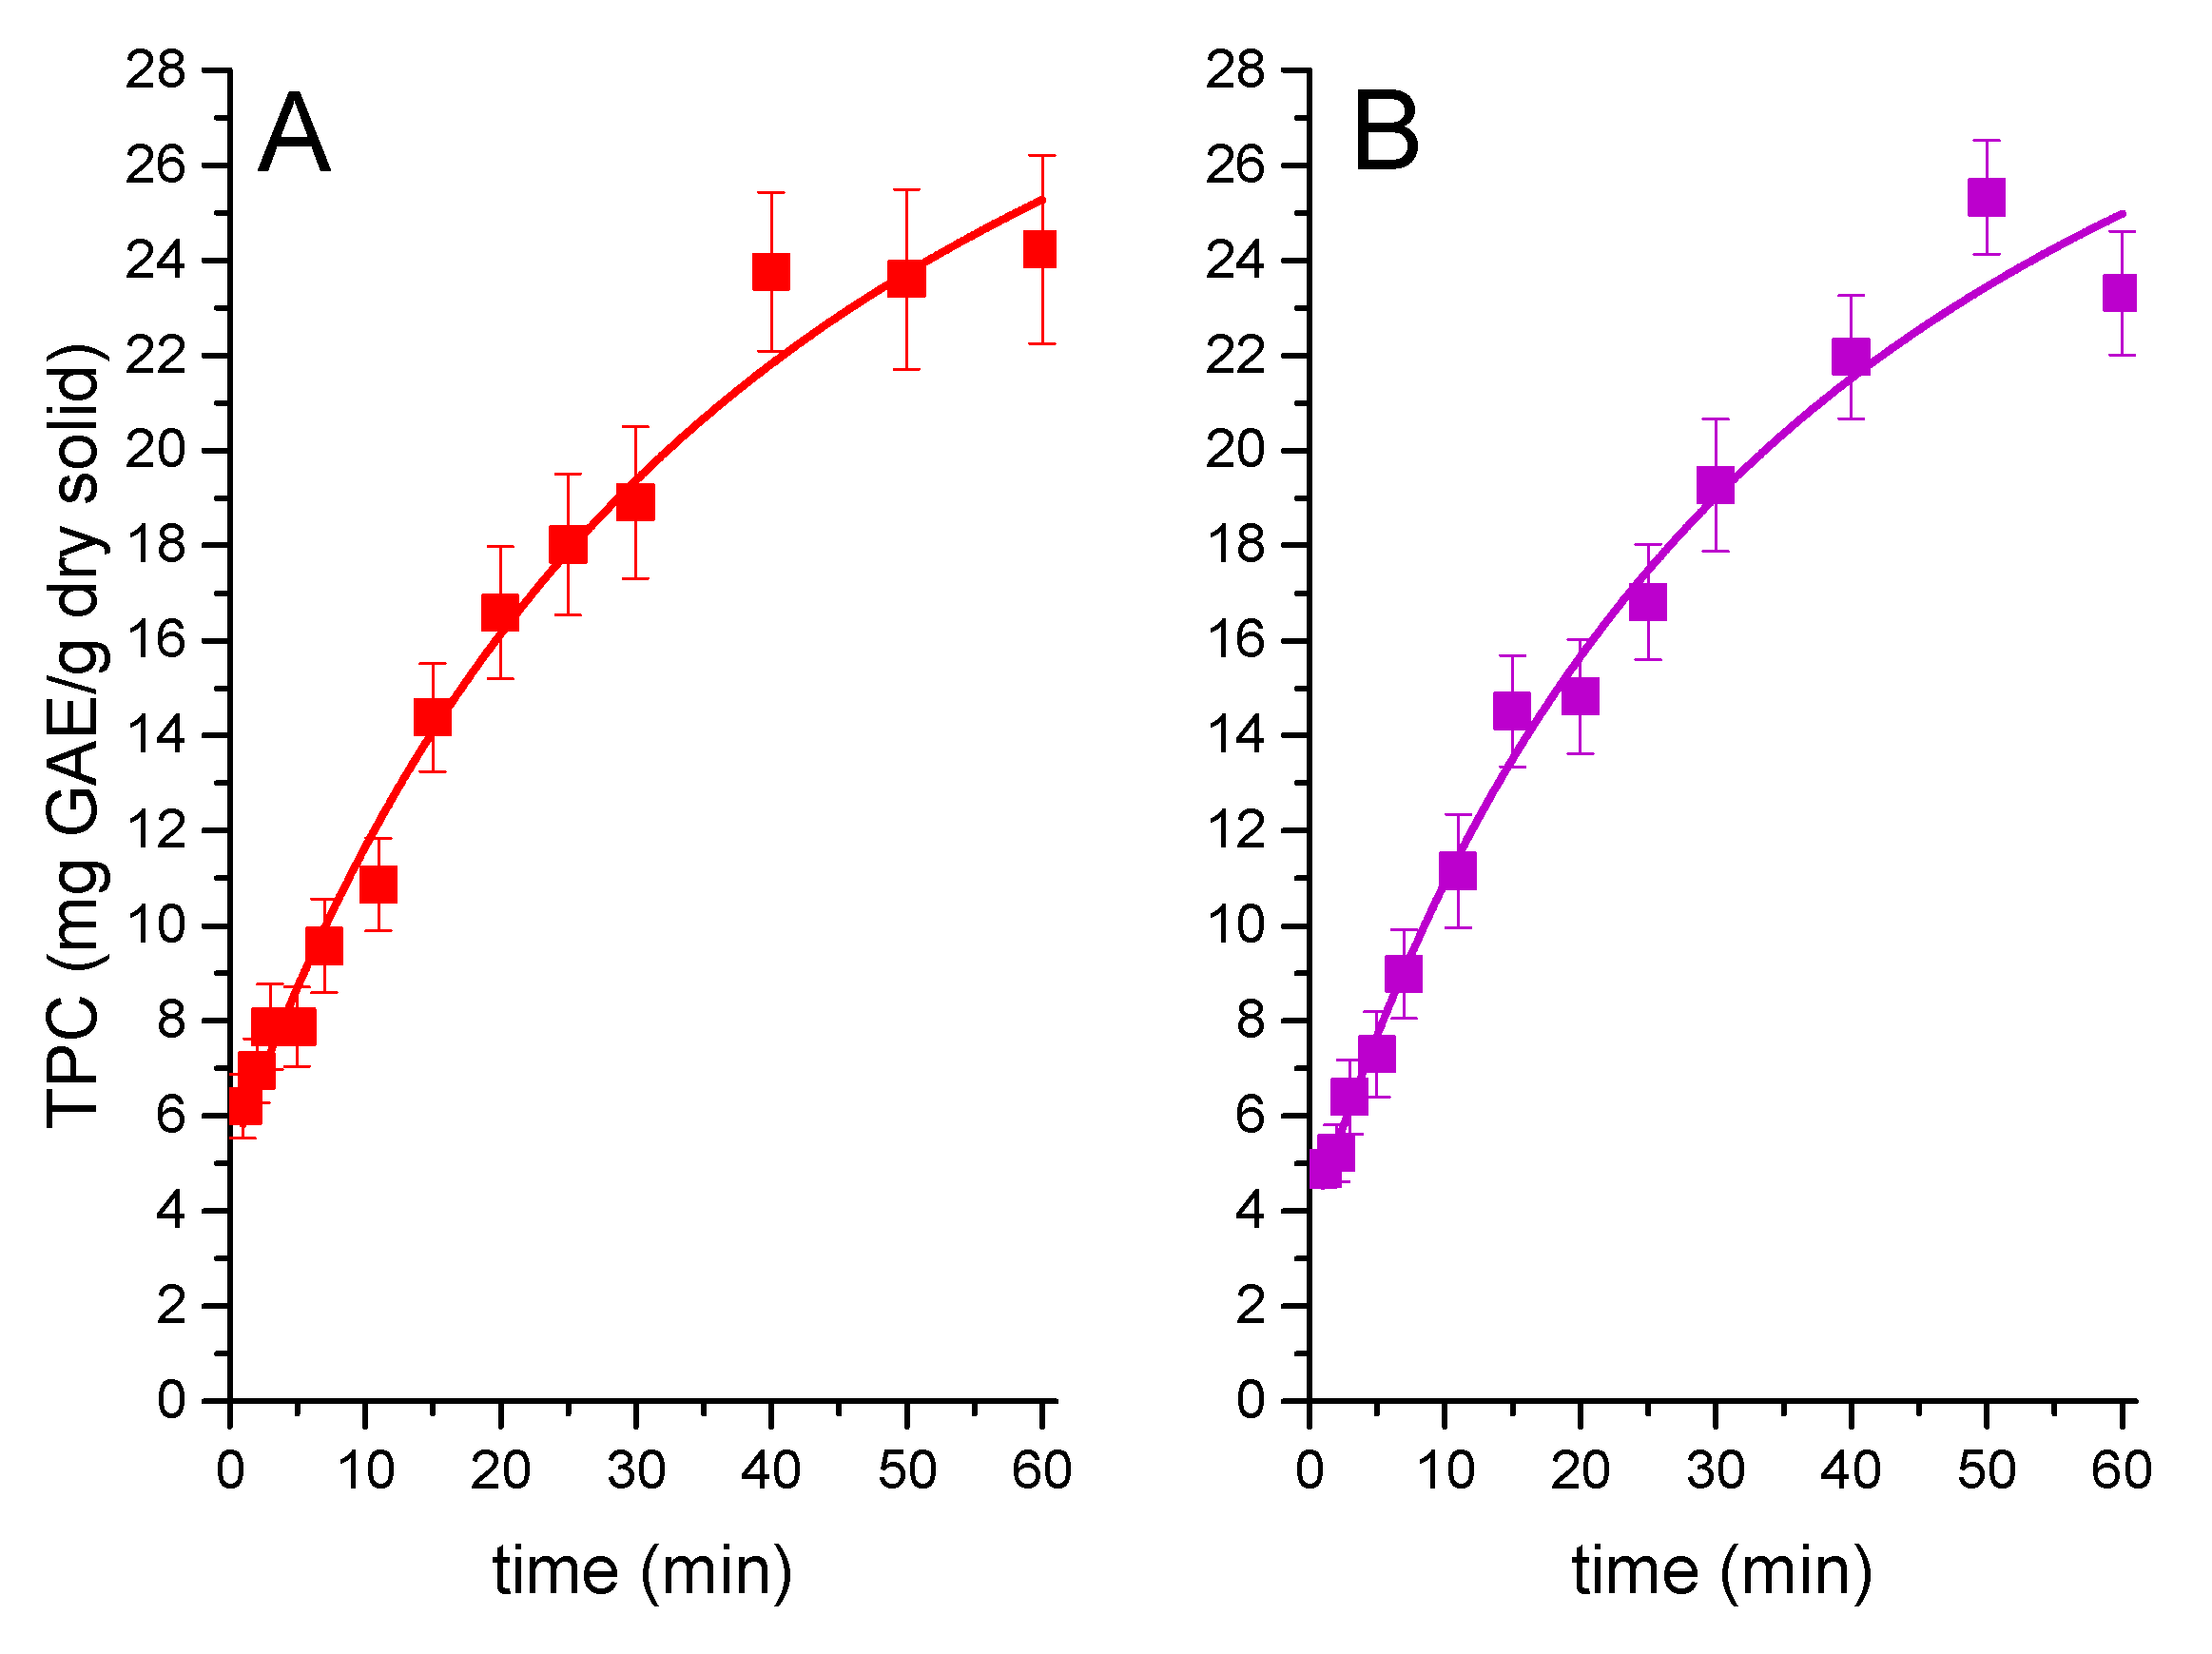
Figure 3 displays the results for TPC extraction when using glycol solutions with a small amount (10%) of water. From the perspective of TPC final yields, these glycol/water mixtures seem to be optimal solvents to extract phenolics in the case of AP at 70 °C, as TPC values reach 25 mg GAE/gds in 60 min and 13 mg GAE/gds in 15 min (equal to the TPC value for ethanol 70% aqueous solution in 60 min). Moreover, the apparent TPC value at zero time (the result of washing or dissolution of readily available phenolics on or near the waste particles’ surface) is 6 mg GAE/gds for the ethyleneglycol solution and almost 5 GAE/gds for the propyleneglycol solution (comparing to 4.3 GAE/gds for the ethanol 70% watery solution). These numbers are a further confirmation of the fast nature of the dissolution or washing process: as the stirring speed was set to a high value (500 r.p.m.) for a low volume of liquid–solid suspension, no external mass transfer hindrances are expected, thus favoring the solubilization phenomena taking place in the first minute of contact. Here, mass transfer is immediate and solvent viscosity plays no role, being that its solvation power is the most important factor to achieve high TPC values.
Figure 3. Kinetic analysis of the extraction process of AP employing (A) ethylene glycol 90% at 70 °C and (B) propylene glycol 90% at 70 °C obtained by the Folin–Ciocalteu method. The lines show the fitting of the second-order kinetic model shown in Equation (1).
Applsci 12 04901 g003
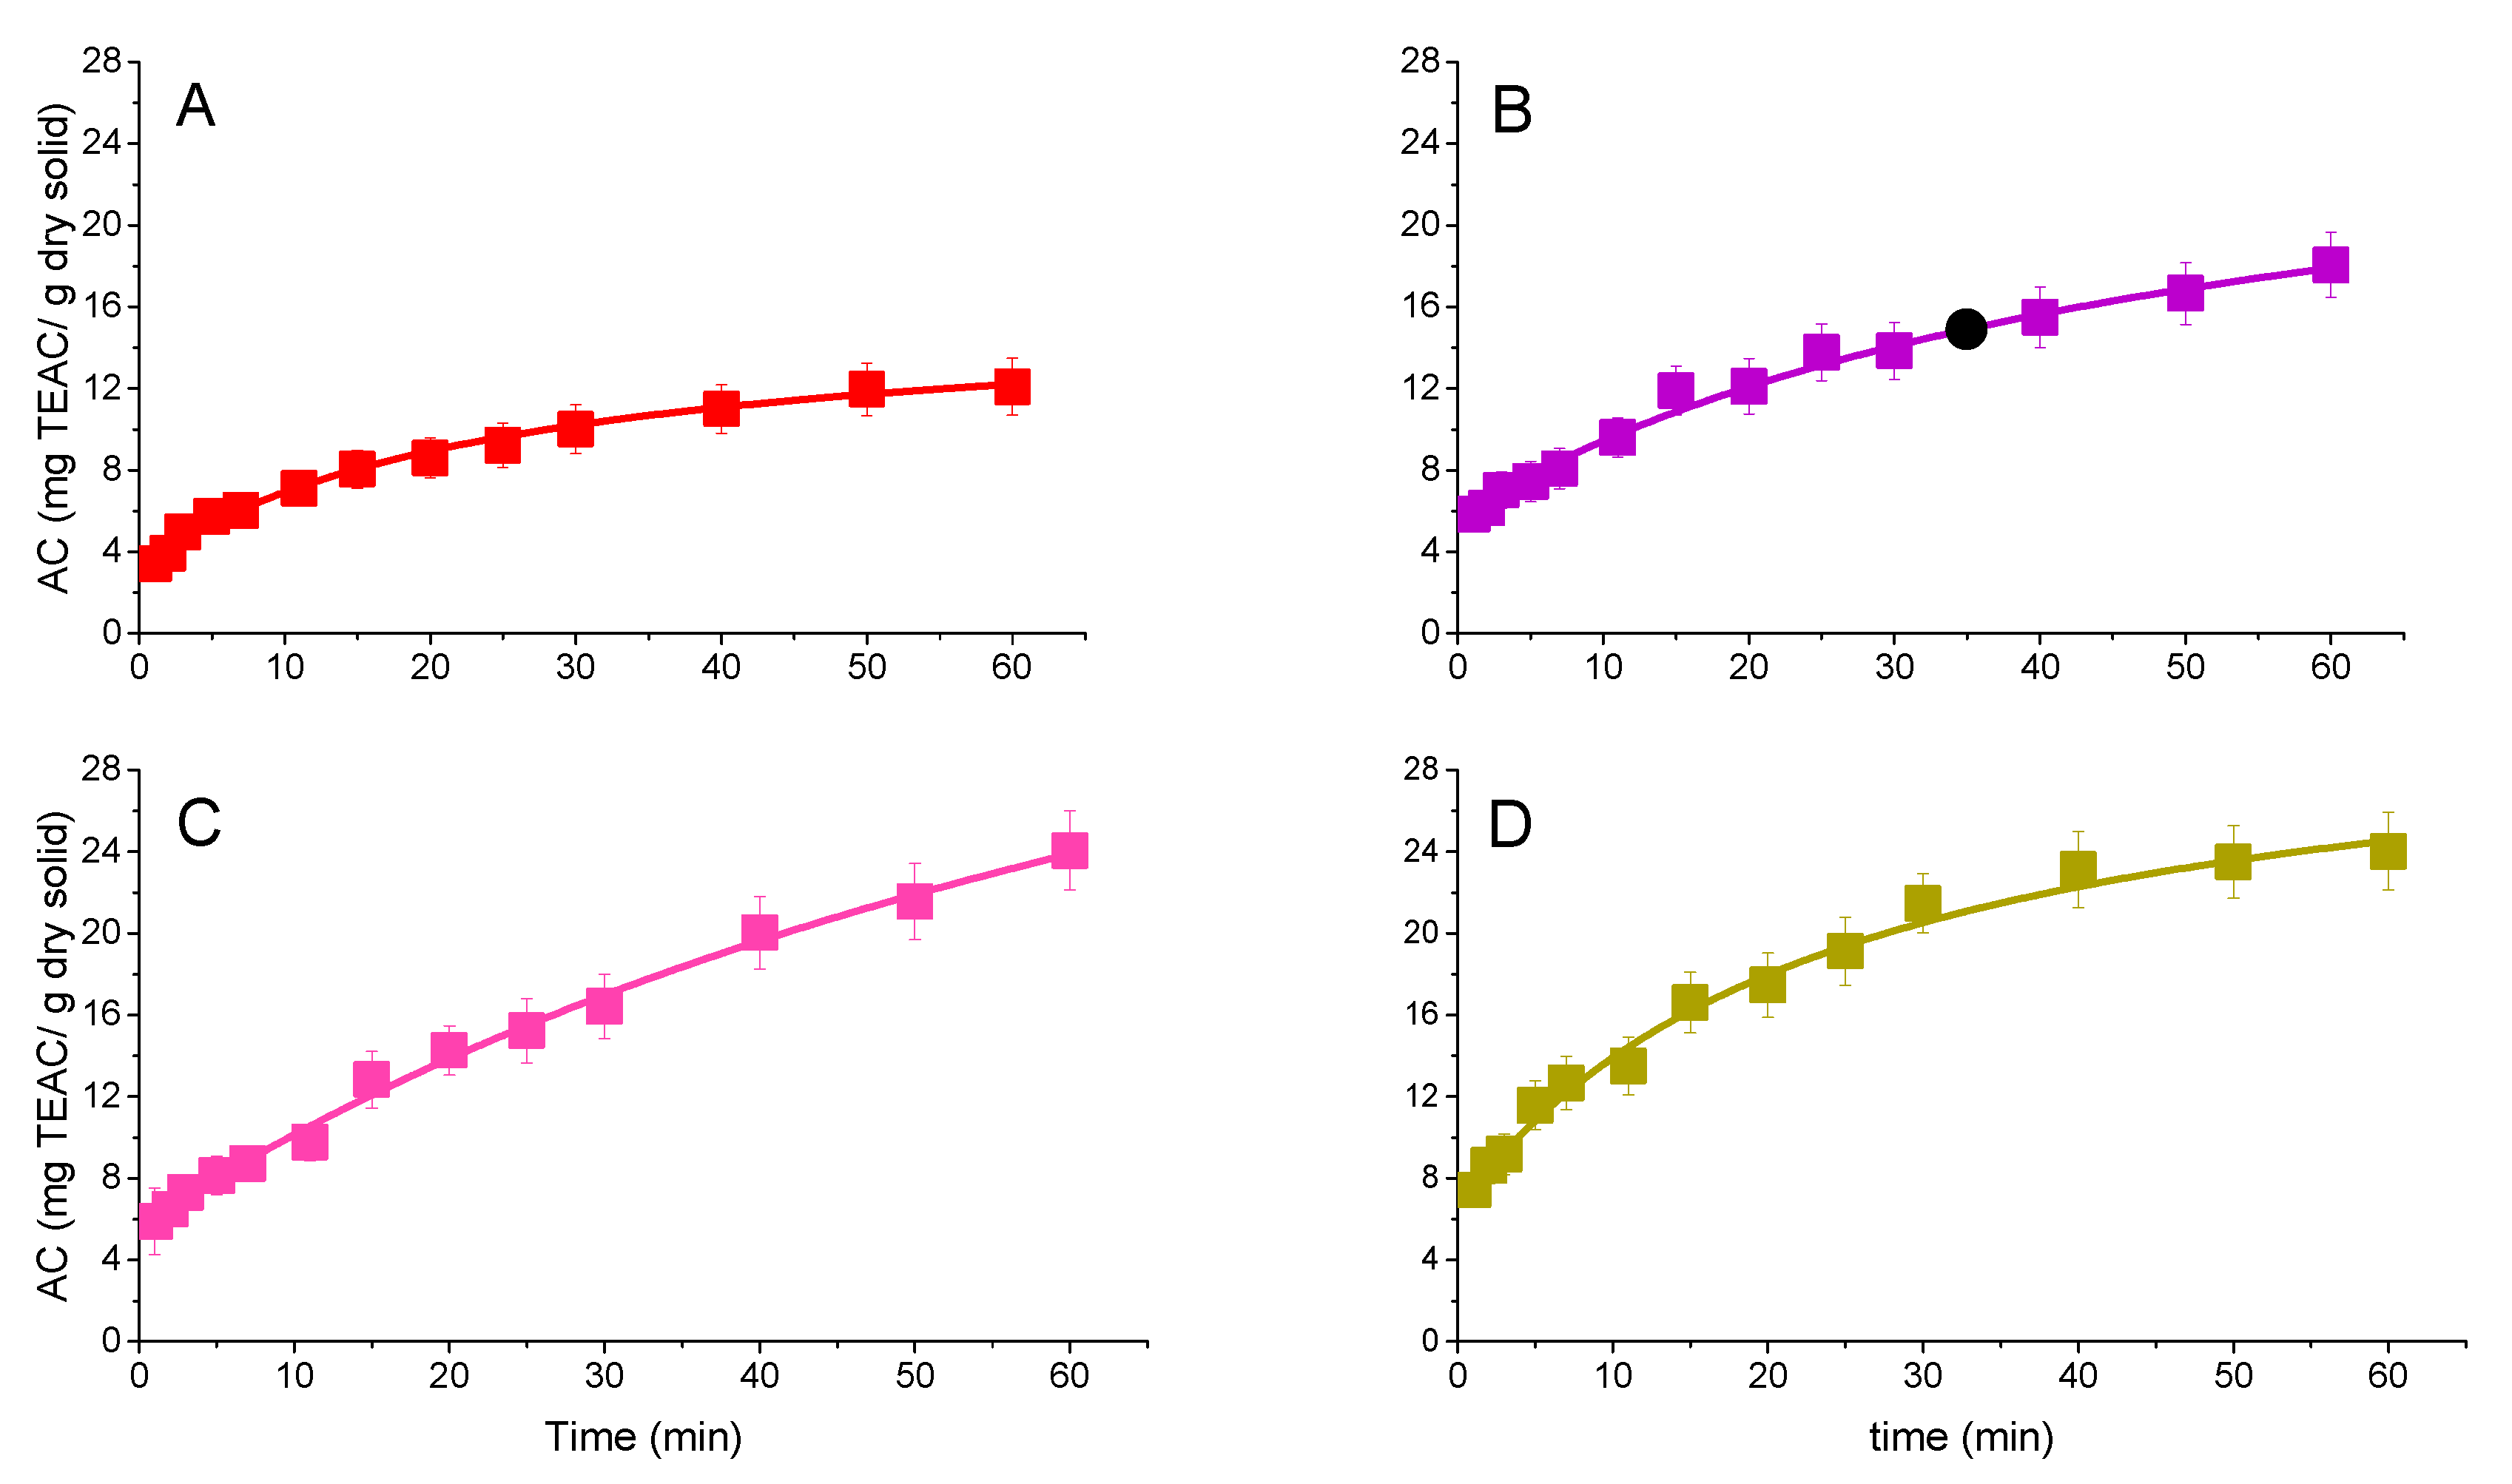
The kinetic trends and model curves reflecting the antioxidant capacity extracted from AP are displayed in Figure 4, Figure 5 and Figure 6. Considering this functional parameter, the extraction driven by an aqueous solution of ethanol at 70% (v/v) shows differences depending on the temperature value. We can see that the maximum antioxidant activity, according to a DPPH test, is obtained at 70 °C and 90 °C, with results of 24.05 ± 1.94 and 24.02 ± 1.89 mg TEAC/gds at 60 min, respectively. It is interesting to observe that these results at both temperatures are identical from a statistical perspective, while a slightly higher initial extraction rate is observed at 90 °C, indicating that this temperature, even in the absence of light, can be deleterious of the antioxidant activity of the extract (as suggested before by TPC analysis) or that an asymptotic value for antioxidant activity is being reached. While the average slopes of tangents to the curve along the extraction period (slow phase) indicate an increasing extraction rate with temperature, the value of TPC at zero time increases slowly from 25 to 70 °C: 3 mg TEAC/gds (25 °C), 4.5 mg TEAC/gds (50 °C), 5.5 mg TEAC/gds (70 °C), and 7 mg TEAC/gds (90 °C), with a sudden increment from 70 to 90 °C coherent with a certain physical modification of the structure near the boiling point observed for the solvent at atmospheric pressure.
Figure 4. Kinetic analysis of the antioxidant activity as measured by the DPPH method during the extraction processes of AP employing a 70%/30% v/v ethanol/water mixture at several temperature values: (A) 25 °C, (B) 50 °C, (C) 70 °C, and (D) 90 °C. The lines show the fitting of a one-term second-order kinetic model (Equation (1)).
Applsci 12 04901 g004
Figure 5. Kinetic analysis of the extraction processes of AP employing (A) acetone at 25 °C, (B) acetone/water 80%/20% v/v at 25 °C, (C) water at 25 °C, and (D) ethanol 96% at 70 °C: antioxidant activity as obtained by DPPH method. Kinetic model fitting is presented in lines.
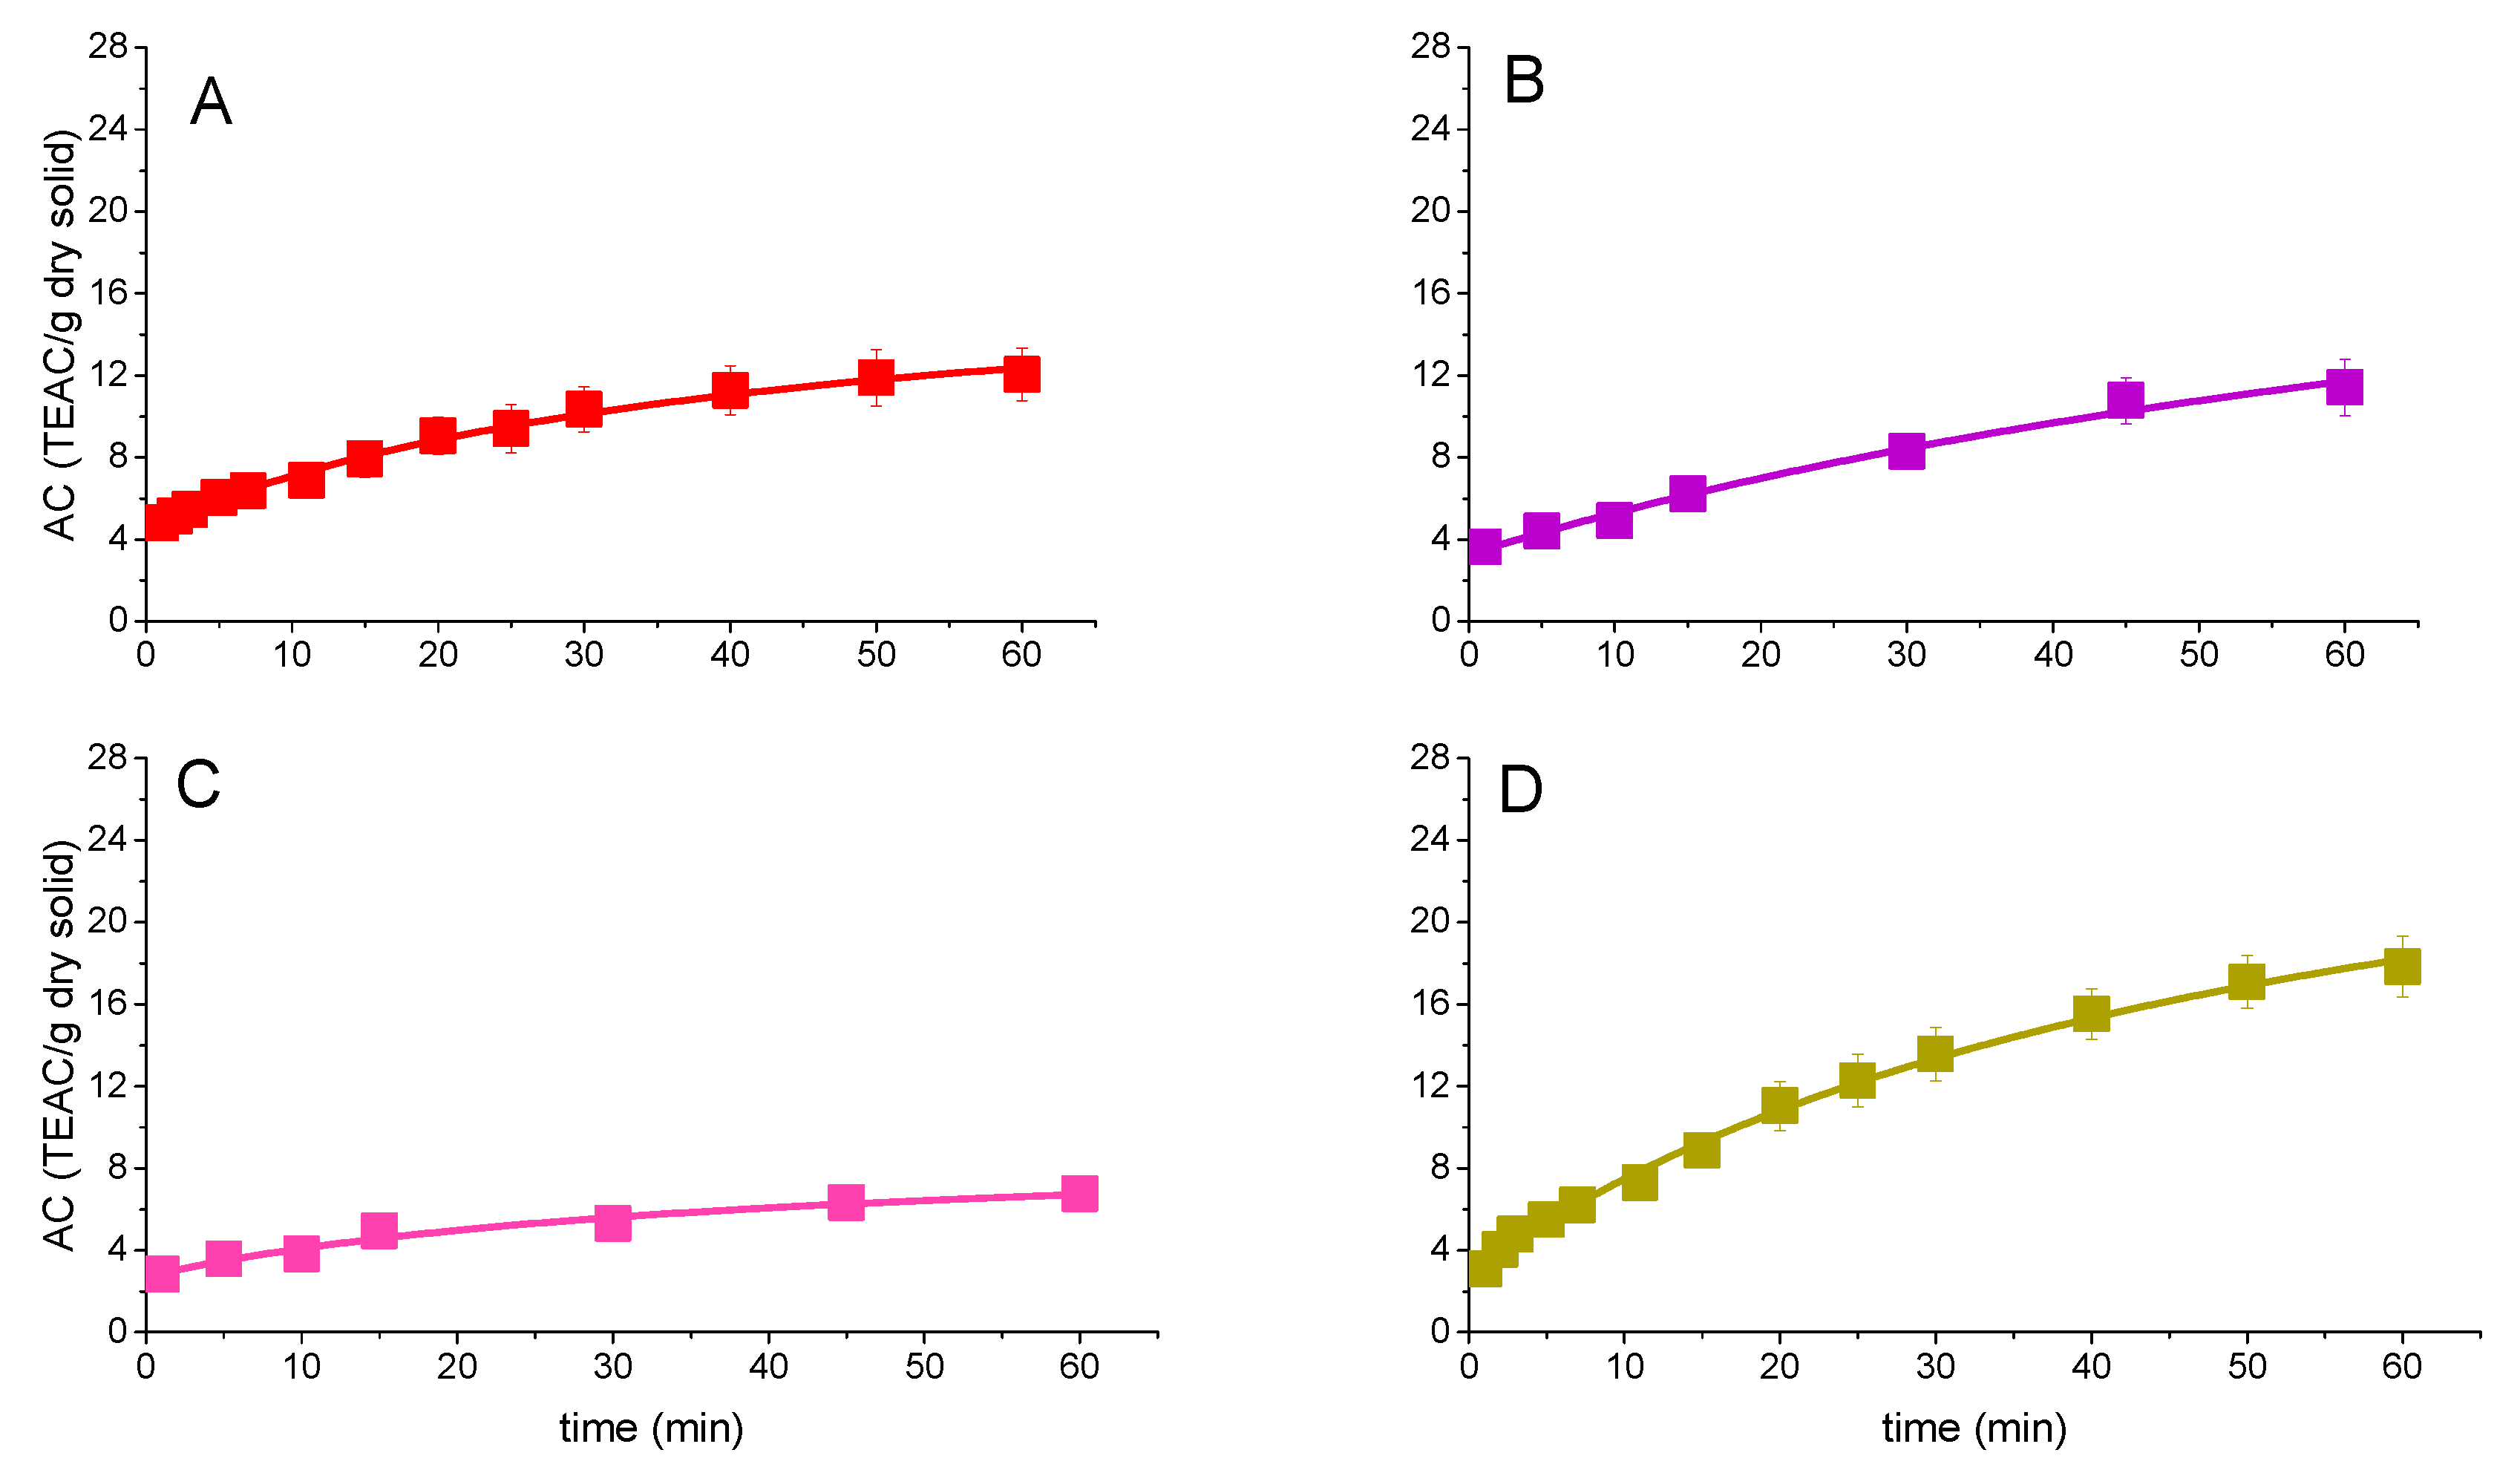
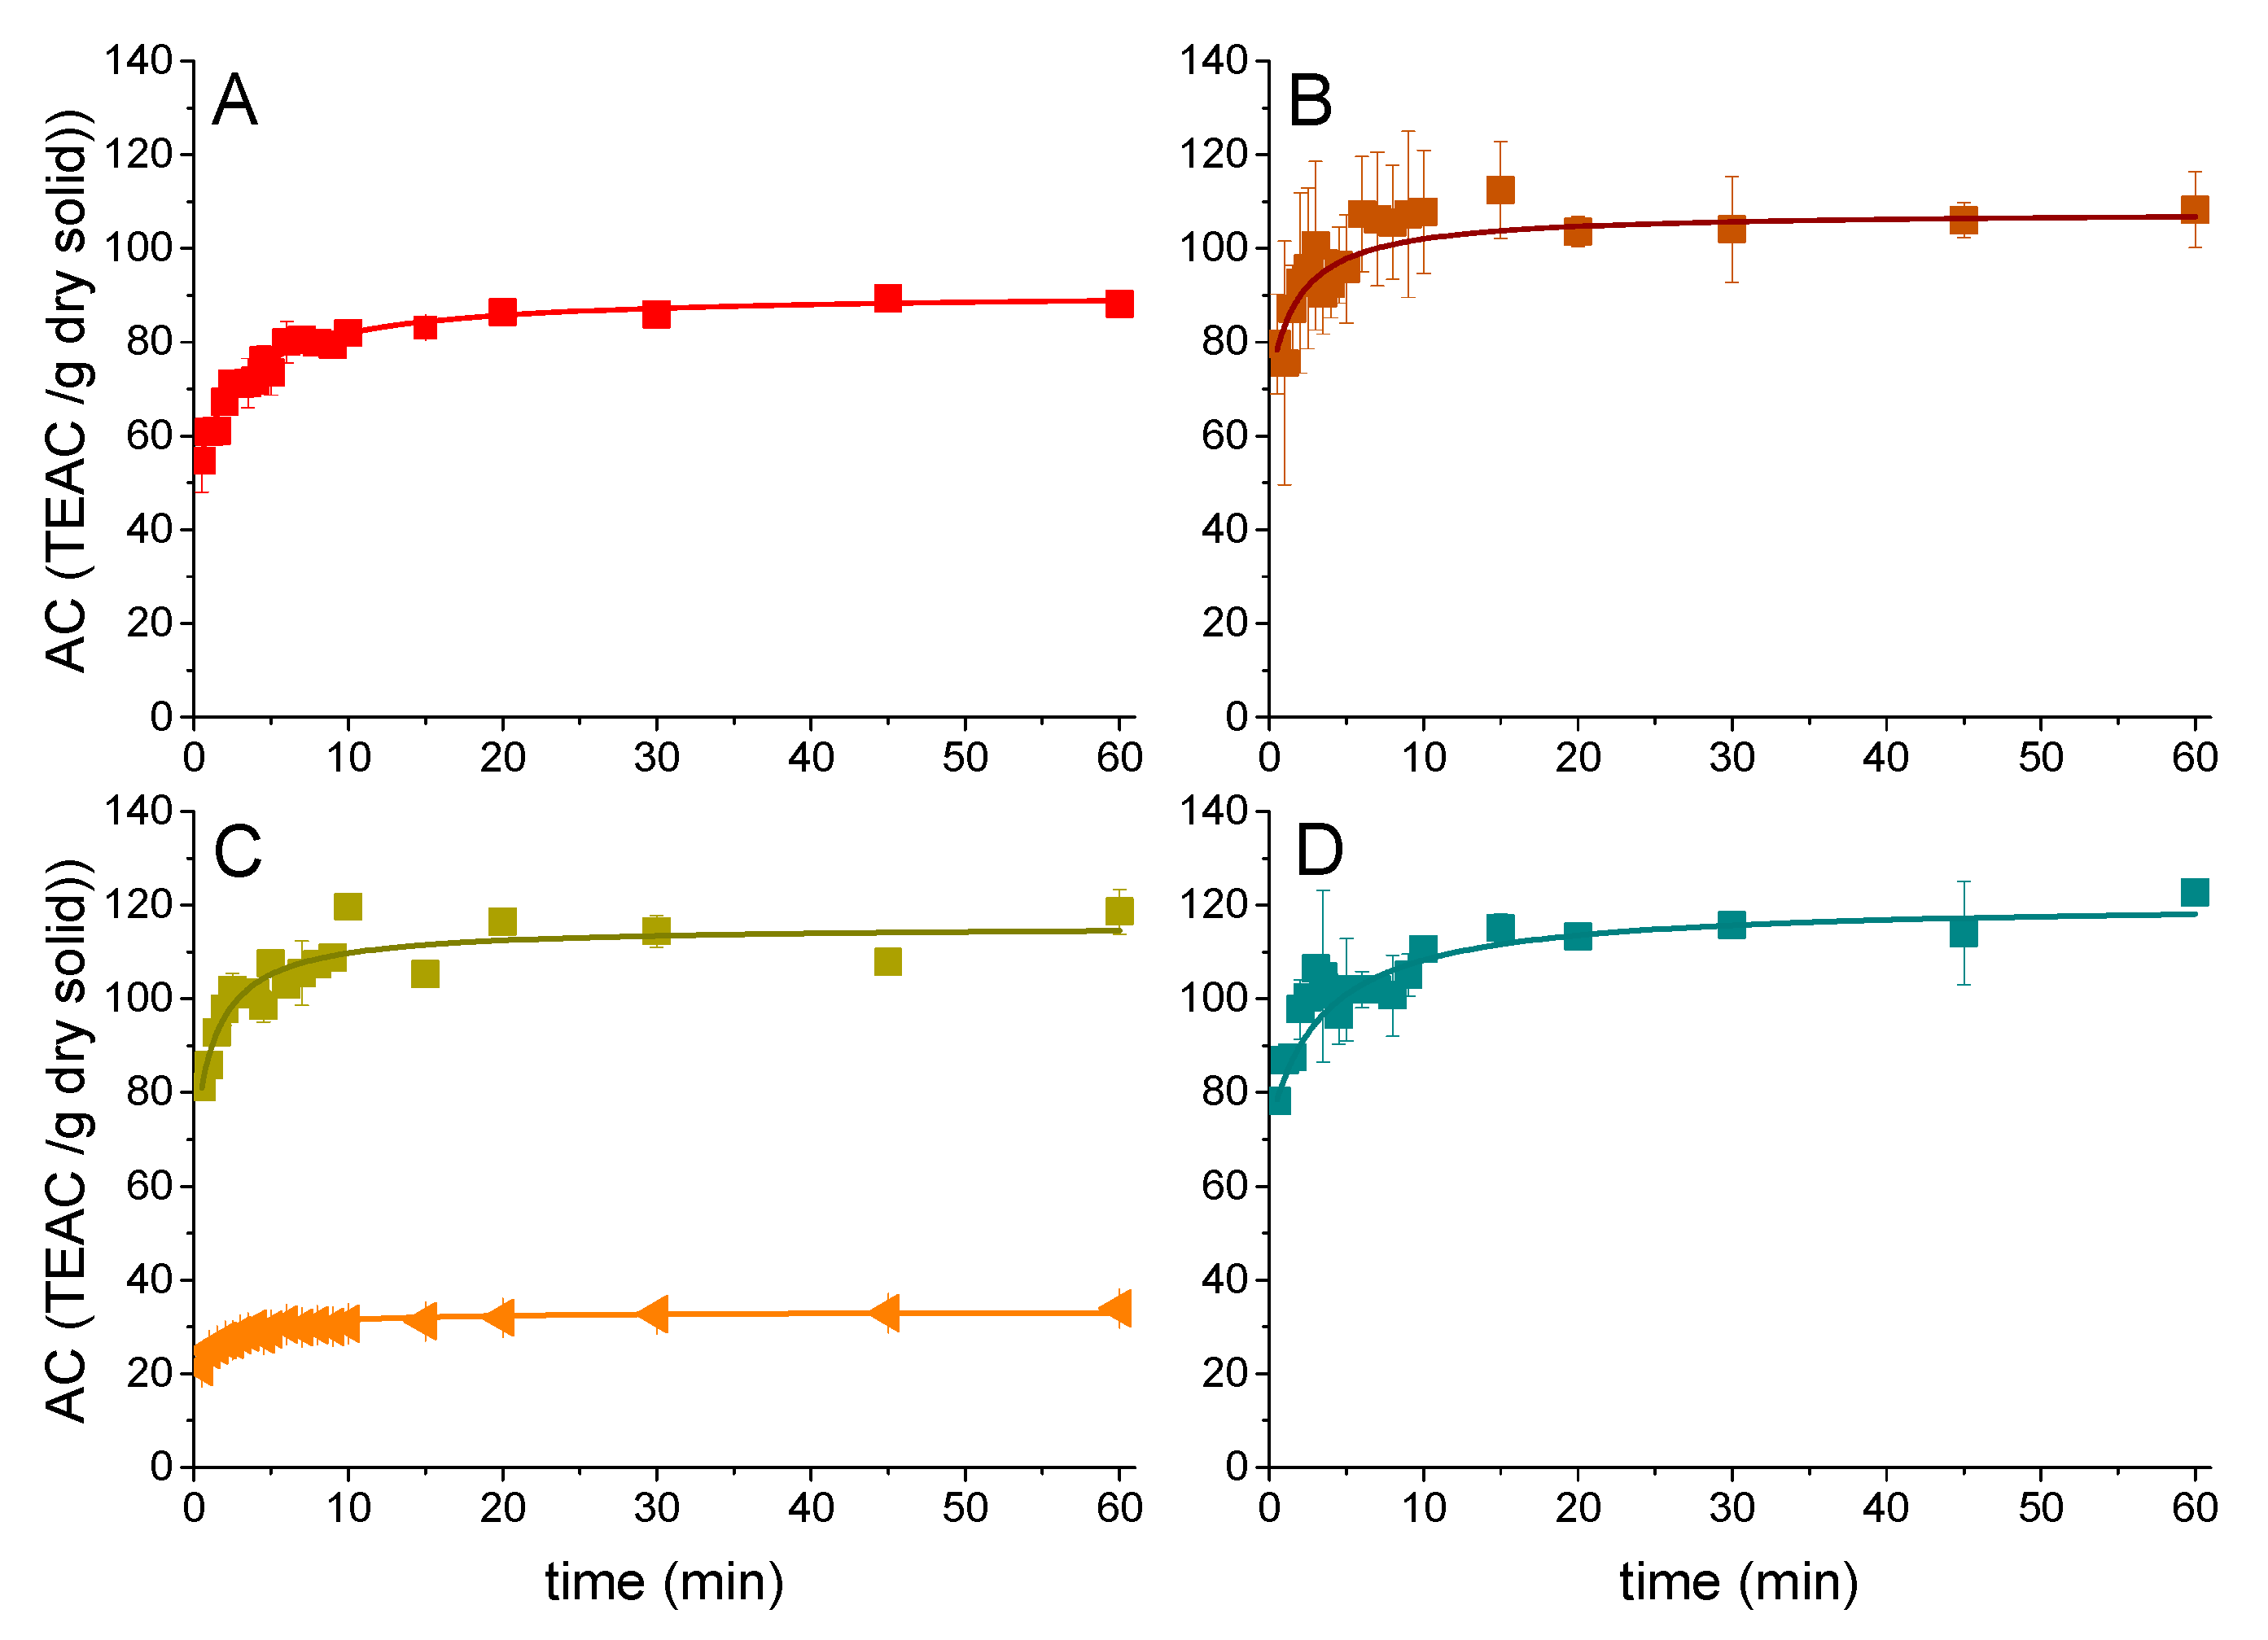
Applsci 12 04901 g005
Figure 6. Kinetic analysis of the extraction processes of AP with glycols and a glycol-based DES at 70 °C. (A) ethylene glycol 90%, (B) propylene glycol 90%, and (C) ChCl:Gly 90%. The kinetic model fitting is presented in lines.
Applsci 12 04901 g006
In the case of propylene glycol and ethylene glycol, despite being the best extractives in terms of TPC, the antioxidant extraction capacity is lower, being higher in the case of EG (19.29 ± 1.58 TEAC/gds in 60 min), while the nontoxic PG scarcely extracts 11.41 ± 1.30 TEAC/gds in the same time. A deep eutectic solvent (DES) composed of CHCl and EG is as good as EG (17.83 ± 1.49 TEAC/gds in 60 min). This may be caused by the nature of the phenolics extracted with these solvents in comparison to those dissolved in mixtures of water/ethanol, which show an almost-double antioxidant-specific activity in terms of AC/TPC (1.5 for ethanol 70% at 70 °C versus 0.77 for ethyleneglycol and 0.46 for propyleneglycol), showing that, on top of being greener and less expensive, ethanol–water mixtures are more specific for phenolics with a high antioxidant activity when valorizing AP.
Acetone and a mixture of acetone (80% v/v) and water, when compared to ethanol 70% in water at 25 °C (12.08 ± 1.39 TEAC/gds in 60 min) are slightly better extractants (12.06 ± 1.28 TEAC/gds and 11.45 ± 1.39 in the same time, respectively), although water is the worst solvent in this case, with an antioxidant capacity of the aqueous extract at 60 min of 6.75 ± 0.58 TEAC/gds. However, AC values at zero time are very interesting for acetone (4.5 mg TEAC/gds and 3.5 mg TEAC/gds) compared to the benchmark ethanol 70% solution (3 mg TEAC/gds). In general, these results show again the superiority of ethanol:water 70/30 v/v mixture for the extraction of antioxidant power from AP, although pure acetone allows for a very fast washing, suggesting a good solvation power or a certain role of viscosity—very low for the acetone at 25 °C—in this first phase. Moreover, the ratio AC/TPC is 1.8 for ethanol 96% and 1.5 for ethanol 70%, showing a more specific extraction for the hydroalcoholic solvent richer in ethanol.
When applying these solvents and conditions to the extraction of GP components (Figure 7, Figure 8, Figure 9 and Figure 10), the better extraction process in terms of TPC and antioxidant capacity yields is performed again with the mixture ethanol/water 70% (v/v), increasing yield values as the operating temperature increases. Therefore, as expected, temperature affects the solubility of phenolics and the rate of the extraction process from the matrix, in this latter case due to the increase in the mass transfer rate and/or solvation power (viscosity reduction, increment in solubility). The GP extraction yields ten times higher TPC than when extracting AP. Moreover, the process is more affected by temperature: it increases from 44.05 ± 1.78 mg GAE/gds at 25 °C to 68.46 ± 1.03 mg GAE/gds at 90 °C (a 55.4% increment in comparison to a 24.2% increment for AP with the same temperature variation). This fact could suggest that AP porosity structure is less affected by this variable, so the effective diffusivity that depends on it changes only slightly.
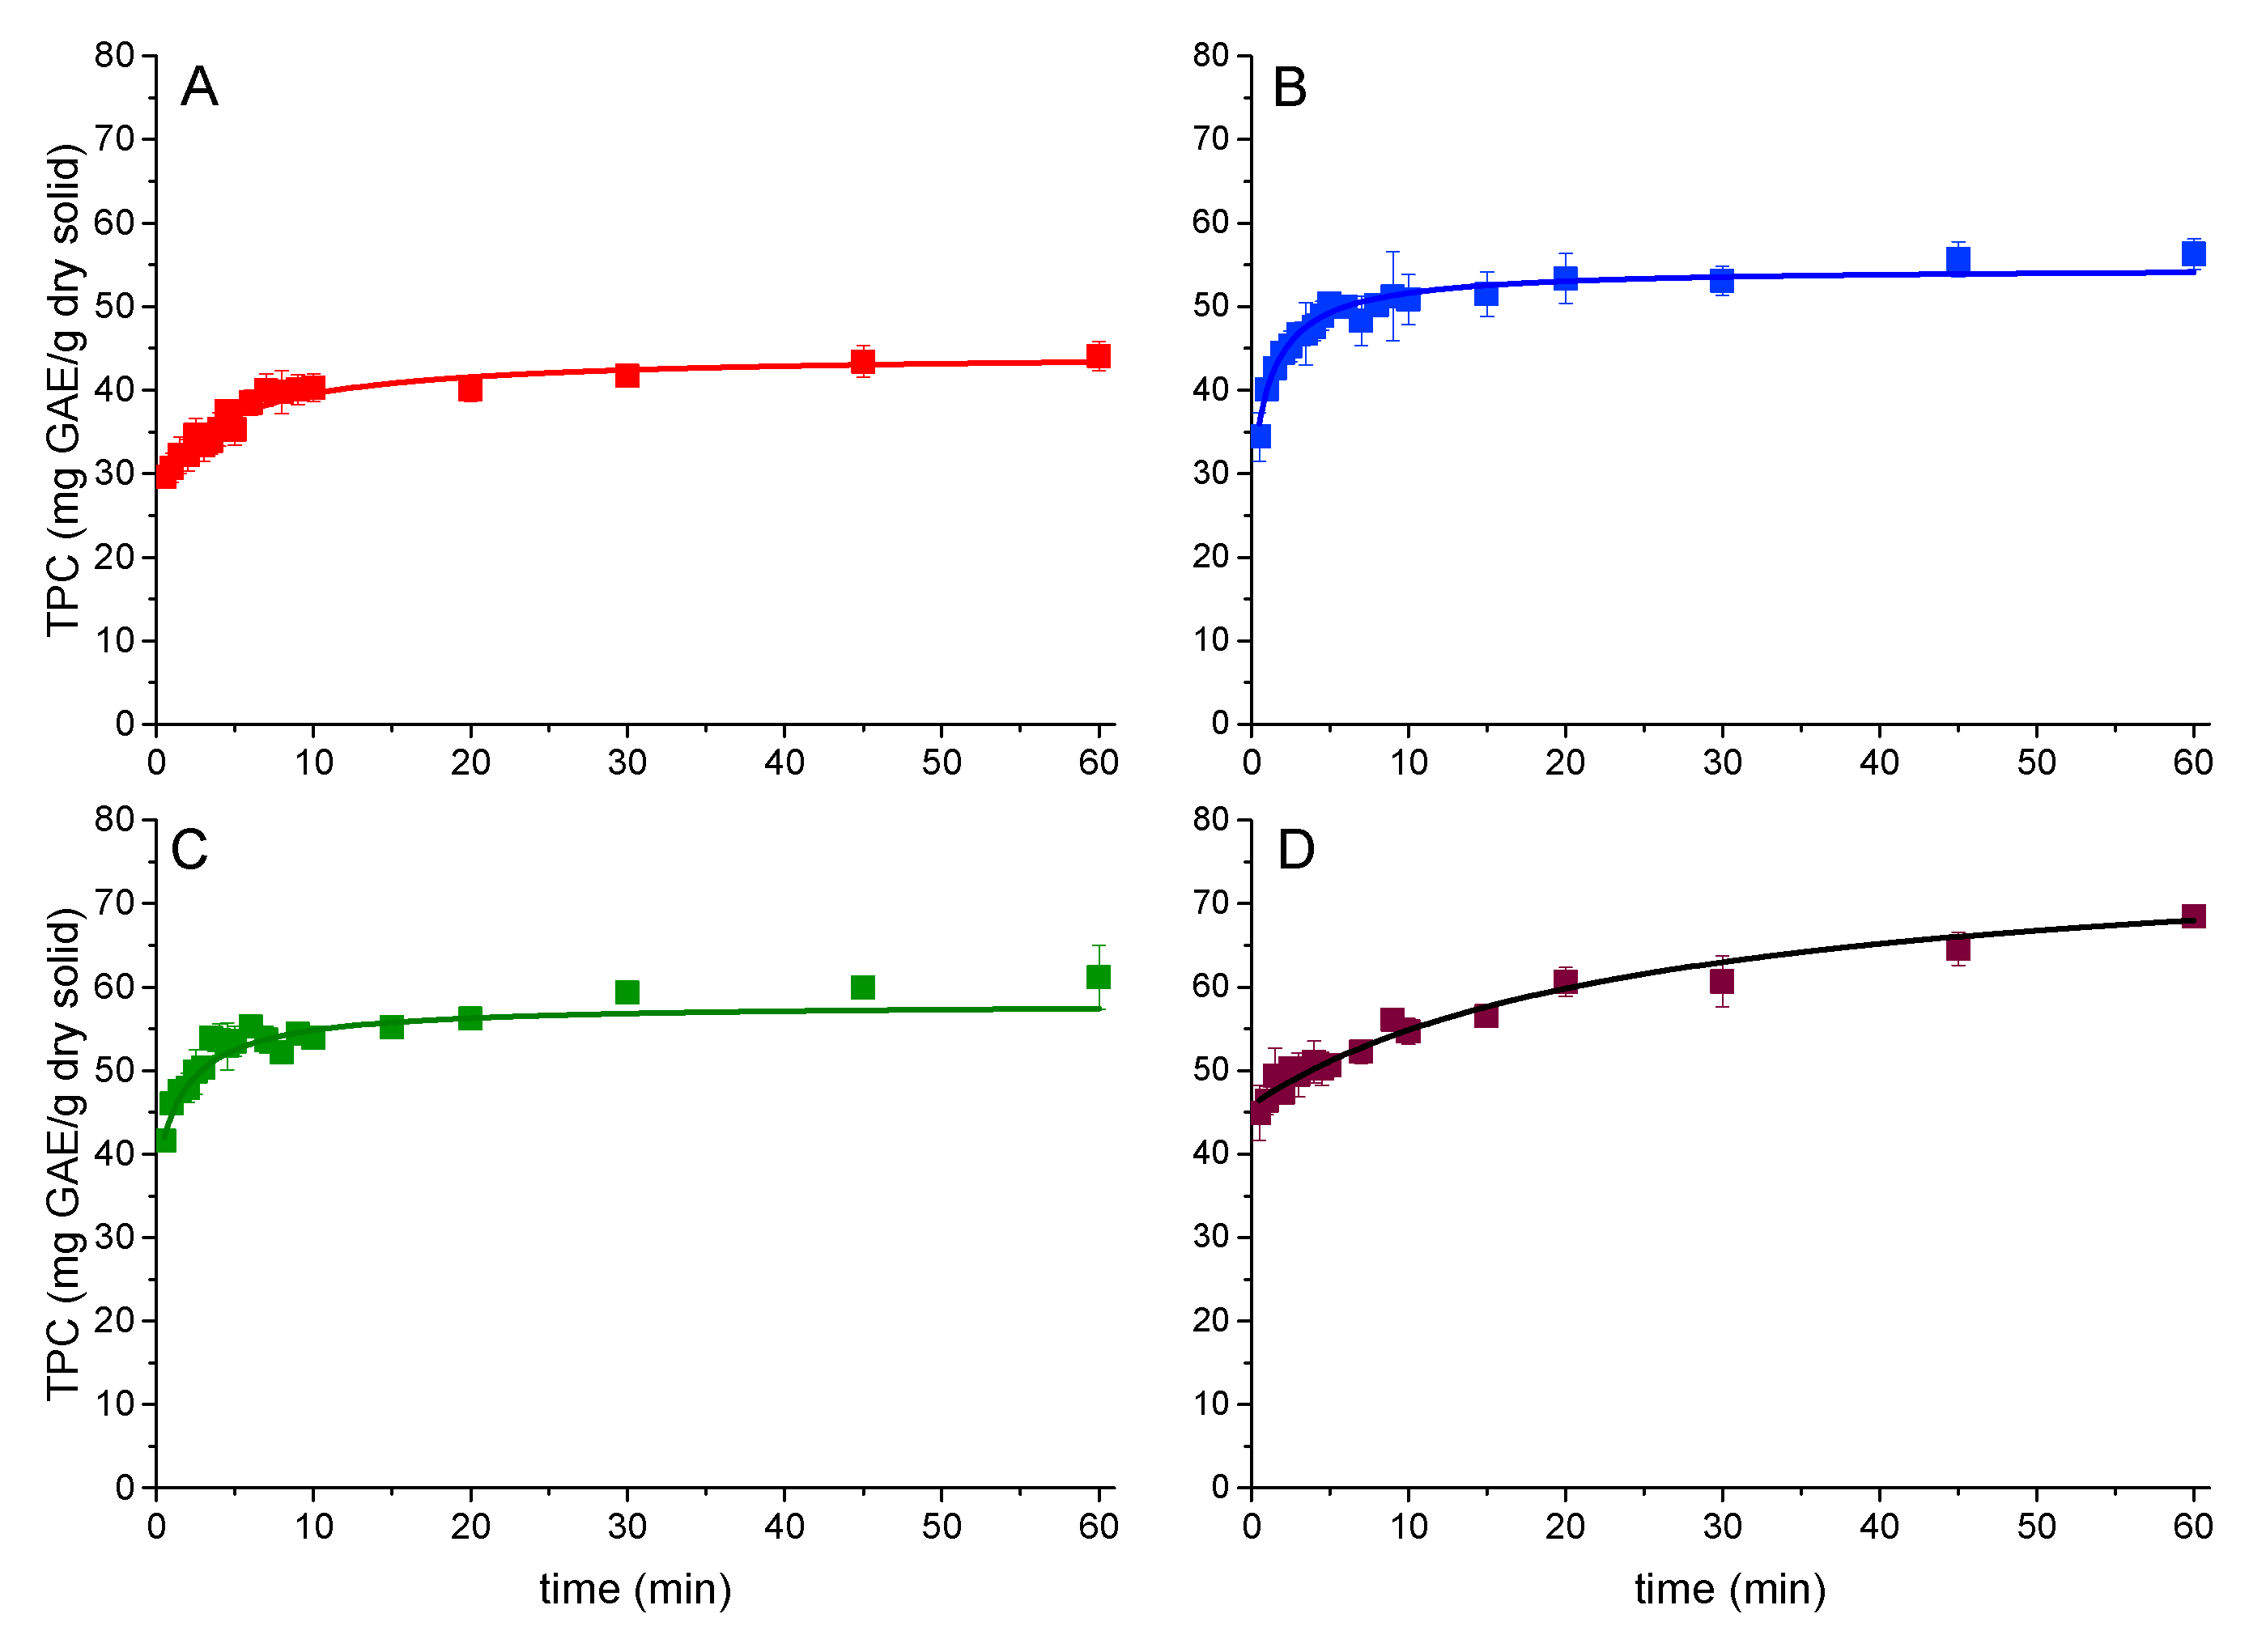
Figure 7. Kinetic analysis of the extraction process from grape pomace (GP) with a hydroalcoholic solution (ethanol/water 70%/30% v/v) at several temperatures: (A) 25 °C, (B) 50 °C, (C) 70 °C, and (D) 90 °C. Data, in points, reflects the total phenolic content (TPC) obtained by the Folin–Ciocalteu method. The lines indicate the fitting of the second-order kinetic model presented in Equation (1).
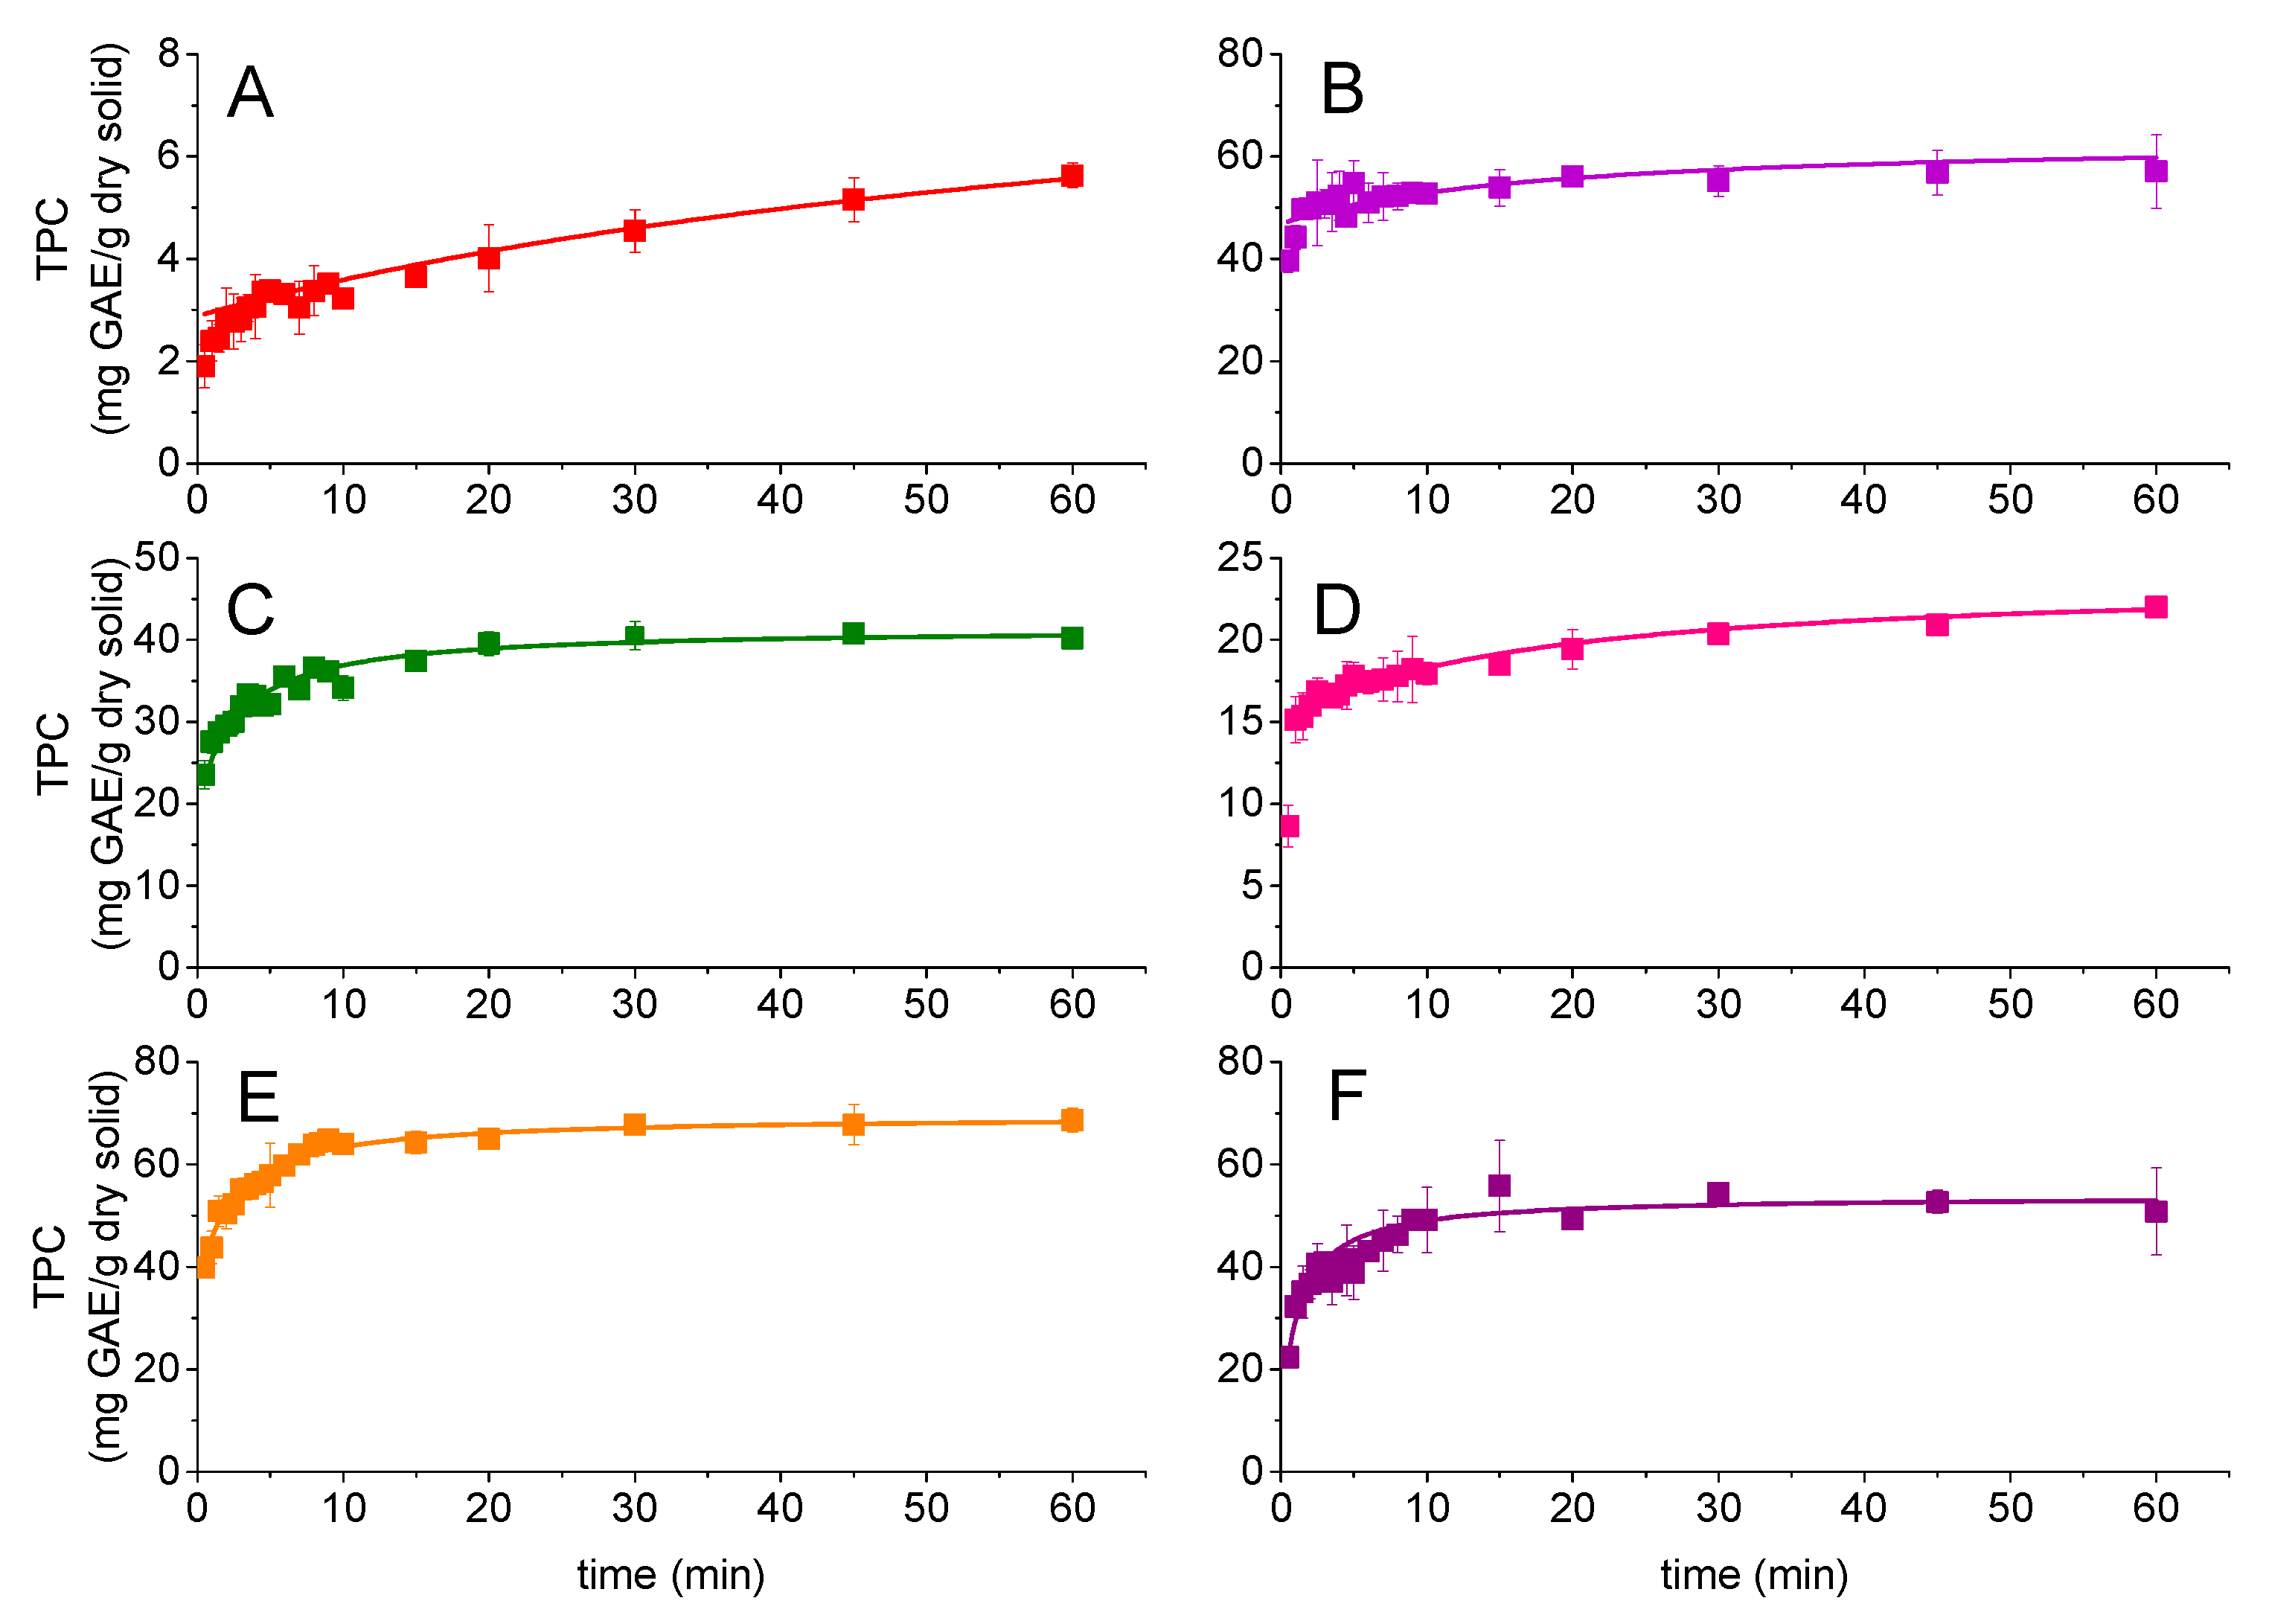
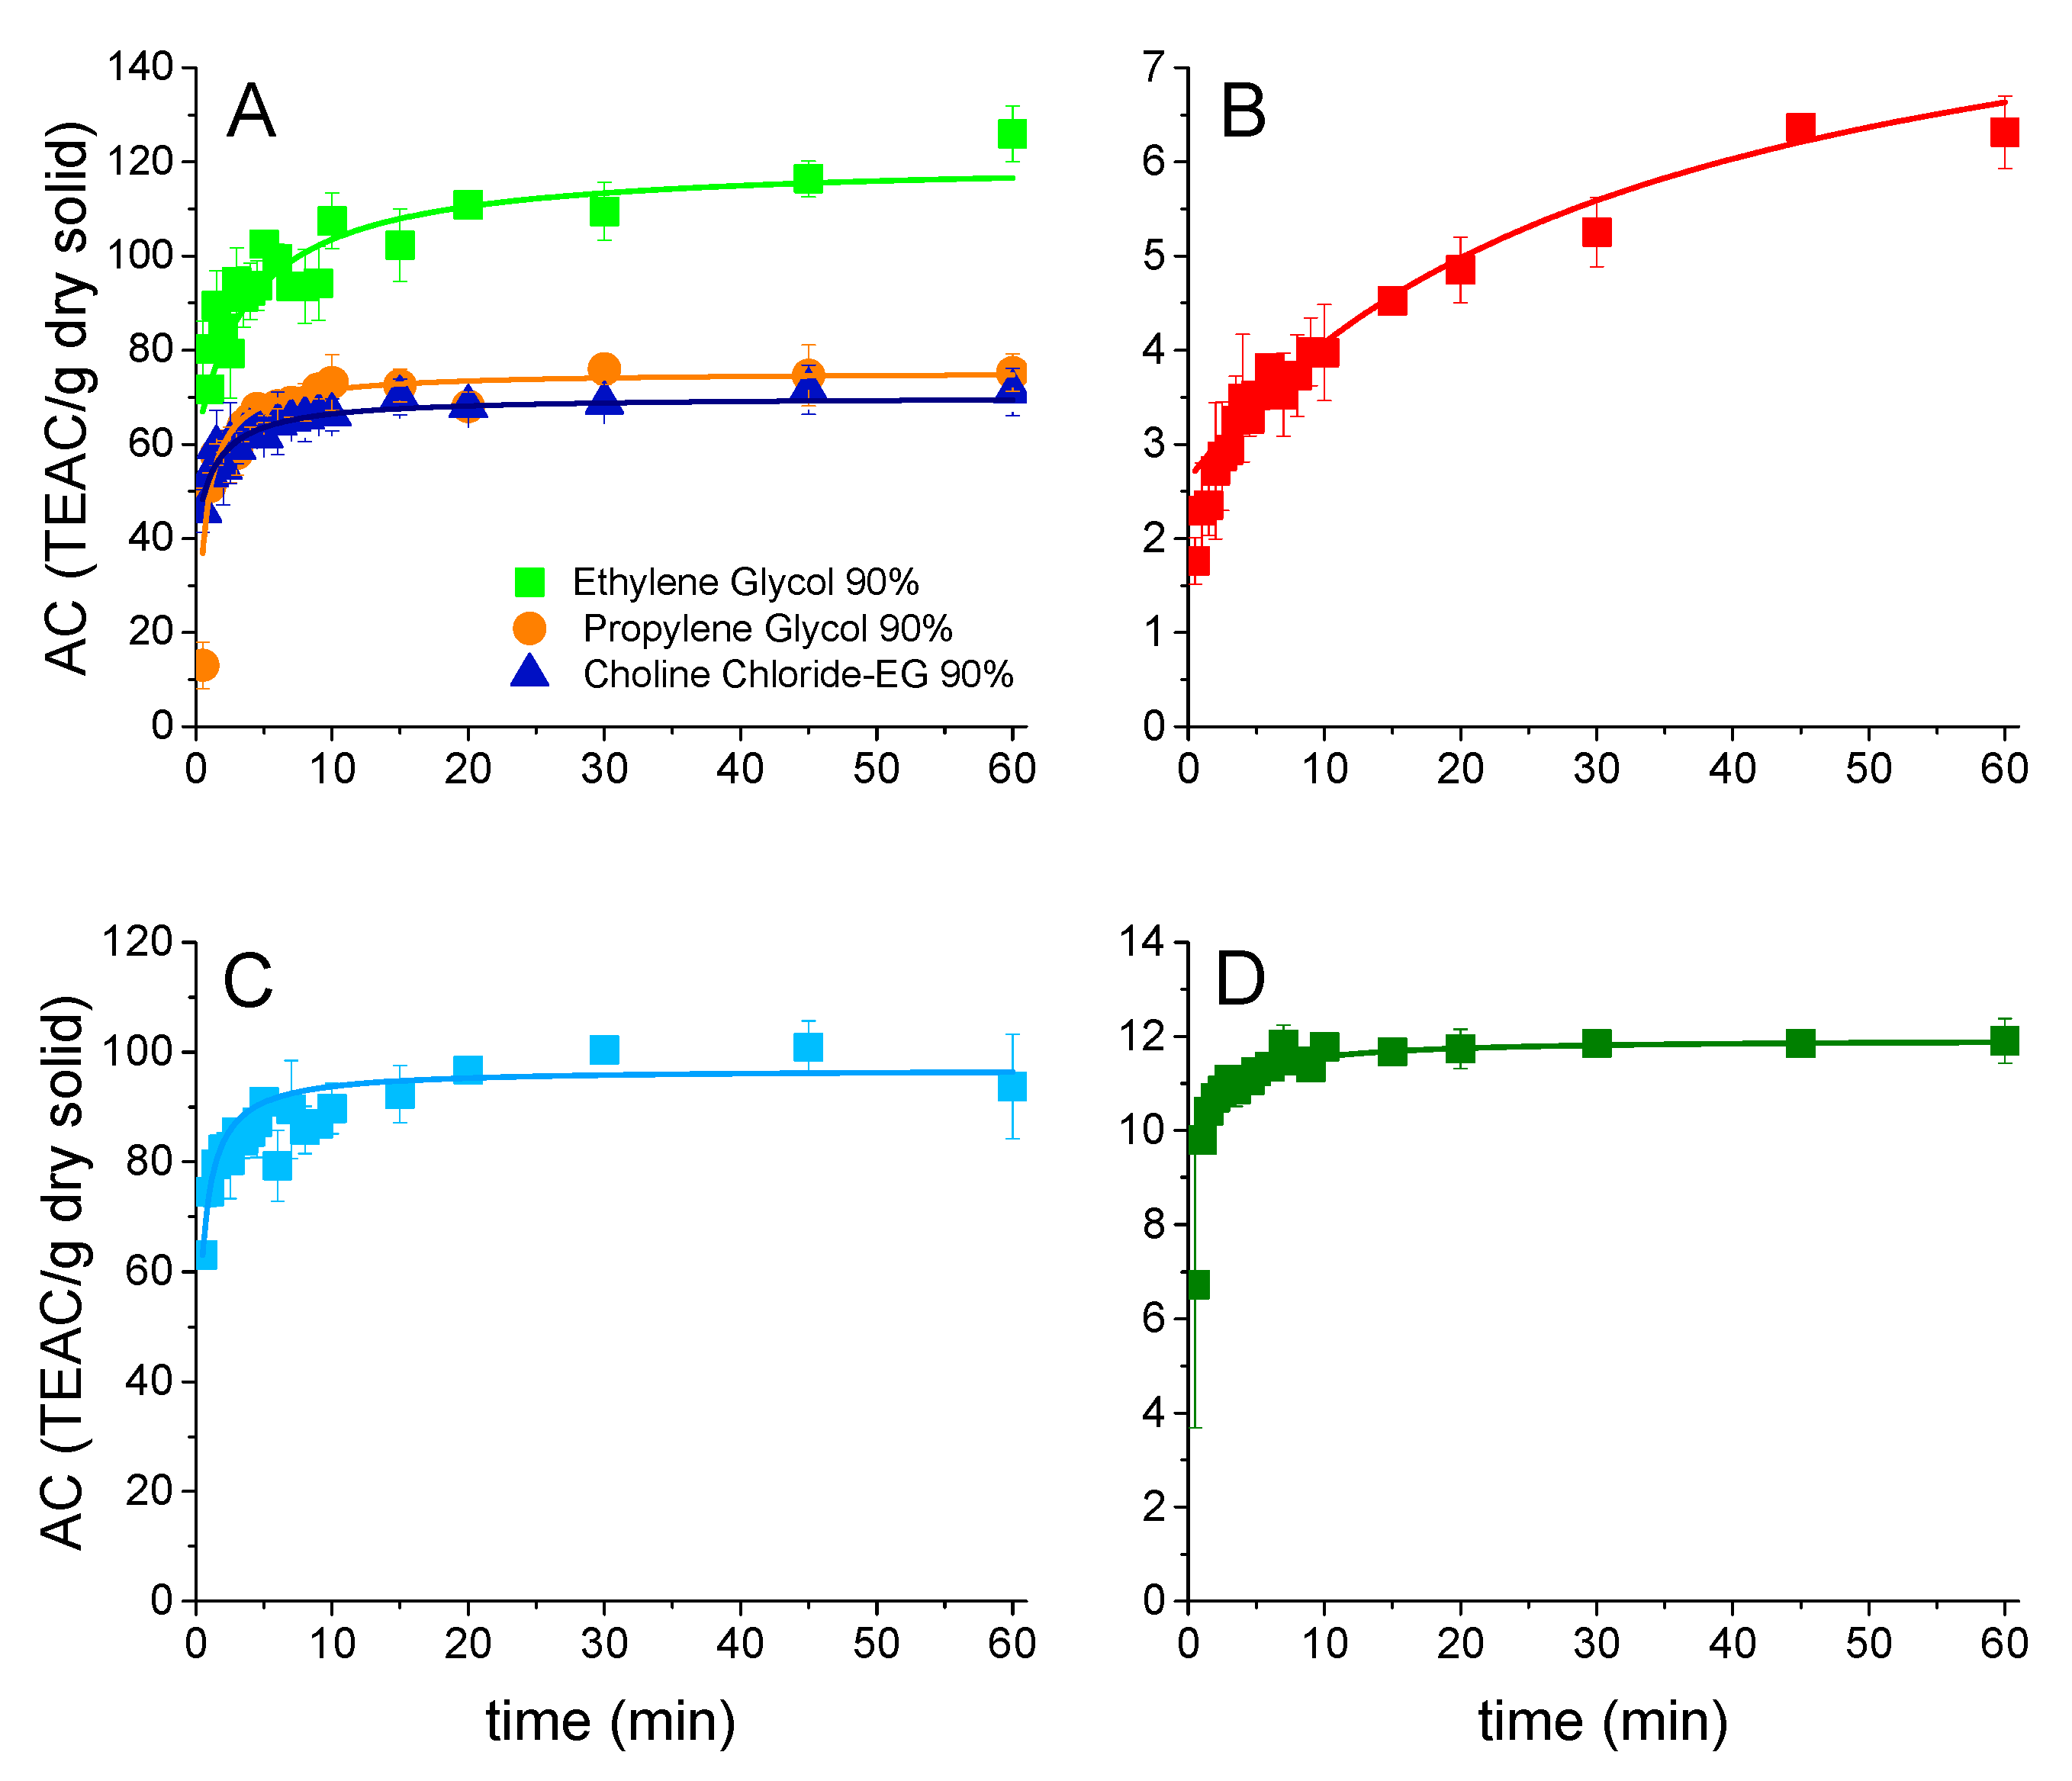
Applsci 12 04901 g007
Figure 8. Total phenolic content results, and their kinetic analysis, obtained during the extraction processes applied to GP using several solvents: (A) acetone at 25 °C, (B) acetone 80%: water 20% at 25 °C, (C) ethanol 96% at 70 °C, (D) water at 25 °C, (E) ethylene glycol at 70 °C, and (F) propylene glycol at 70 °C. The lines show the second-order kinetic model (Equation (1)) fitting to data.
Applsci 12 04901 g008
Figure 9. Antioxidant activity by DPPH method in points (data) and fit of the second-order kinetic model in lines. Results from grape pomace (GP) with a hydroalcoholic solution (ethanol/water 70%/30% v/v) at several temperatures: (A) 25 °C, (B) 50 °C, (C) 70 °C (green line and points: ethanol 70%; orange line and points: ethanol 96%), and (D) 90 °C.
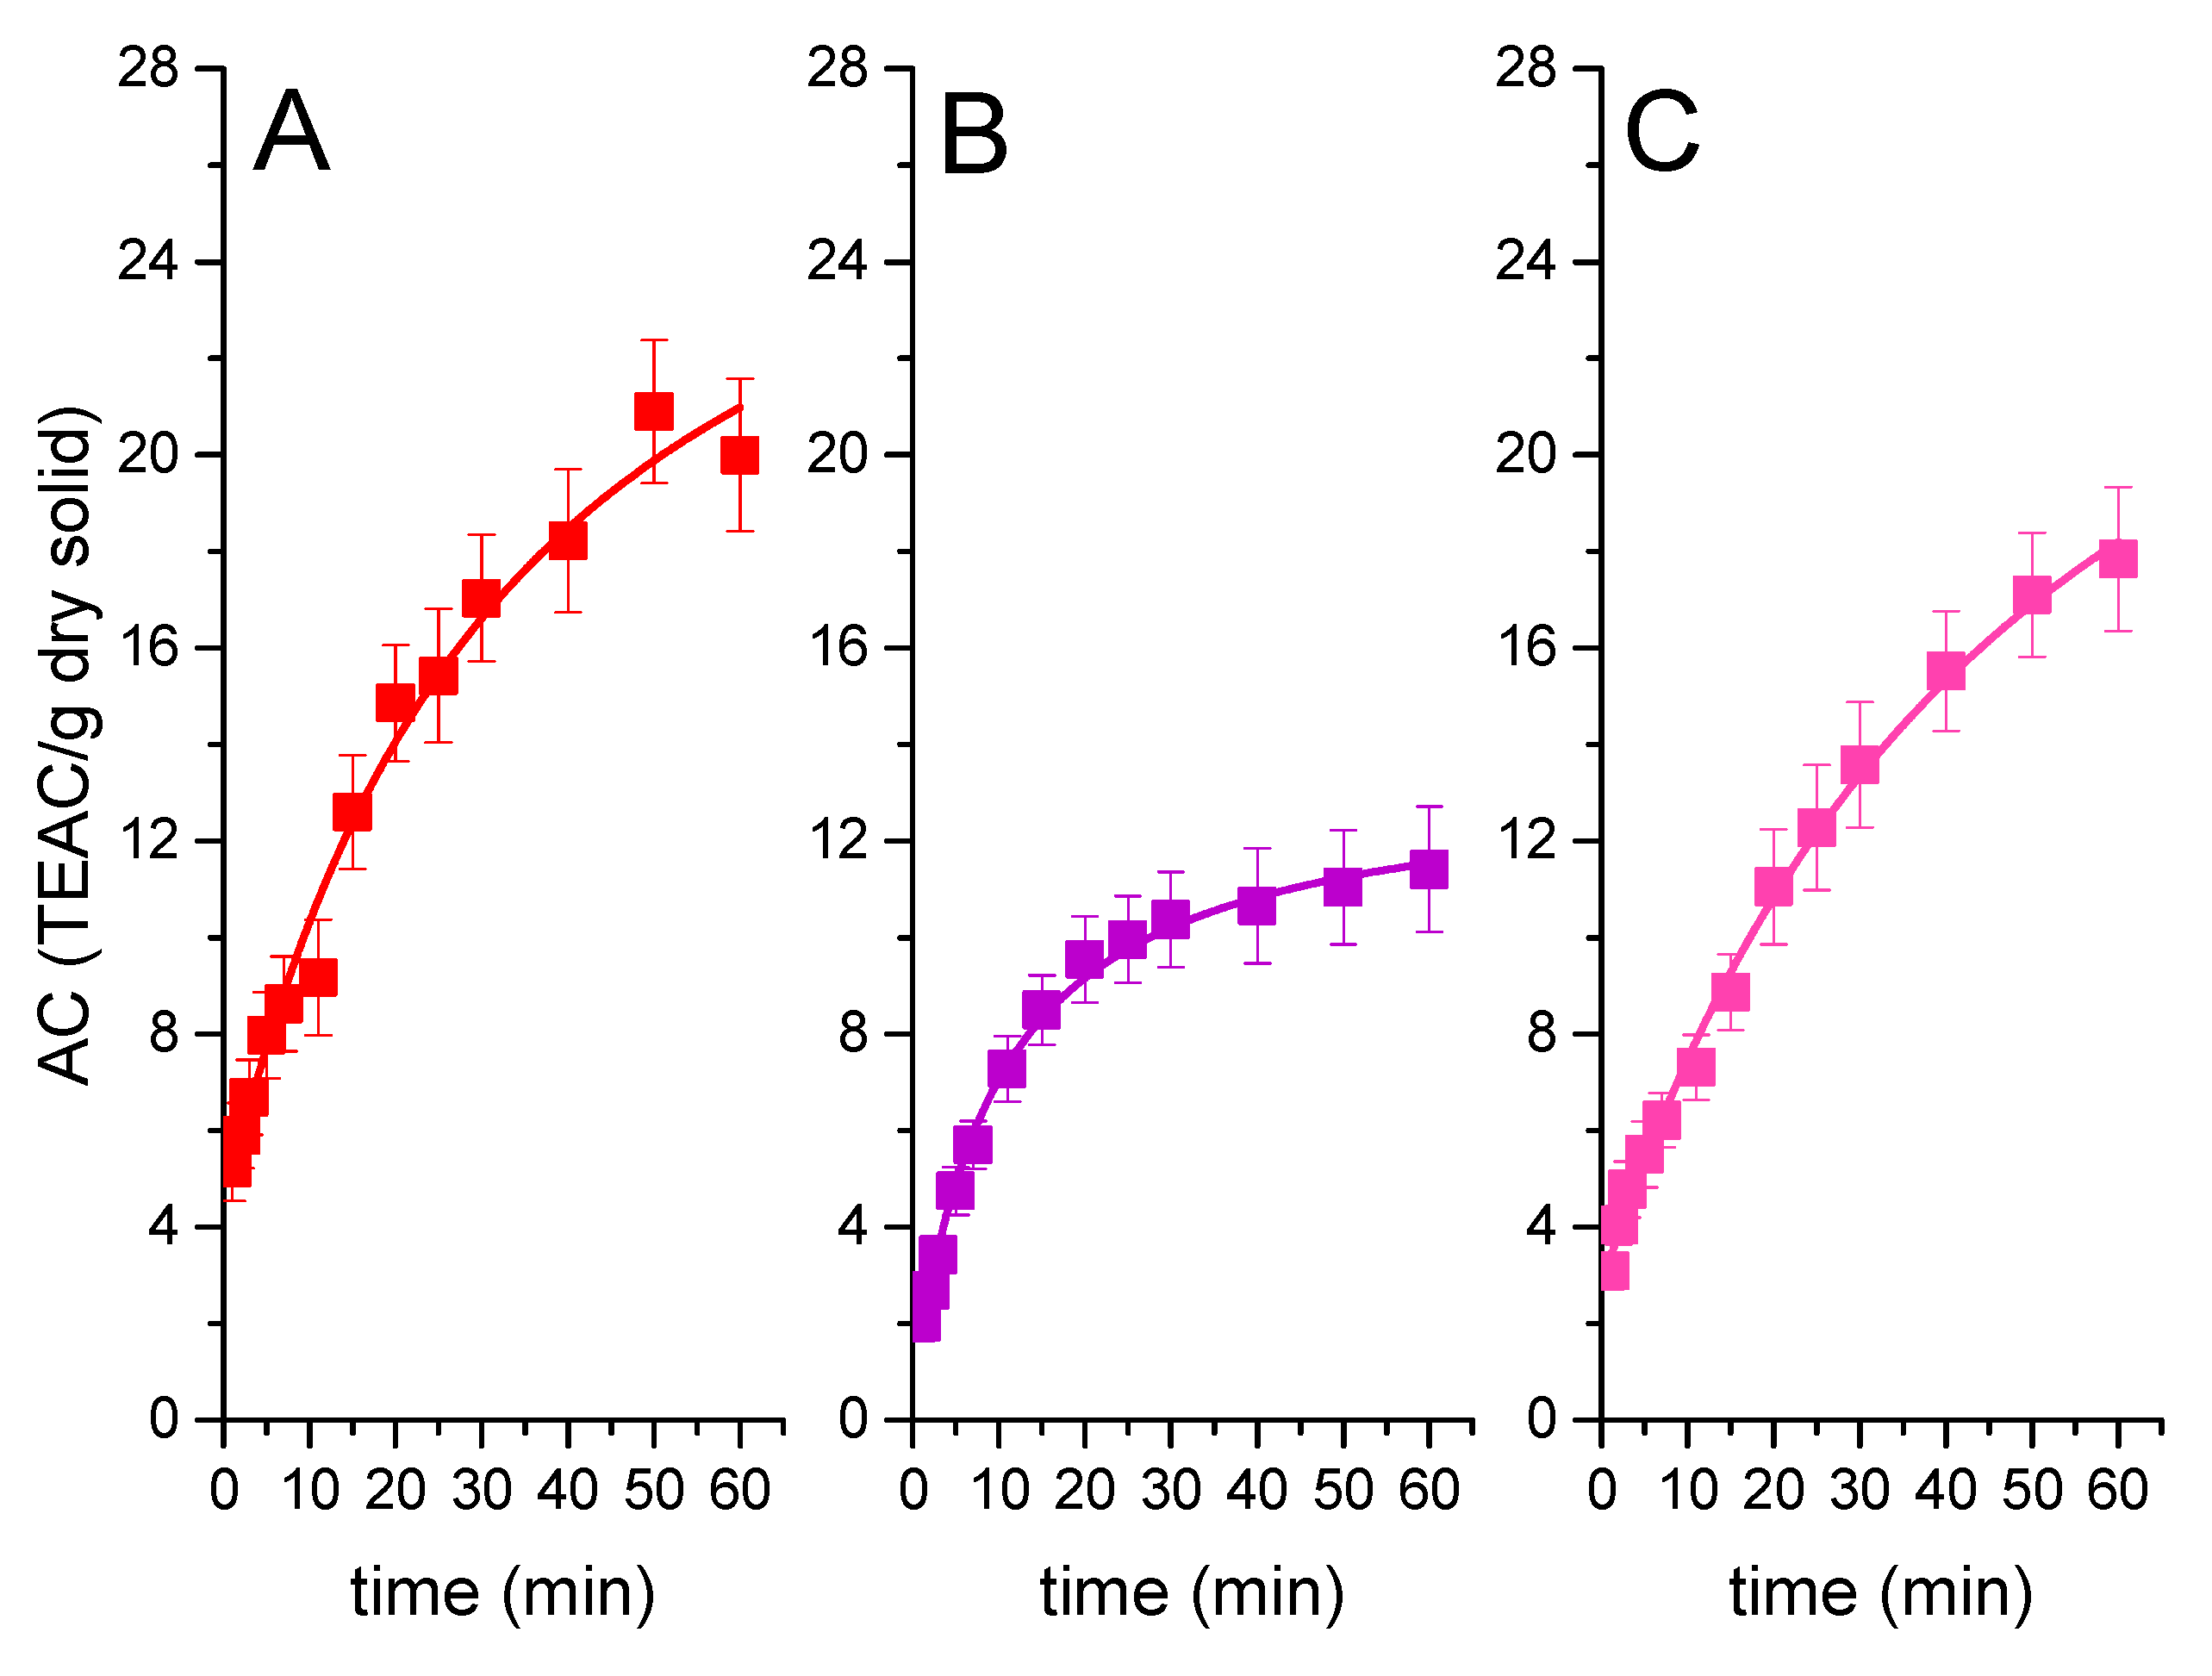
Applsci 12 04901 g009
Figure 10. Antioxidant activity (DPPH) results, and their kinetic analysis, obtained during the extraction processes applied to GP using several solvents: (A) glycols at 70 °C; (B) acetone at 25 °C, (C) acetone 80%: water 20% at 25 °C, and (D) water at 25 °C. The lines show the second-order kinetic model (Equation (1)) fitting to data.
Applsci 12 04901 g010
Again, there is a notable difference between the TPC and antioxidant capacity (AC) results: a 30% water content leads to a slightly better extraction of phenolics, but, for GP extractions, their AC is more than double that of the phenolics extracted with ethanol containing 4% water at 70 °C. Curiously, the AC/TPC ratio is worse for ethanol 96% (0.5) than for ethanol 70% (1.83, the best one for GP extraction), contrary to what is observed for AP extraction. As in the case of TPC, when comparing with AP extracts, these GP extracts have a much higher AC value in the best conditions (5 times higher).
In the case of the other extraction solvents, the ethylene glycol is highlighted as the better one, with high AC and TPC values, and a high AC/TPC ratio (1.7), followed by acetone 80% (v/v) extraction (AC/TPC ratio = 1.5), with the worst solvents being pure acetone and water. In the case of propylenglycol and the tested DES, the results are intermediate with both having similar AC results.
Contrary to the extraction of AP, GP extractions show high differences between solvents and solvents/water mixture due to the fact that the GP residue employed is a dry solid, so, as the residues do not add water, the extraction is only produced by the solvent. An addition of water to solvents is a good option as the mixtures produce higher extraction yields. Acetone 80%, ethyleneglycol 90%, and ethanol 70% have a high extractive capacity, emphasizing the importance of adding a notable percentage of water to these solvents. Possibly, the increase of extraction yield is due to the optimal hydrophilicity–hydrophobicity balance of the solvent mixture, more adequate to extract GP phenolics.

3.2. Kinetic Modeling of Extraction Process

All extraction results concerning TPC and AC have been used to fit a second-order kinetic model with two phases: an almost immediate washing or dissolution process followed by a slow extraction step, as indicated by Equation (1). After the adjustment of the mentioned kinetic equation to the relevant experimental data employing a Levenberg–Marquardt nonlinear regression algorithm, the kinetic constants and correlation values were calculated. The results have been compiled in Table 1, Table 2, Table 3 and Table 4. The values of R2 were superior to 0.9 in all cases, while the F values varied from 1757 to 10,854, leading to a p-value much lower than 0.01 at 95% confidence. Therefore, the mathematical model here proposed fits to the experimental data in each run. This can be further observed in Figure 1, Figure 2, Figure 3, Figure 4, Figure 5, Figure 6, Figure 7, Figure 8, Figure 9 and Figure 10 when comparing the coincidence between data points and fitting curves.
When fitting Equation (1) to the TPC results from the AP extraction (Table 1), the first observation is that q0, the initial TPC value, dramatically increases with temperature, suggesting that the solubility of the compounds that are dissolved during this initial phase increases exponentially with this variable. After calculating an apparent extraction rate (r0) in this phase by dividing q0 by the first sampling time, a finer study, representing ln(r0) versus the inverse value of absolute temperature (1/T)—Arrhenius equation—an exponential trend is again observed (as for q0 with T), but, in this case, the apparent activation energy (Ea) can be calculated, being equal to 19.92 kJ/mol, a value that should be considered essentially empirical, as it shows the exponential increase of solubility with temperature for this particular case: apple pomace and ethanol 70%: water 30% solution as solvent. This is also evident when fitting this same second-order equation to AC results; in this case, the Ea is 10.68 kg/mol, so temperature affects the extraction of phenolic compounds more than the extraction of their antioxidant activity during the washing phase. Thus, the nature of the compounds being dissolved could change with the temperature, suggesting that most active compounds in AP are more polar (for q0, time values are so low that no thermal deactivation exists). For q1 and for qe, there are maximum TPC values at 70 °C (10.6 ± 0.7 and 14.5 ± 1.1 mg GAE/gds, respectively) with a decrease between this temperature and 90 °C. This trend can be ascribed to a reduction in redox potential or to a certain collapse of the inner porous structure as the temperature approaches the boiling point of the extraction liquid. Again, there is no trend with temperature for the kinetic constant kd for TPC analysis, possibly indicating that there is a trade-off between accelerating effects due to increased diffusivity and phenolics desorption rate from pore surface and decelerating effects possibly due to pore structure collapse. Considering the experimental error, this idea can be extended to the analysis of AC kd values.
If we compare the results for different solvents at room temperature to extract active components from AP, we can observe that acetone 80% v/v is the best extractant for a fast extraction of total phenolics (q0 value similar to that of ethanol 70% or 96% at 70 °C); curiously, the addition of water to either ethanol or acetone reduces q0, suggesting a lower solubility of phenolics extracted during the washing phase when water is added. Values for q1 are similar for all acetone and ethanol mixtures, irrespective of water concentration, suggesting that the total amount of phenolics extracted is essentially constant for these solvents. In the case of acetone, the addition of water helps in the extraction slow phase, increasing two-fold the kd value: as this increase cannot be due to solvent viscosity (it is lower in the case of pure acetone), it should be due to the solvation power of the solvent for the phenolics extracted in this slow phase; this factor is key to explaining a higher solvent–solute interaction and, thus, the ability of the solvent to desorb the solute from the pore surface. The case of water is interesting: the relatively high value of q0 indicates a mild solvation power for phenolics during washing (therefore, these phenolics should be notably polar in nature, for example, due to their glycosylation), while a high value for q1 shows a good solvation power for those phenolics remaining in the porous structure at the beginning, compounds that are slowly extracted in the second extraction period, which can be expected when using a relatively viscous solvent (in comparison to the others here tested). The low value for kd, similar to that of pure acetone, can be explained, again, by the high viscosity of water, especially at 25 °C. Glycols are even better solvents from the TPC perspective in terms of q0 and qe, and their high viscosity, as in the case of water, can be the reason for the low values of kd.
Considering the results for TPC and AC values, as ethyleneglycol is toxic and due to economic and logistic reasons, for food and pharma applications, the ethanol 70%–water 30% mixture working at relatively high temperature (70 °C) is the best solvent to obtain active extracts from apple pomace, considering that a higher temperature, though it can be better for a fast extraction in the washing stage, in the end is deleterious for the antioxidant capacity of the extract. On average, the antioxidant mixtures obtained in these conditions, in terms of AC/TPC value (2.15), have a higher antioxidant potential than the one obtained with ethyleneglycol at 70 °C (AC/TPC = 0.95). As for acetone 80%, AC/TPC equals to 1.17, while ethanol 70% AC/TPC at 25 °C leads to a 1.36 value, which are fair ratios obtained with green solvent mixtures at low temperature, thus low thermal energy inputs during the extraction process.
The results from GP extraction indicate much higher final values for TPC (almost 10 times more) and AC (about 5 times higher), which reflects on q0, q1, qe, and kd values, with the values of this latter parameter being much dependent on the solvent. When ethanol 70% is used as solvent at several temperatures, q0 and q1 values show a mild exponential growth for TPC (Ea = 7.57 and 6.52 kJ/mol for q0 and q1, respectively) and a mild hyperbolic increase towards an asymptotic value around 70 (q0) and 48 (q1) mg TEAC/gds for the AC analysis (so a maximum extraction qe value of 118 mg TEAC/gds can be reached); this diversity indicates thermal degradation of AC power as the temperature increases. It is interesting to observe that kd reaches a maximum between 50 and 70 °C both for TPC and AC values, suggesting, again, thermal degradation at high temperature.
A more detailed analysis using the Arrhenius equation for the 25–50 and the 70–90 °C intervals for both TPC and AC kd results indicate Ea values of 21.1 and 16.0 kJ/mol for the low temperature interval (TPC and AC, respectively), indicating an activation of the slow extraction step, while Ea values for TPC and AC in the high temperature interval are −35.8 and −47.4 kJ/mol, indicating a sharp deactivation of the extraction rate (possibly, because extraction and thermal degradation happens at the same time, being the last phenomenon dominant in the high temperature interval). Thus, when aiming for high TPC and AC values (high q0 and qe), it is of interest to use relatively mild temperature values, designing process units and methods to avoid thermal degradation during phenolics extraction [19,20]. Moreover, if we compare kd trends with temperature for AP and GP phenolic extracts, it can be seen that AP extracts are more stable towards temperature.
Ethanol 96%, ethylene glycol 90%, and acetone 80% show a very fast TPC release in the first and the second extraction phases (q0 and q1), emphasizing once again the important role of low to medium water content to reach a good hydrophilic/hydrophobic balance and high solvation power [20]. Low or high values for kd for the solvents under consideration cannot be explained only on the basis of viscosity as, for example, acetone extraction in the second phase is very slow, while those with propylene glycol with 10% water is much faster. Thus, an explanation should be sought in a structure modification: solvents can play a role in the shrinkage or swelling of the porous structure of waste particles and acetone is a well-known dehydration agent, so shrinkage can be expected when using this solvent. Particle shrinkage results in the reduction of average pore diameter and an increase in mass transfer hindrances, thus explaining low kd values. At 70 °C, ethyleneglycol 90% extracts phenolics and AC with a similar performance to ethanol 70% in the long term. However, for a fast and effective extraction with an inexpensive, highly available, and nontoxic mixture, ethanol 70% is the obvious choice.
To extract phenolic compounds from AP or GP, several methods have been used (leaching with reflux using a Soxhlet apparatus, direct contact leaching with agitation or by arranging the material to be extracted in a fixed bed, macerating or homogenizing the solid in the solvent, electric pulses, pressure pulses, ultrasonic cavitation, microwaves, and pressurized liquid extraction), even combining various technologies and solvents (MeOH, EtOH, acetone, water, ionic liquids, DEPs, and supercritical fluids) [6,21]. For apple residues, TPC values vary between 3 and 200 mg GAE/gds, with most values between 3 and 7 mg GAE/gds [6], while these values have been reported to be between 6.2 and 196 mg GAE/gds for GP, with most values in the 30–80 mg GAE/gds range [3]. In this work, these values are around 13–26 mg GAE/gds for AP, and near 120 mg GAE/gds for GP.
Most classic extraction procedures seem to take between 60 min and 24 h to achieve high TPC values in the case of AP, while operation time reduces to 5–20 min for intensified processing (ultrasounds, microwaves, pressurized liquid extraction) [6]. The same can be said for GP, with optimal time values around 15 min for intensified methods and in the range 60–120 min for classic solid–liquid extraction [3,22]. These values are confirmed here, observing, in addition, that a very fast extraction, mostly boosted by ethanol–water mixtures at medium-high temperatures, results in a high percentage of total polyphenols being extracted in the first 2–3 min.
In recent years, some kinetic modeling studies showed that second-order kinetic models can better explain extraction from AP [23] and GP [24], showing in this latter case that biphasic models explain better the lixiviation kinetics. As indicated in this work, activation energy values for relevant kinetic constants show what type of phenomenon is controlling the extraction process, either mass-transfer (low Ea) or chemical phenomena (desorption followed by solvation on the solid pore inner surface, also known as solubilization or thermal deactivation) (high Ea). While second-order apparent behavior in mass-transfer driven processes can be explained by a sum of first-order phenomena [24], real second-order behavior can be expected when slow chemical phenomena such as site-specific desorption take place on the pore surface [14].

3.3. Compositional Analysis of Extraction Liquors

After selecting the optimal extraction method that uses ethanol 70% as the extractant and 90 °C as the operating temperature, an analysis of the AP and GP extracts’ composition was determined by HPLC and HPLC-MS, obtaining the results compiled in Table 5 and Table 6.
In the case of the AP extracts, despite having six different important peaks, there are only two different compounds: isoquercetin and quercetin glycosylated at different positions and with different sugar moieties such as rutin, a quercetin linked to rutinose or linked to arabinose. This composition is similar to others obtained with similar residues [13,14].
In the case of the GP, the extraction liquors are more complex with a high number of different molecules. The most abundant antioxidants detected are shown in Table 6. In the GP extracts, some of the compounds seem to be larger than the limit of detection employed, so we can only analyze the fragments of those compounds detected such as the tetra 2,3-dihydroxycinnamic acid or Di 2,3-dihydroxybenzoic acid + quinic acid.
As Table 6 reflects, GP extracts have more variability, presenting phenolic acids such as hydroxycinnamic acid derivatives, sinapic acid, and 2,3-dihydroxycinnamic acid with quinic acid and flavonols such as catechin and its derivatives, kaempferol, myricetin, isorhamnetin and derivatives, and anthocyanins such as procyanidin, delphinidin, petunidin, and malvidin. This composition is similar to those obtained in other works [3,25,26,27].

4. Conclusions

Apple and grape pomaces were valorized successfully to obtain extracts rich in antioxidant compounds with simple, efficient, and fast extractions, highlighting the extractions employing ethanol/water mixtures as solvents at mild-high temperature values. However, more solvents could be useful like ethyleneglycol or acetone/water mixtures, especially in the case of GP.
We can conclude that GP is the better raw material for the obtention of liquors with high antioxidant capacity, reaching a maximum of 131 TEAC/g dry solid in the extraction employing ethanol 70% (v/v) and 90 °C, that matches with the better extraction solvents in terms of TPC reaching a value of 73 mg GAE/g dry solid. Ethyleneglycol is a promising solvent too, but its toxicity reduces the range of applications, especially in the food and health sectors. Nevertheless, AP can be used to obtain more pure liquors as its composition is less complex, despite its TPC and antioxidant capacity being notably lower.
An in-depth, though empirical, kinetic analysis has been applied to all time-course TPC and AC data, achieving high regression coefficients and high to very high F-values, showing an almost perfect match of the kinetic model to all data. This kinetic model is identical for AP and GP: a second-order kinetic model that reflects an immediate washing or dissolution (first extraction phase) in the parameter q0 and a second extraction phase controlled by mass transport that is much slower and is characterized by the two parameters q1 and kd. Viscosity, solid structure modification by solvents, and the solvation power of such solvents seem to explain the differences between solvents while the Arrhenius equation suggests different controlling phenomena at diverse temperature intervals for TPC and AC with both wastes, including internal mass transfer and phenolic thermal degradation.
Finally, a fine characterization of liquors in terms of phenolic composition was achieved thanks to HPLC and HPLC-MS analysis.

Author Contributions

Conceptualization, V.E.S.M., P.Y.C., J.M.B. and M.L.; data curation, J.G.-M. and A.G.-M.; formal analysis, A.G.-M., P.Y.C. and M.L.; funding acquisition, V.E.S.M. and M.L.; investigation, J.G.-M., A.G.-M. and J.I.B.; methodology, A.G.-M., P.Y.C., J.M.B. and M.L.; project administration, V.E.S.M. and M.L.; resources, V.E.S.M. and J.M.B.; software, J.G.-M., J.I.B. and M.L.; supervision, V.E.S.M. and M.L.; validation, A.G.-M. and M.L.; writing—original draft, J.G.-M. and M.L.; writing—review and editing, V.E.S.M., P.Y.C., J.M.B. and M.L. All authors have read and agreed to the published version of the manuscript.

Funding

This work was kindly supported by the Spanish Science and Innovation Ministry though three research projects: PCI2018-093114, CTQ2017-84963-C2-1-R, and PID2020-114365RB-C21, funding that is gratefully acknowledged.

Institutional Review Board Statement

Not applicable.

Informed Consent Statement

Not applicable.

Data Availability Statement

All relevant data are included in the manuscript. Other data are available from the authors upon reasonable request.

Acknowledgments

We are very grateful to Eva Navascues López-Cordón (Pago de Carraovejas SL, Valladolid, Spain) and Eva Romeo Longares (COVILLASA, Zaragoza, Spain) for the gift for grape and apple pomaces, respectively, and their kind explanations of the processes where these wastes are created. The assistance and support in the pretreatment of grape pomace residues of Cynthia Hopson and the research group “Development of Processes and Products of Low Environmental Impact” (UCM) is gratefully acknowledged.

Conflicts of Interest

The authors declare no conflict of interest.

References

  1. Fierascu, R.C.; Fierascu, I.; Avramescu, S.M.; Sieniawska, E. Recovery of natural antioxidants from agro-industrial side streams through advanced extraction techniques. Molecules 2019, 24, 4212. [Google Scholar] [CrossRef] [PubMed] [Green Version]
  2. UN General Assembly Transforming Our World: The 2030 Agenda for Sustainable Development. Available online: https://www.refworld.org/docid/57b6e3e44.html (accessed on 15 February 2022).
  3. Tapia Quirós, P.; Reig, M.; Vecino, X.; Cortina, L.; Saurina, J.; Granados, M. Recovery of polyphenols from agri-food by-products: The olive oil and winery industries cases. Foods 2022, 11, 362. [Google Scholar] [CrossRef] [PubMed]
  4. Food and Agriculture Organization of the United Nations. FAOSTAT Data Crops. Available online: https://www.fao.org/faostat/en/#home (accessed on 15 February 2022).
  5. Cano, M.E.; García-Martin, A.; Comendador Morales, P.; Wojtusik, M.; Santos, V.E.; Kovensky, J.; Ladero, M. Production of oligosaccharides from agrofood wastes. Fermentation 2020, 6, 31. [Google Scholar] [CrossRef] [Green Version]
  6. Da Silva, L.C.; Viganó, J.; de Souza Mesquita, L.M.; Dias, A.L.B.; de Souza, M.C.; Sanches, V.L.; Chaves, J.O.; Pizani, R.S.; Contieri, L.S.; Rostagno, M.A. Recent advances and trends in extraction techniques to recover polyphenols compounds from apple by-products. Food Chem. X 2021, 12, 100133. [Google Scholar] [CrossRef]
  7. Barreira, J.C.; Arraibi, A.A.; Ferreira, I.C. Bioactive and functional compounds in apple pomace from juice and cider manufacturing: Potential use in dermal formulations. Trends Food Sci. Technol. 2019, 90, 76–87. [Google Scholar] [CrossRef]
  8. Ahmad, B.; Yadav, V.; Yadav, A.; Rahman, M.U.; Yuan, W.Z.; Li, Z.; Wang, X. Integrated biorefinery approach to valorize winery waste: A review from waste to energy perspectives. Sci. Total Environ. 2020, 719, 137315. [Google Scholar] [CrossRef]
  9. Miller, K.V.; Noguera, R.; Beaver, J.; Medina-Plaza, C.; Oberholster, A.; Block, D.E. A mechanistic model for the extraction of phenolics from grapes during red wine fermentation. Molecules 2019, 24, 1275. [Google Scholar] [CrossRef] [Green Version]
  10. Durazzo, A.; Lucarini, M.; Souto, E.B.; Cicala, C.; Caiazzo, E.; Izzo, A.A.; Novellino, E.; Santini, A. Polyphenols: A concise overview on the chemistry, occurrence, and human health. Phytother. Res. 2019, 33, 2221–2243. [Google Scholar] [CrossRef] [Green Version]
  11. Alara, O.R.; Abdurahman, N.H.; Ukaegbu, C.I. Extraction of phenolic compounds: A review. Curr. Res. Food Sci. 2021, 4, 200–214. [Google Scholar] [CrossRef]
  12. Ozturk, B.; Parkinson, C.; Gonzalez-Miquel, M. Extraction of polyphenolic antioxidants from orange peel waste using deep eutectic solvents. Sep. Purif. Technol. 2018, 206, 1–13. [Google Scholar] [CrossRef]
  13. Ribeiro, L.F.; Ribani, R.H.; Francisco, T.M.G.; Soares, A.A.; Pontarolo, R.; Haminiuk, C.W.I. Profile of bioactive compounds from grape pomace (Vitis vinifera and Vitis labrusca) by spectrophotometric, chromatographic and spectral analyses. J. Chromatogr. B Anal. Technol. Biomed. Life Sci. 2015, 1007, 72–80. [Google Scholar] [CrossRef] [PubMed]
  14. Islam, M.A.; Chowdhury, M.A.; Mozumder, M.S.I.; Uddin, M.T. Langmuir adsorption kinetics in liquid media: Interface reaction model. ACS Omega 2021, 6, 14481–14492. [Google Scholar] [CrossRef] [PubMed]
  15. Martin-Dominguez, V.; Aleman Cabrera, P.I.; Eidt, L.; Pruesse, U.; Kuenz, A.; Ladero, M.; Santos, V.E. Production of fumaric acid by Rhizopus arrhizus NRRL 1526: A simple production medium and the kinetic modelling of the bioprocess. Fermentation 2022, 8, 64. [Google Scholar] [CrossRef]
  16. Suárez, B.; Álvarez, Á.L.; García, Y.D.; del Barrio, G.; Lobo, A.P.; Parra, F. Phenolic profiles, antioxidant activity and in vitro antiviral properties of apple pomace. Food Chem. 2010, 120, 339–342. [Google Scholar] [CrossRef] [Green Version]
  17. Cuevas-Valenzuela, J.; González-Rojas, Á.; Wisniak, J.; Apelblat, A.; Pérez-Correa, J.R. Solubility of (+)-catechin in water and water-ethanol mixtures within the temperature range 277.6–331.2 K: Fundamental data to design polyphenol extraction processes. Fluid Phase Equilibria 2014, 382, 279–285. [Google Scholar] [CrossRef]
  18. Sólyom, K.; Solá, R.; Cocero, M.J.; Mato, R.B. Thermal degradation of grape marc polyphenols. Food Chem. 2014, 159, 361–366. [Google Scholar] [CrossRef]
  19. Manara, P.; Zabaniotou, A.; Vanderghem, C.; Richel, A. Lignin extraction from Mediterranean agro-wastes: Impact of pretreatment conditions on lignin chemical structure and thermal degradation behavior. Catal. Today 2014, 223, 25–34. [Google Scholar] [CrossRef]
  20. Reis, S.F.; Rai, D.K.; Abu-Ghannam, N. Water at room temperature as a solvent for the extraction of apple pomace phenolic compounds. Food Chem. 2012, 135, 1991–1998. [Google Scholar] [CrossRef] [Green Version]
  21. Waldbauer, K.; McKinnon, R.; Kopp, B. Apple pomace as potential source of natural active compounds. Planta Med. 2017, 83, 994–1010. [Google Scholar] [CrossRef] [Green Version]
  22. Razgonova, M.; Zakharenko, A.; Pikula, K.; Manakov, Y.; Ercisli, S.; Derbush, I.; Kislin, E.; Seryodkin, I.; Sabitov, A.; Kalenik, T.; et al. Lc-ms/ms screening of phenolic compounds in wild and cultivated grapes vitis amurensis rupr. Molecules 2021, 26, 3650. [Google Scholar] [CrossRef]
  23. Hobbi, P.; Okoro, O.V.; Delporte, C.; Alimoradi, H.; Podstawczyk, D.; Nie, L.; Bernaerts, K.V.; Shavandi, A. Kinetic modelling of the solid–liquid extraction process of polyphenolic compounds from apple pomace: Influence of solvent composition and temperature. Bioresour. Bioprocess. 2021, 8, 114. [Google Scholar] [CrossRef]
  24. Natolino, A.; Da Porto, C. Kinetic models for conventional and ultrasound assistant extraction of polyphenols from defatted fresh and distilled grape marc and its main components skins and seeds. Chem. Eng. Res. Des. 2020, 156, 1–12. [Google Scholar] [CrossRef]
  25. Flamini, R. Recent applications of mass spectrometry in the study of grape and wine polyphenols. ISRN Spectrosc. 2013, 2013, 813563. [Google Scholar] [CrossRef]
  26. De Villiers, A.; Vanhoenacker, G.; Majek, P.; Sandra, P. Determination of anthocyanins in wine by direct injection liquid chromatography-diode array detection-mass spectrometry and classification of wines using discriminat analysis. J. Chromatogr. A 2004, 1054, 195–204. [Google Scholar] [CrossRef]
  27. Li, J.; Zhang, S.; Zhang, M.; Sun, B. Novel approach for extraction of grape skin antioxidants by accelerated solvent extraction: Box–Behnken design optimization. J. Food Sci. Technol. 2019, 56, 4879–4890. [Google Scholar] [CrossRef]
Table 1. Kinetic parameters from the extraction process of AP measuring total phenolic content (TPC) by Folin–Ciocalteu’s method; q0, q1, and qe are measured in mg GAE/gds, while kd units are gds/(mg GAE·min).
Extractionq0q1 qe kd r2
Ethanol 70% (v/v) 25 °C1.3 ± 0.29.6 ± 0.410.9 ± 0.60.02 ± 3 × 10−30.99
Ethanol 70% (v/v) 50 °C3.0 ± 0.19.6 ± 0.212.6 ± 0.20.01 ± 1 × 10−30.99
Ethanol 70% (v/v) 70 °C3.9 ± 0.410.6 ± 0.714.5 ± 1.19 × 10⁻³ ± 3 × 10−30.97
Ethanol 70% (v/v) 90 °C5.7 ± 0.17.5 ± 0.213.2 ± 0.30.02 ± 2 × 10−30.99
Ethanol 96% (v/v) 70 °C4.5 ± 0.29.0 ± 0.913.5 ± 1.15 × 10⁻³ ± 2 × 10−30.98
Acetone 100% (v/v) 25 °C4.3 ± 0.18.8 ± 0.613.1 ± 0.75 × 10⁻³ ± 1 × 10−30.99
Acetone 80% (v/v) 25 °C3.4 ± 0.29.0 ± 0.312.4 ± 0.50.01 ± 2 × 10−30.99
Water 25 °C4.0 ± 0.219.3 ± 3.823.3 ± 4.06 × 10⁻⁴ ± 3 × 10−40.99
Ethylene glycol 90% (v/v) 70 °C5.4 ± 0.439.3 ± 6.544.7 ± 6.95 × 10⁻⁴ ± 2 × 10−40.98
Propylene glycol 90% (v/v) 70 °C3.9 ± 0.336.3 ± 4.040.2 ± 4.37 × 10⁻⁴ ± 2 × 10−40.99
Table 2. Kinetic parameters from the extraction process of AP measuring antioxidant capacity by DPPH method; q0, q1, and qe are measured in TEAC/gds, while kd units are gds/(TEAC·min).
Extractionq0 q1 qe kd r2
Ethanol 70% (v/v) 25 °C3.0 ± 0.211.8 ± 0.714.8 ± 0.65 × 10⁻³ ± 1 × 10−30.99
Ethanol 70% (v/v) 50 °C5.2 ± 0.220.5 ± 1.725.7 ± 0.21 × 10⁻³ ± 3 × 10−40.99
Ethanol 70% (v/v) 70 °C5.7 ± 0.225.5 ± 2.931.2 ± 1.17 × 10⁻⁴ ± 9 × 10−50.99
Ethanol 70% (v/v) 90 °C6.5 ± 0.325.1 ± 1.431.6 ± 0.32 × 10⁻³ ± 4 × 10−40.99
Ethanol 96% (v/v) 70 °C3.7 ± 0.25.6 ± 0.99.3 ± 1.14 × 10⁻³ ± 1 × 10−30.96
Acetone 100% (v/v) 25 °C4.5 ± 0.113.7 ± 1.118.2 ± 0.72 × 10⁻³ ± 4 × 10−40.99
Acetone 80% (v/v) 25 °C3.4 ± 0.230.5 ± 3.233.7 ± 0.52 × 10⁻⁴ ± 2 × 10−40.99
Water 25 °C2.7 ± 0.36.4 ± 1.38.6 ± 4.04 × 10⁻³ ± 3 × 10−30.96
Ethylene glycol 90% (v/v) 70 °C4.5 ± 0.326.5 ± 2.731.0 ± 6.91 × 10⁻³ ± 3 × 10−40.99
Propylene glycol 90% (v/v) 70 °C0.8 ± 0.213.0 ± 0.313.8 ± 6.97 × 10⁻³ ± 7 × 10−40.97
ChCl: EG (1:4)
90% (v/v) 70 °C
2.8 ± 0.229.6 ± 3.031.4 ± 4.36 × 10⁻⁴ ± 2 × 10−40.99
Table 3. Kinetic parameters from the extraction process of GP measuring total phenolic content (TPC) by Folin–Ciocalteu’s method; q0, q1, and qe are measured in mg GAE/gds, while kd units are gds/(mg GAE·min).
Extractionq0 q1 qe kd r2
Ethanol 70% (v/v) 25 °C27.4 ± 1.117.0 ± 1.034.4 ± 2.10.02 ± 3 × 10−30.95
Ethanol 70% (v/v) 50 °C28.9 ± 3.225.7 ± 2.754.6 ± 5.90.03 ± 5 × 10−30.98
Ethanol 70% (v/v) 70 °C37.7 ± 3.220.3 ± 1.558.0 ± 4.70.03 ± 4 × 10−30.98
Ethanol 70% (v/v) 90 °C45.8 ± 0.831.3 ± 2.176.1 ± 2.90.01 ± 4 × 10−30.98
Ethanol 96% (v/v) 70 °C19.4 ± 10.522.0 ± 9.041.4 ± 19.50.02 ± 7 × 10−30.96
Acetone 100% (v/v) 25 °C2.9 ± 0.26.1 ± 3.09.0 ± 3.22 × 10⁻³ ± 1 × 10−30.84
Acetone 80% (v/v) 25 °C46.8 ± 1.216.8 ± 4.863.6 ± 6.03 × 10⁻³ ± 2 × 10−30.82
Water 25 °C15.0 ± 0.58.8 ± 0.723.8 ± 1.27 × 10⁻³ ± 4 × 10−30.95
Ethylene glycol 90% (v/v) 70 °C34.4 ± 3.735.1 ± 3.369.5 ± 7.00.01 ± 2 × 10−30.96
Propylene glycol 90% (v/v) 70 °C9.3 ± 2.844.5 ± 2.153.8 ± 4.90.02 ± 4 × 10−30.99
Table 4. Kinetic parameters from the extraction process of GP measuring antioxidant capacity by DPPH method; q0, q1, and qe are measured in TEAC/gds, while kd units are gds/(TEAC·min).
Extractionq0 q1 qe kd r2
Ethanol 70% (v/v) 25 °C50 ± 0.541 ± 0.591 ± 1.09 × 10⁻³ ± 5 × 10−40.99
Ethanol 70% (v/v) 50 °C70 ± 8.238 ± 7.7108 ± 160.015 ± 5 × 10−30.82
Ethanol 70% (v/v) 70 °C69 ± 6.847 ± 6.0116 ± 130.015 ± 4 × 10−30.95
Ethanol 70% (v/v) 90 °C73 ± 1.848 ± 1.4121 ± 3.26 × 10⁻³ ± 1 × 10−30.99
Ethanol 96% (v/v) 70 °C19 ± 3.215 ± 3.234 ± 6.40.05 ± 6 × 10−30.98
Acetone 100% (v/v) 25 °C2.6 ± 0.26.2 ± 0.78.8 ± 0.95 × 10⁻³ ± 2 × 10−30.96
Acetone 80% (v/v) 25 °C28 ± 8.869 ± 2198 ± 300.030 ± 0.0110.95
Water 25 °C8.8 ± 0.43.2 ± 0.412 ± 0.80.23 ± 0.0230.98
Ethylene glycol 90% (v/v) 70 °C60 ± 4.460 ± 3.4120 ± 7.84 × 10⁻³ ± 2 × 10−30.95
Propylene glycol 90% (v/v) 70 °C-75 ± 2175 ± 210.025 ± 9 × 10−30.90
ChCl: EG (1:4)
90% (v/v) 70 °C
41 ± 4.230 ± 3.971 ± 8.10.024 ± 4 × 10−30.94
Table 5. List of principal compounds obtained from the apple pomace extraction with ethanol 70% (v/v) and 90 °C and their mass spectrometric data.
Compoundtr (min)MW (g/mol)UV Spectrum Pattern (ʎ*máx)
Quercetin-Arabinose-Arabinose32.67565.3254
Rutin41.68610.5254, 354
Isoquercitrin42.30464.4254, 354
Quercetin-Arabinose 1 *43.97434.3254, 354
Quercetin-Arabinose 2 *45.04434.3254, 354
Quercetin-Fucose or Rhamnose45.46448.4254, 354
* The compound was glycosylated one time at two different positions, but the position could not be determined.
Table 6. List of principal compounds obtained from the grape skin extraction with ethanol 70% (v/v) and 90 °C and their mass spectrometric data.
CompoundMW (g/mol)
Tetramer 2,3-dihydroxycinnamic acid684
Catechin290
Di-Catechin + Gallic acid730
Malvidin-O-Glucoside493
Dihydro 2,3-dihydroxycinnamic acid + quinic acid356
Sinapic acid224
2,3-dihydroxybenzoic acid + quinic acid328
Dimer (2,3-dihydroxybenzoic acid + quinic acid)638
Kaempferol-O-xiloside418
Myricetin-O-rhamnoside464
Procyanidin dimer578
Delphinidin-O-glucoside465
Isorhamnetin + acetylglucuronic acid534
Petunidin + glucuronic acid493
Malvidin acetyl glucoside535
Publisher’s Note: MDPI stays neutral with regard to jurisdictional claims in published maps and institutional affiliations.

