Article

A Configurable Dependency Model of a SCADA System for Goal-Oriented Risk Assessment

1
School of Computer Science and Informatics, Cardiff University, Cardiff CF10 3AT, UK
2
Department of Computer and Information Science, Linköping University, 581 83 Linköping, Sweden
3
Airbus Group, Duffryn, Newport NP10 8FZ, UK
*
Author to whom correspondence should be addressed.
Appl. Sci. 2022, 12(10), 4880; https://doi.org/10.3390/app12104880
Submission received: 28 March 2022 / Revised: 21 April 2022 / Accepted: 22 April 2022 / Published: 11 May 2022
(This article belongs to the Topic Cyber Security and Critical Infrastructures)

Abstract

:
A key purpose of a Supervisory Control and Data Acquisition (SCADA) system is to enable either an on-site or remote supervisory control and monitoring of physical processes of various natures. In order for a SCADA system to operate safely and securely, a wide range of experts with diverse backgrounds must work in close rapport. It is critical to have an overall view of an entire system at a high level of abstraction which is accessible to all experts involved, and which assists with gauging and assessing risks to the system. Furthermore, a SCADA system is composed of a large number of interconnected technical and non-technical sub-elements, and it is crucial to capture the dependencies between these sub-elements for a comprehensive and rigorous risk assessment. In this paper, we present a generic configurable dependency model of a SCADA system which captures complex dependencies within a system and facilitates goal-oriented risk assessment. The model was developed by collecting and analysing the understanding of the dependencies within a SCADA system from 36 domain experts. We describe a methodology followed for developing the dependency model, present an illustrative example where the generic dependency model is configured for a SCADA system controlling water distribution, and outline an exemplary risk assessment process based on it.
Dataset License: CC-BY-NC.

1. Introduction

The main purpose of a Supervisory Control and Data Acquisition (SCADA) system is to enable on-site or remote supervisory control and monitoring of physical processes of various nature: manufacturing processes, water distribution, transportation, gas and oil, etc.). It does so by collecting, analysing and visualising data from field devices, and by changing the state of field devices in response to any disruptive change.
SCADA systems control physical processes in many sectors including those which form a Critical National Infrastructure (CNI): Chemicals, Civil Nuclear, Energy, Food, Water, Space, and Transport. Therefore, the cyber security and safety of a CNI as well as of many other industrial processes heavily relies on the secure and safe operation of supporting SCADA systems. A compromised SCADA system may have a detrimental impact on the availability and integrity of critical services, and it could lead to the loss of life, casualties, and significant environmental, economic and social impacts.
SCADA systems provide direct links from a digital world into physical processes that may drastically affect physical resources, environment and even human health and lives. In 2000, the unauthorised tampering with a SCADA system in the Maroochy Water System by a former system engineer led to sewage overflow and resulted in the damage to the surrounding environment [1]. In 2010, the Stuxnet computer worm was used in an attack on the Iranian nuclear facility, leading to the failure of one-fifth of all centrifuges [2]. The Stuxnet attack vividly illustrated the possible severe consequences of a cyber attack on CNI. In 2020, Honda factories had to freeze global production after a ransomware attack, which intended to disrupt ICSs. The overview of 43 historical attacks on Industrial Control Systems (ICS) [1]—a SCADA system is a type of ICS—highlights the critical role that a SCADA system may play in a cyber attack. The cyber attacks on SCADA systems are considered to be one of the popular vectors of attacks on CNI [3].
Since SCADA systems underpin many industrial and critical processes, it is of pivotal importance to manage efficiently risks within SCADA systems [4]. In SCADA and other ICS systems, achieving a safe and secure operation of a system depends on a large number of diverse factors of different nature, including but not limited to administrational, regulatory, human-oriented, technical and environmental factors. These factors must be captured and analysed.
For an efficient risk assessment and management to be in place, a wide range of experts including network and hardware engineers, software developers, system operators, Human Resources (HR) administrators, and floor managers (non-exhaustive list of roles involved) with diverse backgrounds must communicate and work in rapport. Any risk decision related to the safe and secure operation of a complex multi-variable system such as a SCADA system requires a rigorous justification built upon a well-documented evidence base. In this scenario, it is critical to have an overall view of the entire system accessible to all experts. This “helicopter” view of a SCADA system will help to gauge risks to the system and its components.
A SCADA system is a complex system composed of a large number of interconnected and mutually influencing technical and non-technical components. It is crucial for risk assessment methodology applied in the context of a SCADA system to account for the dependencies between the components within the system as well as for the dependencies on external systems, upon which the system under analysis has no control.
In this paper, we present a method of assessing cyber security risk in the context of a SCADA system which is based on dependency modelling. Dependency modelling is an objective-driven, dynamic, dependency-defining approach, which is standardised by the Open Group [5]. We explain the dependency modelling method in detail in Section 2. The dependency modelling approach in the context of a SCADA system aims to answer the following questions:
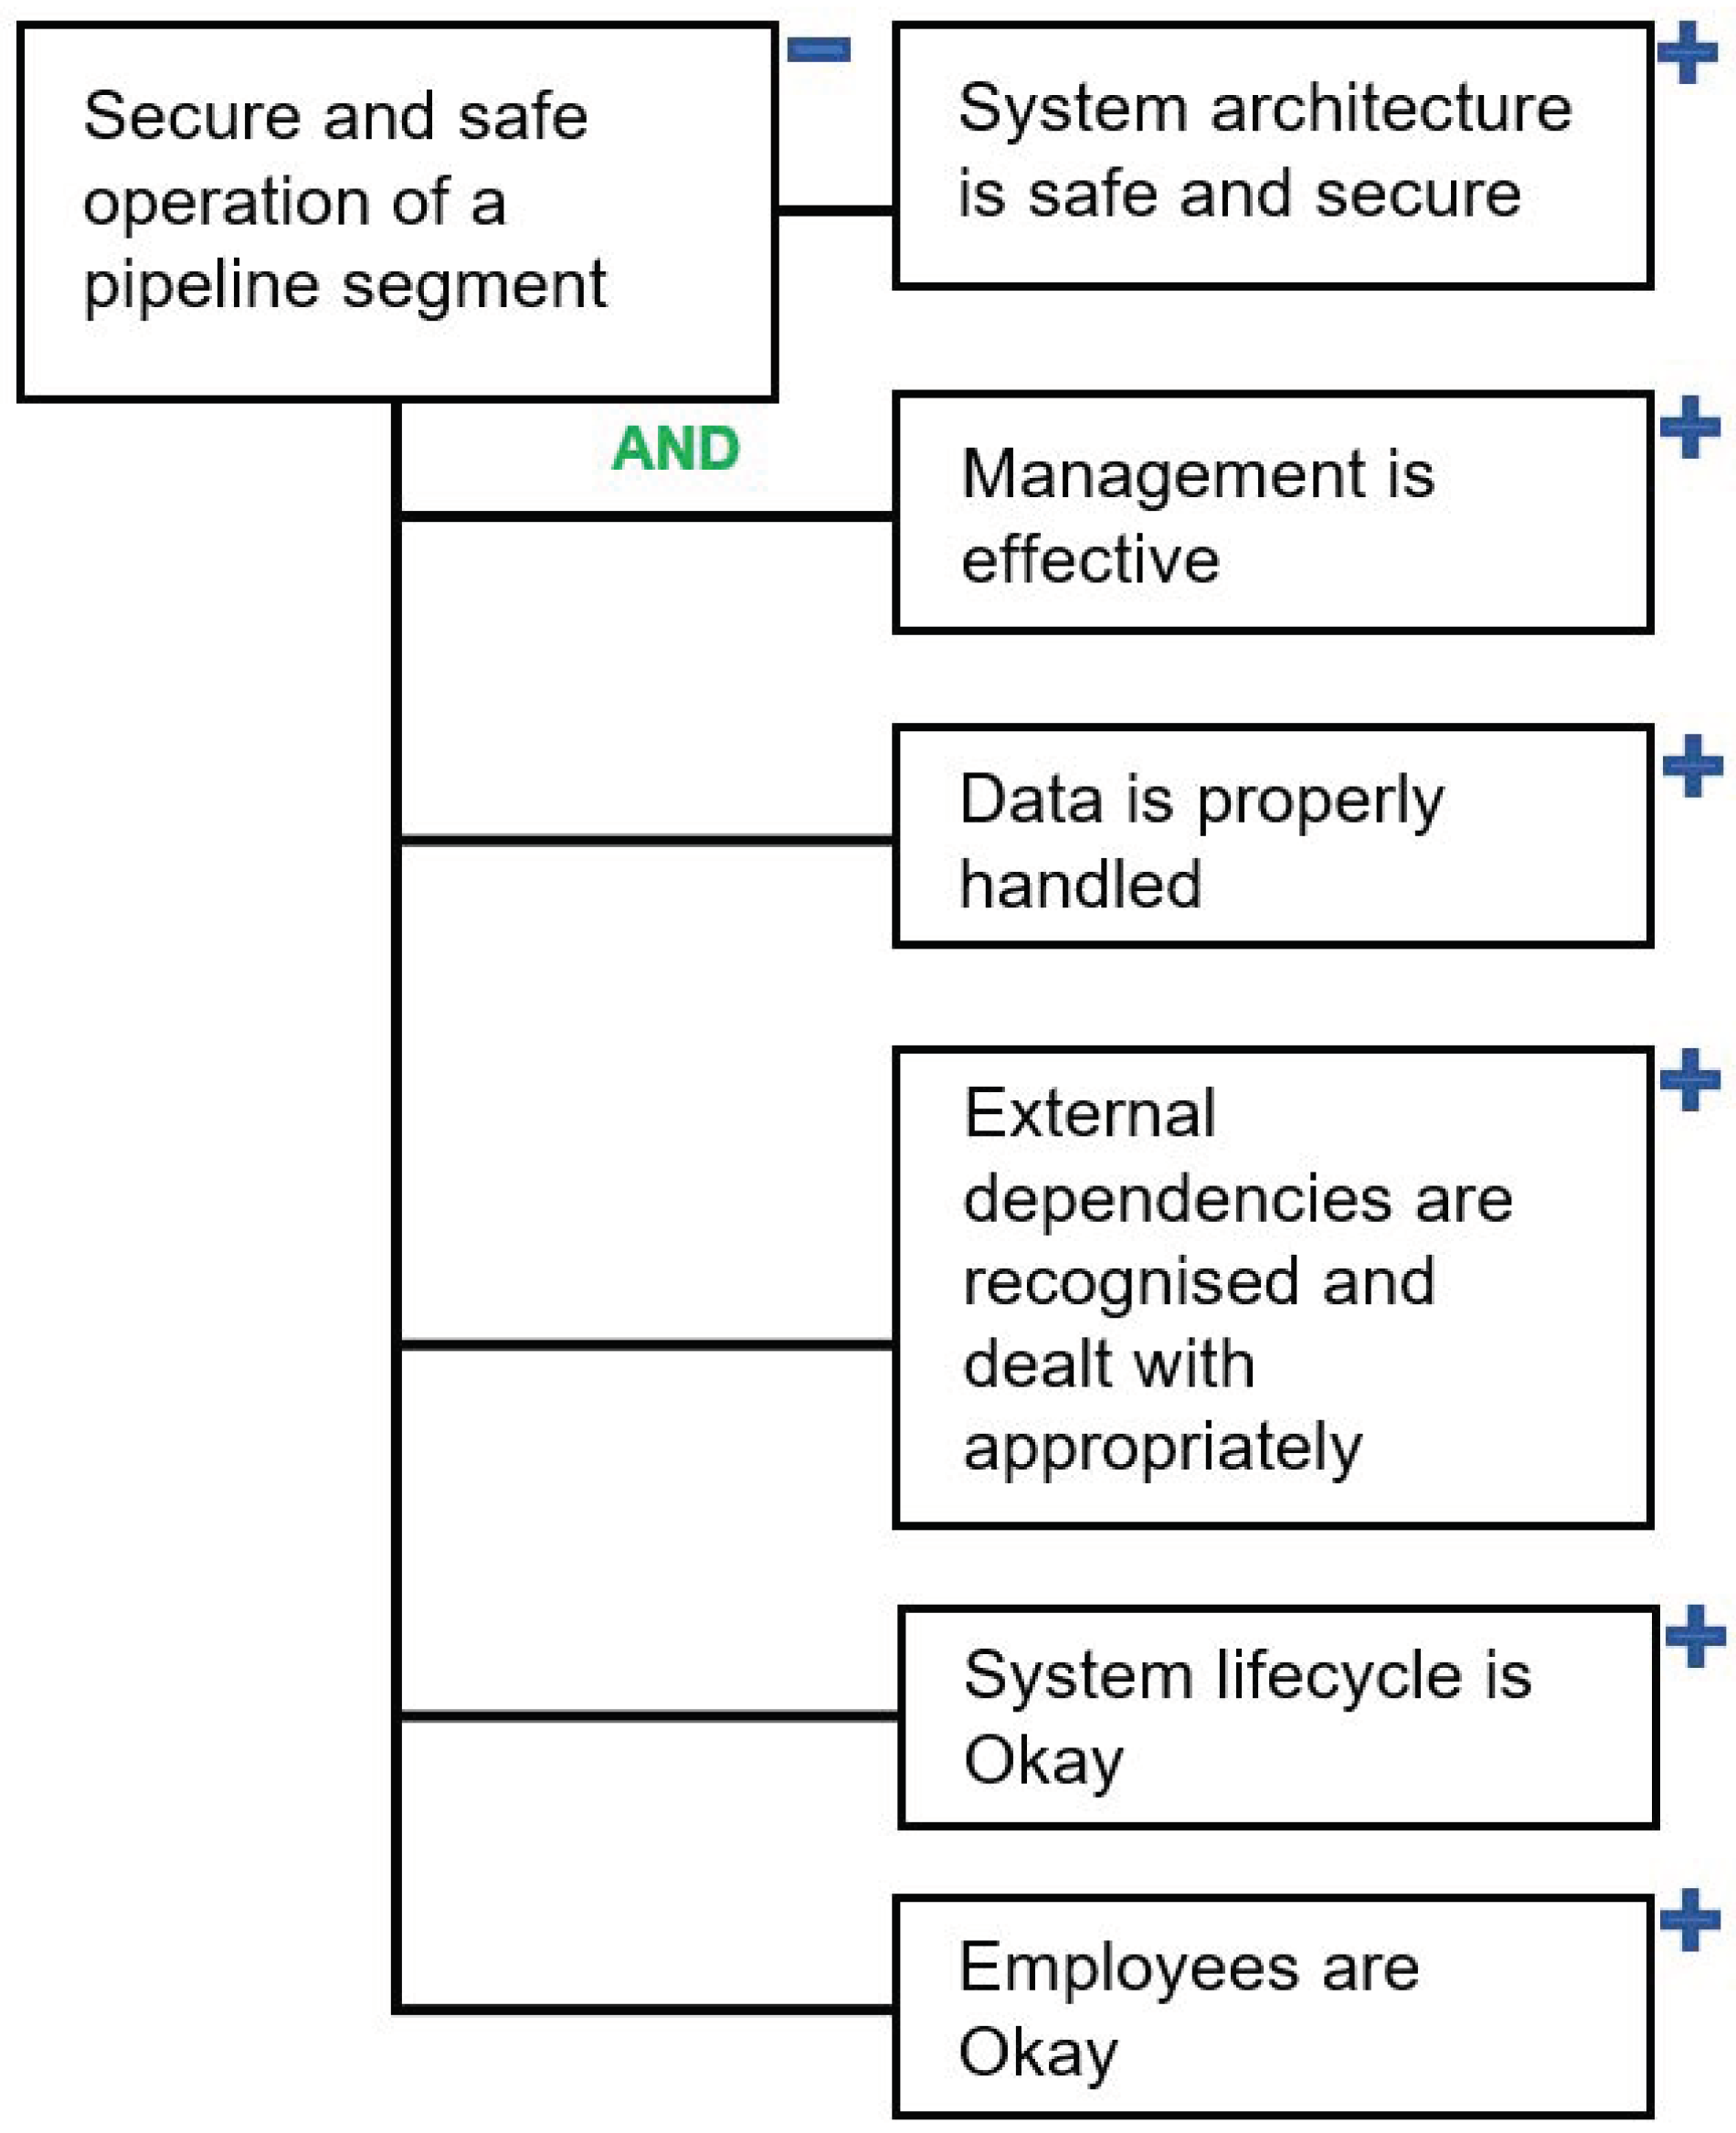
  • What is required for achieving the safe and secure operation of a SCADA system (the core goal)? What does the success of this core goal depend upon?
  • What is the likelihood of achieving the core goal?
  • What can be done to maximise the likelihood of achieving the core goal?
The key contribution of this paper is a SCADA Dependency Model (SCADA DM)—a widely applicable industry-agnostic multi-faceted dependency model of a SCADA system which comprises 452 SCADA system dependencies. Our SCADA DM offers a holistic view of a system that is an integration of sub-models developed by stakeholders responsible for the different aspects of a SCADA system and for the systems reliant on it. The SCADA DM we present in this paper was co-designed with domain experts with varying backgrounds following a rigorous knowledge capture methodology and validated by practitioners and academics via focus groups. By following the rigorous well-documented model development process with the involvement of domain experts, we produced a comprehensive, justified and validated model of a SCADA system, which is capable of supporting risk assessment process.
The presented SCADA DM facilitates understanding of complex interactions and inter-dependencies within a SCADA system. The adopted dependency modelling approach offers the ability to predict the impact of failure of any dependency on other parts of the system and on the system as a whole. A SCADA DM assists with managing the dependencies within the system and well as accounting for external factors that are outside of the system control (e.g., geo-environmental factors and espionage).
The secondary contribution of the paper is the illustrative example of applying the dependency modelling approach to risk assessment, underpinned by the SCADA DM, in the context of SCADA systems. We focus on a water distribution process. To the best of our knowledge, it is the first application of dependency modelling to assessing cyber security risks within a SCADA system in a CNI sector. The illustrative example shows how the presented generic SCADA DM could be configured for a specific SCADA system and how it could facilitate risk assessment process.
The remainder of the paper is organised as follows. In Section 2 and Section 3, we provide an overview of dependency modelling and of the related literature, respectively. In Section 4, we discuss the research methodology for the development and validation of the SCADA DM. In Section 5, we present the SCADA DM, focusing on its six key areas. An illustrative example of conducting a risk assessment for a SCADA system controlling water distribution is outlined in Section 6. Finally, conclusions are drawn, and future work is discussed in Section 7.

2. Background: Dependency Modelling

Dependency modelling is a goal-oriented risk assessment method, which is based on the assumption that all risks come through interdependencies, and that in order to be resilient, a system needs to recognise and manage all dependencies (both external and internal). It is a positivist, top–down approach of elaborating dependencies from the core system goal.
The major distinctive feature of this method is that it focuses on the desired outcome of a system (the core goal) and on the supporting sub-goals that should be achieved for the overall success of the core goal. This feature distinguishes dependency modelling from failure-oriented risk assessment methods [4], which attempt to enumerate threats to a system and list “all the things that could go wrong” with a system [5] (p. 10).
The Open Group’s Dependency Modelling standard [5] provides guidance on how to construct a Dependency Model (DM)—a graph model of a system that consists of a collection of nodes (systems dependencies) arranged in a tree-like hierarchy [5]. These entities in a DM are referred to as paragons or goals, and they are depicted as rectangles. A paragon represents a desired state of a system or of an element of a system.
A DM has only one root node, which represents the core goal of a system, and multiple leaf nodes representing sub-goals upon which the core goal depends. Each leaf node has only one parent node, but it can have zero-to-many child nodes. The leaf nodes that do not have child nodes do not have dependencies within the scope of the model and are called uncontrollables, highlighting the fact that the system itself has no control over the state of these paragons. A DM is composed of smaller building blocks that are meaningful low-level DMs.
One of the key concepts in dependency modelling is the probability of success/failure of each node. This is because dependency modelling builds on the notion of conditional probability, which is the probability of an event occurring given that another event has taken place. In a DM, every childless leaf node is assigned a probability of being in a desired state or being successful. The probability is assigned based either on expert opinion (subjective) or based on historical data, when available (objective) [4]. The conditional probability of a parent node being successful is calculated based on the success probabilities of child nodes. Dependency modelling is a quantitative risk assessment method that facilitates risk sensitivity analysis that shows which system dependencies present the highest risk to the success of the core goal.
In a DM, there are two types of relationships between child nodes of one parent node: and and or. An and relationship means that all child nodes should be successful for the success of a parent node. An or relationship indicates that at least one child node should be successful for the success of a parent node. An or relationship reduces overall risk, while an and relationship increases it. An OR relationship may be used to introduce a cyber security countermeasure which mitigates a risk posed to a system by a certain dependency.
The probability of a parent paragon with an AND relationship between independent child paragons is calculated as follows:
P ( A ) = i = 1 N P ( B i )
where A is the parent paragon, B is a child paragon, P ( X ) is the probability of the paragon X, and N is the number of child paragons.
The equation for the probability of a parent paragon with an OR relationship between independent child paragons is shown below:
P ( A ) = 1 i = 1 N ( 1 P ( B i ) )
A DM facilitates the communication between system stakeholders by providing a common ground for the discussion about system’s core goal, sub-goals, risks and dependencies. It helps to avoid misunderstandings and omissions in risk assessment by providing a clear visual representation of dependencies within a complex system. It is a flexible method which is applicable to a system of any size or nature, as well as to an organisation or a project [5].

3. Related Literature

In 2016, Cherdantseva et al. [4] presented an extensive literature review examining the risk assessment methods used in the context of SCADA systems and ICS. This section contains a brief summary of that review and the discussion of the most recent related publications.
Tree-based risk assessment methods as well as other risk assessment methods based on directed graphs fall under the category of Probabilistic Risk Assessment (PRA) methods. Tree-based methods are similar to each other in their logic and aim to define the probability of a top event or its reliability [6]. What constitutes the major difference between various tree-based methods is a top event: a threat, a fault, an attack or an incident. The vast majority of tree-based risk assessment methods are failure-oriented. They start with an attack, threat or negative consequences and work out a model based on it. Some of them adopt an attacker’s perspective and, accounting for the vulnerabilities of an infrastructure, model the steps to be performed by an attacker to gain unauthorised access to a system [7].
Dependency modelling also belongs to the group of quantitative, tree-based PRA methods. A DM is a form of a directed graph. As other graph-based risk assessment methods, dependency modelling strives to calculate the probability of a top event in a graph. However, while in failure-oriented methods such as fault tree, attack trees, event trees, and vulnerability trees a top event represents an undesired event, in dependency modelling, a top event always represents a desired outcome (a core goal).
Among probabilistic tree-based methods for SCADA systems, inductive and deductive methods are distinguished [8,9]. Inductive methods (e.g., event tree) trace from possible causes to undesired events as opposed to deductive methods (e.g., fault and attack trees), which trace from undesired events to possible causes [9]. Inductive methods are also referred to as forward search techniques, while deductive methods are referred to as backward search techniques [10]. Dependency modelling is a deductive method in terms of how each dependency model is created, because it is necessary to start with a top desired event (a core goal) in order to identify all underlying dependencies.
One of the limitations of failure-oriented methods, which dependency modelling overcomes with the use of an OR relationship (Section 2), is that, in its basic form, attack and fault trees do not facilitate the modelling of security countermeasures or defence mechanisms [7]. However, more elaborated versions of attack graphs exist that allow modelling countermeasures, e.g., [11].
Failure-oriented PRA methods have another limitation [12]: one of the fundamental issues is that the estimation of risk is never complete because it is not possible to identify a full list of all undesired events/threats. Dependency modelling avoids this pitfall by focusing on the “known” side of a system. In the majority of cases, it is possible to identify all dependencies within a system and all elements upon which a core goal and each of its child nodes depend. As any comprehensive and thorough risk assessment method, dependency modelling requires time and effort to be invested in developing a complete model of a system. Any DM will require continuous revision to ensure that it is up to date at a given stage.
In [13], a multi-model incident prediction and risk assessment approach based on Bayesian Networks and designed for ICS is described. This method also belongs to the group of failure-oriented methods, but non-traditionally for failure-oriented methods, this proposal claims to assess the risk caused by unknown attacks. In [7], a risk assessment method is suggested based on Decision Networks that extend Bayesian Networks. It is designed for the analysis of attack/defence scenarios in CNI. This method, while belonging to the group of failure-oriented graph-based PRA models, allows modelling countermeasures and accounting for their costs, thus facilitating the determination of the most cost-effective set of countermeasures.
Many failure-oriented tree-based methods either enrich an attack tree with additional data or combine it with the models of other types, including goal-oriented models. For example, [14] exploits a dual approach: while an infrastructure hyper-graph is a goal-oriented model, an evolution graph is an attack-oriented model. The Dynamic Risk Management Response System (DRMRS) [15]—a framework consisting of three main components such as attack modelling, risk modelling and response modelling—uses attack graphs, which are accompanied by a mission graph presenting a business model of an organisation, business functions, and assets required. A mission graph contains information only about technical devices within a SCADA system. The dependency model of SCADA presented in this paper adopts a much broader view and encapsulates diverse technical and non-technical aspects pertaining to a SCADA environment.
Addressing the earlier call for a comprehensive risk management method for SCADA systems [4], an integrated cyber security risk management framework for cyber-physical systems is presented in [16]. The framework is illustrated using the scenario of a power grid system. This approach is conceptually similar to the risk assessment approach adopted in our research in the following ways: (1) it adopts a holistic perspective and a multi-stakeholder view on a system, (2) it covers both technical and non-technical risks, and (3) it addresses the effect from interdependent system components. However, as opposed to our approach, the framework in [16] (1) does not focus on systematically identifying all system dependencies, and it only lists high-level classes of interdependencies (physical, cyber, logical and geographical interdependencies); and (2) adopts a failure-oriented approach by generating cyber-security attack scenarios to support risk assessment.
In Section 6, we consider an illustrative example of a water distribution system; hence, it is important to consider publications related to cyber-security risk assessment in this sector. Cyber-physical attacks on water distribution systems are examined in [17], where an attack model and a MATLAB toolbox are presented which support the identification of the infrastructure components and the specification of attacks. As opposed to our approach, this work, in line with the publications considered above, also adopts an attack-oriented approach, and it only focuses on the technical components of a SCADA system. The focus on the technical components (networks and hardware devices) persists in water distribution risk assessment—according to the recent review of modelling methodologies for managing water distribution security [18], all reviewed approaches focus on the network component of a system only, failing to address in detail a wider view on cyber security and the role of non-technical factors in a cyber attack.
The analysis in [4] indicates that quantitative PRA methods in general do not concentrate on the context establishment stage. The context establishment phase, if addressed by a method, is typically limited to the understanding of a network configuration. Consequently, only risks associated with the ICT components of a SCADA system are taken into account by a risk assessment method while overlooking a large number of risks arising from non-technical aspects.
Among the related publications, only [19] is exclusively dedicated to the context establishment and the understanding of a SCADA system. It is one of a very few publications adopting a goal-oriented approach. The Hierarchical Holographic Model (HHM), which underpins risk assessment in [19], is the methodology for “capturing and representing the essence of the inherent diverse characteristics and attributes of a system” [20]. Three sub-models are distinguished in the HHM of a SCADA system: (1) hardware and software, (2) human supervisory and (3) environment. Each of these sub-models is decomposed into elements and each element is decomposed into sub-topics. The HHM model of SCADA in [19] includes 263 elements. In comparison with the model in [19], our SCADA DM provides a more detailed view of a SCADA system comprising six key areas and 452 system dependencies. We expanded the key area System Architecture to include the Hardware, Software and Networks elements. The sub-topic Human Supervisory from the SCADA HHM is included in the SCADA DM under the key area Employees, which has a broader nature. In addition to the three key areas addressed by the HHM model, we also identified and included the three new key areas: System Life Cycle, Data (Information) and Management.

4. Research Methodology

The research methodology we followed in this research project is summarised in the following steps:
  • Elicit relevant knowledge from experts using the mind mapping knowledge capture technique;
  • Analyse the collected individual mind maps and develop a unified mind map of a SCADA system;
  • Translate the unified mind map into a dependency model—the SCADA DM;
  • Validate the SCADA DM with experts;
  • Demonstrate how the SCADA DM facilities risk assessment and supports decision-making (an illustrative example is presented in Section 6).

4.1. Why Mind Maps?

Expert knowledge could be captured using a variety of techniques ranging from interviews and surveys to concept maps and mind maps. In this research, we chose mind mapping guided by the reasons explained below.
Mind mapping is based on the natural structure of a human mind [21]. A mind map is a radial diagram that represents semantic or other connections between portions of learned material hierarchically [22]. Mind mapping finds its application in learning, research and business where it may be used for knowledge capture and sharing, brainstorming and problem solving. It is a convenient tool for the quick capture of opinion and summary of knowledge. Mind maps accelerate the accumulation of information, its structuring and systematisation. They assist reflective thinking and enable a user to link the knowledge about a topic to the broader body of knowledge [23].
Mind mapping was preferred to other knowledge capture techniques because
  • It is easy to learn and use so that all experts were able to produce detailed mind maps during a one-hour workshop. Previous work reports the results of a comparative analysis of four knowledge sharing techniques (mind maps, concept maps, conceptual diagrams and visual metaphors). The comparison indicates that mind mapping is the easiest technique to use and learn in comparison to other methods [22].
  • It offers a more time-efficient data collection for the researchers. In particular, using this method, we were able to elicit opinions from a group of experts at the same time. It would not be possible with interviews, for example.
  • It allows optimising the data analysis by requesting the participants to produce mind maps themselves rather than the researchers producing a mind map based on the analysis of in-depth interviews or observations. According to [24], “mind mapping can allow researchers to make rapid and valid transcriptions of qualitative interviews without the need for interviews to be transcribed verbatim. It may also aid the researcher in the analysis of qualitative data by helping her or him to ‘bracket’ their own preconceptions, which is fundamental in phenomenological research”.
  • The similarity of a tree-like structure between a mind map and a dependency model guarantees that the raw data are already well structured and easier to analyse and translate into a dependency model (than for example data from in-depth interviews). In addition, mind maps are association maps [23]—mind maps allow making meaningful connections and associations between various concepts and between different parts of related knowledge—and as such, they could efficiently depict dependency associations.

4.2. Data Collection—The Mind Mapping Workshops

In order to capture expert knowledge, a mind mapping exercise was conducted with a group of ICS/SCADA experts during the 3rd UK Workshop on Cyber Security of ICS and SCADA systems. The SCADA mind mapping workshops were also run in Sweden with selected industrial collaborators of the Swedish Centre for Resilient Information and Control Systems (RICS) www.rics.se (accessed on 27 March 2022). We also employed SCADA experts online via professional networking sites. Overall, 36 domain experts participated in the mind mapping exercise. Twenty-one responses were captured during the workshop with the UK-based experts in cyber security of ICS and SCADA. Twelve mind maps were collected at the RICS centre. Three SCADA experts were employed via LinkedIn. All participants irrespective of the mode of participation followed the same procedure. The exercise took approximately one hour.
During the mind mapping workshops, the participants were invited to produce mind maps of a SCADA system. We aimed to establish how domain experts conceptualise and mentally represent the dependencies within a SCADA system. Prior to the exercise, the rules of mind mapping were explained to the participants, and they were presented with several mind map examples.
The following instructions were given to all participants for the mind mapping exercise:
  • Place in the centre the name of the main topic—“SCADA” (use blue/black ink);
  • Identify the major elements/components of a SCADA system, place them around the main topic and link them to the main topic with lines indicating dependencies within the system;
  • For each new element of your mind map, identify sub-elements and connect them using lines to the element;
  • Continue identifying sub-elements for each new element of your mind map until you reach the point where no more sub-elements may be specified;
  • Use different colours to indicate the criticality of the elements within every node:
    The most critical elements of a node—circle with red;
    The elements of medium criticality—circle with green; and
    The least critical elements of the node—do not circle.
These instructions simplify the mind mapping guidelines provided in [21]. In our experiment, we did not ask the participant to draw any images or symbols to accompany the nodes of a mind map because the aim of the experiment was to elicit the hierarchy of dependencies rather than to produce a cognitively effective mind map. Typically, in mind maps, the links between nodes indicate unspecified connections among the element of the map. To avoid misinterpretations, the participants were instructed to use links only to indicate dependencies within a SCADA system. While working on their individual mind maps, the participants were instructed to answer the questions outlined below:
  • What is required for successful operation of a SCADA system?
  • What does a system depend upon?
  • What does each element of a system depend upon?
  • How critical is each element (colour-coded answer)?
The participants were requested to work individually, and no discussions were allowed during the mind mapping exercise. This was done deliberately in order to prevent cross influences between the participants and to enable the independence of responses. However, after the mind maps were finished, the participants were invited to observe mind maps of their colleagues and exchange opinions, and to add additional elements to their mind maps if they felt any were missing.

4.3. Participants’ Profile

The profiles of 36 participants are presented in Appendix A in Table A1 and Table A2. Among the participants, the experience in SCADA systems has a mean of 10.8 years with standard deviation of 11.8 and ranges from 1 to 40 years. Experts of a broad spectrum of different roles participated in the exercise: academics and practitioners, engineers and consultants, technical and non-technical specialists. Experts came predominantly from industry with only six participants from academia. The participants came from different domains including government and defence, energy, aerospace and marine, oil, gas and petrochemicals, water, smart metering and transport. The aspects of SCADA systems that the participants specialised in were also diverse and included management, risk assessment, cyber security, certification, procurement, networks, modelling, design, and implementation.
Among the participants, 6 did not have experience in cyber security. The number of years of experience in security among the 29 experts with expertise varied from 2 to 37 years with the average of 11 years. The overall average for all participants is 9 years, with the standard deviation of 9.
The set of mind maps was collected from the independent individuals, which were experienced in the relevant subject areas. The broad range of domains and roles of the participants makes the group representative of the SCADA stakeholders in general. Hence, the collected mind maps present snapshots of a SCADA system from various perspectives conditioned by the background of the participants. The diversity of the participants enables the generalisation of the exercise results to the entire SCADA community and justifies the assumption about the acceptable levels of completeness of the knowledge captured.

4.4. Data Analysis and Development of a Unified Mind Map

After the data collection stage, the 36 individual mind maps of a SCADA system were analysed. In this process, we followed the 5 stages of qualitative data analysis [25]:
  • Familiarization—Immersion in the raw data (mind maps) when the researchers observed all mind maps to estimate the richness of the material;
  • Identifying themes—Key areas derivation from the raw data;
  • Indexing—Linking key areas and other elements throughout all participants’ mind maps;
  • Charting—Rearranging the data from individual mind maps into a unified mind map containing the data, first, from some and, then, all respondents;
  • Mapping—In its general sense, this stage does not refer to mind mapping specifically, but to any form of creating a mental model or a framework of a phenomenon under investigation. In our case, we used mind mapping at this stage to define the phenomenon and find associations.
The template analysis method [26] was used in this project as a suitable and well-established method for analysing interpretative phenomenological data collected in the form of mind maps. Each unique element identified in a mind map became a code. The codes were grouped into themes representing the key areas and arranged within a hierarchy. An initial template of key areas and high-level sub-elements was created based on the analysis of 5 randomly selected mind maps. We then worked through all remaining mind maps—element by element—looking for new elements that could be related to previously identified themes or added as or under new themes.
All unique elements identified as a result of the analysis of the collected mind maps were captured. Reasonable adjustments were made regarding the naming of the elements. If the analysis showed that the participants referred to the same concept using different names, these similar elements were merged together. For example, analysis of child elements confirmed that the participants referred to the same concept as Networks, Communications, or Interconnections. These elements were united under the term Networks. We also united close terms such as TCP/IP, IP and IP-based networks in one element. The elements Remotely Controlled Devices and Field Devices were merged as well as such elements as Operator Terminal and Human–Machine Interface (HMI). The elements such as business system link, enterprise interface and corporate access were also grouped together under the term Corporate Access.
It was imperative to capture the complex hierarchical nature of a SCADA system, and mind maps as a tool served in this goal well. The collected elements were analysed, then grouped and categorised according to their nature to produce a unified mind map. The process required an in-depth knowledge of SCADA systems. In many cases, we had to refer to the SCADA literature to clarify the meaning of concepts and relationships between them. Some elements were grouped together as they referred to closely related concepts; for other elements, we had to add new node layers.
Each of the 36 mind maps contained between 14 and 107 elements with the average number of elements per model of 42.25 ± 19.10. Overall, 1521 elements were identified out of which 610 were unique. The maximum number of hierarchical levels of the mind maps (max depth) varied in the range between 2 and 8 with the average of 3.89 ± 1.17. Each mind map had between 1 and 15 key elements, i.e., the elements whose parent element is the core element of a SCADA system. The average number of key elements was 6.89 ± 3.79.
Through this rigorous process, the unified mind map of a SCADA system was gradually refined. Overall, the final version of the unified mind map comprises 610 elements. Figure 1 shows an early version (work in progress) of the unified mind map. This figure is presented here to demonstrate the richness of the model, not to show the individual elements, which will be discussed in detail in Section 5.
For each element, we retained for analysis its parent element and its criticality; then, the data were summarised into a table containing (1) the number of occurrences (i.e., how many out of 36 experts included the element in their mind maps), (2) the average criticality, and (3) the standard deviation for the criticality for each unique element. Due to the size of the data, this summary table is not presented here but is available in the project repository at https://git.cardiff.ac.uk/c1051916/SCADA_DM/ (accessed on 28 March 2022) in an Excel format. Figure 1 is also available in the repository.

4.5. From the Unified Mind Map to a Dependency Model

The unified mind map went through a rigorous transformation process to be converted to a dependency model and to ensure that all rules of dependency modelling are obeyed.
At the very core of our dependency model is the safe and secure operation of a SCADA system. Setting this as the major objective reflects the fact that safety and security, as well as risks, are the properties of the overall system rather than of any sub-component on its own. While in the unified mind map, there were 610 elements, in the process of transformation, the number of elements was reduced to 452 elements due to the following reasons:
  • Elements from the unified mind map were combined together to form one paragon when an entry in a mind map referred to the characteristics of another entity, e.g., a participant had drawn an element such as “Operating System” and then child elements depicting its characteristics such as “Secure” and “Up-To-Date”.
  • The entities which outlined various concrete implementations of higher-level entities were not included; e.g., we only kept a paragon for an Operating System (OS), but we did not include all the different types of OSs listed by the participants (e.g., Linux, Windows, MAC OS), similarly for communication protocols. As the model is configurable, it is expected that a user will enrich the model with the paragons for every operating system that is in use by the organisation and paragons for every communication protocol that is relevant to the system being modelled.
  • A small number of elements did not find a place in the final model as the elements either were not fit with the main structure of the model or were specific to a particular sub-domain rather than being relevant to SCADA systems in general.
  • In a small number of cases, it was not possible to establish the meaning of the entity based on the information provided by the participants. This is one of the limitations of the chosen approach to data collection where we did not have an opportunity to clarify information provided during the workshops at a later stage.
The names of the paragons have been formulated generically to ensure that when configured, they could be replaced with characteristics relevant to the scenario. For example, we named one of the paragons “Software is Ok”. This may have different interpretations for different organisations; some may interpret it to mean that “Software is effective in fulfilling its purpose”, others as “Software is protected from external attacks”, or both of the above. While identifying the important dependencies, we do not prescribe the characteristics and exact interpretations of paragons, leaving the exact wording to the end users of the configurable SCADA model to be defined to suit each particular context.

4.6. Validation by Experts

We ran three workshops with 9 cyber security and ICS experts (5 academics and 4 industry practitioners). The participants of these validation workshops were not involved in the mind mapping exercise at the initial stage of the project. The experts were presented with a printed version of the unified SCADA mind map (Figure 1) and asked to answer the following questions:
  • Does the top-level mind map reflect your vision of a SCADA system?
  • Are there any irrelevant elements?
  • Are there any elements missing (completeness and coverage)?
  • Is the suggested hierarchy of elements consistent with your understanding of dependencies within a SCADA system?
There were no new elements suggested during the workshops, and the expert group positively commented on the completeness of the unified mind map. There were suggestions made about the restructuring of elements under the key area “External Dependencies”. All comments from the first workshop were addressed, and the final version of the mind map was presented at the second workshop when the expert group agreed on the structure. No further suggestions for change were received during the second workshop.
During the validation workshops, the following comments were received from the industry participants commenting on the usefulness of the SCADA DM:
  • An ISC manager at a manufacturing plant: “It is useful to have an extensive model on its own to look at. It is very difficult to sit down in a traditional workshop and cover every scenario: you always forget something, you always miss something. Getting the right people round the table, being able to manage those people to go though all the scenarios is very time consuming and expensive. Most people do not want to be there it becomes boring after a while for them. Certainly, if there is a predefined model that covers the majority of the scenarios, you miss less. To have a model which captures that wider experience saves us money, saves us time. Certainly, it is a useful tool”.
  • An ICT manager at a manufacturing plant: “There is not really anything we use in terms of modelling that helps us accurately look at probabilities. That is why a dependency model may be quite useful, because you do not want to spend a huge amount of money if there is a very low probability and because for everything we do we have to justify costs against benefits. Without understanding probabilities it is very difficult to do that”.
  • A SCADA specialist: “Never I could come up with over 400 elements in a model, I would have struggled. It is certainly useful as it is all about knowledge sharing”.

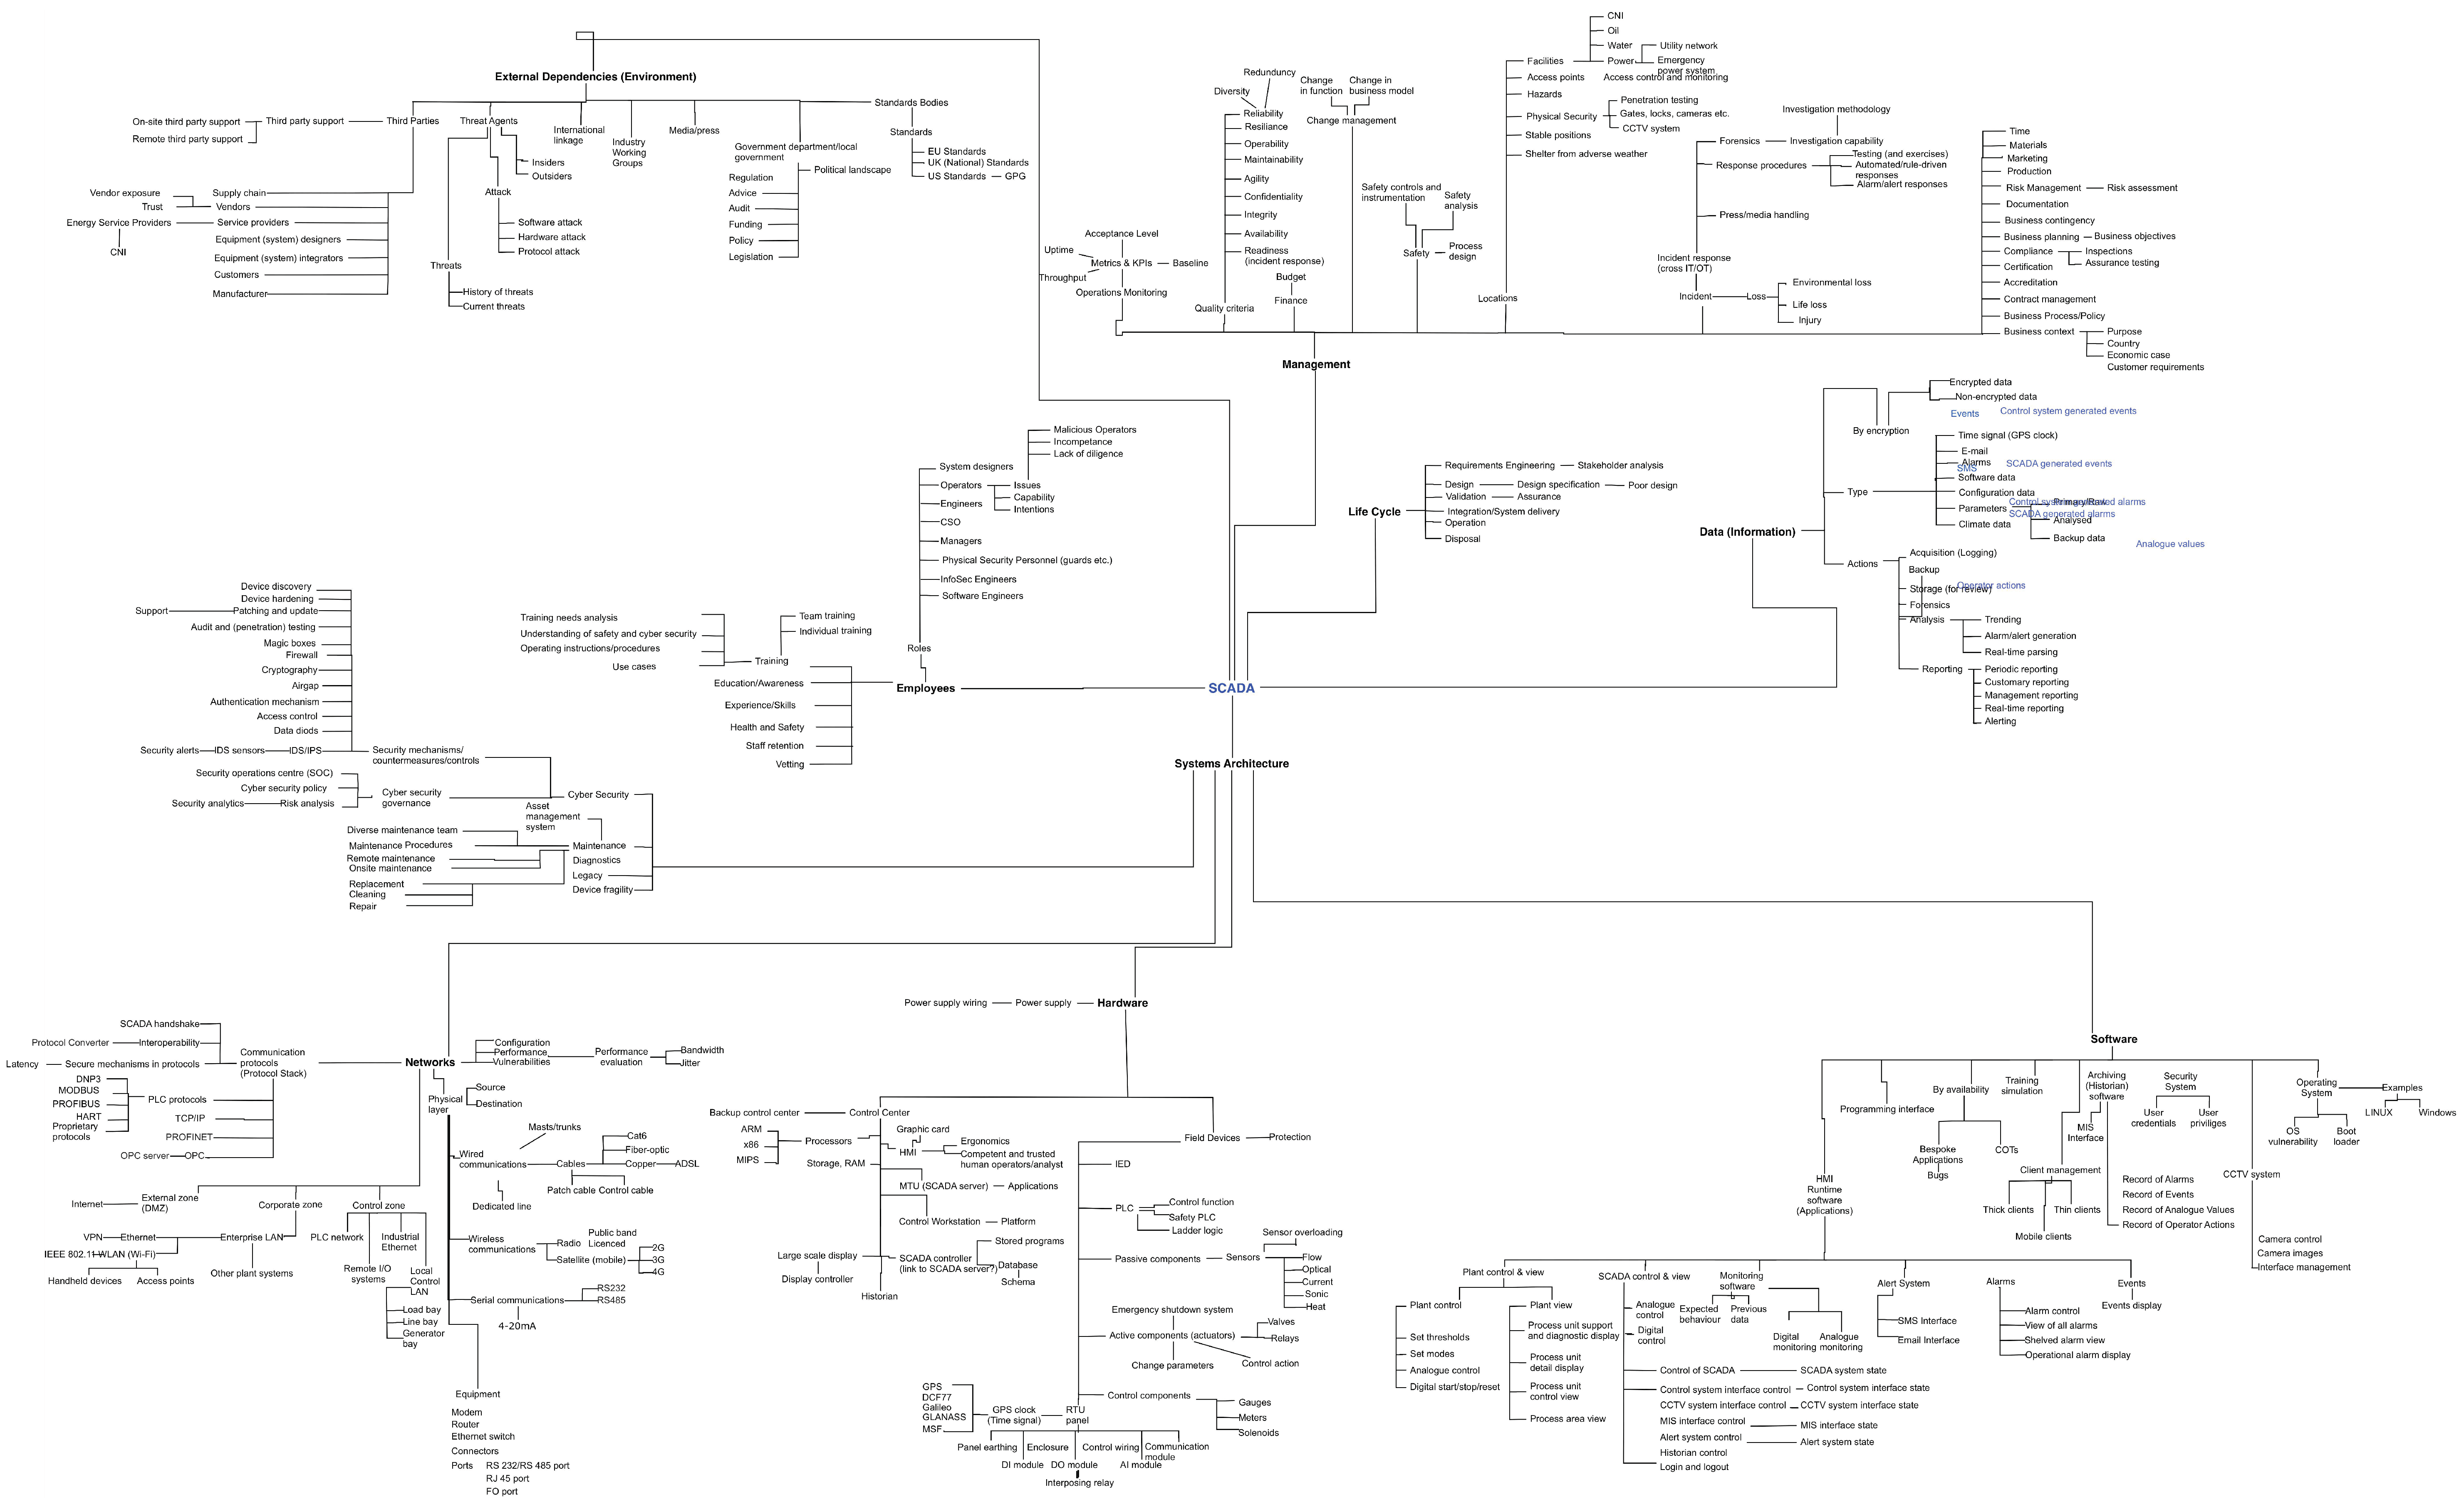
5. The SCADA Dependency Model

5.1. Top Level of the SCADA DM

Figure 2 shows the top-level elements of the unified mind map. The template analysis of the individual mind maps enabled us to identify the top six key areas of a SCADA system:
  • Management;
  • System Architecture;
  • Employees;
  • External Dependencies (Environment);
  • Data (Information); and
  • System Life Cycle.
The System Architecture element is decomposed into the following three elements: Networks, Hardware and Software.
The top level of the unified mind map was directly translated into the dependency model of the safe and secure operation of a SCADA system. The top level of the SCADA DM is presented in Figure 3. We used iDepend https://idependeu.herokuapp.com (accessed on 28 March 2022) as the tool for deploying our SCADA DM and conducting risk assessment in Section 6. A plus sign at the top right corner of a paragon indicates the presence of child paragons. Overall, the model includes 452 elements covering the six key areas of a SCADA system. Due to its size, it is not efficient to depict the full SCADA DM in this paper; instead, the model is available in JPG and XML formats at https://git.cardiff.ac.uk/c1051916/SCADA_DM (accessed on 28 March 2022).

5.2. Key Areas Overview

The System Architecture key area depends upon the Software, Hardware and Networks paragons. The software paragon has dependencies on HMI, operating systems, and different types of software applications in use (e.g., archiving software, training simulation software, other bespoke and COTS software packages, etc.); authorised access is addressed in the dependencies of this paragon as well as patching management and virtualisation. The Hardware paragon has dependencies on a control centre, field and other embedded devices, communication server and power supply. The Network paragon depends upon wired and wireless communication at the physical layer, a range of communication protocols, and the availability and security of networks. It is captured in the model that all network zones, including the control zone, corporate and external zones should function as expected in order for the successful operation of a SCADA system.
The generic model includes the System Life Cycle as one of key areas of a SCADA system. The dependencies of this paragon include elements ensuring that stakeholder analysis is performed and that the requirements in the engineering stage are dealt with effectively. A strong emphasis is placed on the design stage, where it must be ensured that design specifications are accurate, poor design decisions are identified at the early stages and eliminated, and security is addressed at the design stage (security-by-design). The model lists all activities outlined by the participants related to the system integration and delivery stages, operation stage and system disposal.
Another key element that is included in the model is Data. This paragon embraces the dependencies of all activities related to handling of all types. A SCADA system manipulates and generates a range of data of different types such as sensor readings, time signals, climate data, events data, operator action logs, alarms, emails, SMSs, software settings and configuration data. The precision of all types of data shall be ensured. The security of data shall be achieved via appropriate encryption and via enforcing data-handling policies.
Given the nature of SCADA systems, it was anticipated that the generic model will predominantly focus on the technical infrastructure. However, the Management of SCADA systems was denoted as one of the key areas. Other non-technical aspects received significant attention in the generic model. For example, the participants outlined a range of quality criteria including
  • Availability;
  • Integrity;
  • Confidentiality;
  • Agility;
  • Sustainability;
  • Maintainability;
  • Operability;
  • Resilience;
  • Reliability; and
  • Incident response readiness.
In addition, through such activities as operations monitoring, change, contract and risk management, logistics, marketing and certification, the participants have indicated the need for understanding of a problem at the decision level, and the need for appreciating the business context in which a system operates. We have included safety and cyber security into the model under the key area Management.
Despite the known criticality of safety consideration in SCADA systems, safety did not receive a lot of attention in the mind maps collected. Only four out of 36 participants included safety in their mind maps. More emphasis was placed by the participants on cyber security. Twenty-five participants included cyber security or entities related to it into their mind maps. Cyber security governance is included into the generic dependency model under the key area Management, while the technical aspects of security are listed under the key area System Architecture. Among the entities upon which effective cyber security governance depends, the participants named cyber security policies, compliance with cyber security regulations, organisational security culture, anticipation of unknown vulnerabilities, understanding of known vulnerabilities, and security data analytics.
The important role of human factors in SCADA systems is extensively discussed in the literature [19]. Errors made by human operators, who remotely control and monitor SCADA systems, or engineers, who design and configure SCADA systems, may and in many cases have led to undesirable or even disastrous consequences [4]. A significant number of paragons in the generic dependency model are dependencies of the key area that we named Employees. The model indicates a need for ensuring that all roles and experts, who are involved in the design, development, operation and monitoring of a SCADA system (including but not limited to software and system engineers, information security engineers, managers, physical security personnel and operators), should receive the required training and satisfy a number of requirements discussed below. Operators must be competent and diligent, and they should be able to undertake manual supervision of a system when required. All intentions shall be monitored and observed, which shall help to identify malicious operators.
The SCADA operators, who are located remotely and do not have an opportunity to observe the processes in real time, judge the state of physical processes only based on the reports from the SCADA system via HMI. Hence, not only the correctness and precision of the information is important but also the effectiveness of the information representation. The importance of the interactions between human operators and machines should be recognised in every SCADA system, and adverse effects of poor interactions should be minimised.
Training provided to the operators shall start with the analysis of training needs; both individual and team training sessions are required. Use case scenarios shall be examined during training sessions. Given the level of responsibility of the operators of the SCADA system, a background check shall take place as a part of the procedures for new personnel. Procedures for leaving personnel shall also be in place. Staff retention programs shall be in place. The model also includes such elements as health and safety, required knowledge and expertise, appropriate level of awareness, and effective administration of human resources.
Human resources management is also accounted for in the generic dependency model. SCADA systems that use advanced technology require highly-skilled personnel, who will keep their knowledge up-to-date through continuous training.
External dependencies also play an important role for the success of safe and secure operations within a SCADA system. All external factors outlined by the participants are captured under the key area External Dependencies (Environment). As one of the external dependencies, third parties upon which SCADA processes rely were identified. The third party list includes vendors, service providers, equipment and system designers, equipment and system integrators (when these activities are outsourced), customers, manufacturers and all stakeholders of a supply chain. Other dependencies of this paragon include threat agents, industry working groups, press and media, and government and standardisation bodies.

5.3. Configurability of the Model

The SCADA DM presented in Section 5.1 and Section 5.2 is a configurable template. When used in a particular scenario, the elements of the SCADA DM must be adjusted to reflect the specifics of a particular system. The irrelevant or out of scope elements must be removed, and system-specific elements and clarifying elements may be added. The model may also be configured to address only certain aspects of a system (aspect view).
For example, if the analysis only requires risk assessment of the key area System Architecture, then other key areas of the model may be omitted. In this instance, the paragon representing the key areas of interest becomes the root paragon of a new aspect-specific model. Thus, for example, if a risk assessment is conducted from the point of view of a human resources department, then the consideration is only given to the key area Employees and its dependencies.
Additional configuration should be done by creating definitions for paragon states declared in a DM. For example, for a paragon “All hardware components are operational”, the developers and users of a configured model should define what “operational” means in each particular context.
An important question with regard to the population of the SCADA DM is about the probabilities of leaf paragons on the far right—uncontrollables (see Section 2). The analysis of risk assessment methods conducted in the frame of this research project [4] shows that the probabilistic data for the calculations of risk or impact in Probabilistic Risk Assessment (PRA) methods are typically derived based on (1) historical data (e.g., incident logs as in [27]), (2) expert judgment or (3) a combination of both. The correctness of the results rendered by any PRA method (including dependency modelling) strongly depends on the quality of estimated probabilities, which ideally should originate from objective empirical data. Objective data in this instance are data received from statistical sampling, historical records or experimentation [10].
However, historical data are not always available due to various reasons including hardware and software specifics, legacy and confidentiality around safety- and security-critical systems [4]. Hence, in many risk assessment methods, including dependency modelling, it is necessary to rely on expert opinion. Since the correctness of risk estimation is founded in the precision of the probabilities involved in the calculation, it is important to ensure that the expert opinion is accurately captured and documented along with all the evidence upon which the estimation of probability was made whenever possible. For example, for the paragon Analogue Monitoring is Okay, the probability of this paragon being in a successful state may be calculated based on the number of incidents with analogue monitoring in the previous period.
Compiling national statistics, or reported compliance data, e.g., in the context of European regulations, may also be a means to ground the individual estimates on collectively available knowledge.

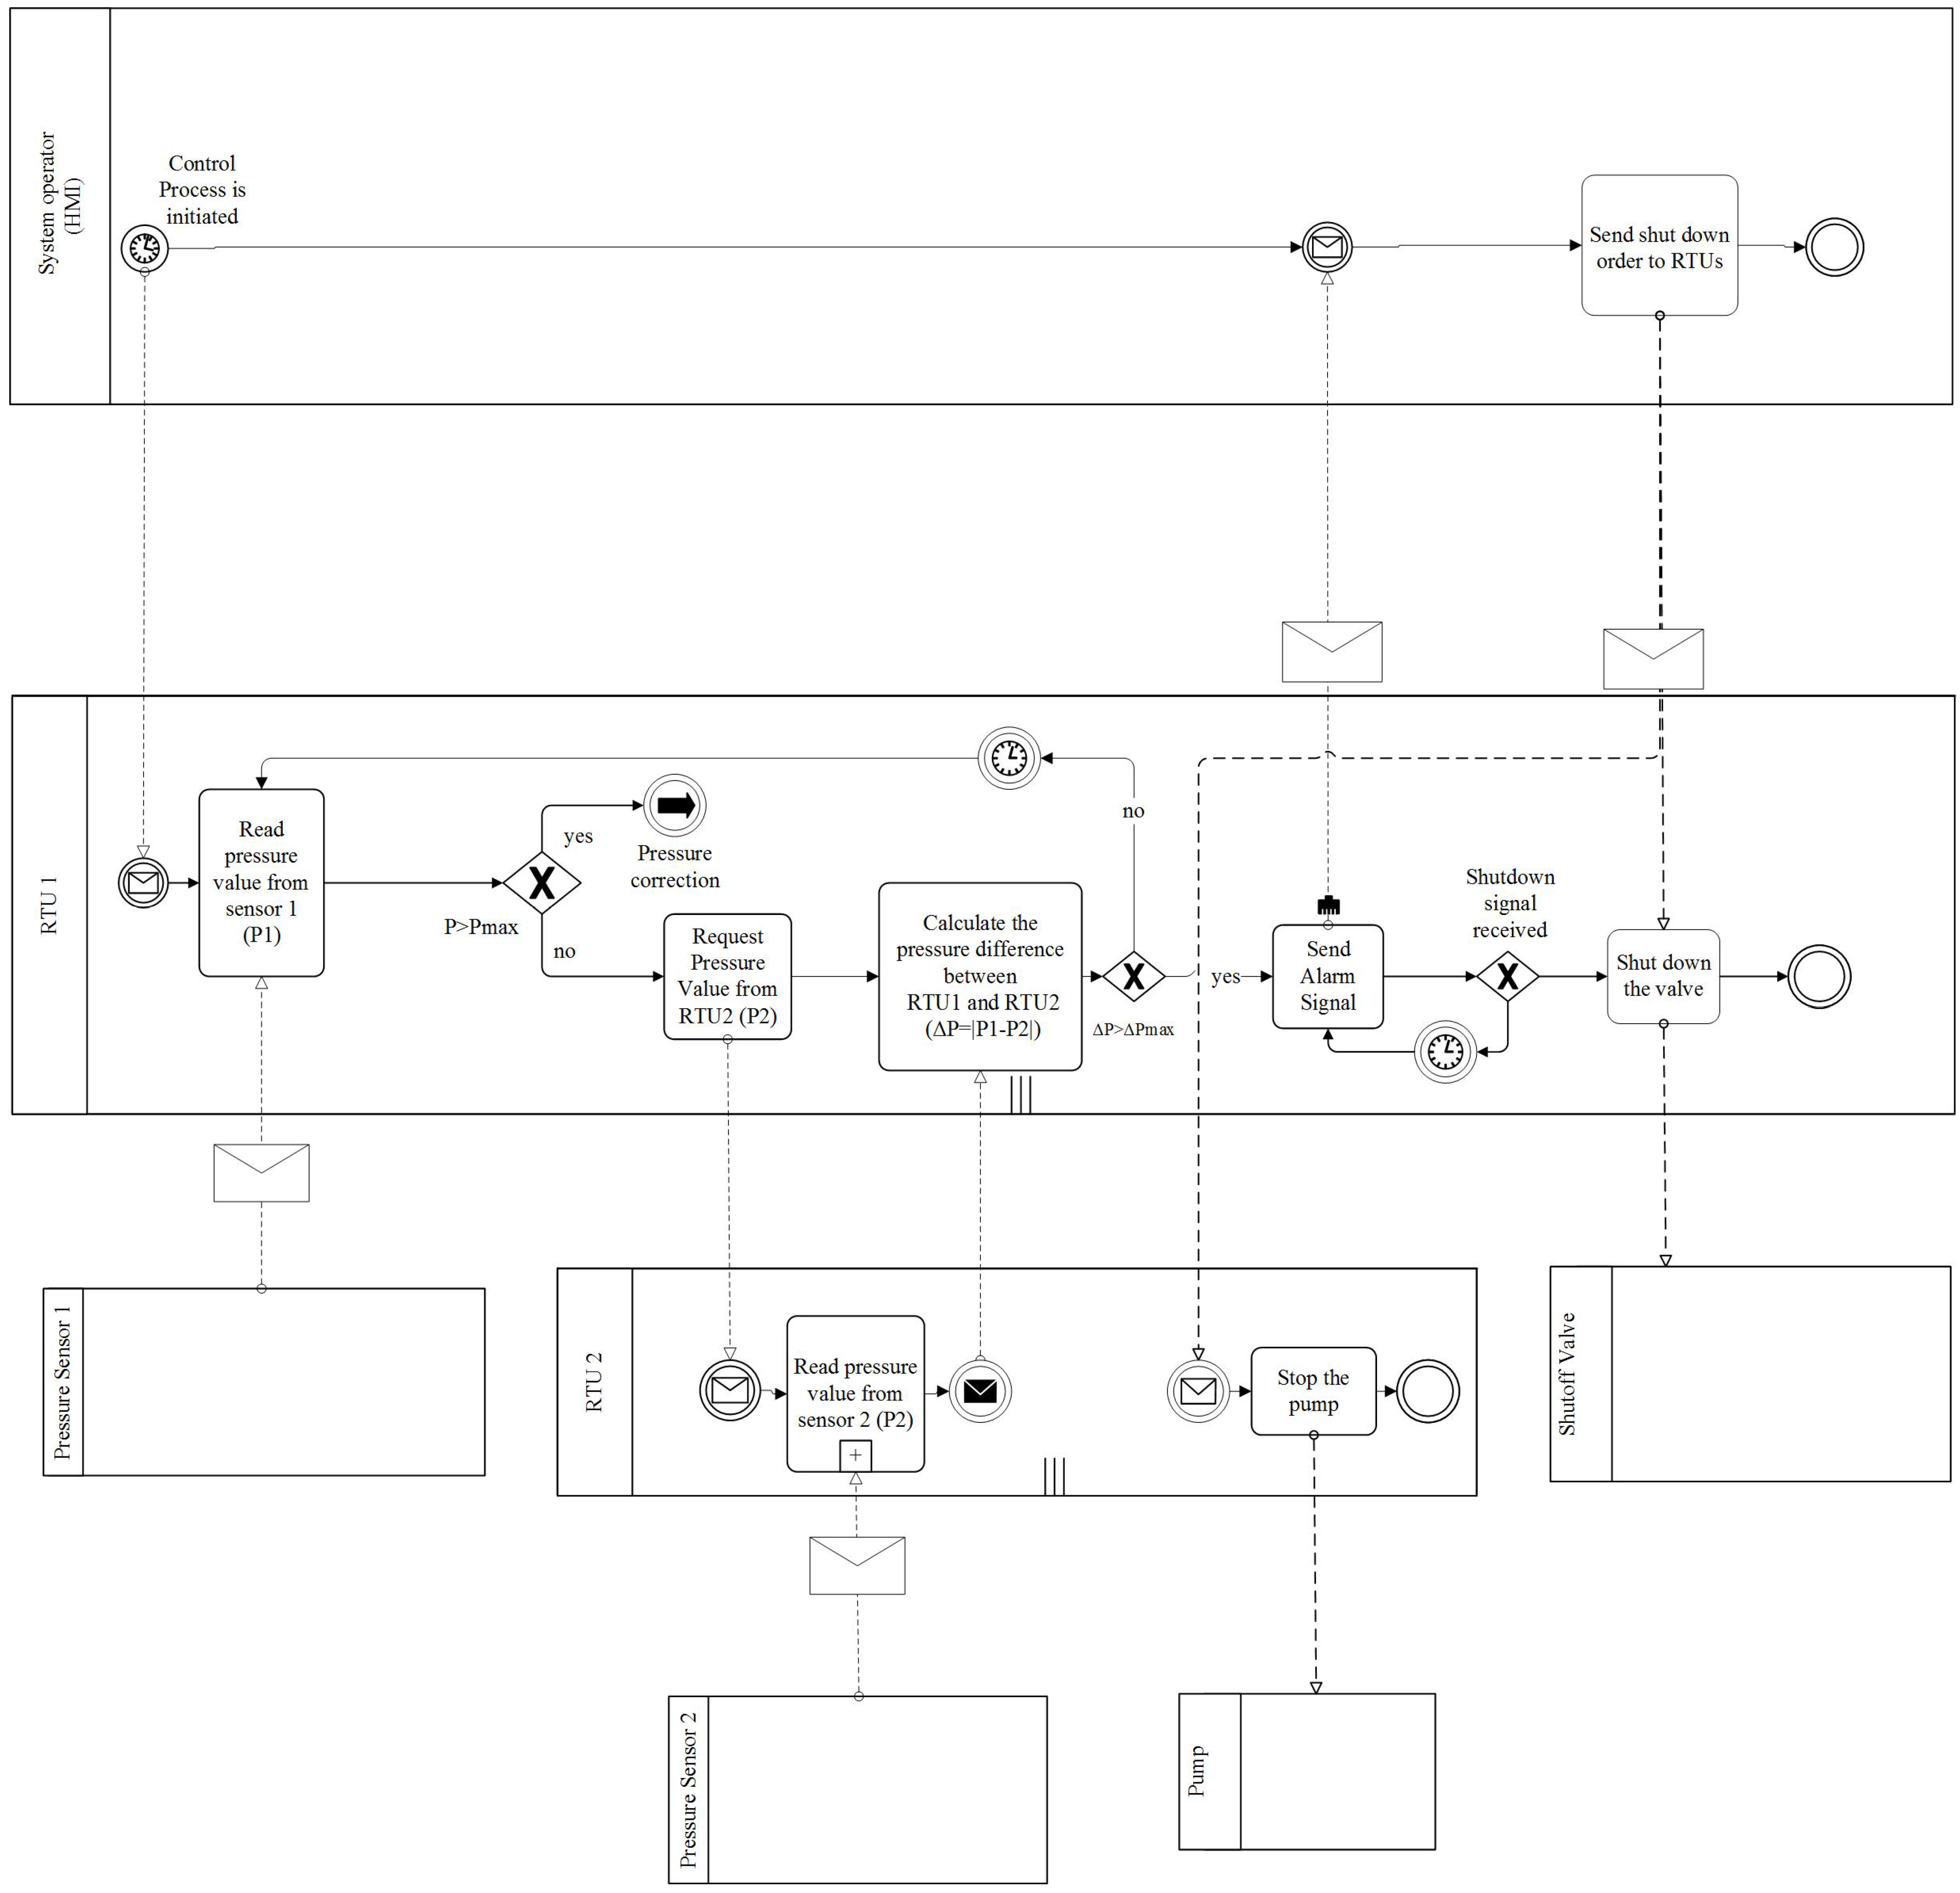
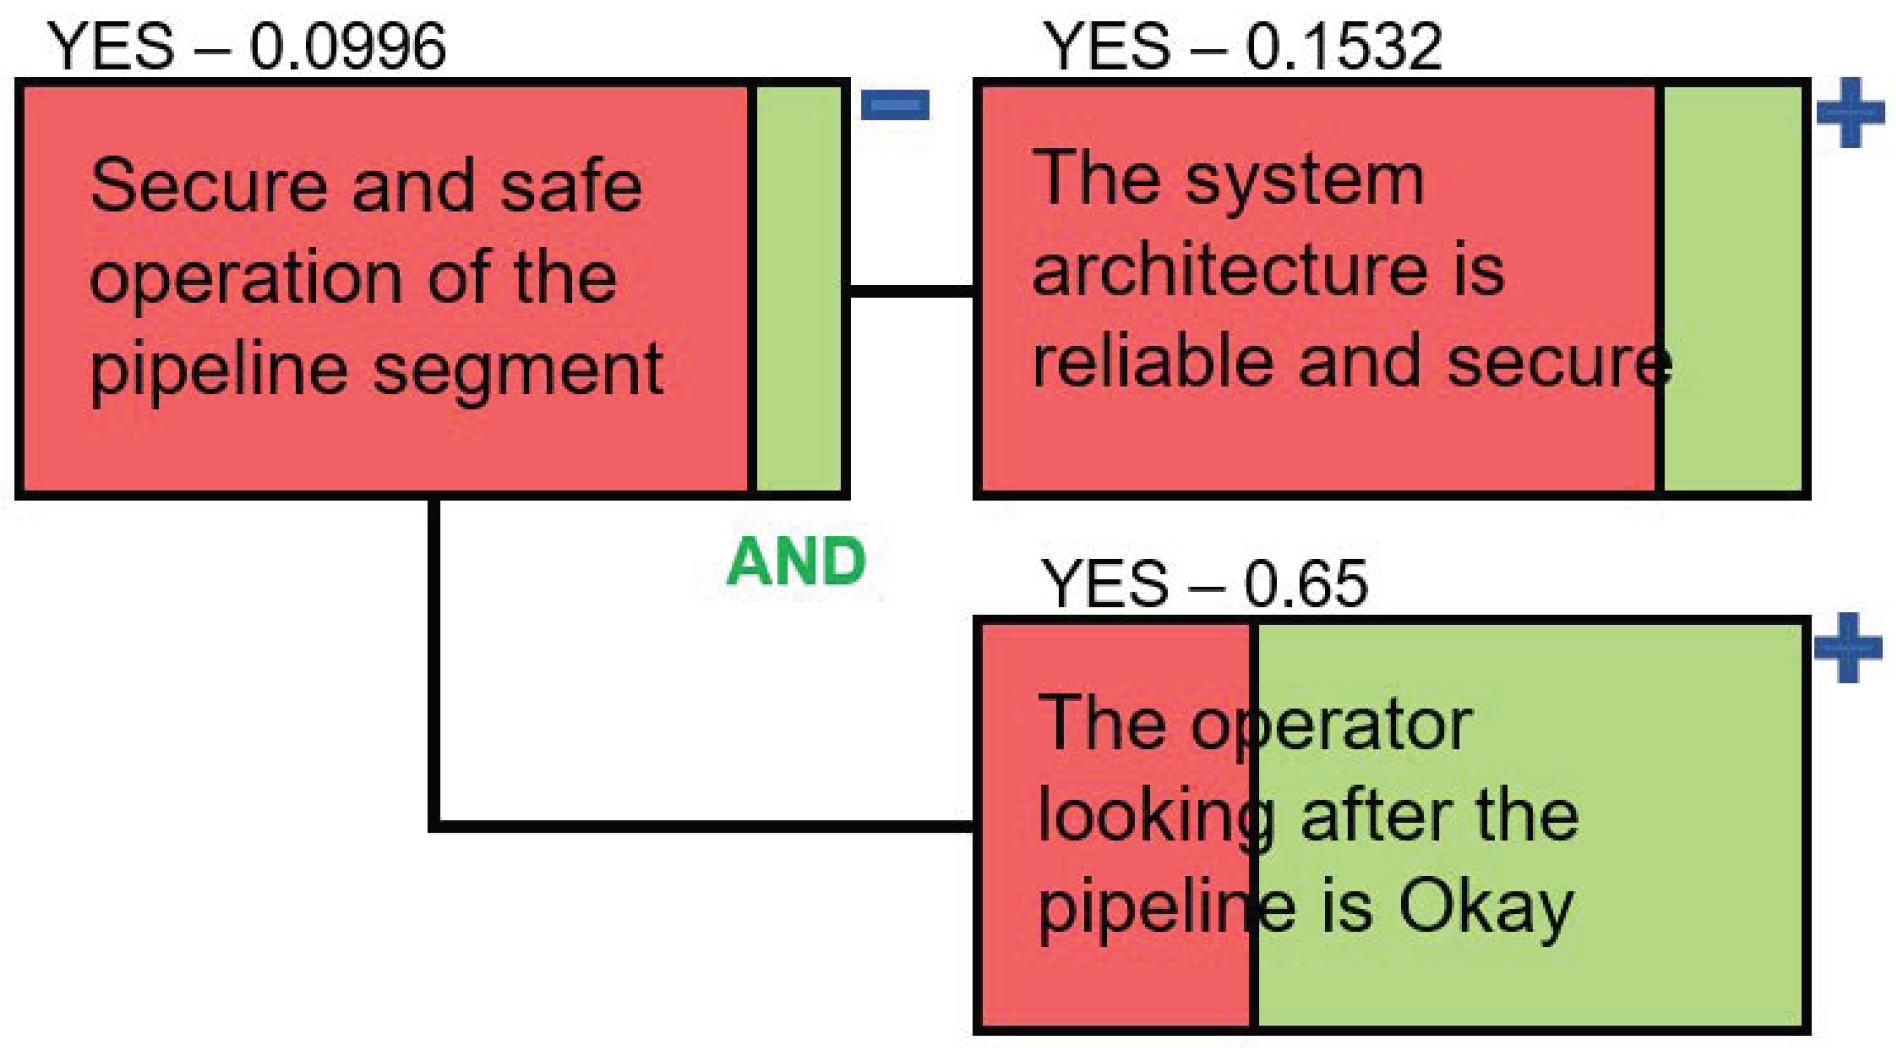
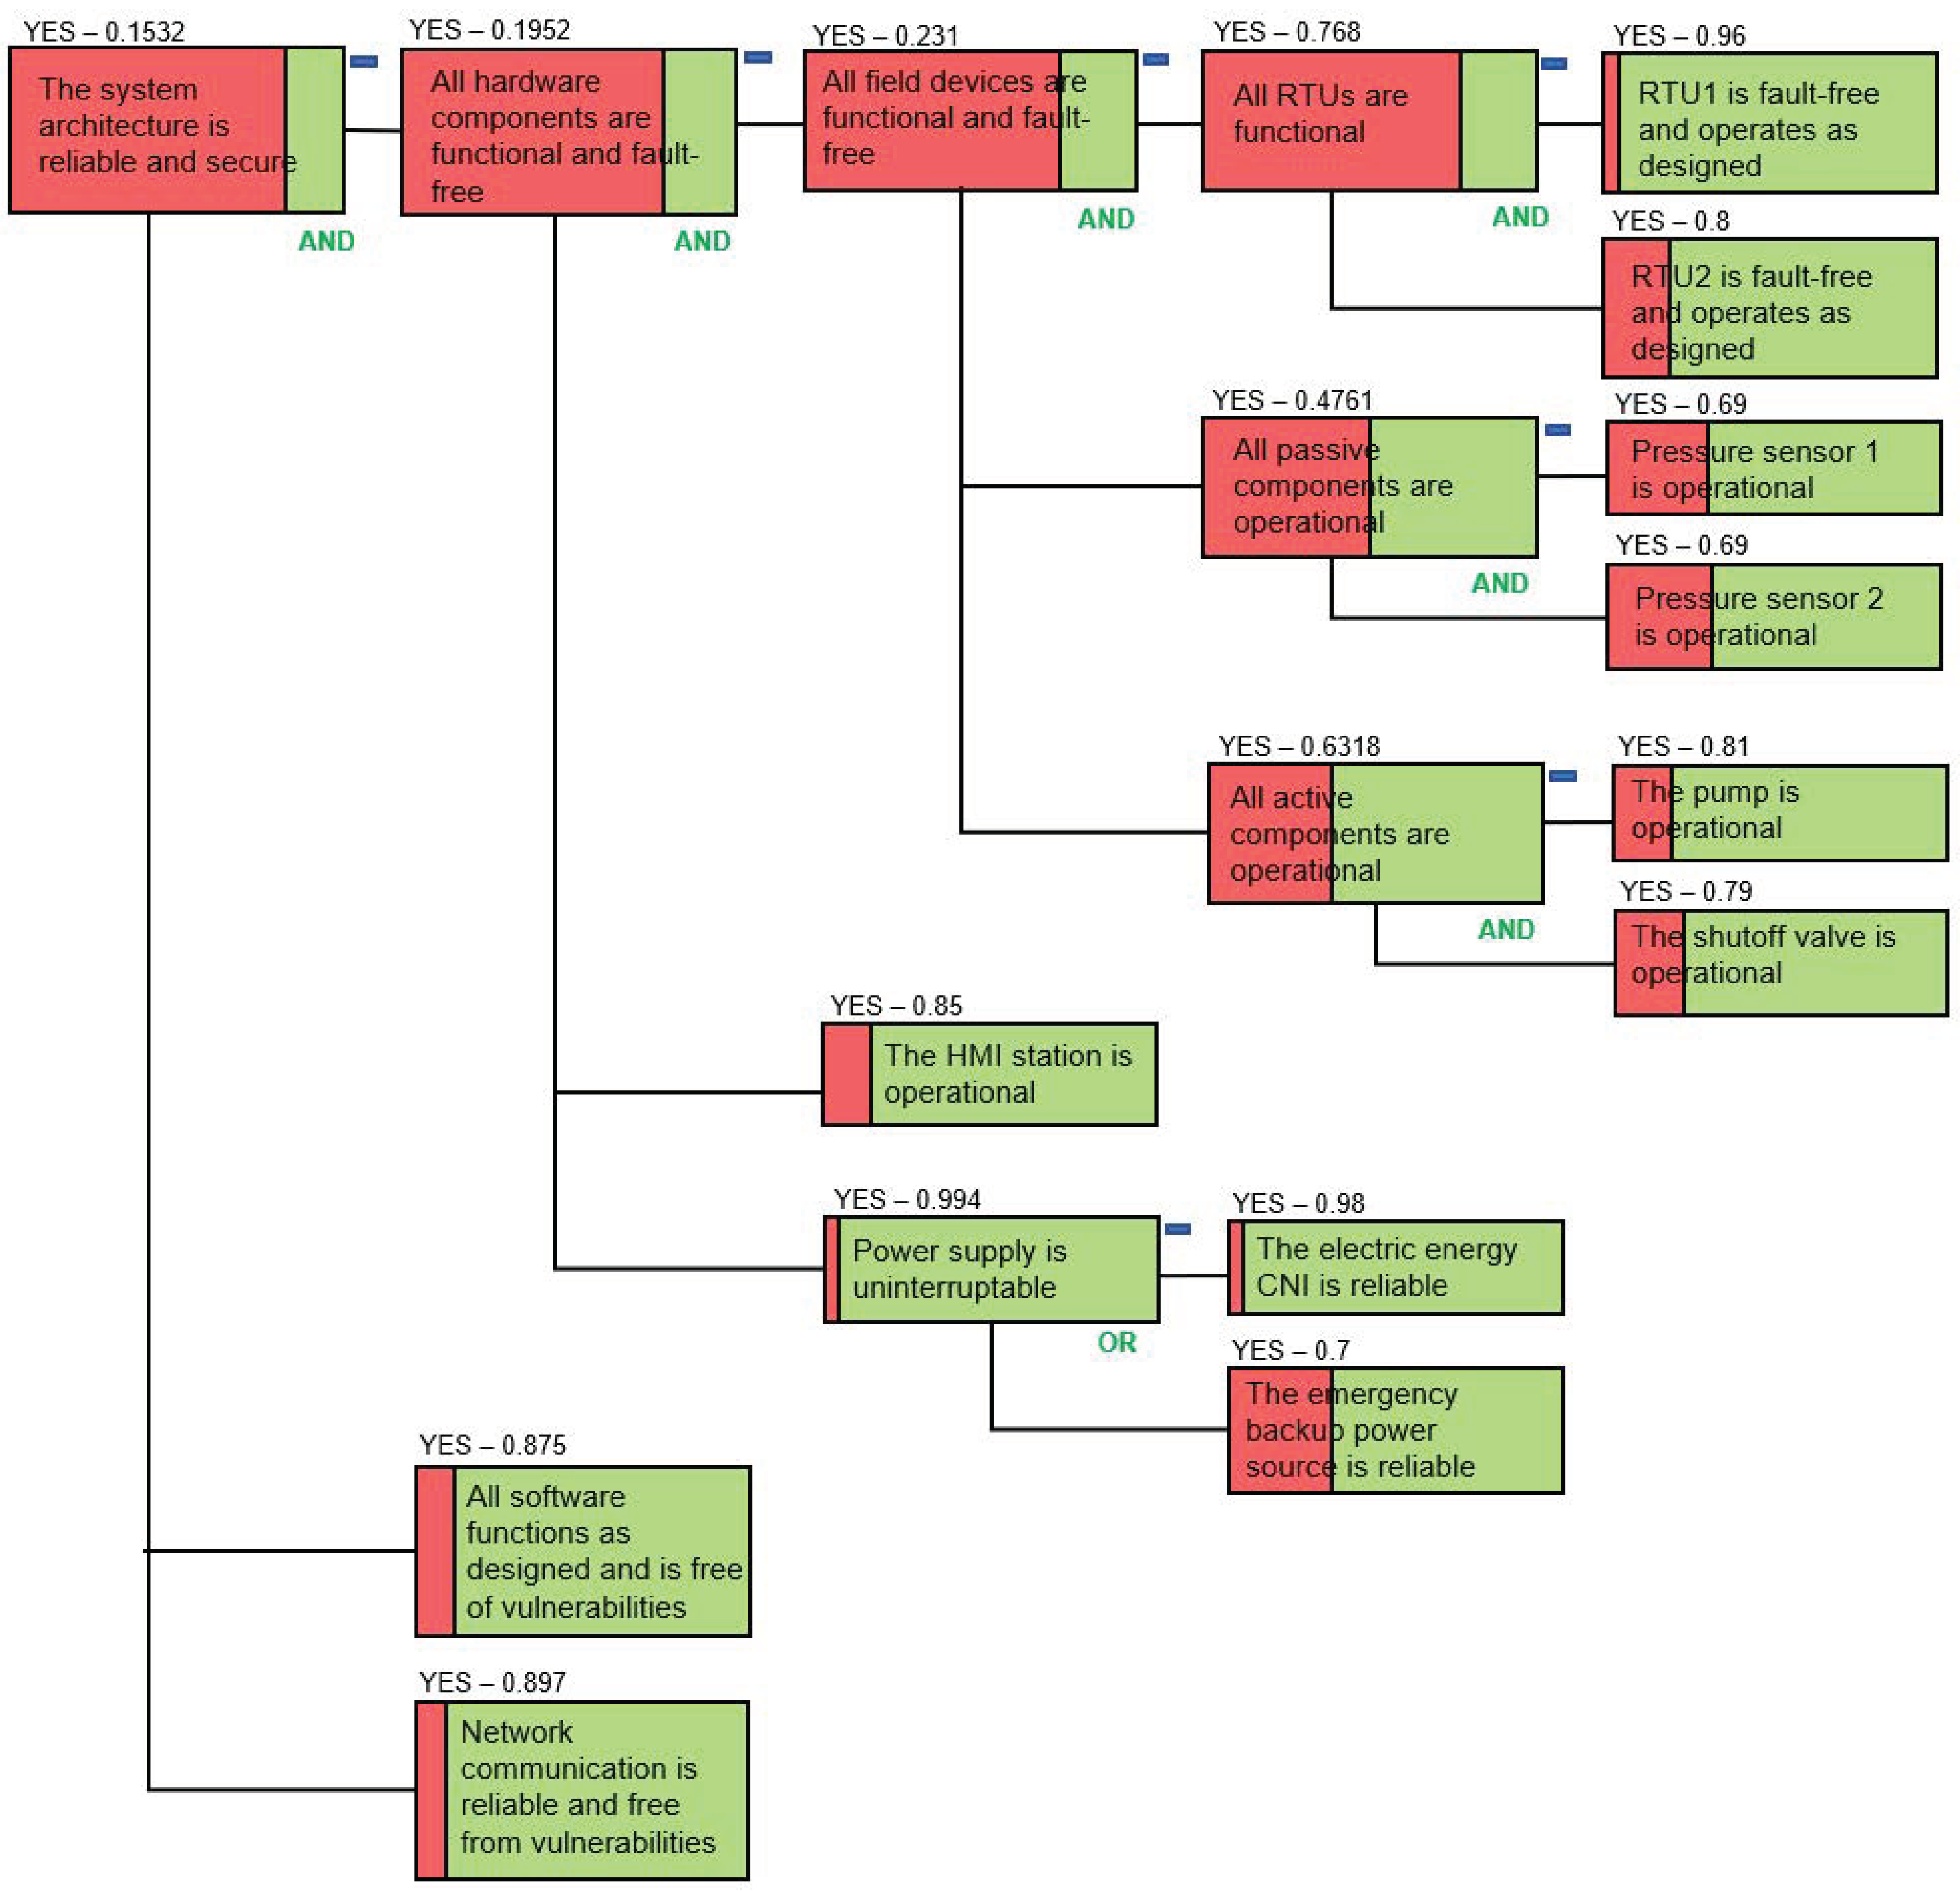
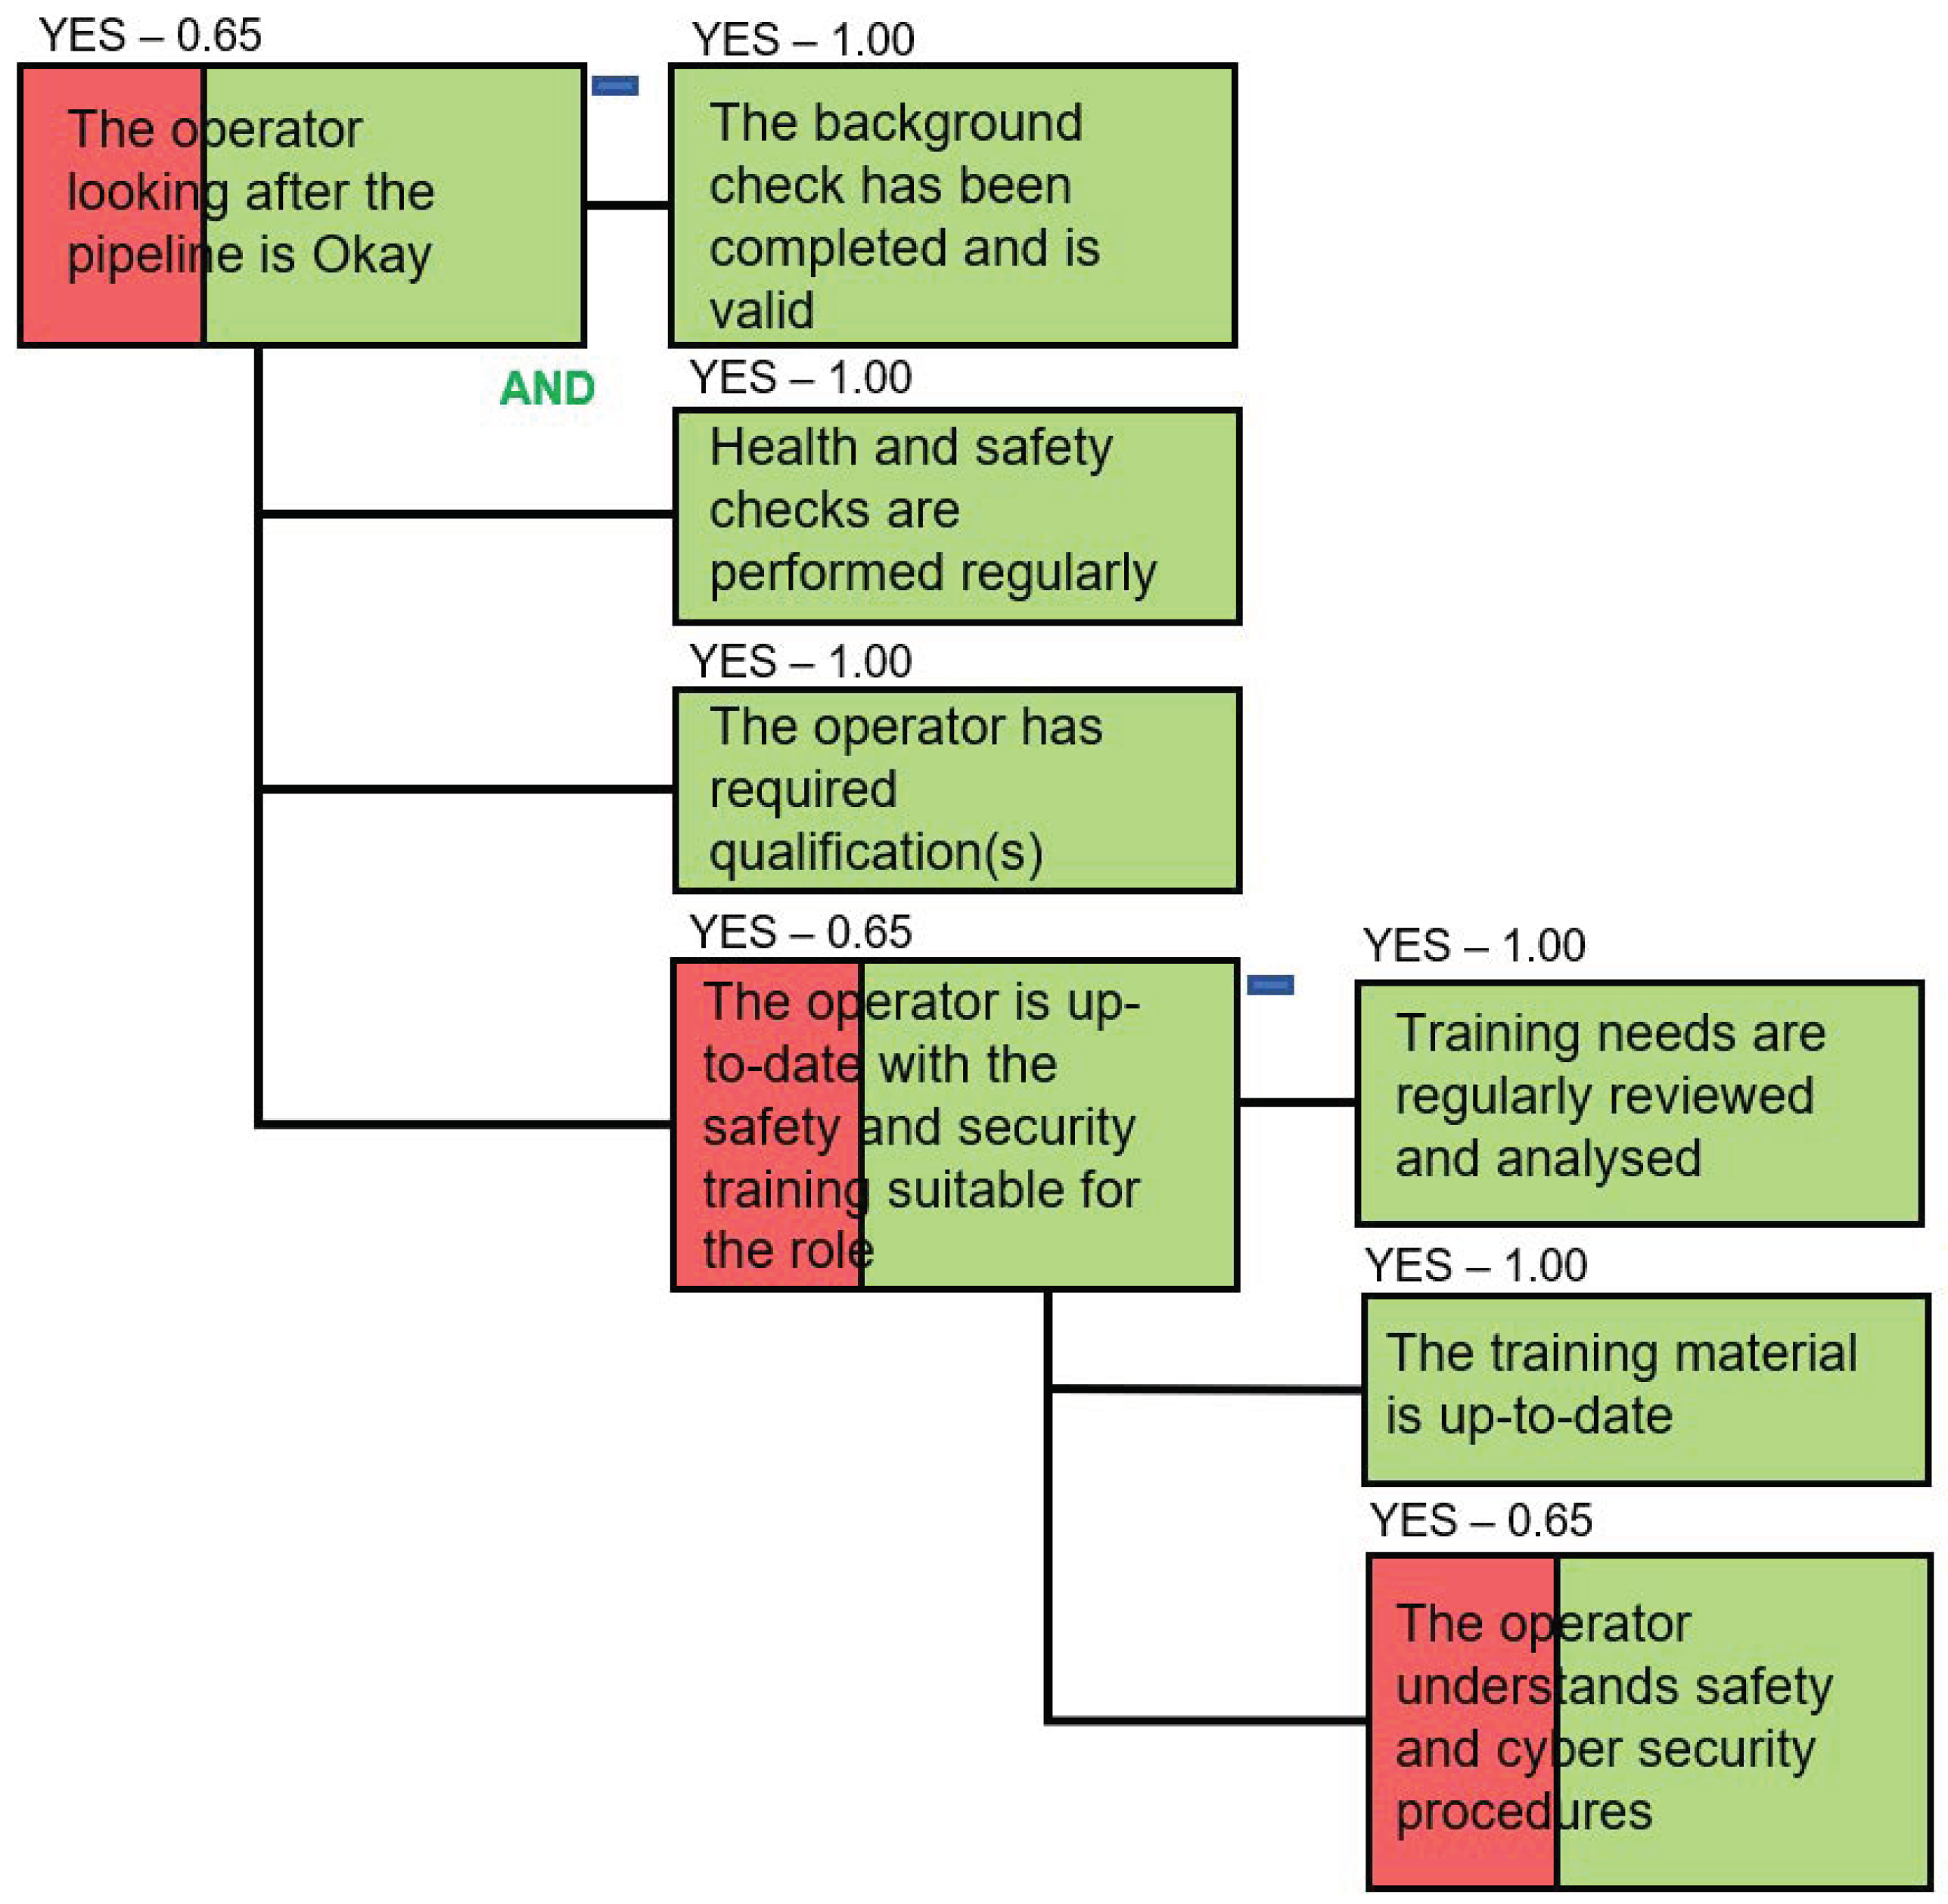
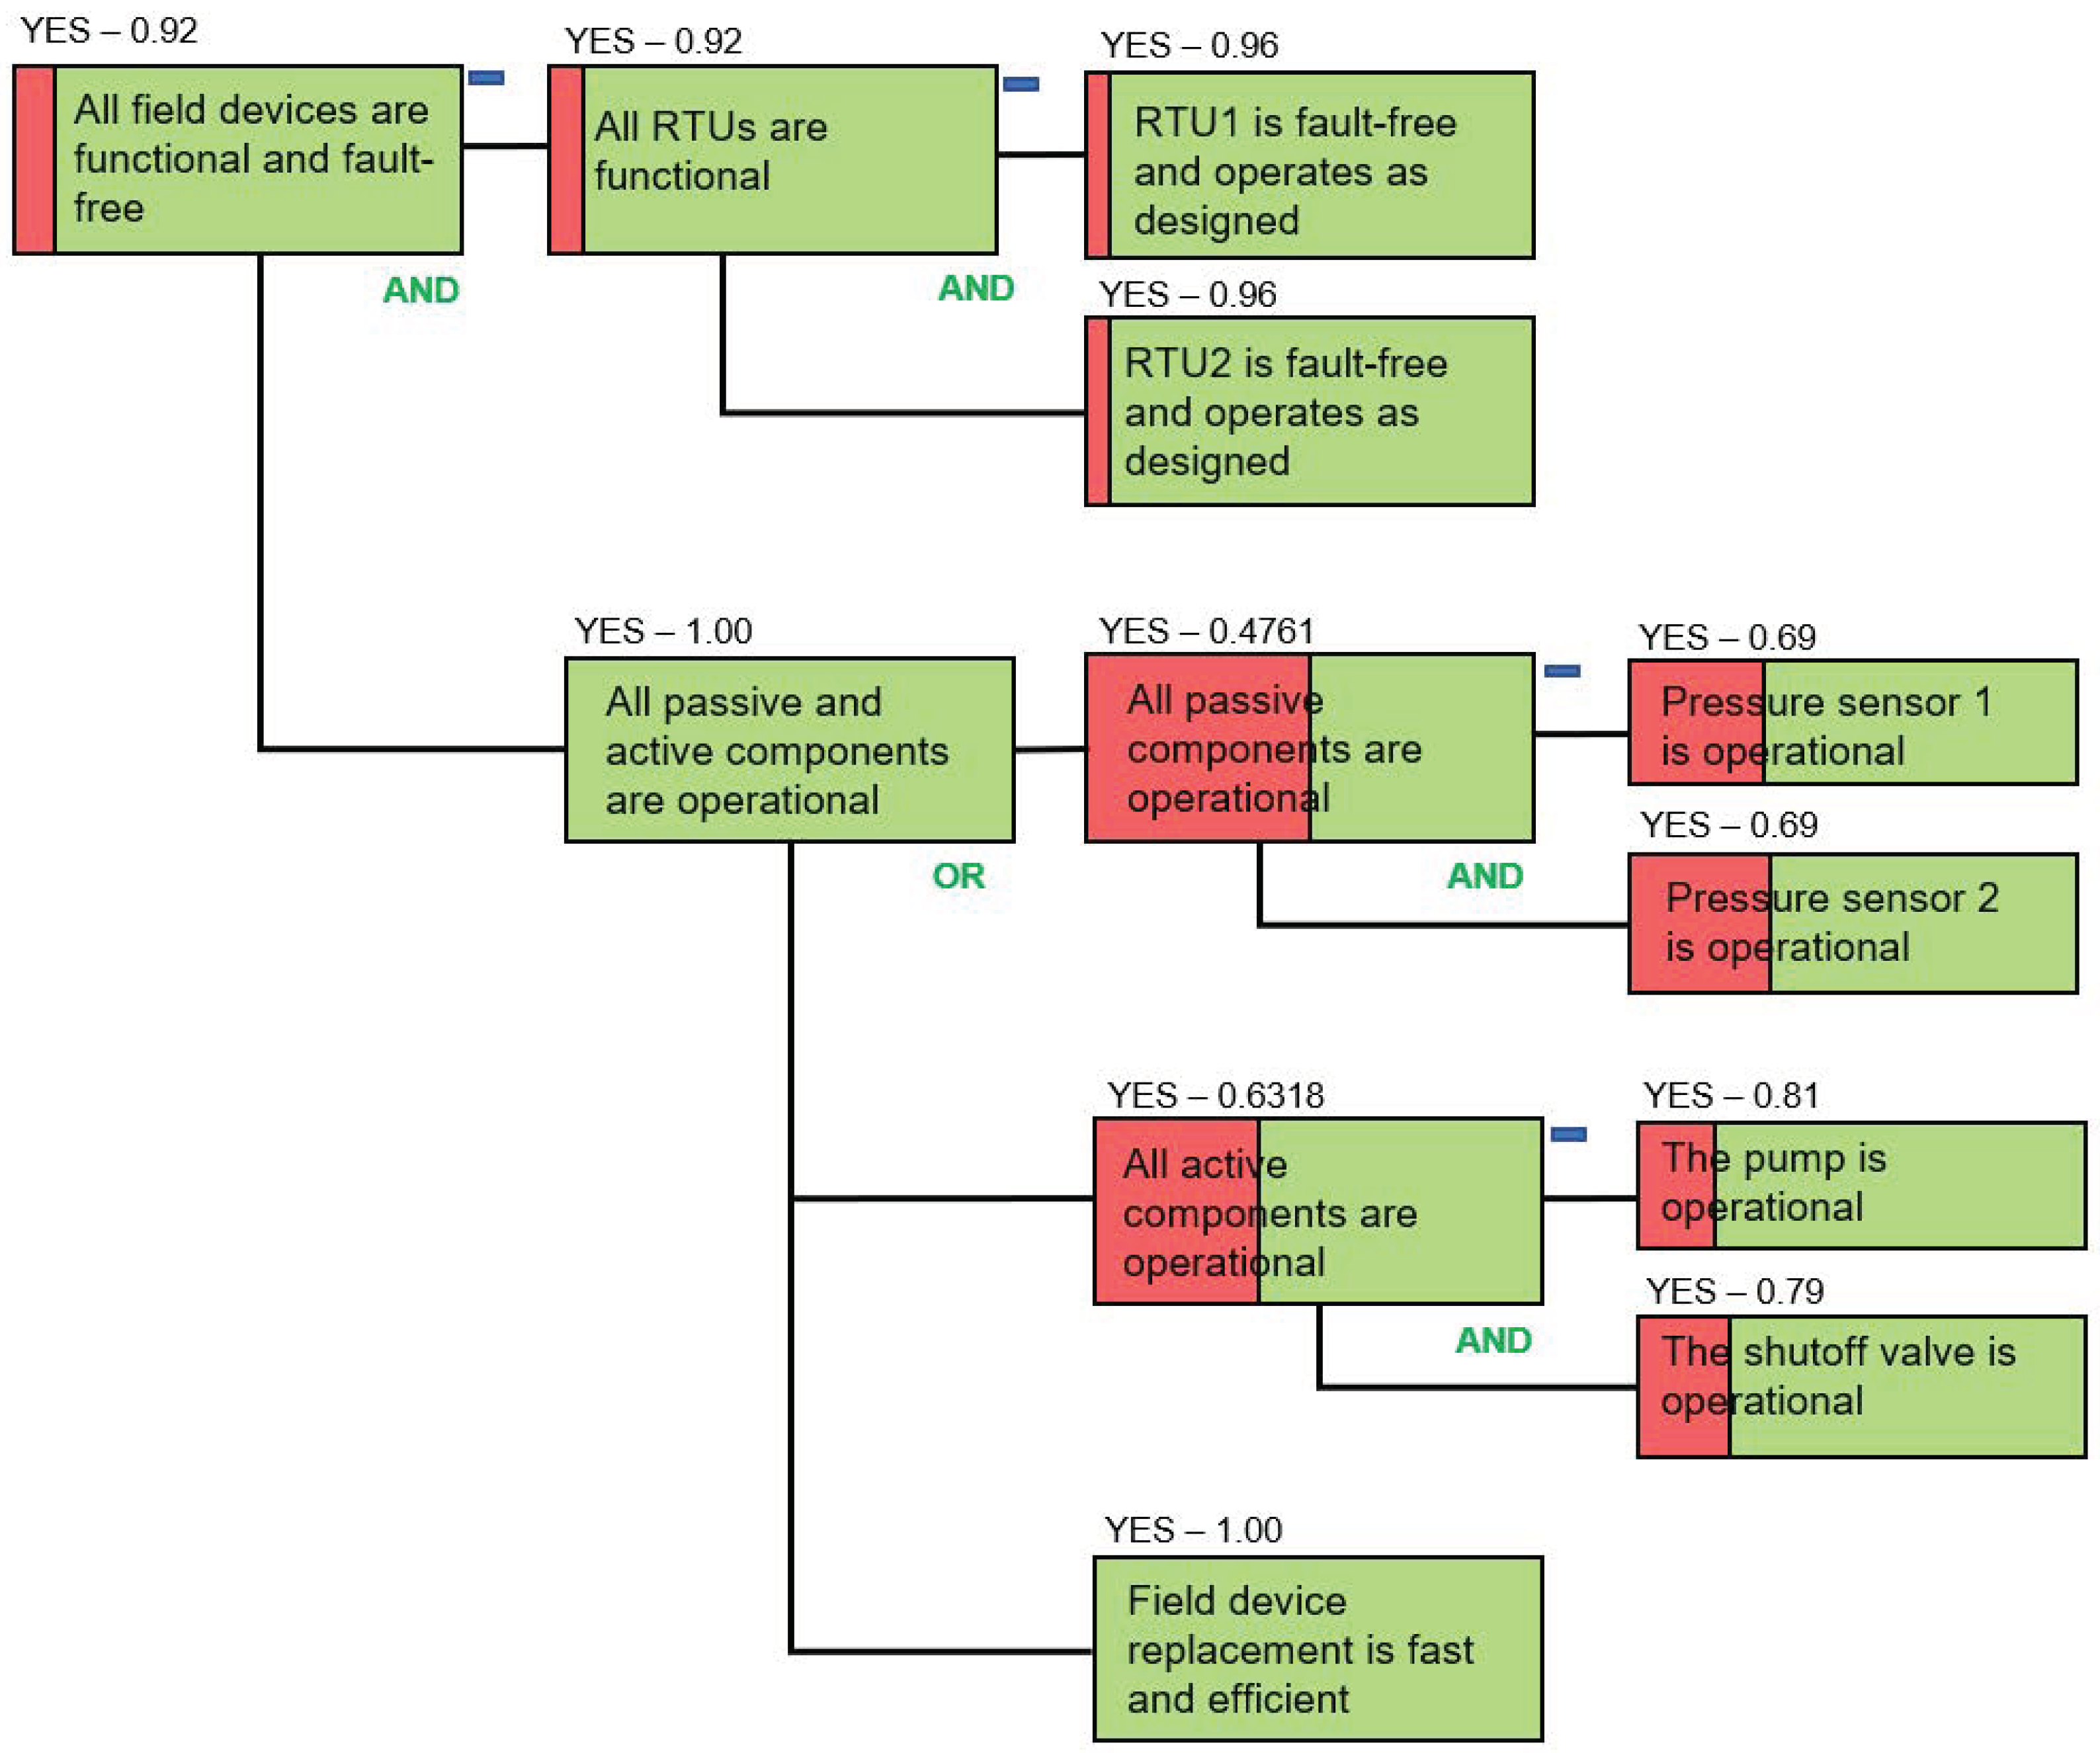
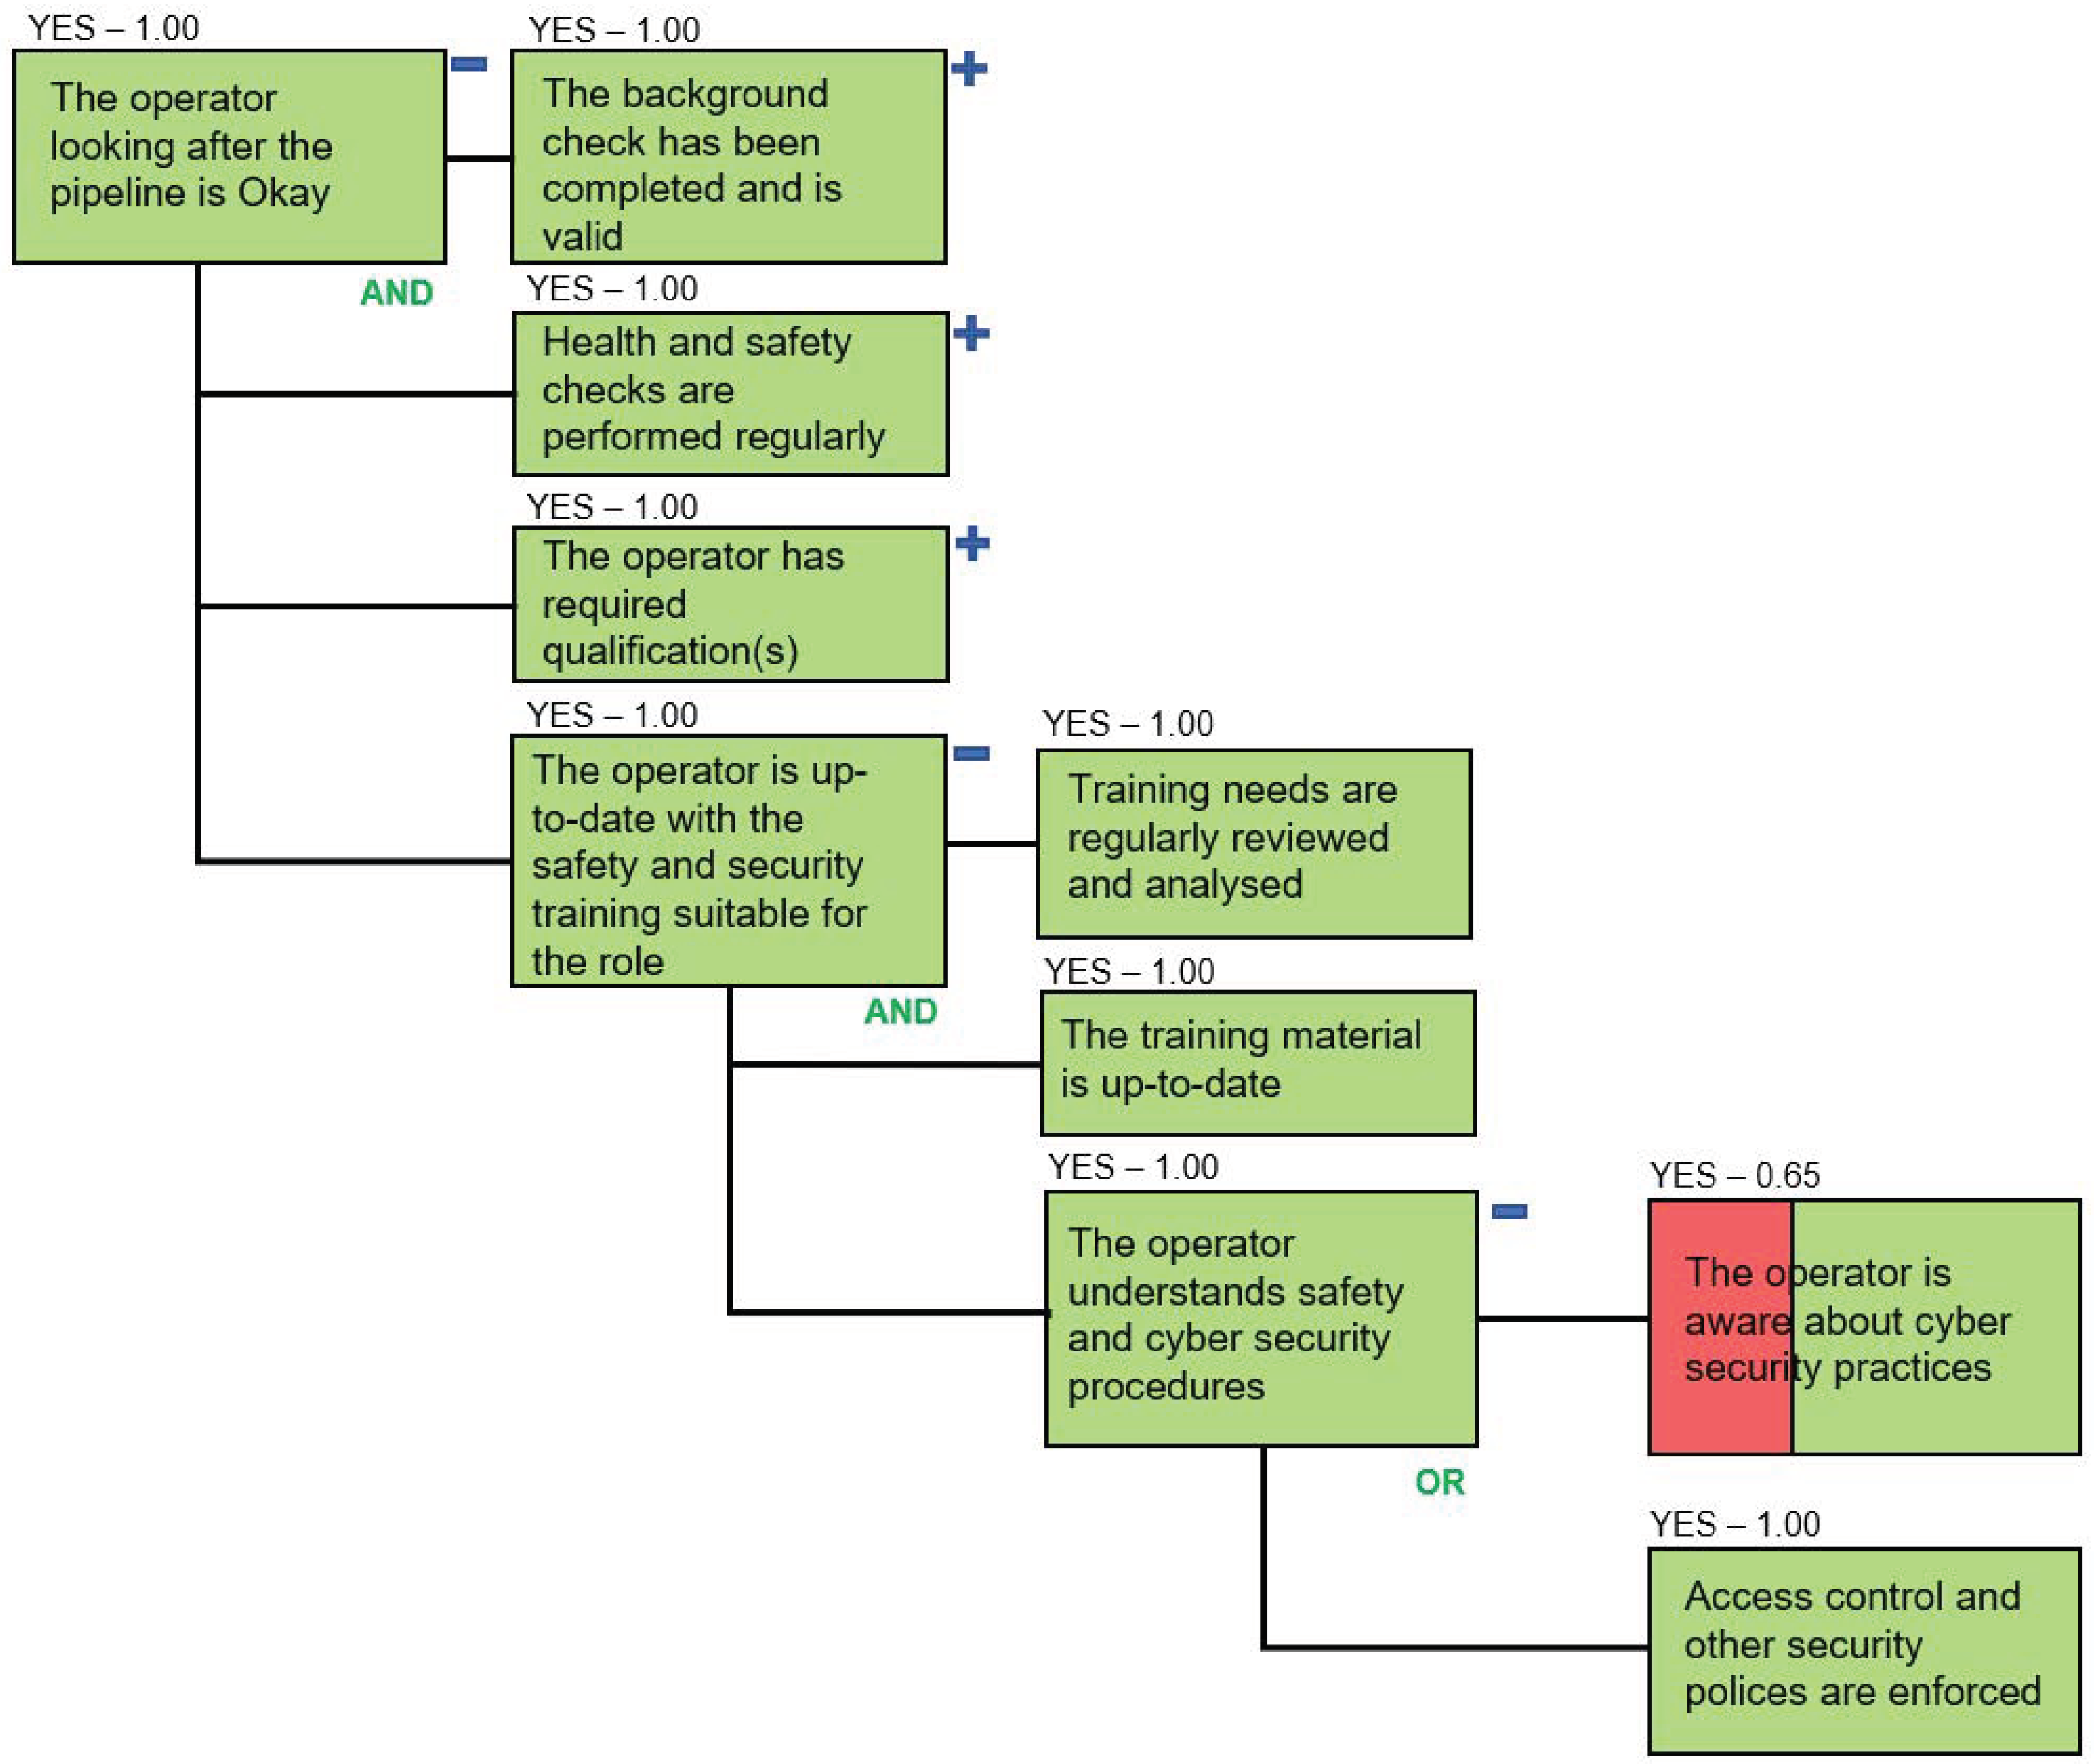
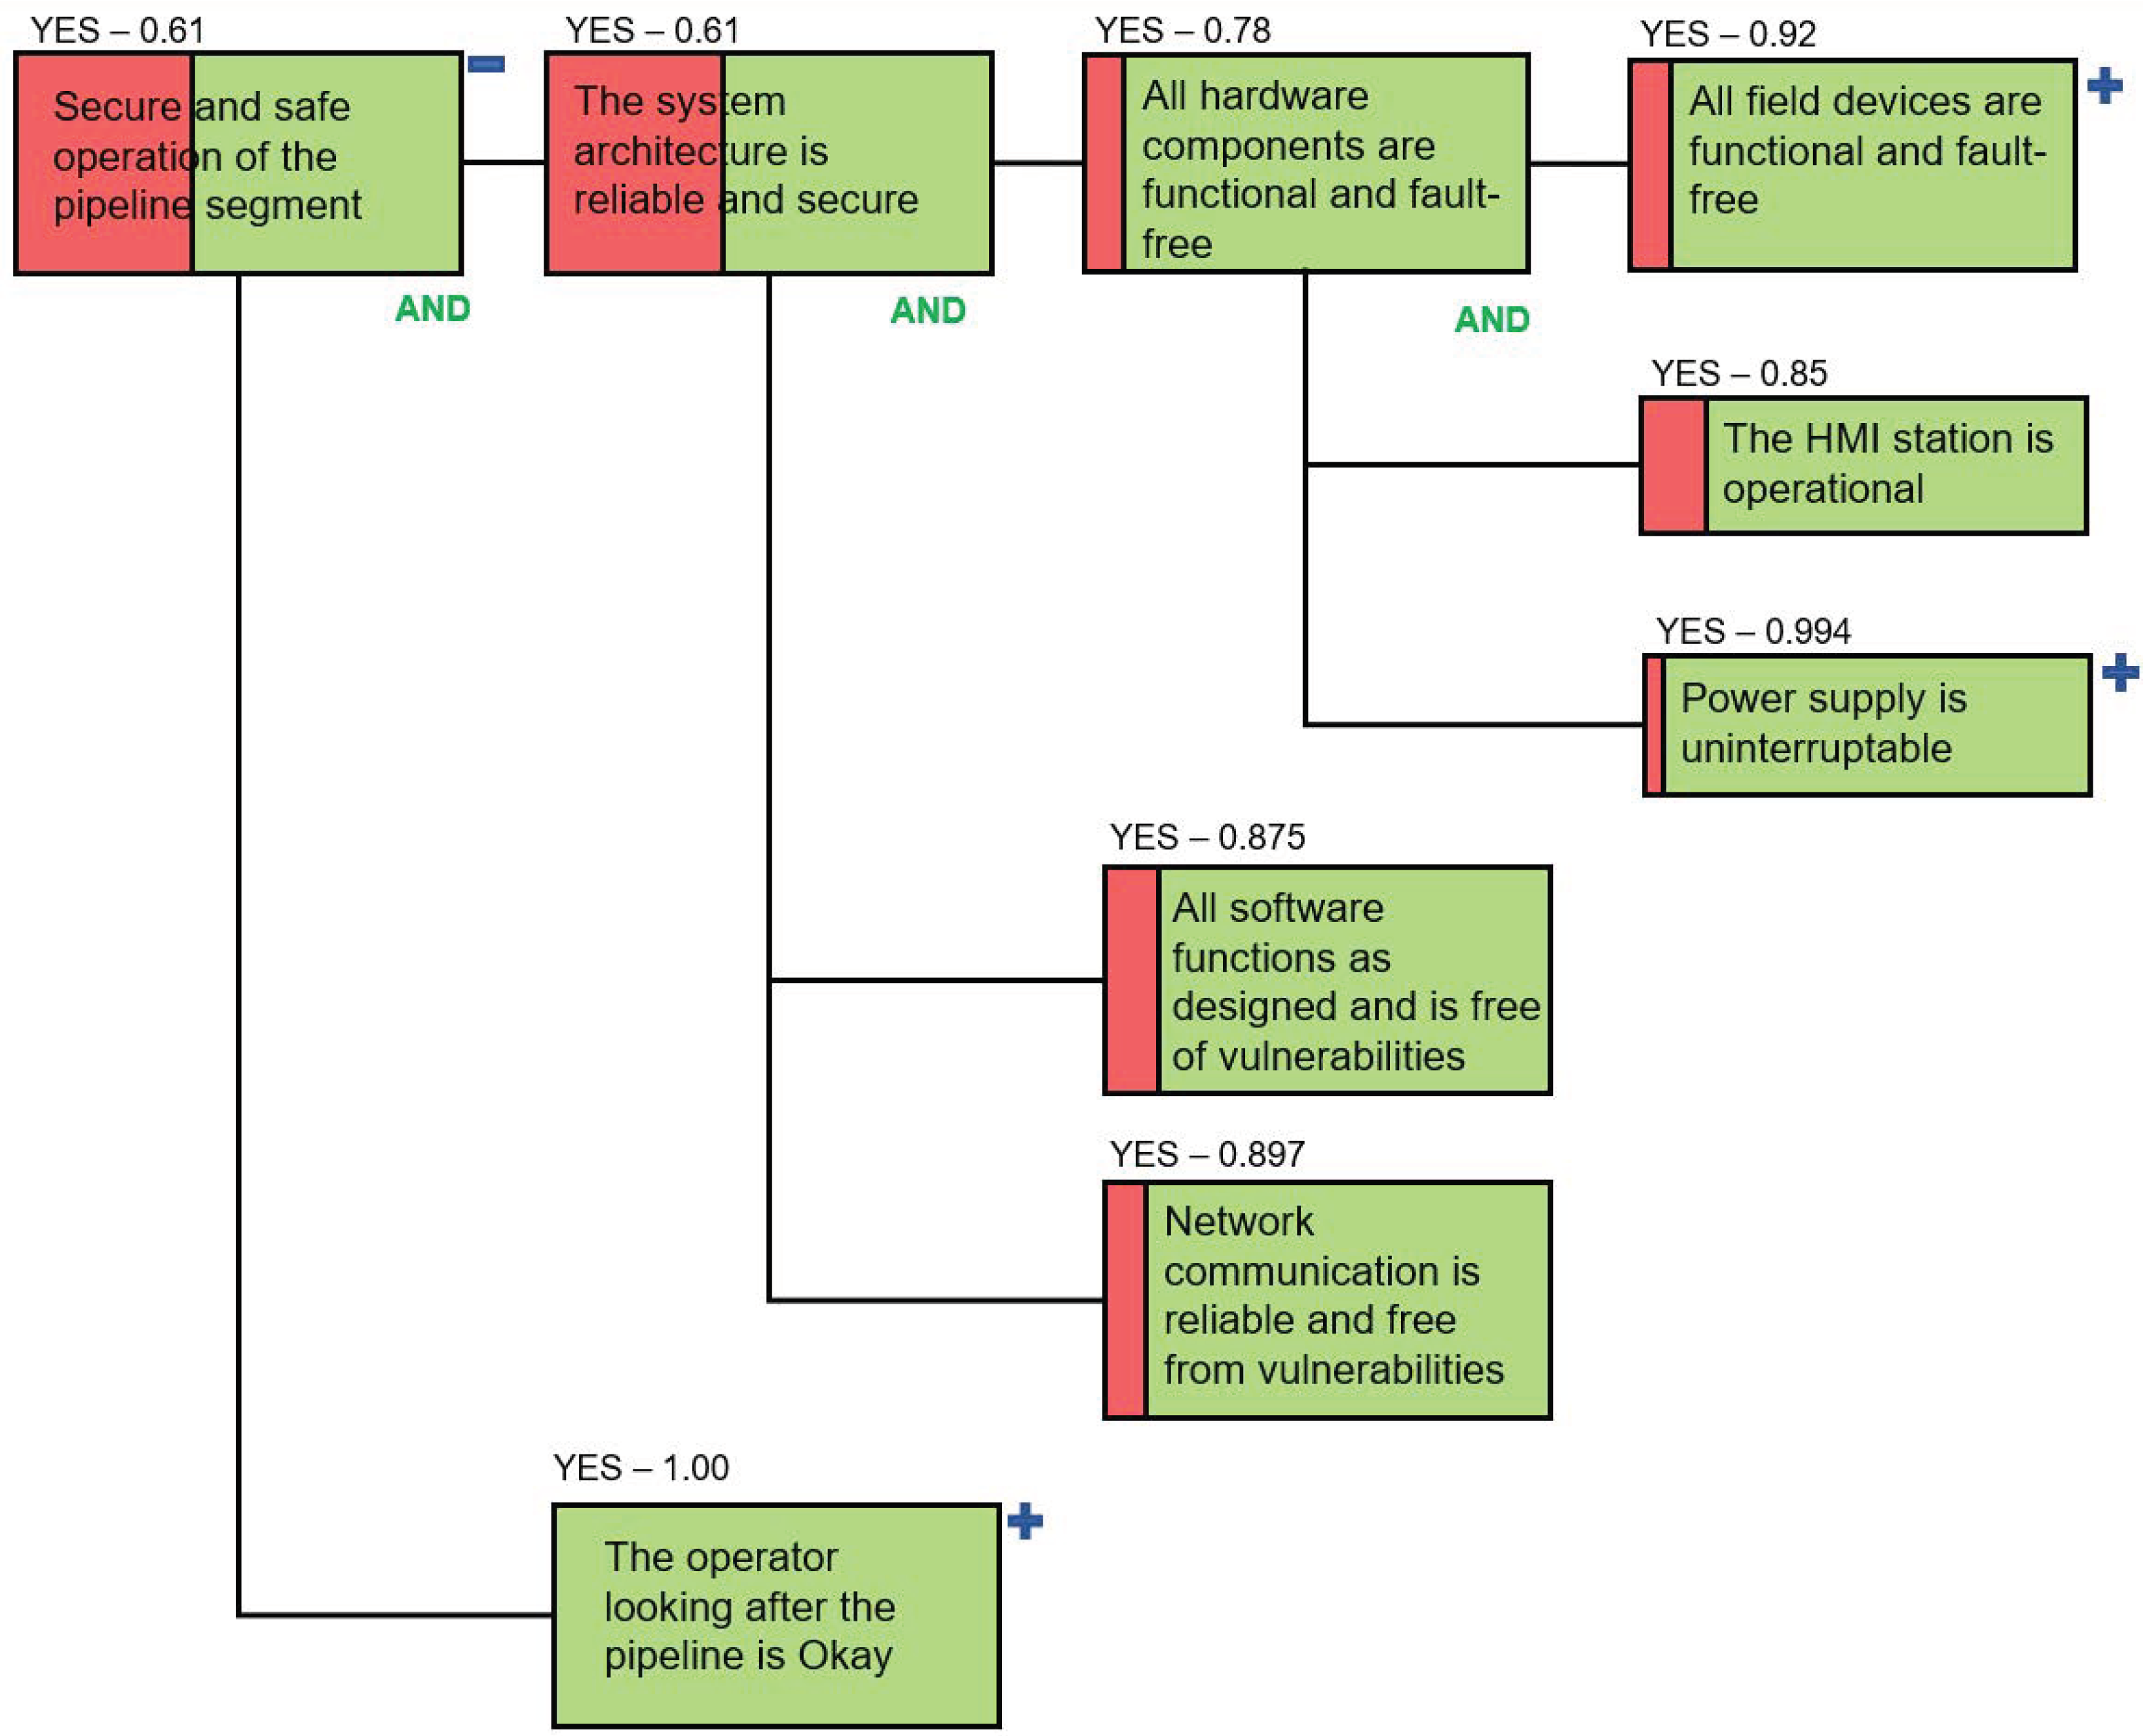
6. Illustrative Example: Water Distribution System

In this section, we consider a cyber-physical system which controls water distribution along a segment of a pipeline.

6.1. Scenario Description

The pipeline is equipped at intervals along its length with pressure transducers (sensors), pumps and valves. The valves can be placed every 5 to 20 miles along the pipeline. A Remote Terminal Unit (RTU) periodically collects data from the pressure sensors, which are scattered over the pipeline, and sends commands to valves and pumps.
We examine the section of the pipeline where RTU 1 collects the pressure readings from Sensor 1 and controls the safety shut-off valve, and where its neighbouring RTU 2 collects the pressure readings from Sensor 2 and controls the pump. Both RTUs are commonly used data logging components CR1000 Measurement and Control Systems [28].
The business process diagram expressed in Business Process Model and Notation (BPMN) [29] in Figure 4 shows the process of communication between the control centre, RTU 1, RTU 2 and other field equipment. On the initiation of the control process RTU 1 requests a pressure value from Sensor 1 (P1) and verifies whether the pressure exceeds a threshold value (Pmax). If P1 is greater than Pmax, then control actions are taken to adjust the flow rate and pressure in the pipeline. We indicate this in the diagram with an intermediate throwing Link Event “Pressure Correction”. The actions required to correct the pressure may be depicted in a separate diagram, but in this example, we do not focus on this scenario. If P1 does not exceed Pmax, RTU 1 requests the pressure reading from RTU 2, which it receives from Sensor 2 (P2). RTU 1 calculates the pressure difference between its own sensor and the sensor of RTU 2 ( Δ P = | P 1 P 2 | ). The threshold (ΔPmax) is typically exceeded by ΔP when the pipeline is broken. If ΔP does not exceed its threshold, then RTU 1 repeats the request to its sensor after a scan interval. A scan interval is set for each CR1000 and may vary between 1 s and 1 h. If ΔP exceeds the threshold, then RTU 1 sends an alarm signal to the control centre. The control centre answers with an emergency control order to RTU 1 to shut down the valve and to RTU 2 to stop the pump. The CR1000 has 8 Digital I/O ports selectable under program control as binary inputs or control outputs. One of these ports is used as output to switch power to the pump via a solid state relay. The orders from the control centre allow shutting down the portion of the pipeline in the event of an accident or for other safety reasons.
The physical access to the RTUs is controlled in this segment of pipeline (in this scenario, a 40 foot by 40 foot area around a mainline valve site is surrounded by a chain-link fence and the devices are placed in a locked enclosure), and video surveillance is in place. For the sensors, neither physical access is controlled nor is a video surveillance system for monitoring these field devices installed. The RTUs are locally installed on pumps and valves, and they control their operation-communicating via a unidirectional wired link over fieldbus cables transmitting digital (binary) output from a digital port on CR1000 to the two-state field devices. High-precision pressure sensors have RS485 digital interface and an optional USB or RS232 converter cable. In our segment, the sensors are connected to the CR1000s via RS232 port.
The RTUs communicate with the control centre, which is located hundreds of kilometres away from the pipeline over public networks. The RTUs communicate with the HMI at the control center over Modbus TCP communication protocol. RTUs communicate with each other to exchange pressure readings over a bidirectional wireless link using Modbus RTU protocol.

6.2. Configuring SCADA DM for the Scenario

The generic SCADA DM presented in Section 5 is used as the baseline template. In order to produce a dependency model for this specific water distribution system, controlling water distribution, we first create a new model based on the generic template and then refine it for the specific context.
In order to keep this example at a manageable scope, we focus on two out of the six key areas: System Architecture, where we predominantly concentrate on the hardware components, and Employees, since a human operator plays a crucial role in this process.
The top level of the resultant dependency model is shown in Figure 5. In this model and other dependency models in this paper, the green part of a paragon reflects the probability of success and the red part—the probability of failure. Figure 6 and Figure 7 expand the two key areas System Architecture and Employees, respectively. In this model, the names of the paragons are made specific to the system. Since we only assess the risks related to one SCADA system operator controlling this segment of the pipeline, we keep the paragon focused on this particular employee.
Figure 5 shows that the success probability of the root paragon is low: 0.0996. The success probabilities of the paragons “The system architecture is reliable and secure” and “The operator looking after the pipeline is Okay” are 0.1532 and 0.65, respectively.
The leaf node success–failure probabilities for all hardware components are assigned based on the expert knowledge about the segment of the pipeline and available data and statistics regarding (1) the failure of the field devices of a similar make in the previous reporting period, (2) the duration of the field devices being in operation, and (3) the physical state of each device as reported during the recent routine check. These probabilities are shown in Figure 6 above the leaf paragons. There are two RTUs which are included in the dependency model (Figure 6); while RTU1 was recently replaced, RTU2 was in operation for several years, and the probability of its failure is 0.2, which is significantly higher in comparison with RTU1, where the probability of failure is 0.04. (Note that in all dependency model graphs in this paper, we show the probability of its success above each paragon).
The success probability of the paragon “Power supply is uninterruptible” is high and equal to 0.994. It depends on the reliability of the Energy CNI. At the same time, emergency backup power supply is available to support the operation of this segment of the pipeline. The emergency power supply (the paragon “The emergency backup power source is reliable”) is introduced into the model using an OR relationship as a countermeasure against the failure of the paragon “Power supply is uninterruptible”.
In Figure 6, we imply that the paragons “Software functions as designed and is free from vulnerabilities” and “Network communication is reliable and is free from vulnerabilities” also have underlying dependencies. However, we do not detail them in this example. The assumption is that the probabilities for the above named paragons are calculated beforehand, and they are approved and supplied by the respective domain experts as the final probability figures and are included into the model as provided, with the underlying dependencies not being considered.
The operator’s trustworthiness and ability to accurately evaluate SCADA system data during normal and abnormal operating conditions is imperative. Therefore, a number of requirements must be satisfied for the success of the paragon “The operator looking after the pipeline is Okay”. In Figure 7, the observed states of the paragons “The background check has been completed and is valid”, “Health and safety check is performed regularly” and “The operator has required qualification” indicated that the requirements are fully met (the value of the success probability is set to 1). A paragon should have at least two distinct named states, which typically represent degrees of achieving of the key goal (from failure to success). While it is possible setting the probabilities for each leaf paragon, in a dependency model, it is also possible to declare an observed state as we did for the above discussed paragons. This is possible because it is known that the required checks and actions were completed by and for the employee and are not subject to change during the reporting period.
Figure 5 indicates that the success probability of the root paragon is low. Since this is an unacceptable level of the success probability, we need to conduct risk assessment to identify the dependencies that affect the key goal the most and then introduce countermeasures to mitigate the key risks and to increase the success probability.
A three-point sensitivity chart was produced for the discussed scenario in order to identify the dependencies that affect the key goal. The chart is presented in Figure 8 and shows the sensitivity of the root paragon to the uncontrollable dependencies. The left side of the red portion of each bar shows the decrease in success probability for the root paragon if the success probability of the corresponding leaf paragon reduces to 0. The right side of the green portion of each bar shows the increase of the success probability for the root paragon if the success probability of the corresponding paragon increases to 1. The difference between these two values is called the sensitivity of the root paragon to a particular uncontrollable dependency. The border between the red and green parts of each bar indicates the current success probability (equal to 0.0996 as shown in Figure 5) that the root paragon has on all its leaf paragons together.
Figure 8 indicates that the uncontrollable dependencies which influence the success of the root goal the most are “The operator understands safety and security procedures” (0.1532), “Pressure sensor 1 is operational” (0.1443), “Pressure sensor 2 is operational” (0.1443), “The shutoff valve is operational” (0.1277), etc. In the brackets in Figure 8, we show the sensitivity of the success probability of the root paragon to an uncontrollable dependency.
For example, the sensitivity of the core goal to the paragon “The operator understands safety and security procedures” is 0.1532, and the red part of the bar starts at the 0 point on the x-axis (Figure 8). This means that if the success probability of this paragon reduces to 0, then the success probability of the core goal also reduces to 0. If the success probability of this paragon increases to 1, then the success probability of the core goal increases to 0.1532. Figure 8 shows that while the key paragon is highly sensitive to the uncontrollable dependency “The operator understands safety and security procedures”, its sensitivity to the paragon such as for example “The emergency backup power source is reliable” is lower and equal to 0.002. This implies that changing the success probability value from 1 to 0 for the latter paragon makes a less significant difference to the success of the root paragon. Thus, a three-point sensitivity chart allows determining the paragons that present high risks to the core goal. It means that focusing on reducing risks for high sensitivity paragons will lead to more significant improvements in the success probability of the core goal.

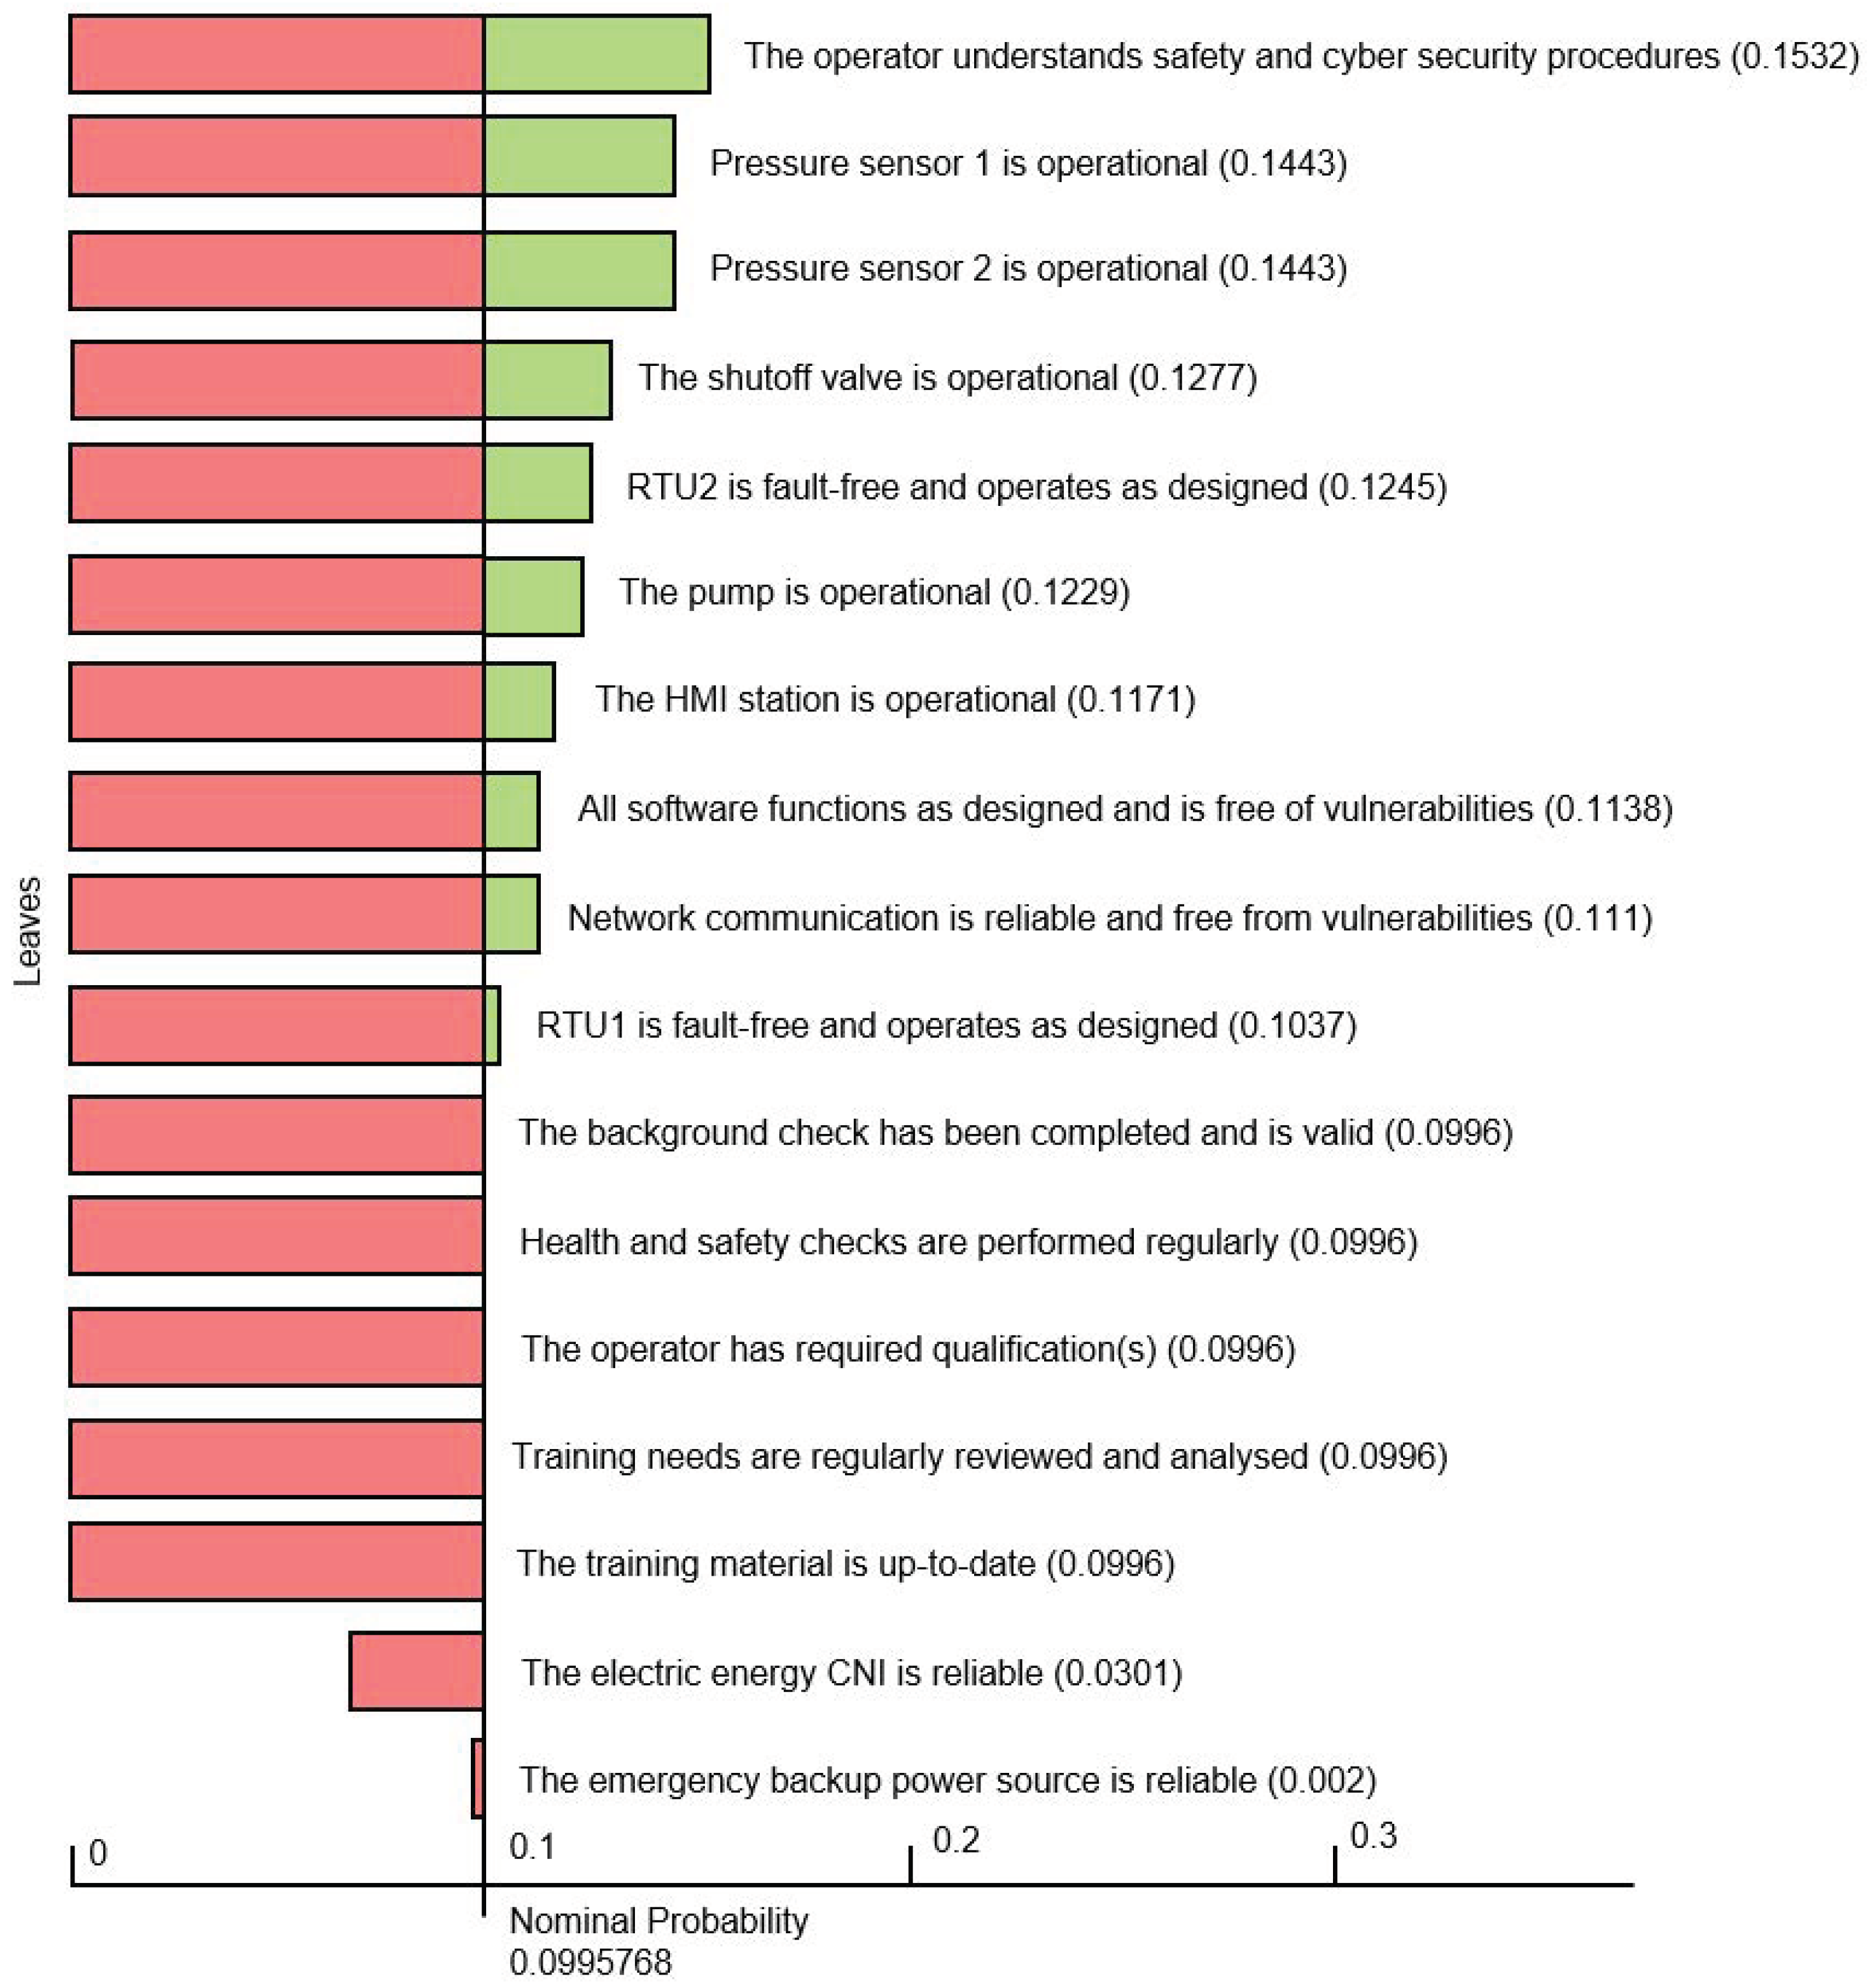
6.3. Introducing Countermeasures into the Dependency Model

Figure 9 and Figure 10 show the updated parts of the dependency model where a range of changes and countermeasures have been introduced to reduce the risks to the segment of the pipeline and to increase the success of the root paragon. Figure 9 shows the updated dependencies of the paragon “All field devices are functional and fault-free”, which in its turn is one of the dependencies of the paragon “All hardware is functional and fault-free”, as shown in Figure 6.
In order to deal with the risks posed by the failure of the passive and active field devices in the examined segment of the pipeline (in this case, these are the pressure sensors 1 and 2, the shutoff valve, and the pump), we have introduced a field device replacement support service, which guarantees that any damaged field device that goes out of order either due to wear and tear or due to any abnormal conditions will be promptly replaced or repaired. Using an appropriate software interface, an engineer is able to read (upload) parameter values from an old device and write (download) them onto a new device to expedite the replacement process. The replacement process also includes the examination of the stored device values in order to support the analysis of the device behaviour and troubleshooting.
The new countermeasure is included in the model as a leaf node “Field device replacement is fast and efficient” (Figure 9). It is connected using an OR relationship with the new paragon “All passive and active components are operational” which unites under its umbrella the two paragons “All passive components are operational” and “All active components are operational”, which are adopted from the original model shown in Figure 6. In Figure 9, the RTU2 is replaced with a new device, and the probability of its faulty behaviour is reduced from 0.2 to 0.04.
The above two measures led to the increase of the success probability of the paragon “All field devices are functional and fault-free” from 0.231 to 0.9216 (compare Figure 6 and Figure 9).
Figure 10 presents the updated dependencies of the paragon “The operator looking after the pipeline is Okay”. The three-point sensitivity chart in Figure 8 flagged that the operator’s appreciation of the safety and cyber security procedures (or the lack of thereof) affects the core goal the most. In order to mitigate this risk, we introduced a new countermeasure where the SCADA system enforces strict access control and other security policies (e.g., access to information based on the need-to-know approach, disallowance of the use of mobile and USB devices and disabling the AutoRun feature). We introduce this paragon as a countermeasure using an OR logical operator. We declare the observed state of this new paragon as “YES-1.00”, since we consider the new state of the system where all these measures are fully implemented. The introduction of this countermeasure increases the success probability of the paragon “The operator looking after the pipeline is Okay” from 0.65 to 1.00 (compare Figure 7 and Figure 10).
Figure 11 shows the state of the top level of the dependency model after introducing all countermeasures discussed above. This figure demonstrates that the introduction of countermeasures resulted in the increase of the success probability of the paragon “The system architecture is reliable and secure” from 0.1532 to 0.61 (compare Figure 6 and Figure 11). As a result of all changes, the success of the root paragon has increased from 0.0996 to 0.61 (Figure 5 above and Figure 11 respectively). Risk assessment and the introduction of additional countermeasures, as well as the increase of success of highly sensitive paragons, should continue until the success probability of a core goal reaches an acceptable value. In this example, we assume that 0.61 is an acceptable value and stop the analysis at this point.
The three-point sensitivity chart is regenerated for the updated version of the dependency model and is presented in Figure 12. It shows a new range of paragons to which the core goal is sensitive together with the levels of sensitivity to each leaf paragon (between the right and left sides of each bar). For example, for the leaf paragons where the corresponding bars in Figure 12 have no green section, the conclusion is that the increase of the success probabilities would not lead to any increase of the success probability of the root paragon. This indicates that the current state of these leaf paragons is adequate, and they do not require any further actions on them. For the leaf paragons where the corresponding bars have a green segment, it means that increasing the success probability for these paragons will lead to the increase of the probability of the core goal success. Based on this outcome, a cost–benefit analysis may be conducted to establish what actions and improvements in terms of risk management for these sets of leaf paragons is optimal. Figure 12 also shows that the success of the root goal critically depends on those leaf paragons that have a large red segment stretching on the sensitivity axis from the nominal probability (0.61) to 0. For the paragons presented by the top ten bars, which exhibit a stretch of sensitivity from 0 to the nominal probability, the graph indicates that the drop of the success probability for each of these paragons leads to the overall failure of the core goal.
Above, we presented some exemplary conclusions that may be derived from a three-point sensitivity chart. A sensitivity chart forms a basis for a systematic and more detailed risk assessment for each dependency in a model.

7. Conclusions and Future Work

In this project, we collected and analysed the understanding of the dependencies within a SCADA system from 36 domain experts. As the key contribution, we have produced and presented a configurable dependency model of a SCADA system containing 452 dependencies. The model addresses all identifiable areas of a SCADA system and serves as a template that may be configured to fit the specifics and needs of a particular SCADA system. It is time- and resource-consuming for any organisation to undertake the type of activity we undertook in this project in order to build an extensive multi-dimensional model of a SCADA system. Using our configurable model will help organisations save time and resources dedicated to risk assessment, and it will allow them to benefit from much broader domain expertise than they generally have access to.
The proposed model has a broad scope, as it identifies and incorporates the elements that are pertinent to a diverse range of roles involved in the design, development, operation and maintenance of a SCADA system. It is virtually impossible from the perspective of an operator, for example, to identify the issues that are managed at a higher or different level, e.g., communication with media in case of an incident or customer service, etc. At the same time, from the perspective of a hardware engineer, it is hardly feasible to anticipate issues with the cognitive effectiveness of data visualisation and timely training of operators on updated security procedures. The SCADA DM presented in this paper brought together the different perspectives onto a SCADA system and organised them in a hierarchical structure of a dependency model which could facilitate risk assessment.
We demonstrated how dependency modelling could be utilised for risk assessment using a case study of a water distribution SCADA system. The risk sensitivity of every dependency was quantified, and the dependencies that pose the highest or significant risk to the success of the core goal were flagged.
The presented configurable, customisable dependency model of a SCADA system provides the academic and industry community with a toolkit for better understating of a SCADA system and for risk assessment. The SCADA DM may support the justifiable evidence-based decision making with regard to the choice of effective risk-mitigating countermeasures based on probabilistic inferences. It is a template for predictive analysis that could support those who deal with a myriad of issues in ICS systems and cyber security investments.
The validation of the presented model is rooted (1) in the fact that the initial data were collected from the domain experts, (2) in a rigorously documented and transparent process of mind maps analysis and the subsequent process of transforming the unified mind map into the dependency model, and (3) in the confirmation of the completeness and appropriateness of the SCADA DM by experts during the validation workshops.
We recognise the limitations of the PRA method used in the following: dependency modelling does not allow specifying the weighted importance of dependencies. This will be a subject of our future work. The tool also inherits the weaknesses of a classic quantitative risk-based analysis that is subjective and at the same time hard to justify with high confidence for all paragons. A version of the approach could be developed allowing probability intervals rather than fixed values reflecting the best–worst-case scenarios. Furthermore, the SCADA DM will benefit from additional iterations of stakeholders’ reviews and modifications. Additional workshops with domain experts will help to fine-tune the model. In the future, we plan to conduct a detailed comparison of the SCADA DM with other emerging goal-oriented models of a SCADA system, and this may lead to the enriching of the SCADA DM with new elements.
In this paper, we focused on the use of the SCADA DM for risk assessment. However, the model may have implications that go beyond this. The SCADA DM may support in-work training and awareness programs. A newcomer to the SCADA domain or even an expert willing to expand their knowledge may rely on the model to gain faster appreciation of the complexity and diversity of a SCADA system. We believe that the SCADA DM will be of value for the SCADA/ICS community and thereby provide it as a blueprint for future instantiation.

Author Contributions

Conceptualization, Y.C., P.B. and K.J.; Data curation, Y.C. and S.N.-T.; Funding acquisition, P.B. and K.J.; Methodology, Y.C.; Visualization, Y.C.; Writing—original draft, Y.C.; Writing—review and editing, Y.C. and S.N.-T. All authors have read and agreed to the published version of the manuscript.

Funding

This work was funded by the Airbus Group Endeavr Wales scheme under the SCADA Cyber Security Life-cycle (SCADA-CSL) programme. The third author is supported by the national project RICS (Resilient Information and Control Systems) financed by the Swedish Civil Contingencies Agency (MSB).

Institutional Review Board Statement

The data collection was conducted in 2015–2016. According to the Ethics Committee procedure that was in place in 2015, data collection activities that did not involve personally identifiable information were not subject for approval.

Informed Consent Statement

Informed consent was obtained from all subjects involved in the study.

Data Availability Statement

The SCADA Dependency model is available in a graphical form (jpg) and as an XML at https://git.cardiff.ac.uk/c1051916/SCADA_DM (accessed on 27 March 2022).

Acknowledgments

The authors would like to thank all experts who participated in the SCADA mind mapping exercise and in the validation workshops.

Conflicts of Interest

The funders had no role in the design of the study; in the collection, analyses, or interpretation of data; in the writing of the manuscript, or in the decision to publish the results.

Abbreviations

The following abbreviations are used in this manuscript:
BPMNBusiness Process Model and Notation
CNICritical National Infrastructure
DMDependency Model
HMIHuman–Machine Interface
ICSIndustrial Control Systems
OSOperating System
PRAProbabilistic Risk Assessment
SCADASupervisory Control and Data Acquisition
RTURemote Terminal Unit

Appendix A. Participants’ Profile

Table A1. Participants’ Profile. Domains and Roles.
Participant No.DomainRole
1GovernmentHead of CNI/ICS defence
2AcademiaResearch Assistant
3Energy-NuclearC&I Safety Assessor/Inspector
4Built EnvironmentDirector
5Aerospace, Marine, Energy and DefenceSoftware Intensive Systems Specialist
6Nuclear, Defence, Aerospace and MarineStrategy Lead/Consultant
7Oil, Gas & PetrochemicalsChief Engineer Control Systems
8Academia/Electrical EnergyLecturer
9Various domains from risk perspectiveTeam Lead/ Cyber Security Consultant
10DefenceSecurity researcher
11DefenceSenior Engineer
12Government and waterSecurity advisor
13AcademiaTechnical Lead/Researcher
14AcademiaProfessor
15AerospaceCyber Technical Lead for Forensics
16Energy, Gas and Smart MeteringManaging Consultant, R&D in Technology Group
17Energy, waterCyber security consultant
18AcademiaResearch
19AcademiaLecturer
20TransportLecturer
21Defence and spaceSales manager
22Transport (Airports)Technical architect
23Transport (Rail and MRTS)Senior Executive Officer
24Energy, Net GridTechnical Advisor
25EnergyDeveloper
26EnergyConsultant
27Energy/ElectricityTechnology Developer
28EnergySCADA System administrator
29Space and Geographical SystemsSenior Software Developer
30Energy (Transport)Operations Manager
31Various domainsAdvisor, requirements, assessment
32EnergyProduct manager
33Critical InfrastructureCTO
34TransportInfrastructure specialist
35EnergyOperations/System Engineer
36Energy/TransportTechnical specialist
Table A2. Participants’ Profile. Expertise in SCADA and Cyber Security.
Partic. No.Years in SCADAAspects of SCADAYears in SecurityAspects of Security
12.5Response/assurance testing20Malware, pen-testing, incident response, forensics etc.
21SCADA forensics4Cyber security, digital forensics
340SCADA/ICS4Computer-based safety systems
43Business Processes & System Engineering18InfoSec, cyber security, system engineering and development of code of practice
537Protection (safety) systems37Defence, information assurance
62System design/integration, information assurance10secure systems design, secure life cycle, safety and security
710Specification, Procurement, Functional Definition3Theory
89WAN telecom delivery technology, synchro phasors0N/A
91Cyber risk12Security architecture, cyber risk identification and mitigation
105Not specified5Embedded systems
111Research20Certification management, key management, system level, SOCs
123Protective security of SCADA systems30Military, Management, policy and advisory role
135Architecture and technologies5Networks
142Aircraft Docking Systems and Taxiway routing7Detection and prediction of cyber attacks
151.5Various8.5Forensics
166Security Architecture and Integration, Response systems16System Architecture and Network security, cryptographic protocols, development, InfoSec Management, Systems and Governance
171.5Risk assessment10IT
183Resilience Modelling3Resilience Modelling
196Networks6Networks
202Their use in remote condition monitoring0N/A
211Sales0N/A
2220Design and implementation (complete life cycle)0N/A
237Complete SCADA System with main focus on Control Centre (Software, Hardware, Networking, System Integration etc.)15Information Security – ensure integrity of recording data, maintain data flows, controlled deletion
2430Statistics0N/A
2530Statistics0N/A
268All aspects of SCADA8General knowledge
2720High level and generalisation at staff level2General and related to high level
286Servers, security, network, changes/updates, education etc.10General knowledge
291Design and architecture4Data Leakage Prevention, Security Policies
3022RTU, control systems integration5Ethical hacking, server hardening, DMZ
3115Cyber security20Diverse range of topics
3220Development5Security architectures, access control
335Security and risk management20Governance and defence
3440Availability, procurement, projects, IT security, safety15Regulation, networks and other
357Central system, RU, HMI, IED2VPN, tunnelling, firewalls, routing, DMZ
3615Remote control of substations0Some knowledge
Average10.79 9.01

References

  1. Miller, T.; Staves, A.; Maesschalck, S.; Sturdee, M.; Green, B. Looking back to look forward: Lessons learnt from cyber-attacks on Industrial Control Systems. Int. J. Crit. Infrastruct. Prot. 2021, 35, 100464. [Google Scholar] [CrossRef]
  2. Miller, B.; Rowe, D. A survey SCADA of and critical infrastructure incidents. In Proceedings of the 1st Annual Conference on Research in Information Technology, Calgary, AL, Canada, 11–13 October 2012. [Google Scholar]
  3. Maglaras, L.; Ferrag, M.A.; Derhab, A.; Mukherjee, M.; Janicke, H.; Rallis, S. Threats, protection and attribution of cyber attacks on critical infrastructures. arXiv 2019, arXiv:1901.03899. [Google Scholar]
  4. Cherdantseva, Y.; Burnap, P.; Blyth, A.; Eden, P.; Jones, K.; Soulsby, H.; Stoddart, K. A Review of cyber security risk assessment methods for SCADA systems. Comput. Secur. 2016, 56, 1–27. [Google Scholar] [CrossRef] [Green Version]
  5. The Open Group. Dependency Modeling (O-DM). Constructing a Data Model to Manage Risk and Build Trust between Inter-Dependent Enterprises; Open Group: San Francisco, CA, USA, 2012. [Google Scholar]
  6. Patel, S.; Graham, J.; Ralston, P. Quantitatively assessing the vulnerability of critical information systems: A new method for evaluating security enhancements. Int. J. Inf. Manag. 2008, 28, 483–491. [Google Scholar] [CrossRef]
  7. Codetta-Raiteri, D.; Portinale, L. Decision Networks for Security Risk Assessment of Critical Infrastructures. ACM Trans. Internet Technol. (TOIT) 2018, 18, 29. [Google Scholar] [CrossRef]
  8. Cheminod, M.; Durante, L.; Valenzano, A. Review of Security Issues in Industrial Networks. IEEE Trans. Ind. Inform. 2013, 9, 277–293. [Google Scholar] [CrossRef]
  9. Ralston, P.; Graham, J.; Hieb, J. Cyber security risk assessment for SCADA and DCS networks. ISA Trans. 2007, 46, 583–594. [Google Scholar] [CrossRef] [PubMed]
  10. Taylor, C.; Krings, A.; Alves-Foss, J. Risk analysis and probabilistic survivability assessment (RAPSA): An assessment approach for power substation hardening. In Proceedings of the ACM Workshop on Scientific Aspects of Cyber Terrorism, (SACT), Washington, DC, USA, 21 November 2002; p. 64. [Google Scholar]
  11. Roy, A.; Kim, D.; Trivedi, K.S. Cyber security analysis using attack countermeasure trees. In Proceedings of the Sixth Annual Workshop on Cyber Security and Information Intelligence Research, Oak Ridge, TN, USA, 21–23 April 2010; p. 28. [Google Scholar]
  12. Guan, J.; Graham, J.; Hieb, J. A digraph model for risk identification and management in SCADA systems. In Proceedings of the IEEE International Conference on Intelligence and Security Informatics (ISI), Beijing, China, 10–12 July 2011; pp. 150–155. [Google Scholar]
  13. Zhang, Q.; Zhou, C.; Xiong, N.; Qin, Y.; Li, X.; Huang, S. Multimodel-based incident prediction and risk assessment in dynamic cybersecurity protection for industrial control systems. IEEE Trans. Syst. Man Cybern. Syst. 2016, 46, 1429–1444. [Google Scholar] [CrossRef]
  14. Baiardi, F.; Telmon, C.; Sgandurra, D. Hierarchical, model-based risk management of critical infrastructures. Reliab. Eng. Syst. 2009, 94, 1403–1415. [Google Scholar] [CrossRef] [Green Version]
  15. Gonzalez-Granadillo, G.; Dubus, S.; Motzek, A.; Garcia-Alfaro, J.; Alvarez, E.; Merialdo, M.; Debar, H. Dynamic risk management response system to handle cyber threats. Future Gener. Comput. Syst. 2018, 83, 535–552. [Google Scholar] [CrossRef]
  16. Kure, H.I.; Islam, S.; Razzaque, M.A. An integrated cyber security risk management approach for a cyber-physical system. Appl. Sci. 2018, 8, 898. [Google Scholar] [CrossRef] [Green Version]
  17. Taormina, R.; Galelli, S.; Tippenhauer, N.O.; Salomons, E.; Ostfeld, A. Characterizing cyber-physical attacks on water distribution systems. J. Water Resour. Plan. Manag. 2017, 143, 04017009. [Google Scholar] [CrossRef]
  18. Berglund, E.Z.; Pesantez, J.E.; Rasekh, A.; Shafiee, M.E.; Sela, L.; Haxton, T. Review of modeling methodologies for managing water distribution security. J. Water Resour. Plan. Manag. 2020, 146, 03120001. [Google Scholar] [CrossRef]
  19. Chittester, C.; Haimes, Y.Y. Risks of terrorism to information technology and to critical interdependent infrastructures. J. Homel. Secur. Emerg. Manag. 2004, 1, 402. [Google Scholar] [CrossRef]
  20. Haimes, Y.V. Hierarchical holographic modeling. IEEE Trans. Syst. Man Cybern. 1981, 11, 606–617. [Google Scholar] [CrossRef]
  21. Buzan, T. The Mind Map Book; Penguin: New York, NY, USA, 1991. [Google Scholar]
  22. Eppler, M.J. A comparison between concept maps, mind maps, conceptual diagrams, and visual metaphors as complementary tools for knowledge construction and sharing. Inf. Vis. 2006, 5, 202–210. [Google Scholar] [CrossRef]
  23. Dixon, R.A.; Lammi, M. Cognitive Mapping Techniques: Implications for Research in Engineering and Technology Education. J. Technol. Educ. 2014, 25, 2–17. [Google Scholar] [CrossRef]
  24. Tattersall, C.; Powell, J.; Stroud, J.; Pringle, J. Mind mapping in qualitative research. Nurs. Times 2011, 107, 20–22. [Google Scholar] [PubMed]
  25. Ritchie, J.; Spencer, L. Qualitative data analysis for applied policy research. Qual. Res. Companion 2002, 573, 305–329. [Google Scholar]
  26. King, N. Using templates in the thematic analysis of text. In Essential Guide to Qualitative Methods in Organizational Research; Cassell, C., Symon, G., Eds.; Sage: Newcastle upon Tyne, UK, 2004. [Google Scholar]
  27. Gertman, D.; Folkers, R.; Roberts, J. Scenario-based approach to risk analysis in support of cyber security. In Proceedings of the 5th International Topical Meeting on Nuclear Plant Instrumentation Controls, and Human Machine Interface Technology, Albuquerque, NM, USA, 12–16 November 2006. [Google Scholar]
  28. Campbell Scientific. CR1000 Measurement and Control System; Revision: 7/08; Campbell Scientific: Logan, UT, USA, 2008. [Google Scholar]
  29. ISO/IEC 19510:2013(E); Information Technology-Object Management Group Business Process Model and Notation. ISO: Geneva, Switzerland, 2013.
Figure 1. An Early Version of the Unified SCADA Mind Map.
Applsci 12 04880 g001
Figure 2. Top-Level Entities of the Unified Mind Map of a SCADA System.
Applsci 12 04880 g002
Figure 3. The Top Level of the SCADA DM.
Applsci 12 04880 g003
Figure 4. Exchange of Information between Devices in a SCADA System in the Water Distribution Scenario.
Applsci 12 04880 g004
Figure 5. Top-Level DM Configured for the Water Distribution System.
Applsci 12 04880 g005
Figure 6. Dependencies of the Paragon System Architecture.
Applsci 12 04880 g006
Figure 7. Dependencies of the Paragon Employees.
Applsci 12 04880 g007
Figure 8. Three-Point Sensitivity Graph for the Water Distribution SCADA System.
Applsci 12 04880 g008
Figure 9. Introducing Field Device Replacement as a Countermeasure.
Applsci 12 04880 g009
Figure 10. Access Control and Other Security Policies are introduced as Countermeasures.
Applsci 12 04880 g010
Figure 11. Updated Top-Level DM for the Water Distribution System.
Applsci 12 04880 g011
Figure 12. Three-Point Sensitivity Graph for the Water Distribution SCADA System with Countermeasures.
Applsci 12 04880 g012
Publisher’s Note: MDPI stays neutral with regard to jurisdictional claims in published maps and institutional affiliations.

