Article

Use Electroencephalogram Entropy as an Indicator to Detect Stress-Induced Sleep Alteration

1
Department of Veterinary Medicine, School of Veterinary Medicine, National Taiwan University, Taipei 10617, Taiwan
2
Graduate Institute of Brian and Mind Sciences, College of Medicine, National Taiwan University, Taipei 10617, Taiwan
3
Graduate Institute of Acupuncture Science, College of Chinese Medicine, China Medical University, Taichung 406040, Taiwan
4
Department of Medicine, College of Medicine, China Medical University, Taichung 406040, Taiwan
*
Authors to whom correspondence should be addressed.
Appl. Sci. 2022, 12(10), 4812; https://doi.org/10.3390/app12104812
Submission received: 21 March 2022 / Revised: 5 May 2022 / Accepted: 6 May 2022 / Published: 10 May 2022

Abstract

:
An acute stressor can cause sleep disruptions. Electroencephalography (EEG) is one of the major tools to measure sleep. In rats, sleep stages are classified as rapid-eye movement (REM) sleep and non-rapid-eye movement (NREM) sleep, by different characteristics of EEGs. Sleep alterations after exposure to an acute stress are regularly determined by the power spectra of brain waves and the changes of vigilance stages, and they all depend on EEG analysis. Herein, we hypothesized that the Shannon entropy can be employed as an indicator to detect stress-induced sleep alterations, since we noticed that an acute stressor, the footshock stimulation, causes certain uniformity changes of the spectrograms during NREM and REM sleep in rats. The present study applied the Shannon entropy on three features of brain waves, including the amplitude, frequency, and oscillation phases, to measure the uniformities in the footshock-induced alterations of sleep EEGs. Our result suggests that the footshock stimuli resulted in a smoother and uniform amplitude as well as varied frequencies of EEG waveforms during REM sleep. In contrast, the EEGs during NREM sleep exhibited a smoother, but less uniform, amplitude after the footshock stimuli. The result depicts the change property of brain waves after exposure to an acute stressor and, also, demonstrates that the Shannon entropy could be used to detect EEG alteration in sleep disorders.

1. Introduction

Electroencephalography (EEG) corresponds to several vigilance states of the brain. These states, such as wakefulness and sleep, are demonstrated by distinct brain waves [1,2]. Nevertheless, stress influences brain rhythms in both sleep and wakefulness in humans and rodents [3,4,5,6]. For instance, theta waves are predominant during an anxious condition in rodents [7,8,9,10,11]. Moreover, the literature, also, demonstrates that theta waves are dominant during learning and navigation in rodents [1,10,12]. In comparison to wakefulness, the function of electrical activities during sleep is much less known. There are two distinct states of sleep, rapid eye movement (REM) sleep and non-rapid-eye movement (NREM) sleep, and each sleep state has a unique EEG pattern. The delta powers of EEGs during NREM sleep are positively correlated with the level of sleep depth, implying the sleep quality. Stages 3 and 4 of NREM sleep generate large slow waves within the delta frequency band (0.5–4 Hz). Theta waves can be observed during REM sleep in rodents [1,2,10,13].
Diagnostic criteria for acute stress disorder (ASD) or post-traumatic stress disorder (PTSD) include hyperarousal conditions, such as insomnia or hypervigilance [14]. Stress is frequently associated with sleep disturbance (approximate 78%) in insomnia patients [15]. The studies for measuring stress-related sleep problem mainly count on the parameters of polysomnography, e.g., the duration and transitions between different states [5] and the powers of different frequency spectra [4,16,17]. EEG is a composition of distinct brain waves, which contain certain basic features, including amplitude, frequency, and oscillation phases. Some researchers link these features to potential physiological meanings. These features might be correlated and associated with physiological functions. For example, the amplitudes extracted from frequencies between 0.5 and 4 Hz are greater during NREM sleep, during which the amplitudes are positively correlated with sleep intensity [18,19]. The coupling of oscillation phases and frequencies in the hippocampus are elevated when rodents learn a new behavioral task [20,21]. These EEG features can also, solely, correlate with a physiological meaning. For example, instantaneous running speed is positively correlated with the frequencies of theta [11,22] and gamma waves in rats [23,24]. Therefore, the aim of the present study is investigating the features of EEGs during sleep after exposure to an acute stressor and revealing the stressor’s potential effects on EEG features.
Measuring the spectrum of a period of EEGs, or counting densities of a unique waveform, is a regular method to study the alterations of EEGs [4,5,16,17]. However, EEG has a unique property: EEG amplitude decreases as the frequency increases. The inverse relationship between amplitude and frequency is due to the slower oscillation of EEGs, which involves larger numbers of neurons and generates stronger brain waves [1]. In other words, the distributions between the amplitude and frequency of EEG are non-linear [1]. Moreover, the features of EEGs, e.g., amplitude, frequency, and phase, are, also, non-linear or circular. For instance, the amplitude of EEGs as a function of time can be regard as a sine wave but not a straight line. Therefore, it is important to develop a method to describe these non-linear changes of EEGs, when animals come across a certain stimulation. In the present study, we focus on stress-induced EEG alterations. The Shannon entropy (information theory) can measure the uncertainty, by calculating the probability of a variable appearing [25]. It has the potential to detect non-linear changes of EEGs, since the Shannon entropy is related to probabilities and distributions but is not affected by the distribution of data. If the uncertainty level is high, which means the probability of appearance is even, the entropy would be high. This theory has been modified into several mathematical models in the fields of neuroscience, such as consciousness investigation and reconstruction of input signals (e.g., sensory input) to form action potentials of neurons [1]. Since the Shannon entropy depends on the distributions of occurrent rates for certain measuring variables, it can detect not only linear, but also non-linear, or even circular, changes. The aim of this study is to detect the changes of amplitude, frequency, and phase of EEGs. We prospected to apply the information theory to detecting the alterations of EEG features. Although rodent study has demonstrated that stress increases theta powers during a vigilance state [8], there are still few studies investigating the post-effect of stress on the features of EEGs. In the present study, we calculated the entropies of the amplitudes, frequencies, and oscillation phases of sleep EEGs and compared these entropies between naïve and footshock-stimulated rats. The probabilities of the appearance of amplitude, frequency, and oscillation phases, between the control and footshock-stimulated rats, are quantified by Shannon entropy. The analysis methods and results may provide a distinct way for detecting EEG alterations after exposure to a stressor.

2. Materials and Methods

2.1. Animals

This study included 34 male Sprague-Dawley rats (250–300 g; BioLASCO Co., Ltd., Taipei, Taiwan). These rats were housed individually in their home cages, with a consistent temperature of 23 ± 1 °C. The circadian rhythm was controlled in a 12:12 h light:dark cycle (with 40 watts × 4 tubes illumination). For minimizing interference of the circadian rhythm, all the experimental procedures and daily care were manipulated 30 min prior to the light period. Food and water were available ad libitum. All procedures performed in this study were approved by the National Taiwan University Animal Care and Use Committee.

2.2. Surgery

The subjects were anesthetized with 50 mg/kg ZoletilTM (Tiletamine:Zolazepam = 1:1; Virbac, Carros, France) and surgically implanted with two EEG screw electrodes (Plastics One, Roanoke, VA, USA). The EEG screw electrodes were implanted on the skull, and the tips of screws were placed on the surface of the cortex for recording. The coordinates for EEG electrode implantation are as follows: one electrode is on ML: 2.5 mm and AP: 2.0 mm relative to bregma, and the other one is on ML: −3.0 mm and AP: −11.5 mm relative to bregma. Insulated leads from EEG electrodes were routed to a Teflon pedestal (Plastics One), and, then, cemented to the skull with dental acrylic (Tempron, GC Co., Tokyo, Japan). After surgery, penicillin G (5000 IU; Sigma-Aldrich, St. Louis, MO, USA) was administrated systemically, and the incision was treated topically with polymyxin B sulphate-bacitracin zinc. Ibuprofen was dissolved in drinking water (140 mg/250 mL) for rats to relieve pain. Animals were allowed to recover for seven days before proceeding with the experiments. The antibiotic and analgesic were also dissolved in the drinking water for seven days during the recovery. In order to reduce the influence of sleep by the tether, the tether was plugged into the pedestal four days before the experiment and was only unplugged when performing footshocks.

2.3. Apparatus

Foot electrical stimuli were given by a custom-made footshock stimulation box (40 cm × 22 cm × 29 cm). The box randomly generated electrical stimuli 12 times within 10 min. The intensity of each stimulus current was 0.5 mA, and the stimulation duration was 50 ms. No extra cues or escapable places were provided in the footshock stimulation box.
Signals from the EEG electrodes were amplified at a factor of 5000 and analogue filtered between 0.1 and 40 Hz (frequency response: ±3 dB; filter frequency roll off: 12 dB/octave) by an amplifier (model V75-01; Colbourn Instruments, Lehigh Valley, PA, USA). Gross body movements were detected by infrared-based motion detectors (Biobserve GmbH, Bonn, Germany), and the movement activity was converted to a voltage output that was digitized and integrated into 1-s bins. The EEGs and gross body movements were subjected to analogue-to-digital conversion, with 16-bit precision at a sampling rate of 128 Hz (NI PCI-6033E; National Instruments, Austin, TX, USA).

2.4. Experimental Procedure

After recovery, the animals were randomly divided into the control (n = 18) and footshock (n = 16) groups. Rats in the footshock group received footshocks 12 times within 10 min, as described in Section 2.3. Upon completion of the footshock stimulation, each rat was moved back to its recording cage, and the tether was plugged into the pedestal again. We executed the footshock protocol during the last 10 min of the dark period; thus, the sleep EEGs were acquired from the subsequent resting (light) period. The rats in the control group stayed in their recording cages, while their sleep EEGs were recorded during the light period. The digitized EEG waveforms and integrated values of body movement were stored as binary files, pending for subsequent analyses.

2.5. Data Analysis

2.5.1. Analysis of the Vigilance States

The distinct vigilance states were categorized by visually scoring 12 s epochs of EEGs using custom software (ICELUS, M. R. Opp) written in LabView (National Instruments, Austin, TX, USA). The sleep–wake state was classified as either NREM sleep, REM sleep, or wakefulness, based on previously defined criteria (Chang and Opp, 1998). NREM sleep is characterized by a large amplitude of EEG slow waves, high-power-density values in the delta frequency band, and lack of gross body movements. During REM sleep, the amplitude of EEG is reduced, the predominant EEG power density occurs within the theta frequency, and there are phasic body twitches. During wakefulness, the rats are, generally, active, with protracted body movements. The amplitude of the wakefulness EEG is similar to that observed during REM sleep, but mixed with frequencies that were high than the theta band.

2.5.2. EEG Parameter Investigation

The program for analyzing EEGs in the aspects of spectrograms for the amplitude, frequency, and oscillation phases was designed by using custom-written scripts in MATLAB R2016b (MathWorks, Natick, MA, USA) or combining with open-sourced codes. To match up the epochs of EEG analyses and vigilance states, the raw EEGs were also cut into non-overlapping 12 s epochs and, then, the spectrum and the entropies of the amplitude, frequency and phase were calculated. The analyzed data were subsequently classified into NREM sleep, REM sleep, or wakefulness, based on the criteria of the vigilance states (Section 2.5.1). A 12 s resolution is not appropriate for representing 12 h sleep–wake states, given that certain vigilance states, normally, do not occur during certain times (e.g., REM sleep at the very first 12 s epoch). Therefore, we collected 75 epochs of 12 s bins and averaged them to generate the time resolution of 15 min. The analyzed data were excluded, if no certain vigilance state was found. The methods for measuring the spectrum, Shannon entropy, instantaneous amplitude, instantaneous frequency, and instantaneous phase were specified as follows.

Spectrum

The spectrogram was computed using the multitaper method from the open-source MATLAB toolbox Chronux (version 2.10) [26]. The time–bandwidth product parameter was set at 3, and the number of tapers was set at 5. The power for each frequency was subsequently z-scored, to minimize the difference of absolute power between different subjects.

Instantaneous Amplitude, Frequency, and Phase

Before analyzing the entropies of amplitude, frequency, and phase, the instantaneous amplitude, frequency, and phase of every sampling point were calculated first. To be specific, the raw EEGs were converted by Hilbert transformation. This transformation gave complex numbers for every sampling point. The instantaneous amplitudes were obtained by calculating the absolute values of the complex numbers [27]. Similarly, the instantaneous phases were obtained by calculating the angles of the complex numbers. For the instantaneous frequencies, the raw EEG data were filtered between 0.5 to 30 Hz from a Hamming window and, then, converted by Hilbert transformation. Subsequently, the differences in the phases between sampling points were then computed, by measuring the angles of complex numbers. By determining the differences of the phases within the delta time (in our setup, the sampling rate was 128 Hz), the instantaneous frequencies can be acquired [11]. For instance, a difference of pi/128 gives an instance frequency of 2 Hz.

Shannon Entropy

The Shannon entropy was used to compare the differences of EEG waveforms after being exposed to the footshock. The Shannon entropy equation is as follows [25].
H ( X ) = i = 1 n P ( x i )   l o g 2 P ( x i )
The entropy H(X) is the summation of P(xi)*log2P(xi), and the P(xi) is the probability of occurrence of event x under i circumstance. In our study, we applied the equation to measuring the entropies of amplitude, frequency, and phase. We, firstly, sorted the variables (i.e., amplitude, frequency, or phase) into n levels (nAmplitude = 15, nFrequency = 25, nPhase = 12). For amplitude entropy, the z-scored amplitudes between −0.4 and 1.4 were sorted into 15 levels, as we noticed most amplitudes were within this range. For frequency entropy, frequencies between 0.5 and 30 Hz (the range of predominant frequencies for sleep and wakefulness) were sorted into 25 levels. For phase entropy, the phases between 0 and 2*pi were sorted into 12 levels. The numbers or levels were related to data distribution and the number of data points, so we used the Freedman–Diaconis rule to determine them [28].
n l e v e l s = max ( x ) min ( x ) 2 Q x n 1 3
Qx is the 25th and the 75th percentiles of the data X, n is the total number of data points, and max(x) and min(x) are the maximum and minimum values of the data X. We, then, calculated the occurrence rate of each level during each 12 s epoch and obtained the values of PAmplitude(xi), PFrequency(xi), and PPhase(xi), and, finally, calculated the entropies of the amplitude, frequency, and phase using the Shannon entropy equation.

2.6. Statistics

A statistically significant difference was indicated by one-way ANOVA, with an alpha level of p < 0.05, using the software SPSS (Version: 10.0.7, IBM, New York, NY, USA).

3. Results

3.1. Alterations of Sleep Duration and Spectrogram after Footshock

The aim of the present study is to investigate sleep EEGs, after exposure to an acute stressor. Electrical footshock stimulation is a common protocol, for creating an animal model to mimic stress-related diseases and the subsequent sleep alterations in humans [3]. Therefore, the sleep EEGs obtained from the control (n = 18) and footshock (n = 16) groups were analyzed and compared. In the footshock group, the rats received 12 footshock stimuli within 10 min before the light period. EEGs were acquired for 12 h, after the rats returned to their home cages. We determined whether the footshock protocol altered the sleep patterns of the subjects. By calculating the duration of the vigilance states (Figure 1), we found that the inescapable and random footshock stimuli only decreased the duration of NREM sleep for the first two hours of the light period (Figure 1A), but the mean duration during the light period did not demonstrate a significant difference between the footshock and control groups (Figure 1B, control vs. footshock: 7.19 ± 0.11 vs. 6.85 ± 0.14 (min), F(1,1393) = 3.48, p = 0.065). However, the durations of REM sleep (Figure 1C,D) and wakefulness (Figure 1E,F) were significantly altered; the mean duration during the light period was reduced in REM sleep (Figure 1D, control vs. footshock: 3.03 ± 0.08 vs. 2.54 ± 0.09 (min), F(1,1393) = 16.60, p < 0.01) and was enhanced in wakefulness (Figure 1F, control vs. footshock: 4.74 ± 0.15 vs. 5.58 ± 0.19 (min), F(1,1393) = 12.33, p < 0.01). The results indicated that the present footshock protocol affected the subsequent sleep behavior in the rats. We then analyzed the spectrum of EEG between different sleep–wake states.
Figure 2A,B represented the EEG spectrograms of NREM sleep for the control and footshock group, respectively. Figure 2A,B revealed, approximately, 5 h of strong delta EEG powers at the beginning of light period, which gradually decreased. This phenomenon demonstrated that both the control and footshock groups entered deeper sleep stages because the delta power of EEGs during NREM sleep reflects the depth of sleep [18,19]. We, further, determined the statistical differences between Figure 2A,B. The footshock significantly decreased the power of slow waves (1–3 Hz) during the first 2 h (the black-dashed-line area of Figure 2C). Although the averaged power of frequencies from 1 to 6 Hz during the first 5 h of light period were stronger in the footshock group, they still did not reach statistical significance (the red-dashed-line area of Figure 2C). Interestingly, the significances were mainly in frequencies between 6 and 12 Hz (the green-dashed-line area of Figure 2C), which are, predominantly, theta frequencies during paradoxical sleep in rats [13]. Theta rhythms mainly occur during REM sleep; thus, we, next, determined the spectrogram during REM sleep (Figure 2D,E). Similar to the spectrogram of NREM sleep, the footshock significantly enhanced the power of the theta band near the second hour of light period (the black-dashed-line area of Figure 2F). We were, also, interested in the EEG features during their wakefulness, since Figure 1E showed the increases of wakefulness, especially during the first 2 h. The spectrograms (Figure 2G,H) and panel of significance test (Figure 2I) depicted an enhancement of high frequencies (25–30 Hz) during the first 2 h after the footshock stimuli (the black-dashed-line area of Figure 2I). From the result of the spectrogram analysis, we postulated that the distinct EEG profiles would be clearer if we measured entropies of the EEG features because we noticed the consistent alterations of EEGs between the control and footshock groups. For instance, the control group had a wider theta band than those in the footshock group (Figure 2D vs. Figure 2E, the arrow area demonstrated the power intensity). Since entropy is only related to the probabilities and distributions of the data, it can detect both linear and non-linear changes. Moreover, entropy is insensitive to the effect of the power law (i.e., higher frequency shows lower power), so it may reveal some underlying changes of EEGs.

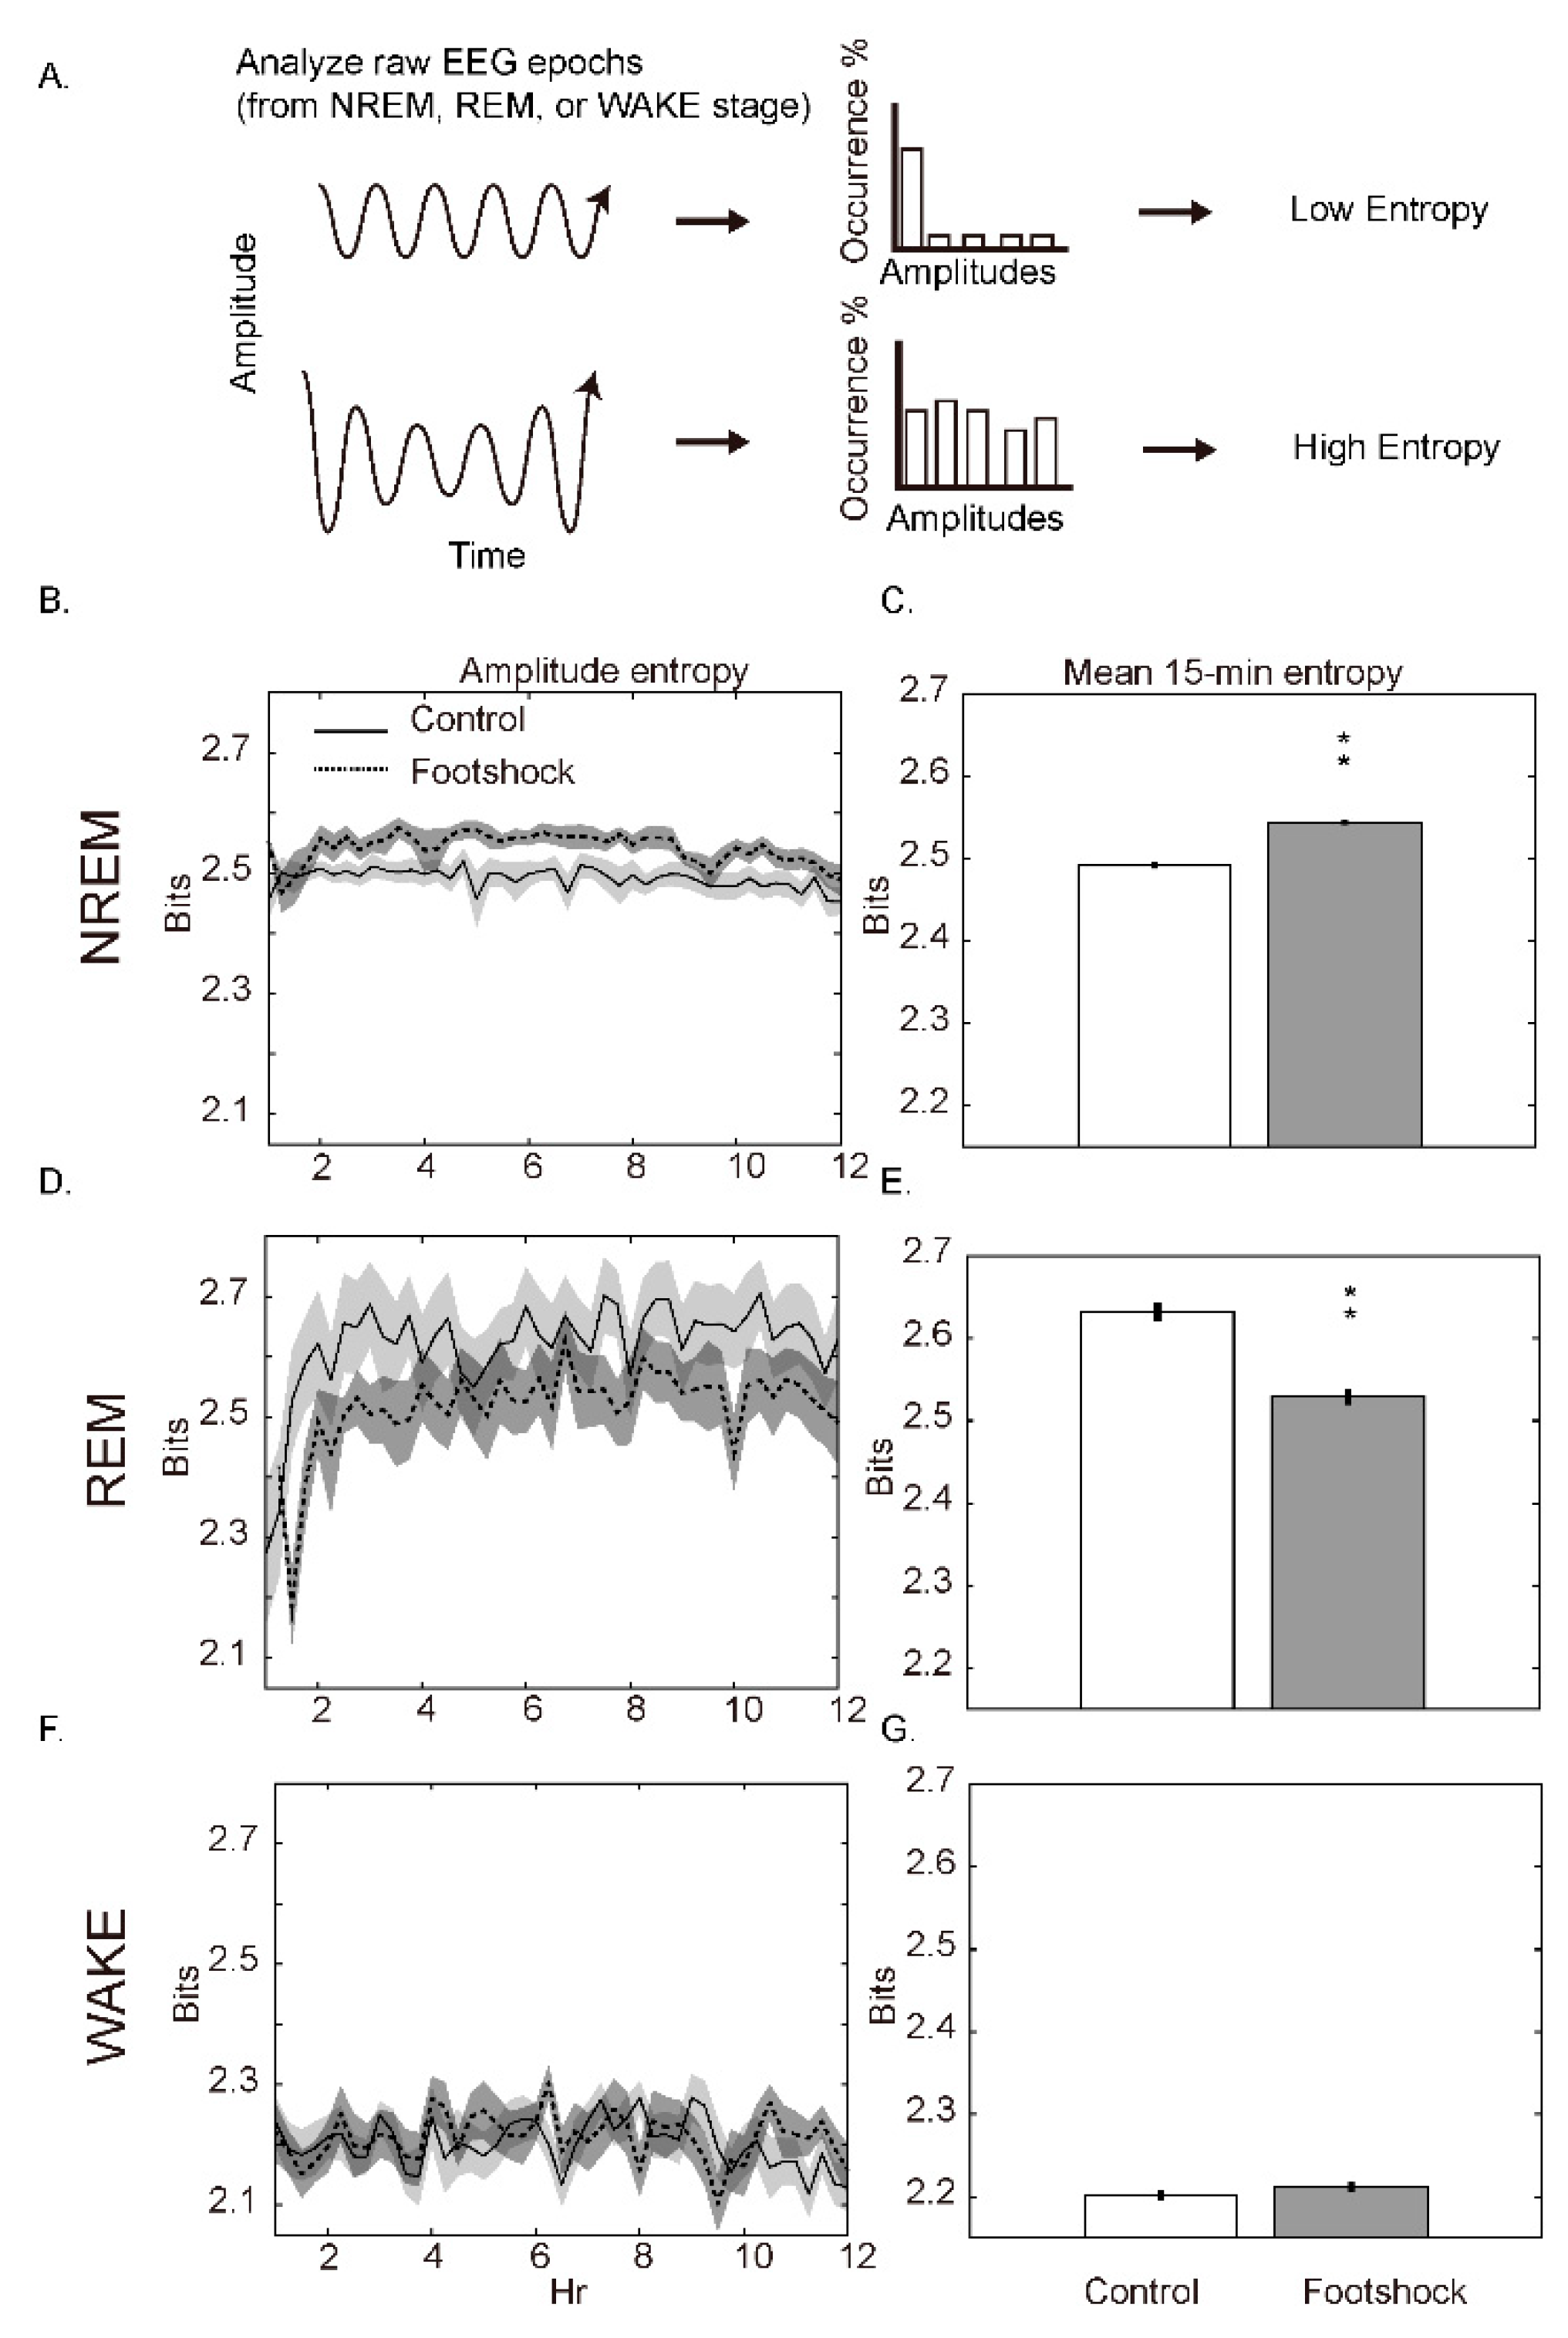
3.2. Amplitude Entropy

We, firstly, investigated the amplitude entropies between the control and the footshock groups (Figure 3). Figure 3A illustrates that a uniform amplitude of the wave results in a low entropy. The distributions of amplitude entropy in NREM sleep (Figure 3B) demonstrated that the footshock group (dashed line) had a higher entropy than the control group (solid line). We further analyzed the 15 min mean amplitude entropy and showed an increase in amplitude entropy after the footshock stimuli (Figure 3C, control vs. footshock: 2.491 ± 0.011 vs. 2.544 ± 0.010, F(1,1394) = 137.60, p < 0.01). In contrast, the footshock stimuli significantly decreased the amplitude entropy during REM sleep (Figure 3D,E, control vs. footshock: 2.63 ± 0.003 vs. 2.529 ± 0.003, F(1,1226) = 47.46, p < 0.01). The amplitude entropy demonstrated no significant change between the control and footshock groups during wakefulness (Figure 3F,G). This result suggests that the footshock stimuli potentiated the variation of EEGs during NREM sleep but attenuated the variation of EEGs in REM sleep.

3.3. Frequency Entropy

We, further, calculated the frequency entropy of EEGs during sleep–wake states (Figure 4). The entropy elevated when the EEG contained various instantaneous frequencies (Figure 4A–G). During NREM sleep (Figure 4B,C), we noticed a rising frequency entropy as a function of time, no matter whether in the control or footshock groups. This finding suggests that the composition of frequencies in NREM sleep gradually became more complex as the resting time (light period) moved toward the active time (dark period). Regarding REM sleep (Figure 4D,E) and wakefulness (Figure 4F,G), the frequency entropies significantly increased after the footshock stimuli (Figure 4E, REM sleep: control vs. footshock: 3.623 ± 0.003 vs. 3.665 ± 0.003, F(1,1199) = 109.71, p < 0.01; Figure 4G, wakefulness: control vs. footshock: 3.667 ± 0.002 vs. 3.688 ± 0.002, F(1,1513) = 66.91, p < 0.01). These results implied that the footshock stimuli increased the complexity of instantaneous frequencies during REM sleep and wakefulness.

3.4. Phase Entropy

The phase entropies between the control and footshock groups were compared in Figure 5. The phase entropy reflects the shape of EEG waveforms; that is, smooth sine-wave-like oscillations result in an even phase distribution and a higher phase entropy (Figure 5A). By analyzing the phase entropy, we noticed that the footshock enhanced the phase entropies during NREM sleep (Figure 5B,C), REM sleep (Figure 5D,E) and wakefulness (Figure 5F,G). The 15-min mean phase entropies were significantly higher after the footshock stimuli (Figure 5C, NREM sleep: control vs. footshock: 3.5791 ± 0.0001 vs. 3.5801 ± 0.00003, F(1,1394) = 86.21, p < 0.01; Figure 5E, REM sleep: control vs. footshock: 3.5793 ± 0.0001 vs. 3.5807 ± 0.00004, F(1,1226) = 169.02, p < 0.01; Figure 5G, wakefulness: control vs. footshock: 3.5795 ± 0.0001 vs. 3.5805 ± 0.00003, F(1,1473) = 77.72, p < 0.01). These results suggest that the waveforms became smoother after receiving the footshock stimuli when compared with those obtained from the control group. In summary, the footshock stimuli profoundly affected the duration, EEG amplitude, frequency and oscillation phase during the distinct vigilance states.

4. Discussion

4.1. Footshock Reduces REM Sleep Duration

The present study demonstrated that an acute stressor not only altered the duration of sleep stages, but also affected the EEG features during the subsequent sleep–wake states. We showed that the random and inescapable footshock stimuli reduced NREM sleep in the first hour and it changed the quantity of distinct vigilance states during a quarter hour; that is, REM sleep was decreased and wakefulness was increased. Further investigating the values, we found that the increased wakefulness mostly contributed to the changes in the composition of sleep–wake states. The wakefulness duration increased 0.84 min and REM sleep duration decreased approximately 0.5 min in a unit of 15 min. This finding is similar to other report which used the footshock to create a rodent model of stress-induced sleep disorder [29]. We postulated that our protocol employing the footshock stimuli partially simulates the stress-induced sleep problems in humans, such as acute stress disorder (ASD) or post-traumatic stress disorder (PTSD). Hyper-arousal is one of the main symptoms of ASD and PTSD [14]. Although most of the clinical studies report a reduction in NREM sleep in patients with PTSD, the alterations in REM sleep are still inconclusive [30]. A meta-analysis report states that the percentage of REM sleep decreases in PTSD patients with age below 30-year-old and affects less in patients older than 30 [30]. Even though the inescapable footshock is not specific as the PTSD model in rodents [3], our data suggest the hypothesis of decreased REM sleep in PTSD patients.

4.2. The EEG Spectrum after Footshock

Spectrum is a common way for analyzing the power as a function of frequency. The spectrum between the control and footshock group did not show extensive changes. If we focus on the x-axis (time), the spectrum demonstrates the alterations mostly occurred during the first 2 h of the light period; the power of delta band (0.5–4 Hz) was attenuated in NREM sleep, theta power (4–12 Hz) during REM sleep was increased, and gamma power (25–30 Hz) in wakefulness was also increased. If we focus on the y-axis (frequency) of each stage, the footshock enhanced theta power in NREM sleep, although delta power is the predominant frequency during NREM sleep. Since the type-1 (6–12 Hz) and type-2 (4–9 Hz) [10,31] theta bands contain an overlap frequency (6–9 Hz) in rats, we can hardly differentiate which type(s) of theta band(s) was (were) mainly affected without pharmacological approaches. However, we noticed the enhanced theta was very likely the type-1 since it contained 9 to 12 Hz frequencies as we demonstrated in Figure 2C. Regarding to REM sleep, Figure 2F demonstrated the increases of type-1 and type-2 theta rhythms, and they mainly occurred during the first 2 h of sleep. Studies depicts that type-1 theta rhythm was correlated to movement and exploration [32] and type-2 theta oscillation was observed during a predator presence [10,31]. Regarding to the wakefulness, slow gamma (25–30 Hz) power was increased after footshock. Slow gamma is known to be generated when rats are retrieving memories [33]. Taken the presence of theta and gamma oscillations together, we proposed that the aversive memories from footshock cause sleep disturbances during the subsequent light period. This phenomenon may link to the occurrence of nightmare in ASD and PTSD patients [14]. However, this hypothesis needs to be further investigated in the future.

4.3. Amplitude Entropy

Using Fourier transform to measure the EEG features is a standard method for analyzing polysomnography findings during sleep. Fourier transform is temporally dependent. In Figure 2 we observed a linear correlation with the time variable by using Fourier transform. For instance, the EEG power of NREM sleep gradually attenuated as the function of time. We further noticed some nonlinear correlations. For example, the power for frequencies of each temporal bin (15 min) is not linear and the width of theta frequency during REM sleep was narrower in the footshock group than that in the control group. Therefore, using the Shannon entropy can compromise this limitation. We thoroughly measured the entropies of instantaneous amplitudes, frequencies, and phases to depict the EEG profiles after the footshock stimuli. The footshock stimuli increased the amplitude entropy of NREM sleep, but decreased the amplitude entropy of REM sleep, which suggests that the footshock affected the uniformity of amplitude. During NREM sleep, the amplitudes of EEGs were changed more frequently after the footshock because their amplitude entropy increased. These results can be interpreted by two possible explanations. One possibility is the poor sleep quality affected by the footshock stimuli, given that the amplitude of EEGs during NREM sleep corresponds to sleep quality. The various amplitudes may reflect that the rats entered various NREM sleep stages after the footshock stimuli, although it is difficult to further differentiate the sleep stages of NREM sleep in rodents compared to humans. The other possible explanation is that there may be certain sleep compensation for the first hour of sleep deficit after the footshock. This sleep compensation might result in greater amplitudes, indicating the sleep quality, rather than the regular baseline and the greater amplitudes, contributed to the lower uniformity of the amplitude. In contrast, the footshock stimuli caused a low entropy of amplitudes during REM sleep, which may result from the weak power spectrum and the smaller amplitudes of REM EEGs, as indicated in Figure 2D,E. We believe the spectrogram of REM sleep in Figure 2D,E reflects this finding; that is, the power of theta waves between 6 to 8 Hz decreased after the footshock stimuli, although it did not reach significant meaning. Some human [34] and rodent studies [4], also, report that PTSD patients or susceptible animals have a reduction in theta powers during REM sleep. Weak amplitudes contributed to lower amplitude entropies because the difference of amplitudes at different levels is low and would be sorted into the same level, which would, subsequently, exhibit a low entropy.

4.4. Frequency Entropy

Although the classification of brain oscillations was defined by certain ranges of frequency, the dominant frequencies were not always the same in the animals’ behaviors. For instance, the frequencies of the theta band are positively correlated with the running speed of rats [11,22,23,24]. This finding implies that the behavior not only affects the power of brain waves, but also affects the frequencies when a brain is processing the information. It, also, means that frequencies can be a measurable variable. EEGs are mixed with more than one frequency band and are dominated by one frequency band for a particular behavior or event. For instance, gamma oscillations could nest in the theta waves [35], and theta waves are predominant during REM sleep in rodents [1,2]. High entropy of instantaneous frequency reflects the oscillations of various frequency bands. We still do not know the physiological relevance of high entropy frequency, but we hypothesized that a complex composition of frequencies corresponds to an un-resting and busy brain. Evidence in Figure 4 supports our hypothesis. The first, the tendency of entropy matched spectral power of NREM sleep, represents the depth of sleep [18,19]. We found that the deeper the sleep, the lower the frequency entropy, especially during the first few hours of the light period. In humans, the deeper stage of sleep, called slow wave sleep, shows a uniform and synchronized slow frequency [2,18,19]. The second, the frequency entropies, were highest in wakefulness and lowest in NREM sleep, which suggested that frequency entropy is positively correlated with the level of vigilance states. Therefore, based on the aforementioned hypothesis, we demonstrated that the footshock stimuli reduced REM sleep intensity because the frequency entropy of REM sleep was higher after the footshock. Moreover, the brain activities during wakefulness were also increased after the footshock because higher frequency entropy was observed. We postulated that the footshock-induced changes in frequency entropy mimic the symptom of hyperarousal in ASD or PTSD patients.

4.5. Phase Entropy

We, next, analyzed the phase features of EEGs. An evenly distributed phase generates a sine-wave-like waveform and results in a high-phase entropy. Our data demonstrated that the footshock increased phase entropy in NREM sleep, REM sleep, and wakefulness, which suggests a smoother and uniform EEG waveform after the footshock stimuli. The physiological meaning of low/high phase entropy is still unclear. Sleep spindles (found in both rodents and humans) and sawtooth waves (mainly found in humans) are abrupt and edge EEG waveforms during sleep [4,36], which may cause lower phase entropy. Therefore, we hypothesized that an acute stressor may disrupt spindles or sawtooth waves. In rodents, sleep spindles occur during the transition from NREM sleep to REM sleep [4]. Researchers propose that the sleep spindle facilitates memory consolidations and eliminates unnecessary memory [37]. A rodent PTSD model demonstrates that the decrease in sleep spindles occurs when rats are exposed to a single prolonged stress [4]. On the other hand, the sawtooth waves are observed during REM sleep in normal humans, and the density of the sawtooth waves increases after the first sleep cycle [36]. The function of sawtooth waves is also unclear. We hypothesized that a normal waveform of sleep EEGs should contain sharp and edge waves, and the footshock stimuli may decrease this kind of waveform, reflecting the ability of forgetting aversive memory. However, this hypothesis needs to be further confirmed in the future.

5. Conclusions

The alterations of EEGs after exposure to the footshock stimuli can be determined by the Shannon entropy. The entropies suggest that the footshock resulted in a smoother, lower amplitude variation, and more frequent variation of EEG waveforms in REM sleep. The EEGs during NREM sleep were smoother, and the amplitude variation was higher, after the footshock stimuli. The Shannon entropy (information theory) could be applied to detect the alterations of sleep EEGs in stress-related disorders such as ASD and PTSD.

Author Contributions

The manuscript was written by Y.L., Y.-T.H. and F.-C.C. Data were analyzed and collected by Y.L. and Y.-T.H. The experiments were designed by Y.-T.H. and F.-C.C. All authors have read and agreed to the published version of the manuscript.

Funding

This work was supported by the Ministry of Science and Technology, Taiwan (108-2320-B-002-074, 109-2320-B-002-023-MY2) and National Taiwan University (111L892302).

Institutional Review Board Statement

The animal study protocol was approved by the National Taiwan University Animal Care and Use Committee, ID: B201800191, June 2018.

Informed Consent Statement

Not applicable.

Data Availability Statement

Data are available based upon request, by contacting the corresponding author.

Acknowledgments

The authors thank the Ministry of Science and Technology (108-2320-B-002-074, 109-2320-B-002-023-MY2) and National Taiwan University (111L892301 and 111L892302) for their support.

Conflicts of Interest

The authors declare no conflict of interests.

Abbreviations

ASDAcute stress disorder
EEGElectroencephalography
NREMNon-rapid-eye movement
PTSDPost-traumatic stress disorder
REMRapid-eye movement

References

  1. Buzsaki, G. Rhythms of the Brain; Oxford University Press: Oxford, UK; New York, NY, USA, 2006. [Google Scholar]
  2. Jouvet, M. Neurophysiology of the states of sleep. Physiol. Rev. 1967, 47, 117–177. [Google Scholar] [CrossRef] [PubMed]
  3. Vanderheyden, W.M.; Poe, G.R.; Liberzon, I. Trauma exposure and sleep: Using a rodent model to understand sleep function in PTSD. Exp. Brain Res. 2014, 232, 1575–1584. [Google Scholar] [CrossRef] [PubMed]
  4. Vanderheyden, W.M.; George, S.A.; Urpa, L.; Kehoe, M.; Liberzon, I.; Poe, G.R. Sleep alterations following exposure to stress predict fear-associated memory impairments in a rodent model of PTSD. Exp. Brain Res. 2015, 233, 2335–2346. [Google Scholar] [CrossRef] [PubMed] [Green Version]
  5. Kim, E.J.; Dimsdale, J.E. The effect of psychosocial stress on sleep: A review of polysomnographic evidence. Behav. Sleep Med. 2007, 5, 256–278. [Google Scholar] [CrossRef] [PubMed] [Green Version]
  6. Thibodeau, R.; Jorgensen, R.S.; Kim, S. Depression, anxiety, and resting frontal EEG asymmetry: A meta-analytic review. J. Abnorm. Psychol. 2006, 115, 715–729. [Google Scholar] [CrossRef] [Green Version]
  7. Vanderwolf, C.H. Hippocampal electrical activity and voluntary movement in the rat. Electroencephalogr. Clin. Neurophysiol. 1969, 26, 407–418. [Google Scholar] [CrossRef]
  8. Hsiao, Y.T.; Yi, P.L.; Cheng, C.H.; Chang, F.C. Disruption of footshock-induced theta rhythms by stimulating median raphe nucleus reduces anxiety in rats. Behav. Brain Res. 2013, 247, 193–200. [Google Scholar] [CrossRef]
  9. Seidenbecher, T.; Laxmi, T.R.; Stork, O.; Pape, H.C. Amygdalar and hippocampal theta rhythm synchronization during fear memory retrieval. Science 2003, 301, 846–850. [Google Scholar] [CrossRef] [Green Version]
  10. Lever, C.; Kaplan, R.; Burgess, N. The Function of Oscillations in the Hippocampal Formation. In Space, Time and Memory in the Hippocampal Formation; Derdikman, D., Knierim, J.J., Eds.; Springer Vienna: Vienna, Austria, 2014; pp. 303–350. [Google Scholar]
  11. Wells, C.E.; Amos, D.P.; Jeewajee, A.; Douchamps, V.; Rodgers, J.; O’Keefe, J.; Burgess, N.; Lever, C. Novelty and anxiolytic drugs dissociate two components of hippocampal theta in behaving rats. J. Neurosci. 2013, 33, 8650–8667. [Google Scholar] [CrossRef] [Green Version]
  12. Winson, J. Loss of hippocampal theta rhythm results in spatial memory deficit in the rat. Science 1978, 201, 160–163. [Google Scholar] [CrossRef]
  13. Corsi-Cabrera, M.; Perez-Garci, E.; Del Rio-Portilla, Y.; Ugalde, E.; Guevara, M.A. EEG bands during wakefulness, slow-wave, and paradoxical sleep as a result of principal component analysis in the rat. Sleep 2001, 24, 374–380. [Google Scholar] [CrossRef] [PubMed] [Green Version]
  14. American Psychiatric Association. DSM-V: Diagnostic and Statistical Manual of Mental Disorders: DSM-5; American Psychiatric Association: Washington, DC, USA, 2013. [Google Scholar]
  15. Bastien, C.H.; Vallieres, A.; Morin, C.M. Precipitating factors of insomnia. Behav. Sleep Med. 2004, 2, 50–62. [Google Scholar] [CrossRef] [PubMed]
  16. Benca, R.M.; Obermeyer, W.H.; Larson, C.L.; Yun, B.; Dolski, I.; Kleist, K.D.; Weber, S.M.; Davidson, R.J. EEG alpha power and alpha power asymmetry in sleep and wakefulness. Psychophysiology 1999, 36, 430–436. [Google Scholar] [CrossRef] [PubMed]
  17. Anderson, C.; Horne, J.A. Prefrontal cortex: Links between low frequency delta EEG in sleep and neuropsychological performance in healthy, older people. Psychophysiology 2003, 40, 349–357. [Google Scholar] [CrossRef]
  18. Franken, P.; Dijk, D.J.; Tobler, I.; Borbely, A.A. Sleep deprivation in rats: Effects on EEG power spectra, vigilance states, and cortical temperature. Am. J. Physiol. 1991, 261, R198–R208. [Google Scholar] [CrossRef]
  19. Borbely, A.A. A two process model of sleep regulation. Hum. Neurobiol. 1982, 1, 195–204. [Google Scholar]
  20. Tort, A.B.; Kramer, M.A.; Thorn, C.; Gibson, D.J.; Kubota, Y.; Graybiel, A.M.; Kopell, N.J. Dynamic cross-frequency couplings of local field potential oscillations in rat striatum and hippocampus during performance of a T-maze task. Proc. Natl. Acad. Sci. USA 2008, 105, 20517–20522. [Google Scholar] [CrossRef] [Green Version]
  21. Tort, A.B.; Komorowski, R.W.; Manns, J.R.; Kopell, N.J.; Eichenbaum, H. Theta-gamma coupling increases during the learning of item-context associations. Proc. Natl. Acad. Sci. USA 2009, 106, 20942–20947. [Google Scholar] [CrossRef] [Green Version]
  22. Hinman, J.R.; Penley, S.C.; Long, L.L.; Escabi, M.A.; Chrobak, J.J. Septotemporal variation in dynamics of theta: Speed and habituation. J. Neurophysiol. 2011, 105, 2675–2686. [Google Scholar] [CrossRef]
  23. Ahmed, O.J.; Mehta, M.R. Running speed alters the frequency of hippocampal gamma oscillations. J. Neurosci. 2012, 32, 7373–7383. [Google Scholar] [CrossRef]
  24. Zheng, C.; Bieri, K.W.; Trettel, S.G.; Colgin, L.L. The relationship between gamma frequency and running speed differs for slow and fast gamma rhythms in freely behaving rats. Hippocampus 2015, 25, 924–938. [Google Scholar] [CrossRef] [PubMed] [Green Version]
  25. Shannon, C.E. A mathematical theory of communication. Bell Syst. Tech. J. 1948, 27, 379–423. [Google Scholar] [CrossRef] [Green Version]
  26. Bokil, H.; Andrews, P.; Kulkarni, J.E.; Mehta, S.; Mitra, P.P. Chronux: A platform for analyzing neural signals. J. Neurosci. Meth. 2010, 192, 146–151. [Google Scholar] [CrossRef] [PubMed]
  27. Adhikari, A.; Sigurdsson, T.; Topiwala, M.A.; Gordon, J.A. Cross-correlation of instantaneous amplitudes of field potential oscillations: A straightforward method to estimate the directionality and lag between brain areas. J. Neurosci. Methods 2010, 191, 191–200. [Google Scholar] [CrossRef] [Green Version]
  28. Freedman, D.; Diaconis, P. On the histogram as a density estimator: L2 theory. Z. Wahrscheinlichkeitstheorie Verwandte Geb. 1981, 57, 453–476. [Google Scholar] [CrossRef] [Green Version]
  29. Jha, S.K.; Brennan, F.X.; Pawlyk, A.C.; Ross, R.J.; Morrison, A.R. REM sleep: A sensitive index of fear conditioning in rats. Eur. J. Neurosci. 2005, 21, 1077–1080. [Google Scholar] [CrossRef]
  30. Zhang, Y.; Ren, R.; Sanford, L.D.; Yang, L.; Zhou, J.; Zhang, J.; Wing, Y.K.; Shi, J.; Lu, L.; Tang, X. Sleep in posttraumatic stress disorder: A systematic review and meta-analysis of polysomnographic findings. Sleep Med. Rev. 2019, 48, 101210. [Google Scholar] [CrossRef]
  31. Sainsbury, R.S.; Heynen, A.; Montoya, C.P. Behavioral correlates of hippocampal type 2 theta in the rat. Physiol. Behav. 1987, 39, 513–519. [Google Scholar] [CrossRef]
  32. O’Keefe, J. Hippocampus, theta, and spatial memory. Curr. Opin. Neurobiol. 1993, 3, 917–924. [Google Scholar] [CrossRef]
  33. Bieri, K.W.; Bobbitt, K.N.; Colgin, L.L. Slow and fast gamma rhythms coordinate different spatial coding modes in hippocampal place cells. Neuron 2014, 82, 670–681. [Google Scholar] [CrossRef] [Green Version]
  34. Cowdin, N.; Kobayashi, I.; Mellman, T.A. Theta frequency activity during rapid eye movement (REM) sleep is greater in people with resilience versus PTSD. Exp. Brain Res. 2014, 232, 1479–1485. [Google Scholar] [CrossRef] [PubMed]
  35. Colgin, L.L.; Denninger, T.; Fyhn, M.; Hafting, T.; Bonnevie, T.; Jensen, O.; Moser, M.B.; Moser, E.I. Frequency of gamma oscillations routes flow of information in the hippocampus. Nature 2009, 462, 353–357. [Google Scholar] [CrossRef] [PubMed]
  36. Pearl, P.L.; LaFleur, B.J.; Reigle, S.C.; Rich, A.S.; Freeman, A.A.; McCutchen, C.; Sato, S. Sawtooth wave density analysis during REM sleep in normal volunteers. Sleep Med. 2002, 3, 255–258. [Google Scholar] [CrossRef]
  37. Poe, G.R. Sleep Is for Forgetting. J. Neurosci. 2017, 37, 464–473. [Google Scholar] [CrossRef] [PubMed] [Green Version]
Figure 1. Comparison of the duration between distinct vigilance stages. (A) NREM sleep duration. The solid line and light gray shadow represent the values of means ± SEMs, for every 15 min during the light period in the control group. The dashed line and dark gray shadow are the values acquired from the footshock group. (B) Mean duration of 15 min bins across the total 12 h light period. The white bar is the value of mean ± SEM obtained from the control grou,p and the gray bar represents data acquired from the footshock group. (C,D) Represented the data from REM sleep. (E,F) Demonstrated the result of wakefulness. ** Indicates the difference reaches statistical significance of p < 0.01.
Applsci 12 04812 g001
Figure 2. Alterations of spectrogram and statistical significance testing after the footshock stimuli. (A) Mean spectrogram of NREM sleep obtained from the control group. (B) Mean spectrogram of NREM sleep acquired from the footshock group. (C) Statistical significance testing for the difference between (A,B). The black-dashed-line area marks 1–3 Hz, the red-dashed-line area marks 1–6 Hz, the green-dashed-line area marks 6–12 Hz. (D) Mean spectrogram of REM sleep obtained from the control group. (E) Mean spectrogram of REM sleep observed from the footshock group. The arrows in (D,E) represent a wider predominant frequency band in the control than that obtained from the footshock. (F) Statistical significance testing for the difference between (D,E). The black-dashed-line area marks 4–12 Hz. (G) Mean spectrogram of wakefulness acquired from the control group. (H) Mean spectrogram of wakefulness recorded from the footshock group. (I) Statistical significance testing for the difference between (G,H). The black-dashed-line area marks 25–30 Hz. The p-value applied was p = 0.05; p < 0.05 was marked by the white color.
Applsci 12 04812 g002
Figure 3. Comparison of the amplitude entropy after the footshock stimuli. (A) Uniform amplitudes of EEGs result in a low entropy, whereas the variety of amplitudes causes uncertainty of occurrence rate and results in a high entropy. (B) Distribution of amplitude entropy for NREM sleep. The solid line and light gray shadow are the values of means ± SEMs for every 15 min during the light period, obtained from the control group. The dashed line and dark gray shadow are results acquired from the footshock group. (C) Statistical significant test for the amplitude entropy. The white bar represents the value of mean ± SEM for 15 min bins across the total 12 h light period, obtained from the control group, and the gray bar depicts the amplitude entropy acquired from the footshock group. (D,E) Represented the data of REM sleep. (F,G) Demonstrated the results for the wakefulness. ** Indicates the difference reaches statistical significance of p < 0.01.
Applsci 12 04812 g003
Figure 4. Comparison of the frequency entropy after the footshock stimuli. (A) Uniform frequencies of EEGs result in a low entropy, whereas the variety of frequencies causes an uncertainty of the occurrence rate and results in a high entropy. (B) Distribution of frequency entropy for NREM sleep. The solid line and light gray shadow represent the values of means ± SEMs for every 15 min during the light period, obtained from the control group. The dashed line and dark gray shadow are the results acquired from the footshock group. (C) Statistical significant test for the frequency entropy. The white bar is the value of mean ± SEM for 15 min bins across the total 12 h light period, obtained from the control group, and the gray bar represents the frequency entropy acquired from the footshock group. (D,E) Represented the data for REM sleep. (F,G) Demonstrated the results for wakefulness. ** Indicates the difference reaches statistical significance of p < 0.01.
Applsci 12 04812 g004
Figure 5. Comparison of the phase entropy after the footshock stimuli. (A) Abrupt and edge waveforms result in a low entropy whereas smooth sine-wave-like waveforms cause uncertainty of occurrence rate and results in a high entropy. (B) Distribution of phase entropy obtained from NREM sleep. Solid line and light gray shadow are the values of means ± SEMs for every 15 min of light period obtained from the control group. Dashed line and dark gray shadow are results acquired from the footshock group. (C) Statistical significant test for the phase entropy. White bar is the value of mean ± SEM for 15-min bins across the total of 12-h light period obtained from the control group and gray bar represents the phase entropy acquired from the footshock group. (D,E) represented the data of REM sleep. (F,G) demonstrated the results for wakefulness. ** Indicates the difference reaches statistical significance of p < 0.01.
Applsci 12 04812 g005
Publisher’s Note: MDPI stays neutral with regard to jurisdictional claims in published maps and institutional affiliations.

