Article

Analysis of the Working Performance of a Back-to-Back Geosynthetic-Reinforced Soil Wall

1
State Key Laboratory of Mechanical Behavior and System Safety of Traffic Engineering Structures, Shijiazhuang Tiedao University, Shijiazhuang 050043, China
2
School of Civil Engineering, Shijiazhuang Tiedao University, Shijiazhuang 050043, China
3
School of Urban Geology and Engineering, Hebei GEO University, Shijiazhuang 050043, China
*
Author to whom correspondence should be addressed.
Appl. Sci. 2022, 12(1), 516; https://doi.org/10.3390/app12010516
Submission received: 30 November 2021 / Accepted: 30 December 2021 / Published: 5 January 2022
(This article belongs to the Special Issue Advances in Geosynthetics)

Abstract

:
Back-to-back geosynthetic-reinforced soil walls (BBGRSWs) are commonly used in embankments approaching bridges and narrow spaces. However, the available literature and design guidelines for BBGRSWs are limited. The aims of this research were to develop a greater understanding of the working performance of BBGRSWs and to optimize the design method of a BBGRSW to ensure the cost-efficiency as well as the stability of the structure. On the basis of a monitored BBGRSW structure located in China, we established a numerical model. The parameters of the materials used in the actual project were determined through triaxial and tensile tests. The numerical results were compared with the measured results in the field to verify the correctness of the selected parameters. Two parameters were investigated by the FEM method: the reinforcement length and the arrangement. The FEM analysis indicated that post-construction deformations such as displacement and settlement could be reduced by reinforcing the same layer on both sides. Longer reinforcements were needed to achieve the same performance if the reinforcements were cross-arranged. Thus, BBGRSWs can have a superior performance if the reinforcements are connected in the middle from both sides. Even with longer reinforcements, the safety factor of the wall with a cross-arranged reinforcement was smaller than that with same-layered reinforcements.

1. Introduction

Geosynthetic-reinforced soil walls (GRSWs) have been widely used in various engineering fields such as roads and railways. A GRSW is a viable replacement for conventional concrete-retaining structures in infrastructure development and remedial treatments around the world [1,2,3,4,5,6,7]. To evaluate the stability and durability of GRSWs, researchers have conducted several experimental studies on the working performance of GRSWs under different conditions. The results suggest that the post-construction deformation of a well-designed wall (less than 13 m in height) will generally be less than 25 to 30 mm during the first year of service and less than 35 mm during the design life of the wall [8,9]. However, this statement depends on several factors and cannot be generalized. In recent decades, various studies have analyzed the deformation and stress characteristics of GRSWs using different reinforcement lengths and vertical spacing, as well as different types of faces and found that the post-construction displacement of a reinforced soil wall is approximately 0.3–1% H [10,11,12]. However, these studies were based on a single GRSW and not a back-to-back geosynthetic-reinforced soil wall. Therefore, the actual post-construction performance of back-to-back geosynthetic-reinforced soil wall is still unclear.
The concept of back-to-back geosynthetic-reinforced soil walls (BBGRSWs) has been addressed in design manuals [13] and has been divided into two types: (I) the width of the ramp or embankment allowing for the construction of two separate walls with sufficient spacing in between to allow each wall to act independently, and (II) an overlap in the reinforcement resulting in an interaction between the two walls. Many numerical studies have been conducted to analyze back-to-back mechanically stabilized earth walls (BBMSEWs) or BBGRSWs. The results indicate that the distance between the two back-to-back walls is the key to achieving the maximum tensile strength of the reinforcement in addition to the filling material properties that affect the distribution of tension in the reinforcement and lateral pressure of BBMSEWs [14,15,16,17,18,19].
In case II, suggested by Berg et al. [13], the interaction mechanism between the two walls is still unclear. The width (W) of the BBGRSW could be smaller (i.e., W/H < 1.4), and, in that case, there was insufficient space for the minimum reinforcement length (i.e., 0.7 H on each side, 1.4 H in total) in the same layer.
According to Han and Leshchinsky [14], the distance between the reinforcement of each side is the key to the performance of the BBGRSW; this study focused on the lateral pressure behind the reinforcement and the tension in the reinforcement. Of the parameters affecting the performance of the BBGRSW, only the cohesion of the block facing and the wall width were analyzed. Sravanam [20] also studied the performance of a BBMSEW under different reinforcement stiffnesses. Xu [21] conducted a series of numerical modeling studies on the upper-bound bearing capacity of footing on BBMSEWs using the finite element limit analysis (FELA) method and suggested that a full-length top reinforcement layer is the most effective method to improve the bearing capacity of the structure. However, the working performance of BBGRSWs under different reinforcement lengths or arrangements has not been studied. To study the post-construction performance of a BBGRSW and optimize the design, we require a parametric study on the reinforcement length and layout. Therefore, a series of FEM analyses were conducted on the basis of the BBGRSW on-site. The findings provide a reference for the design and construction of GRSWs, which was the main purpose of this study.

2. Experimental Study and Numerical Modeling

2.1. Description of the Wall

Located in the eastern part of Shandong Province, Qing-Yan-Wei-Rong Intercity Railway is a passenger-dedicated railway line that was the first high-speed railway built in that region with a design speed of 250 km/h. The starting point is Qingdao, and it passes through Yantai and Weihai; the destination is Rongcheng. It was completed in August 2014 and was officially put into service on 28 December 2014. This study is based on remote observation tests of the GRSW near Rongcheng Station (shown in Figure 1).
The subgrade is formed by an 8.8 m tall BBGRSW with a 1.7 m thickness of filling soil at the top. This was the first application of this type of structure on a Chinese high-speed railway and represents a bold attempt in the history of Chinese high-speed railway. The back-to-back GRSW is an attempt to study whether this type of structure meets the requirements of a high-speed railway; therefore, the frequency of the live loads applied to it is approximately four to five trains per month, and the dead load of the track is applied to the subgrade.
The left side of the subgrade is a paneled module block. The dimensions of the concrete modular blocks on the left panel are 0.5 m × 0.3 m × 0.3 m with the reinforcement buried among the blocks. The right side face of the subgrade is wrapped with a cast-in-situ concrete panel outside. The concrete is C35, 0.3 m thick, and has the same reinforcement layer arrangement as the left side. The reinforcements are TGDG EG130R HDPE uniaxial plastic geogrids with lengths of 8.0 or 10.5 m and 0.3 or 0.6 m, respectively, as the vertical spacing with the machine direction perpendicular to the wall. As the height of the subgrade is 10.5 m, the minimum length of reinforcement should be 7.35 m; therefore, a reinforcement of 8.0 m was selected. As the maximum width of the subgrade is 16.0 m, several geogrid layers were overlapped and not connected. The foundation below the subgrade is a cement-fly ash-gravel (CFG) pile composite foundation, the column diameter is 0.4 m, square arranged, and the column length is 4.0 m. A 0.5 m thick gravel layer is located upon the composite foundation and on that is the back-to-back GRSW.
On the basis of the Standard for Acceptance of Earthworks in High-speed Railways (TB 10751-2018), the coefficient of compaction K (the ratio of dry density on-site to the maximum dry density of the soil) should be no less than 0.92, which indicates that the filling soil has not been compacted to 100%.
The field tests of the retaining wall during the service period include the base pressure, lateral earth pressure, vertical pressure, lateral displacement, settlement, and geogrid strain. The observation elements include the earth pressure cells, displacement meter, single point settlement meter, and strain gauges. The elements were buried in the wall during the construction progress, and the retaining wall has been continuously monitored using wireless remote monitoring equipment. The details of the instruments are shown in Table 1 and the layout scheme is shown in Figure 2.

2.2. Characterization of the Materials

The filling soil was tested in a laboratory; a direct shear test and a triaxial test were used to determine the cohesion and friction angle. A Standard Proctor was used in the compaction experiment to determine the maximum dry density. The gradation curve of the soil is shown in Figure 3. The moisture content of the filling soil was 5.7%, indicating that the filling soil on-site was unsaturated. On the basis of the laboratory results, we found that the percentage of fine-grained soil (i.e., a particle size smaller than 0.075 mm) was about 3.35%. The physical and mechanical properties of the filling soil are shown in Table 2.
The geogrid was also tested by a tensile experiment and a creep test under a normal load. The long-term stiffness of geogrid was from the creep test in laboratory, and the rheological behavior was taken into consideration in the stiffness of geogrid. The technical specifications are shown in Table 3.

2.3. Numerical Modeling

The numerical modeling was performed using the 2D finite element computer program PLAXIS [22]. Figure 4 shows the geometry of the numerical model adapted from the BBGRSW on-site. A fixed boundary condition in the horizontal direction was applied to the left and right lateral borders. At the bottom of the model, a fixed boundary condition was adopted along the horizontal and vertical directions.
The PLAXIS virtual three-axis simulator was used to test the input parameters of the soil. The result is shown in Figure 5.
The input parameters of the soil and panel properties from the laboratory tests are listed in Table 4 and Table 5, respectively. The reinforcement was performed using high-density polyethylene (HDPE) uniaxial geogrids modeled as a linear elastic material. The total railway load and load of the track board that was applied on the BBGRSW were 54.1 and 17.4 kN·m−2, respectively, as per the Chinese design code for railways.

3. Results and Discussion

3.1. Post-Construction Performance of the BBGRSW

3.1.1. Lateral Deformation of the BBGRSW

The lateral deformation of the wall during the 72 months after completion is shown in Figure 6. During this period, the lateral deformation of the BBGRSW on-site never exceeded 5.0 mm. No sudden deformation appeared, and the deformation remained steady. The post-construction lateral deformation remained stable after 72 months of construction. The measured maximum deformation on-site was 3.94 mm, which is approximately 0.0365% of the wall height and much less than the 4% limitation [13,23] or the deformation results investigated by Allen and Bathurst [8,9,24,25]. As seen in Figure 6, the lateral deformation of the wall under a load of 54.1 kPa was much larger than that under 17.3 kPa, especially at the position near the top, which indicated that the applied load could have a major impact on the post-construction deformation of the BBGRSW.
As shown in Figure 7, the post-construction deformation on the left blocks and right panel along the height indicated that the deformation under the load of 54.1 kPa at the top was approximately 467.8% of that under 17.3 kPa. The deformation distribution of the wall showed that the load on the top of the wall had a significant influence on the deformation of the upper wall and the panel at the top of the wall had an obvious outward inclination that also caused the wall to move outward. The deformations of the left blocks and right panel were reasonable based on the model test attributed to El-Sherbiny and Ehrlich et al. [26,27]. According to the model test results, the deformation pattern was linear for the blocked wall, in which the lateral deformation increased along the height and peaked at the top.
The deformation pattern was also different between both sides. This was because the panel was different; not only was the geogrid buried among the layers of the blocks, but also the modular blocks were connected with rebar from the top to the bottom, which resulted in a much greater stiffness of the blocked panel compared with the wrapped and concrete-faced panel.
The vertical deformation of the wall during the 72 months after completion is shown in Figure 8. During this period, the compressive deformation of the wall exhibited a large increase over the first 9 months, which was approximately 86.7% of the total vertical deformation. It then slowed down to approximately 35.0 mm during the last 12 months of the 5 years after the wall was completed. The post-construction deformation was approximately 0.39% of the wall height, which was approximately 35.19% (i.e., 100 mm) of the allowable settlement in the Chinese Code for the Design of High-Speed Railways (TB 10621-2014) [28]. This indicated that the deformation was suitable for its application in high-speed railway subgrades.

3.1.2. Strain on the Geogrid of the BBGRSW On-Site

The distribution of the strain on the geogrid inside the wall over the period of 70 months after construction is shown in Figure 9. During the period from the completion of the wall to 72 months, the distribution of the strain was nonlinear along the reinforcement with an increase over time.
With the progression of time, the strain appeared to increase. The strain 72 months after construction was completed was approximately 295.2% of the end of the construction value. The geogrid at the panel restricted the deformation of the wall and balanced the lateral pressure on the panel to maintain the stability of the wall.
Avoiding tensile failure has always been one of the most critical aspects of the internal stability design procedure. According to the studies by Allen et al. [8], the strain on geogrids inside walls is usually less than 1%, even after 12 years post-completion; it is considered that the tensile strength for geosynthetics is too conservative. With respect to the TGDG EG130R uniaxial geogrid, the measured maximum strain was approximately 2.58%, only 28.9% of the peak strain. This indicated that the safety redundancy for the reinforcement strength chosen by the designers was sufficient.
The strain in the reinforcement from FEM was approximately 116.5% of that from the field test, as shown in Figure 10, which was in good agreement and shared the same trend along the wall height as the results obtained by Han [14] and Cao et al. [29]. The comparison indicated that the input parameters were reasonable.

3.2. Parametric Study on the Geogrid Length

To study their influence on the geogrid length, we justified the reinforcements in each case to the same length from top to bottom on each side with a same-layer arrangement and a vertical spacing of 0.3 m (Figure 3). All other parameters remained the same as the baseline case.

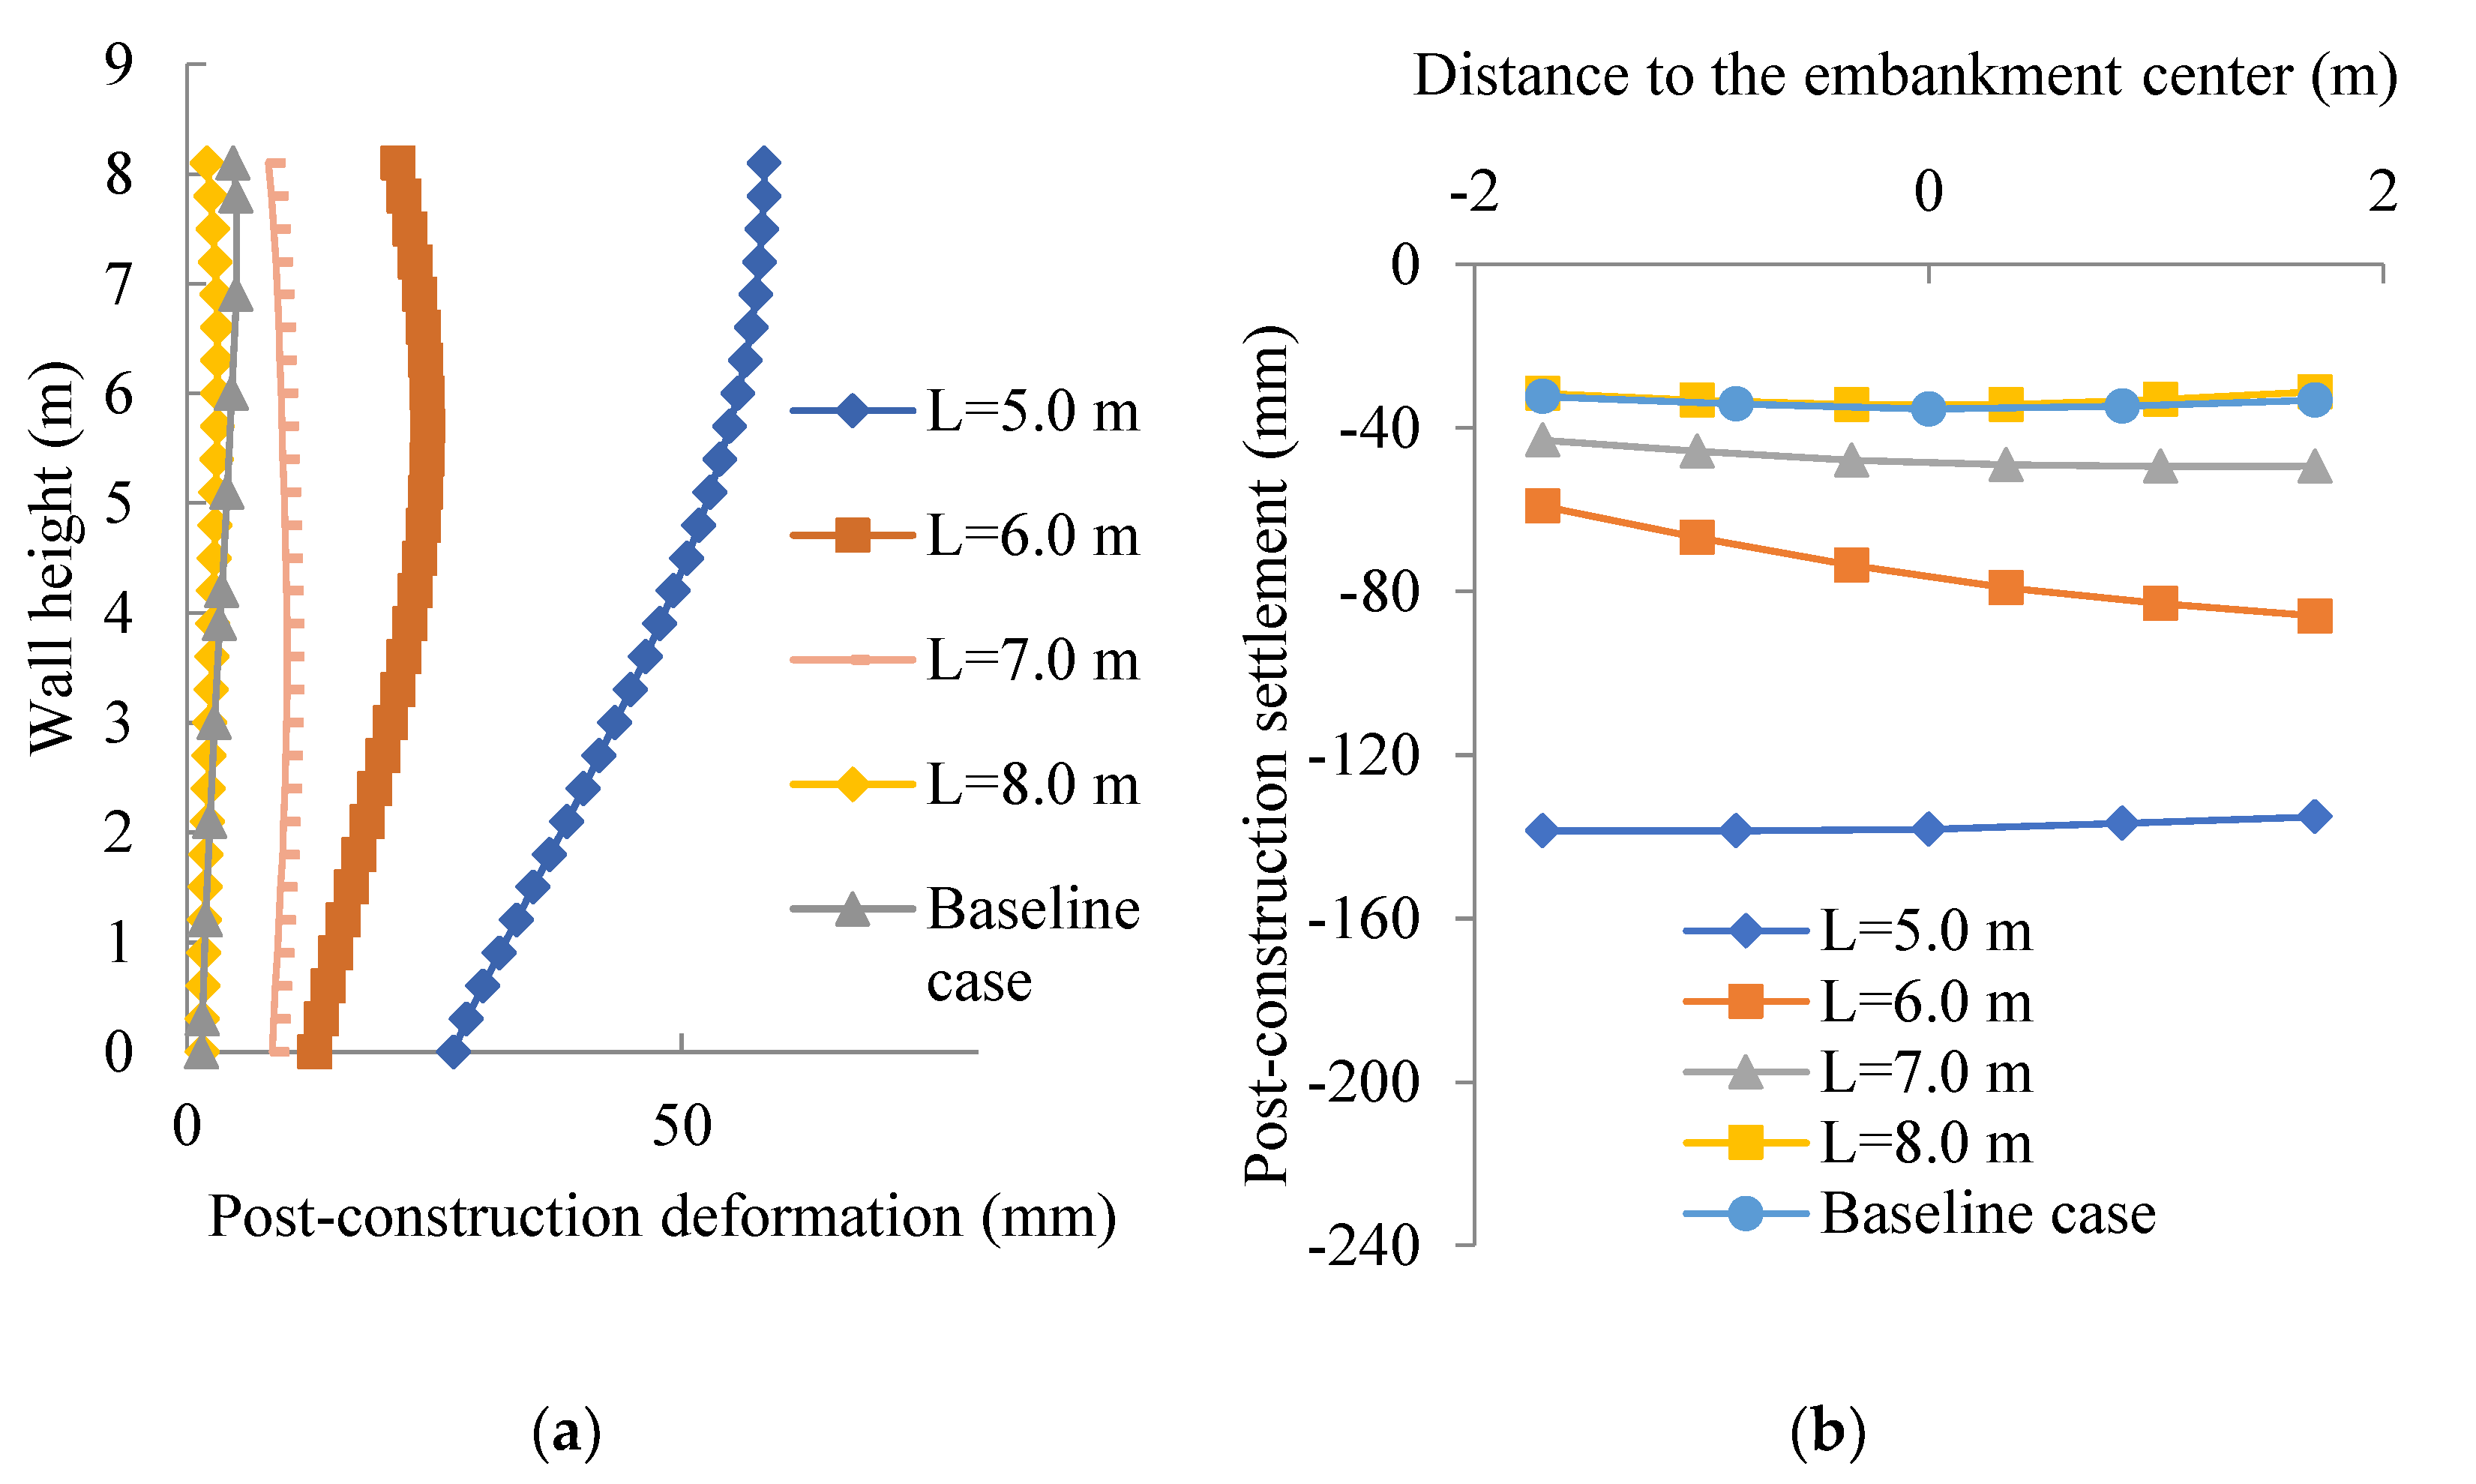
3.2.1. Post-Construction Deformation of the Wall

The FEM results verified the previous research by Leschinsky and Vuloav [30]; the maximum horizontal displacement for the first year with a 5 m long geogrid was 58.06 mm, where L/H = 0.57. It was larger than the lateral deformation limitation of 35.0 mm set by Bathurst and Allen [9]. Hence, the wall could be considered to be performing poorly or potentially unstable. A longer geogrid could lead to a smaller deformation as the maximum deformation for the reinforcement lengths of 6.0, 7.0, and 8.0 m were 24.38, 9.79, and 4.29 mm, respectively, on the left side wall (Figure 11). The maximum deformation of the right side wall decreased from 18.15 to 3.68 mm for the reinforcement length of 6.0 to 8.0 m, respectively. Overall, this indicated that, for reinforcements less than the required 0.7 H, the BBGRSW could perform poorly.
The stipulation from the railway department required more than the stability of the entire structure. The Chinese standard for high-speed railways states that the post-construction settlement must be less than 100 mm such that the railway tracks can remain functional. Therefore, the post-construction settlement on top of the wall required attention. For walls with a 5.0 to 8.0 m long geogrid, the maximum post-construction settlements on the top were 138.12 mm, 73.67 mm, 47.86 mm, and 34.30 mm. The FEM results indicated that the distance between the geogrid influenced the post-construction settlement as the settlement peaked with a reinforcement length of 5.0 m, which was approximately 390.23% of the baseline case settlement. It also verified the judgment based on the lateral deformation that the GRSW could perform poorly for reinforcement lengths less than 0.7 H. In addition, the BBGRSW with the 8.0 m reinforcement was the only case in which the post-construction settlement was 96.9% of the baseline case. This indicated that the reinforcement length was a key factor in the settlement control.

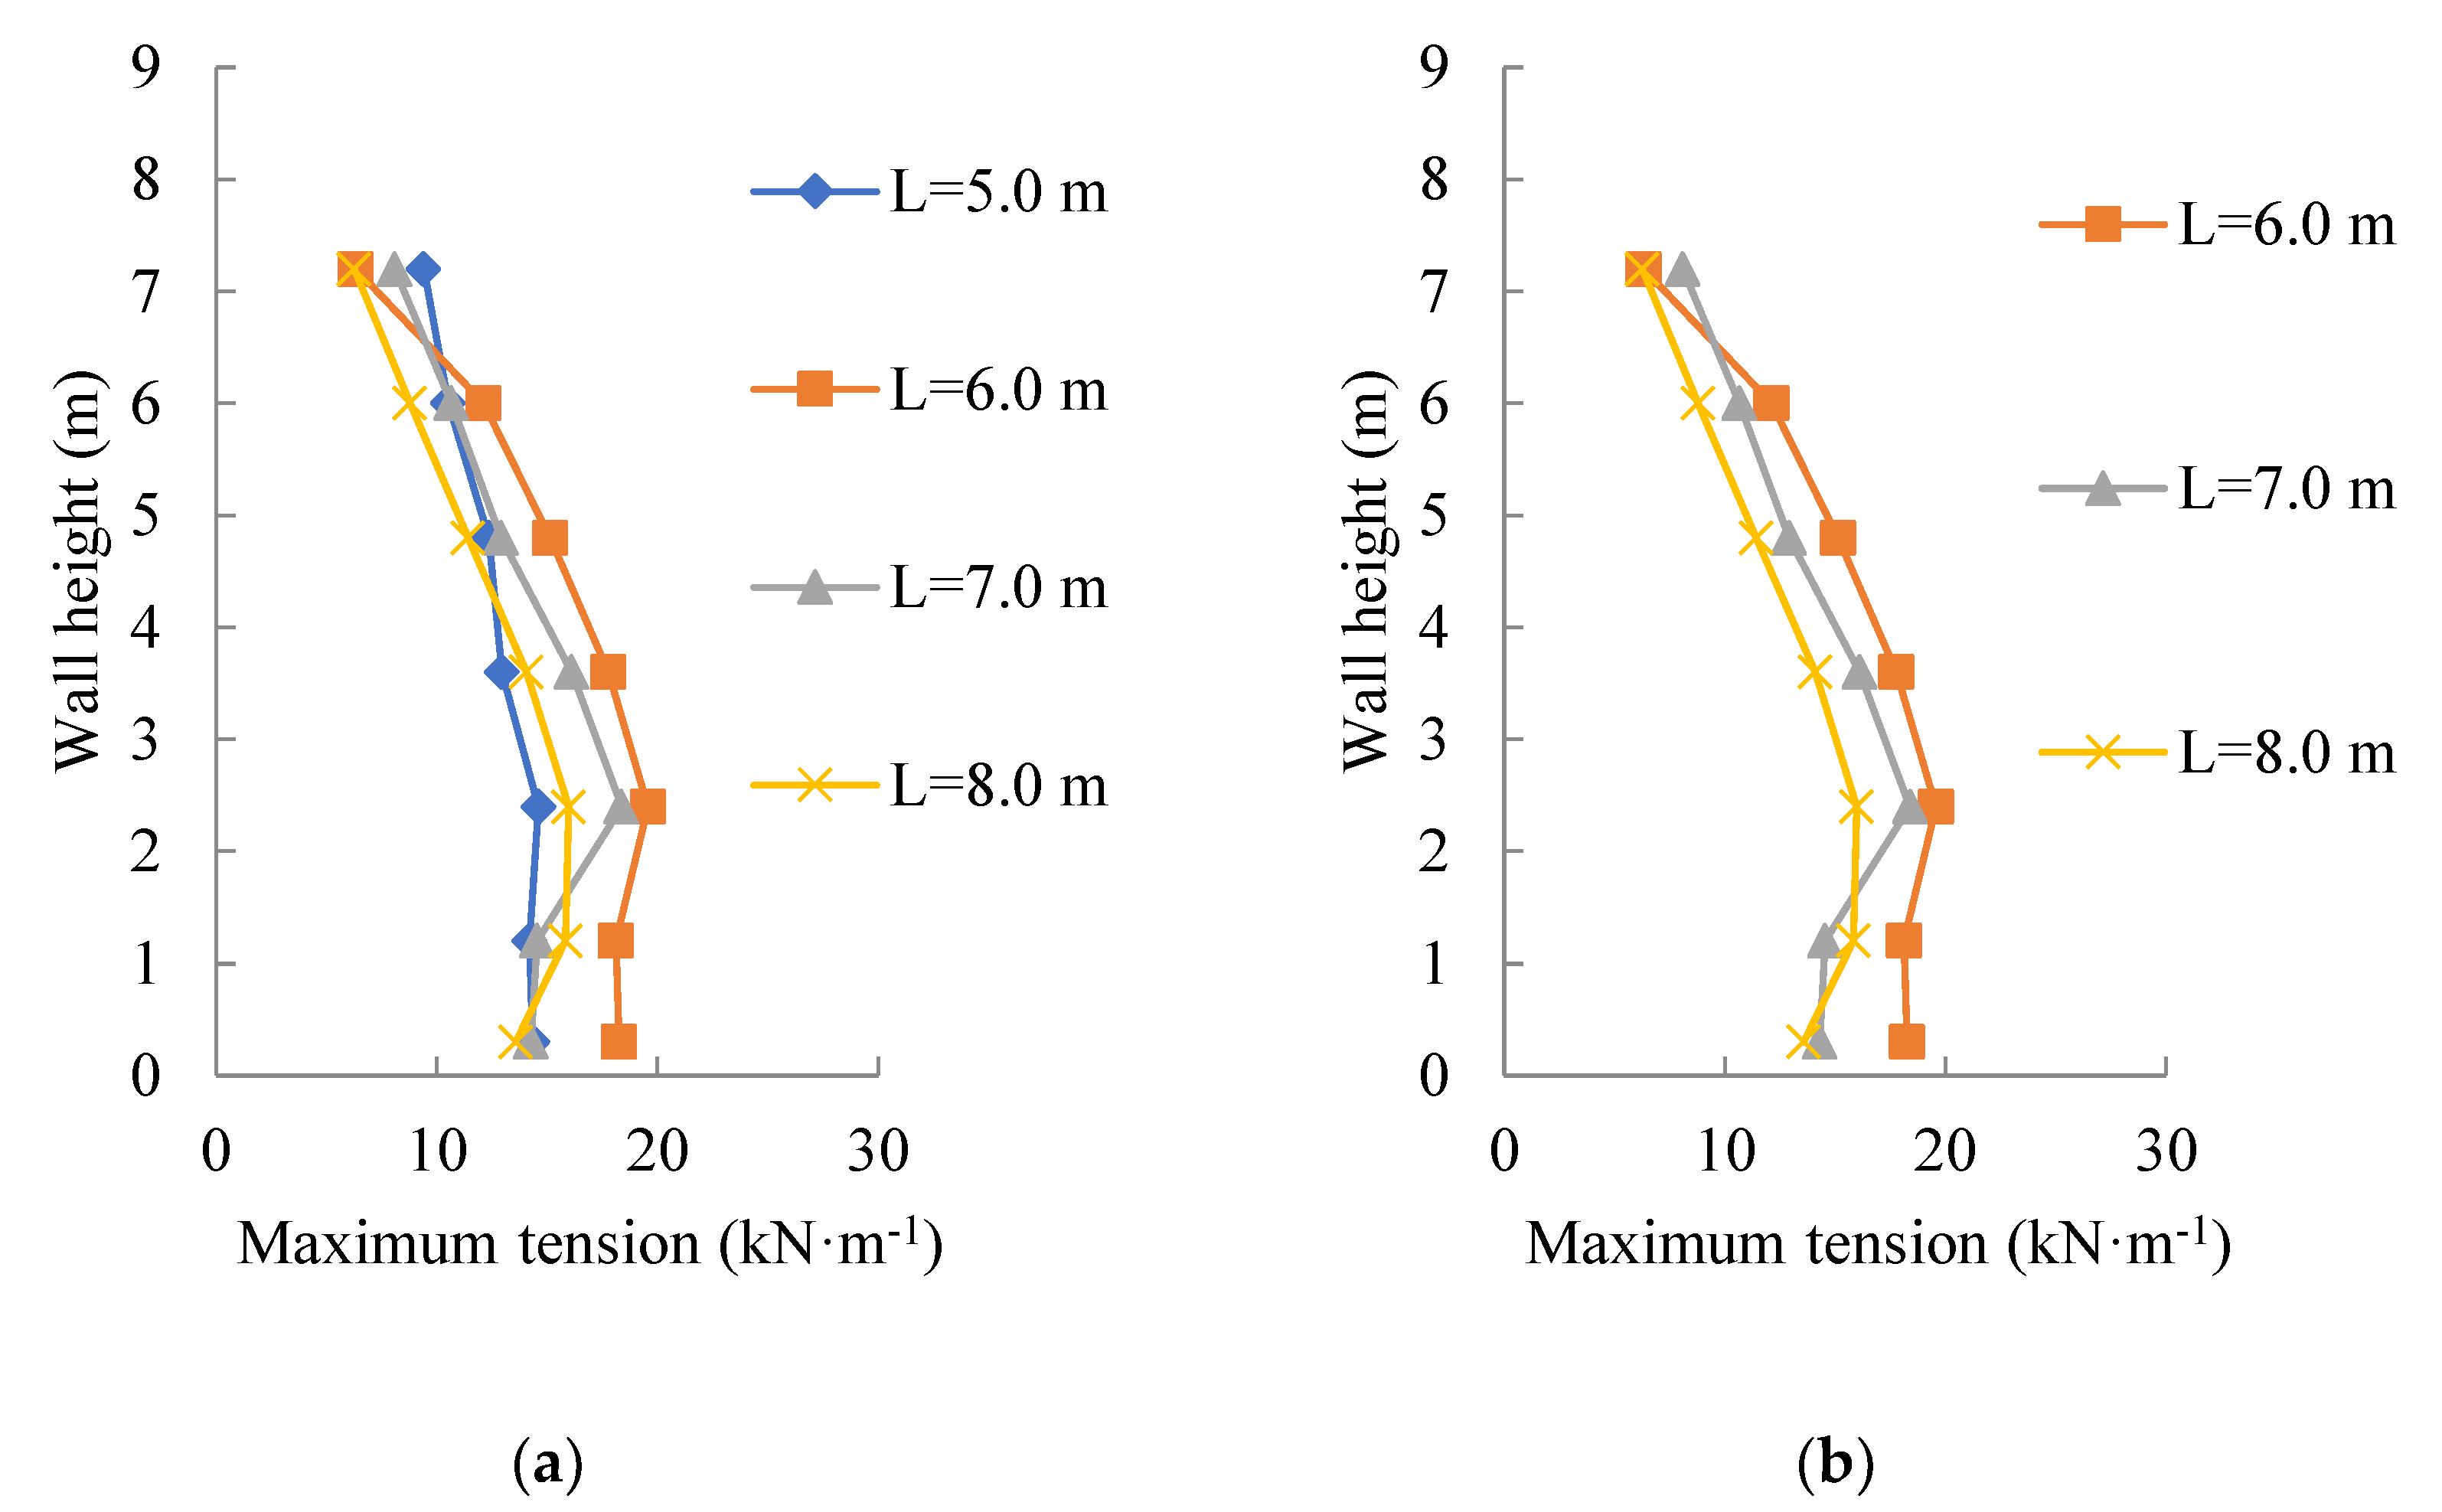
3.2.2. Tension in the Reinforcement

Berg et al. [13] suggested that no lateral earth pressure needs to be considered from the backfill for external stability if the overlap exceeds 0.3 H, which is based on the vertical panel and the same length reinforcement. A varied overlap scenario was not discussed, which is the case for different reinforcement lengths. This was due to the consideration of the two walls acting as one wall with no unreinforced backfill to exert an external destabilizing thrust. As the maximum distance between the left blocks and right panel was 16.0 m at the bottom of the wall, there should have been reinforcement layers in the upper half that were fully covered with the geogrid.
The maximum tension in the reinforcement is shown in Figure 12. A rising trend can be observed with the decrease in reinforcement length from 8.0 to 6.0 m. A peak tension value was observed for the reinforcement length of 6.0 m, indicating that if the required embedded length in the active zone remained the same, the length in the resistance zone would be shorter. Therefore, the reinforcement had to provide additional tension to resist being pulled out and maintain the stability of the entire structure.

3.3. Parametric Study on the Reinforcement Arrangement

According to the baseline case, two types of reinforcement arrangement were applied on-site: 8.0 m of a geogrid with a same-layered reinforcement and 30 cm vertical spacing and a 10.5 m cross-arranged reinforcement with 60 cm spacing. Despite the fact that the application of a cross-arranged reinforcement was due to the lack of spacing, the BBGRSW performed perfectly.
On the basis of the idea of investigating the influence of the reinforcement arrangement on the performance of the GRSW structure, we performed an additional FEM analysis. As the post-construction settlement of the GRSW with a reinforcement length shorter than 7.0 m was larger than the settlement limitation of the Chinese standard for high-speed railways (i.e., 100.0 mm), the analysis focused on the cases using geogrids that were longer than 7.0 m. The vertical spacing was 0.3 m on each side; therefore, the vertical spacing was 0.15 m because of the overlap in the middle of the BBGRSW.

3.3.1. Post-Construction Deformation of the Wall

The FEM analysis results on the lateral deformation revealed that there was a significant reduction between 7.0 and 8.0 m length, as shown in Figure 13. The deformations with the 7.0 and 8.0 m cross-arranged reinforcements were approximately 554.9% and 114.8% of the baseline case, respectively. The deformations with the same-layered reinforcement were approximately 379.4% and 96.7% of the deformation from the baseline case, respectively. Hence, the cross-arranged reinforcement performed worse than the same-layered reinforcement, with the former being 146.2% and the latter being 118.7% of the deformation.
It was verified that the key point in controlling post-construction deformation was whether there were any reinforcement layers that were completely covered with geosynthetics. The post-construction settlement was smaller with multiple layers of fully covered reinforcements (e.g., L = 8.0 m), which was 96.9% of the baseline case. An additional length was needed for the cross-arranged reinforcement to achieve the same performance on the deformation of the wall. For the BBGRSW, the settlement with a cross-arranged 8.0 m long reinforcement was approximately 95.4%, of which 7 m was a same-layered reinforcement. This indicated that the reinforcement length along with the arrangement of the reinforcement was a key parameter for post-construction settlement.

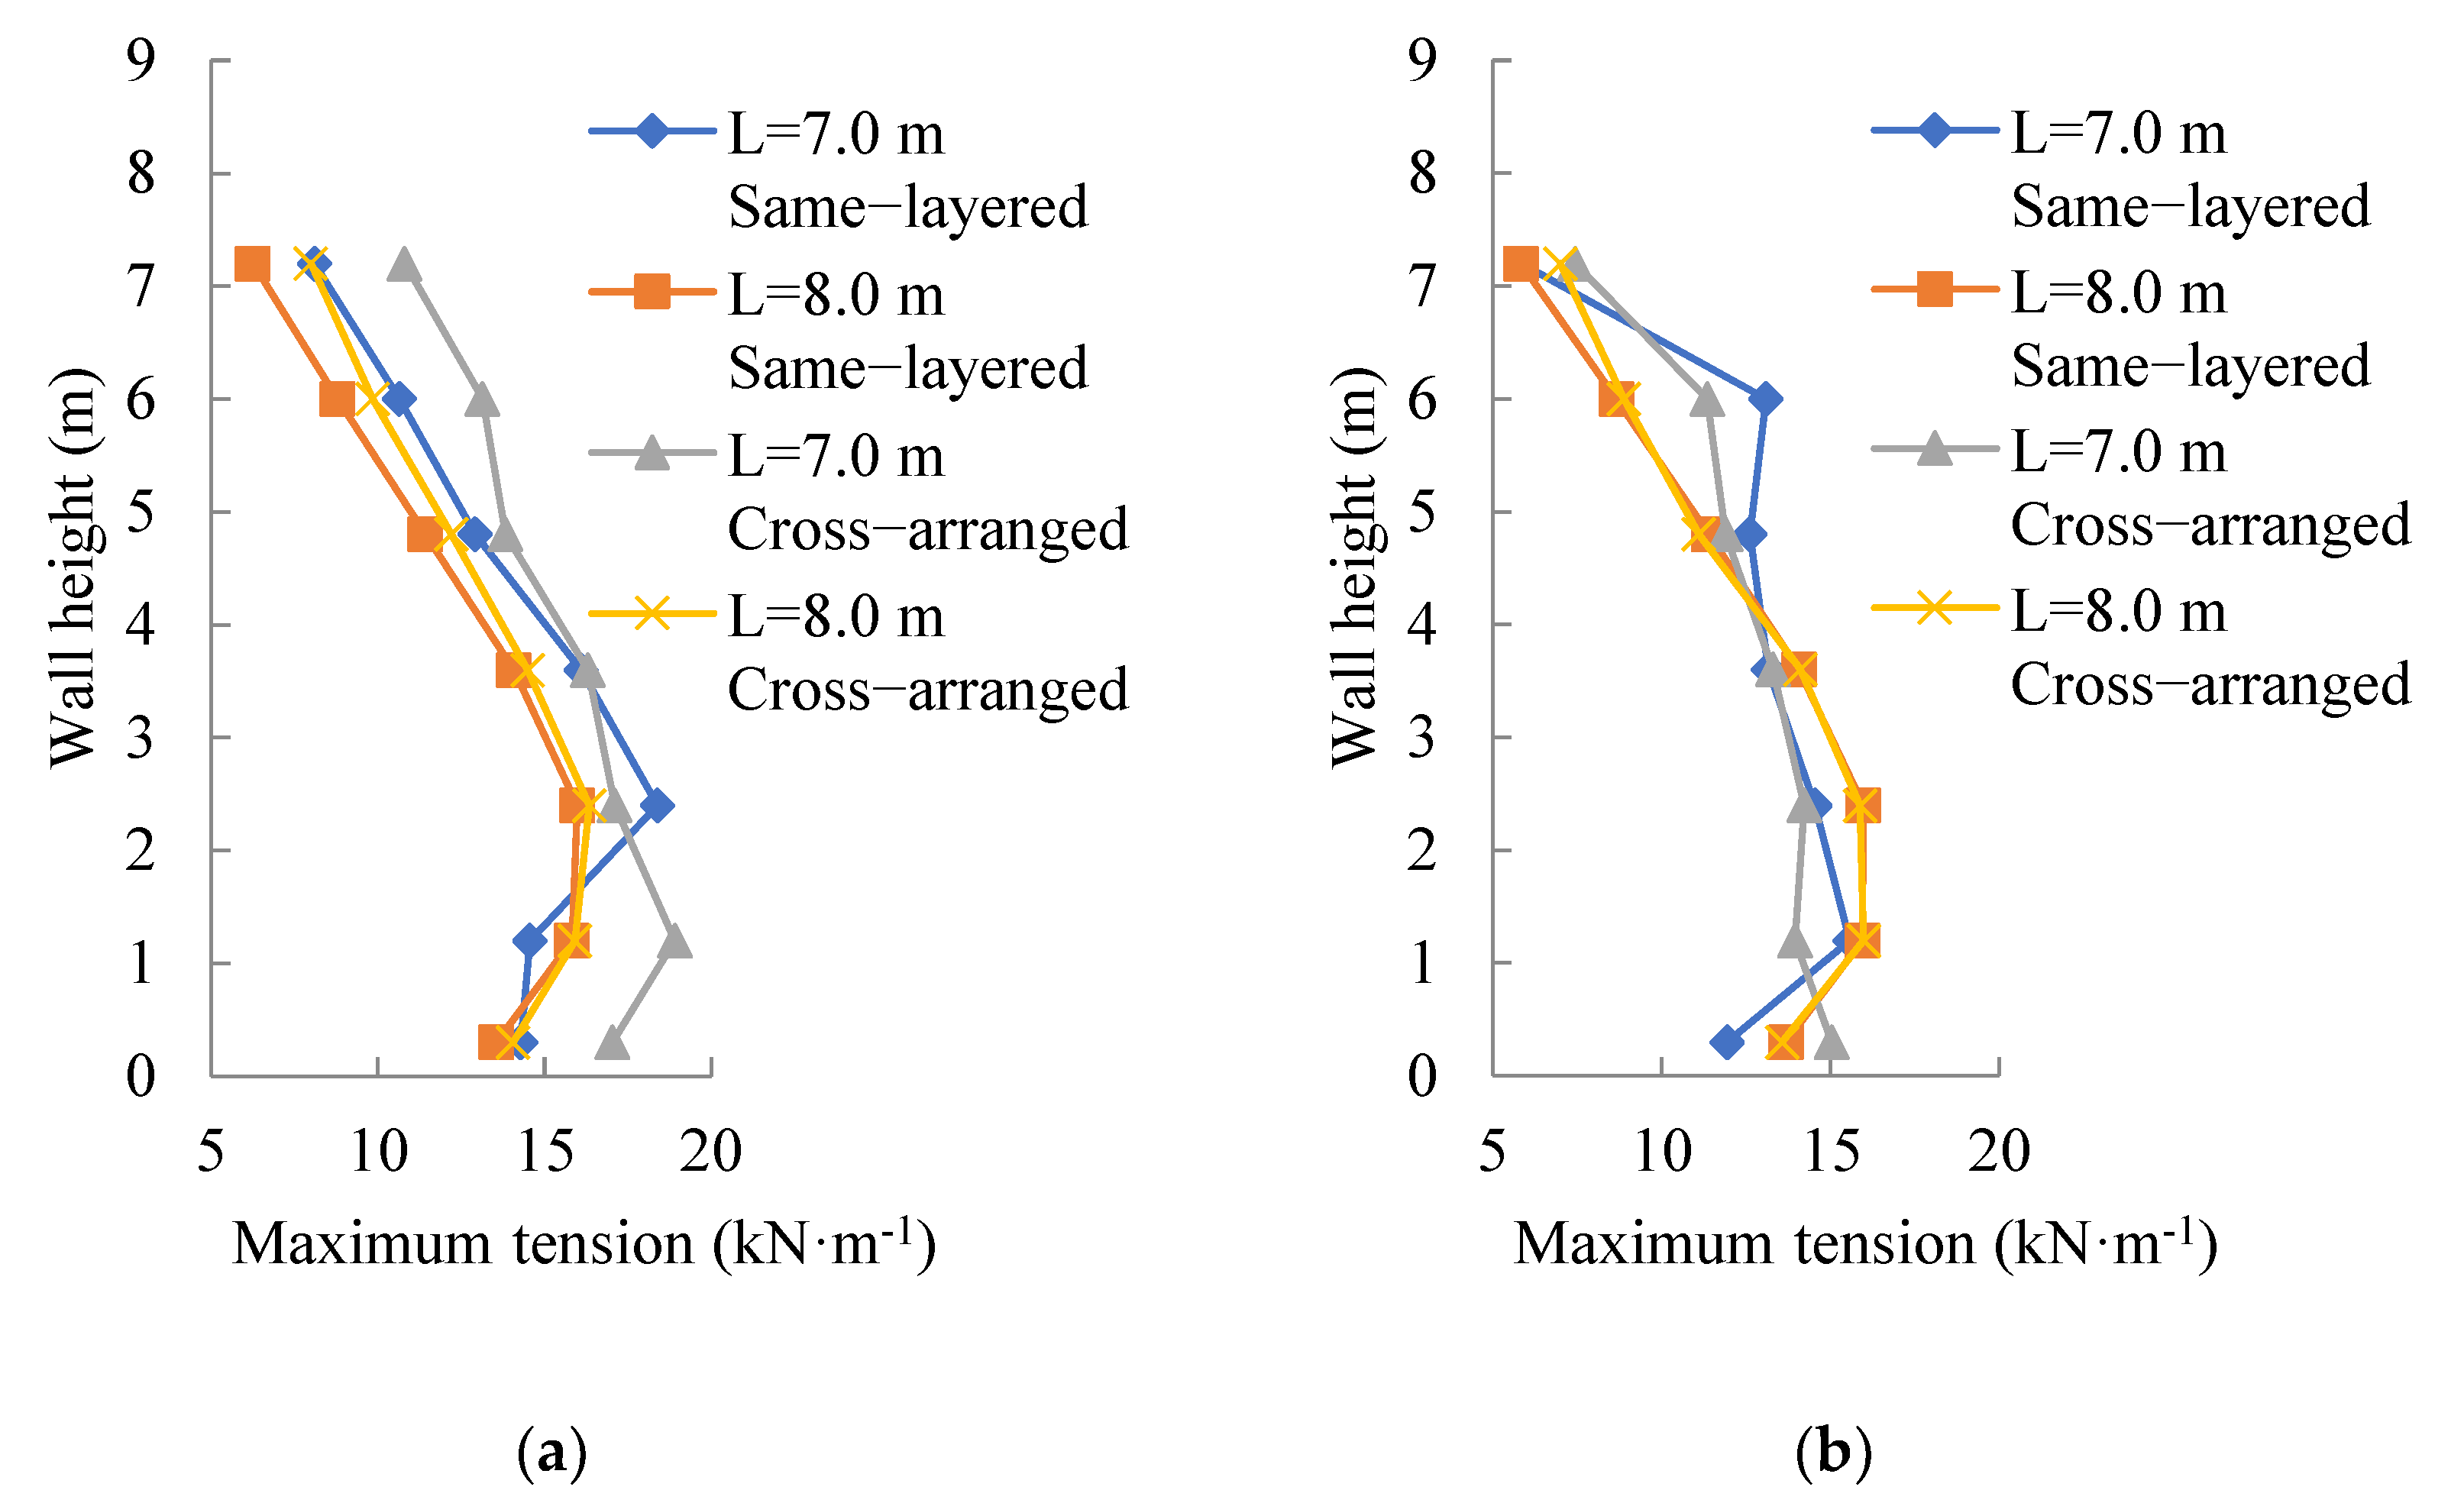
3.3.2. Tension in Reinforcement

According to the baseline case, the maximum distance between the left blocks and right panel was 16.0 m at the bottom of the wall, and the minimum distance was approximately 13.4 m. This indicated that the same-layered reinforcement was connected to a fully covered layer. For the cross-arranged reinforcement, the distances between both reinforcements were −0.8 to 1.9 m and −0.07 to −2.8 m (i.e., the overlap length was negative) for the 7.0 and 8.0 m reinforcements, respectively.
The maximum tension in the reinforcement, as shown in Figure 14a,b, indicated that the cross-arranged reinforcement provided more tension than the same-layered reinforcement. The maximum tensions in the cross-arranged reinforcement were 112.8% and 105.7% of the same-layered reinforcements with 7.0 and 8.0 m reinforcement lengths, respectively. Even when the maximum overlap length was 2.8 m (0.32 H), the reinforcement was pulled more than the same-layered reinforcement.

3.4. Factor of Safety of the Wall

The factor of safety (FOS) is a factor that evaluates the safety of a structure. According to Figure 15, a minimum FOS was the case with the same-layered reinforcement of 5.0 m long (which was 1.50), which was larger than the minimum factor of safety for the global stability of 1.3 [13]. The result also indicated that longer reinforcements led to a larger FOS. As the maximum distance between the left blocks and right panel was 16.0 m, the maximum reinforcement length for the same-layered GRSW was 8.0 m for each side. Therefore, the maximum FOS for the structure was 4.27, which was 3.71 times larger than what was required. For the 8.0 m long reinforcement, the FOS for the cross-arranged reinforcement with the same vertical reinforcement spacing (Sv) was 3.03, which was 71.0% of the FOS with the same-layered reinforcement. The 3.29 FOS for the 9.0 m long reinforcement indicated that the cross-arranged reinforcement was less safe than the same-layered reinforced GRSW structure and required more reinforcement to achieve the same stability. However, for the cross-arranged reinforcement, additional reinforcements did not always improve the structural stability. There was a sharp rise in the FOS from 2.02 to 3.67 for the reinforcement lengths between 7.0 and 10.0 m long. This indicated that even with 2.0 m longer reinforcements, a cross-arranged reinforced BBGRSW was still less safe than one with same-layered reinforcements.

4. Conclusions

A series of FEM analyses were conducted on the basis of a well-performed BBGRSW in an actual railway system. The design and parameters of the GRSW were investigated and optimized. The main conclusions are as follows:
(1)
Reinforcement length was an important parameter for the performance of a BBGRSW. The deformation and settlement showed a downward trend with the increase in the geogrid length. The post-construction lateral deformation with a 5.0 m reinforcement was approximately 58.06 mm. This indicated that the BBGRSW could be considered to be performing poorly or potentially unstable with reinforcements shorter than 0.7 H. The post-construction settlement was larger than that required by the Chinese railway department. The walls had a superior performance with longer reinforcements as the deformation with a fully covered reinforcement was only 5.2% of that with a 5.0 m long reinforcement and 24.8% of the settlement.
(2)
The performance of a BBGRSW may be superior with same-layered reinforcements, especially with a fully covered reinforcement in limited spacing. For a lateral deformation with an 8.0 m long reinforcement, it was 84.2% of that with a cross-arranged reinforcement with 94.5% tension. The same-layered reinforcement was 72.7% of the cross-arranged reinforcement on the settlement.
(3)
The FOS of the BBGRSW increased with a longer reinforcement and peaked at 4.27 for an 8.0 m long same-layered reinforcement. The cross-arranged reinforcement was 3.03, which was weaker in stability compared with the same-layered reinforcement. The FOS for the cross-arranged reinforcement was smaller than the same-layered reinforcement with longer reinforcements.
On the basis of the site monitoring content, this study discussed the performance of a BBGRSW in the limited space of the reinforcement length and layout. Additional research is needed for BBGRSWs with different top widths and wall slopes. The conclusions presented in this paper depend on the conditions from the field, and several other non-evaluated factors such as external loading, soil compaction, the type and stiffness of the soil, facing, and reinforcement were not considered. Hence, more research is needed.

Author Contributions

Conceptualization, G.Y. and Y.Z.; methodology, Y.Z.; software, Y.Z.; validation, H.W. and Z.W.; formal analysis, Y.Z.; investigation, Y.Z.; resources, H.W. and Z.W.; data curation, Y.Z.; writing—original draft preparation, Y.Z.; writing—review and editing, G.Y. and H.W. All authors have read and agreed to the published version of the manuscript.

Funding

This research was funded by the National Natural Science Foundation of China, grant numbers 52079078 and 51709175, and the National Science Foundation of Hebei Province, grant numbers E2018210097, and E2019208159.

Institutional Review Board Statement

Not applicable.

Informed Consent Statement

Not applicable.

Data Availability Statement

All data have been included in the article.

Conflicts of Interest

The authors declare no conflict of interest.

References

  1. Yoo, C.; Kim, S. Performance of a two-tier geosynthetic reinforced segmental retaining wall under a surcharge load: Full-scale load test and 3D finite element analysis. Geotext. Geomembr. 2008, 26, 460–472. [Google Scholar] [CrossRef]
  2. Basha, B.M.; Babu, G.L.S. Seismic reliability assessment of external stability of reinforced soil walls using pseudo-dynamic method. Geosynth. Int. 2009, 16, 197–215. [Google Scholar] [CrossRef]
  3. Wu, Y.; Chou, N. Forensic Studies of Geosynthetic Reinforced Structure Failures. J. Perform. Constr. Facil. 2013, 27, 604–613. [Google Scholar] [CrossRef]
  4. Yonezawa, T.; Yamazaki, T.; Tateyama, M.; Tatsuoka, F. Design and construction of geosynthetic-reinforced soil structures for Hokkaido high-speed train line. Transp. Geotech. 2014, 1, 3–20. [Google Scholar] [CrossRef]
  5. Khosrojerdi, M.; Xiao, M.; Qiu, T.; Nicks, J. Evaluation of prediction methods for lateral deformation of GRS walls and abutments. J. Geotech. Geoenviron. Eng. 2016, 143, 06016022. [Google Scholar] [CrossRef] [Green Version]
  6. Yu, Y.; Bathurst, R.J.; Allen, T.M. Numerical modelling of two full-scale reinforced soil wrapped-face walls. Geotext. Geomembr. 2017, 45, 237–249. [Google Scholar] [CrossRef]
  7. Yu, Y.; Bathurst, R.J.; Allen, T.M.; Nelson, R. Physical and numerical modelling of a geogrid-reinforced incremental concrete panel retaining wall. Can. Geotech. J. 2016, 53, 1883–1901. [Google Scholar] [CrossRef]
  8. Allen, T.; Bathurst, R.; Berg, R. Global Level of Safety and Performance of Geosynthetic Walls: An Historical Perspective. Geosynth. Int. 2002, 9, 395–450. [Google Scholar] [CrossRef]
  9. Allen, T.; Bathurst, R. Observed Long-Term Performance of Geosynthetic Walls and Implications for Design. Geosynth. Int. 2002, 9, 567–606. [Google Scholar] [CrossRef]
  10. Liu, H. Long-term lateral displacement of geosynthetic-reinforced soil segmental retaining walls. Geotext. Geomembr. 2012, 32, 18–27. [Google Scholar] [CrossRef]
  11. Latha, G.M.; Manju, G.S. Seismic Response of Geocell Retaining Walls through Shaking Table Tests. Int. J. Geosynth. Ground Eng. 2016, 2, 7. [Google Scholar] [CrossRef] [Green Version]
  12. Zevgolis, I.E. A Finite Element Investigation on Displacements of Reinforced Soil Walls Under the Effect of Typical Traffic Loads. Transp. Infrastruct. Geotechnol. 2018, 5, 231–249. [Google Scholar] [CrossRef]
  13. Berg, R.R.; Christopher, B.R.; Samtani, N.C. FHWA-NHI-10-024. Design and Construction of Mechanically Stabilized Earth Walls and Reinforced Soil Slopes–Volume I; U.S. Department of Transportation Federal Highway Administration: Washington, DC, USA, 2009. [Google Scholar]
  14. Han, J.; Leshchinsky, D. Analysis of back-to-back mechanically stabilized earth walls. Geotext. Geomembr. 2010, 28, 262–267. [Google Scholar] [CrossRef]
  15. Djabri, M.; Benmebarek, S. FEM Analysis of Back-to-Back Geosynthetic-Reinforced Soil Retaining Walls. Int. J. Geosynth. Ground Eng. 2016, 2, 26. [Google Scholar] [CrossRef] [Green Version]
  16. Benmebarek, S.; Djabri, M. FE Analysis of Back-to-Back Mechanically Stabilized Earth Walls under Cyclic Harmonic Loading. Indian Geotech. J. 2017, 48, 498–509. [Google Scholar] [CrossRef]
  17. Tajabadi, M.; Kalantari, B. Parametric analysis of back-to-back reinforced earth retaining walls. Pamukkale Univ. Muh. Bilim. Derg. 2019, 25, 247–256. [Google Scholar] [CrossRef] [Green Version]
  18. Lajevardi, S.H.; Malekmohammadi, K.; Dias, D. Numerical Study of the Behavior of Back-to-Back Mechanically Stabilized EarthWalls. Geotechnics 2021, 1, 18–37. [Google Scholar] [CrossRef]
  19. Dram, A.; Balunaini, U.; Benmebarek, S.; Sravanam, S.M.; Madhav, M.R. Earthquake Response of Connected and Unconnected Back-to-Back Geosynthetic-Reinforced Soil Walls. Int. J. Geomech. 2021, 21, 04021223. [Google Scholar] [CrossRef]
  20. Sravanam, S.M.; Balunaini, U.; Madhav, M.R. Analysis of Single and Back-to-Back Reinforced Retaining Walls with Full-Length Panel Facia. Geotech. Geol. Eng. 2020, 38, 6281–6293. [Google Scholar] [CrossRef]
  21. Xu, P.; Yang, G.; Li, T.; Hatami, K. Finite element limit analysis of bearing capacity of footing on back-to-back reinforced soil retaining walls. Transp. Geotech. 2021, 30, 100596. [Google Scholar] [CrossRef]
  22. Brinkgreve, R.B.J.; Vermeer, P.A. PLAXIS: Finite Element Code for Soil and Rock Analyses, version 8; CRC Press Balkema: Leiden, Netherlands, 2002. [Google Scholar]
  23. AASHTO. AASHTO LRFD Bridge Design Specifications, 8th ed.; American Association of State Highway and Transportation Officials: Washington, DC, USA, 2017. [Google Scholar]
  24. Allen, T.M.; Bathurst, R.J. Design and Performance of 6.3-m-High, Block-Faced Geogrid Wall Designed Using K-Stiffness Method. J. Geotech. Geoenvironmental Eng. 2014, 140, 04013016. [Google Scholar] [CrossRef]
  25. Allen, T.M.; Bathurst, R.J. Performance of an 11 m high block-faced geogrid wall designed using the K-stiffness method. Can. Geotech. J. 2014, 51, 16–29. [Google Scholar] [CrossRef] [Green Version]
  26. El-Sherbiny, R.; Ibrahim, E.; Salem, A. Stability of back-to-back mechanically stabilized earth walls. In Geo-Congress 2013: Stability and Performance of Slopes and Embankments III; ASCE: San Digeo, CA, USA, 2013; pp. 555–565. [Google Scholar] [CrossRef]
  27. Ehrlich, M.; Mirmoradi, S. Evaluation of the effects of facing stiffness and toe resistance on the behavior of GRS walls. Geotext. Geomembr. 2013, 40, 28–36. [Google Scholar] [CrossRef]
  28. Industrial Standard of the People’s Republic of China TB10621-2014; Chinese Code for Design of High Speed Railway. China Railway Press: Beijing, China, 2014.
  29. Cao, J.Z.; Liu, H.B.; Fan, C. Seismic response analysis of back-to-back mechanically stabilized earth (MSE) walls. China J. Geotech. Eng. 2019, 41, 918–926. [Google Scholar]
  30. Leschinsky, D.; Vuloav, C. Numerical Investigation of the Effects of Geosynthetic Spacing on Failure Mechanisms of MSE Block Walls. Geosynth. Int. 2001, 8, 343–365. [Google Scholar] [CrossRef]
Figure 1. BBGRSWs near Rongcheng Station. (a) Left side of the BBGRSW; (b) right side of the BBGRSW.
Applsci 12 00516 g001
Figure 2. Arrangement of the monitoring instruments (unit: cm).
Applsci 12 00516 g002
Figure 3. Curve of the particle size distribution of the filling soil.
Applsci 12 00516 g003
Figure 4. Layout of the BBGRSW on-site (baseline case).
Applsci 12 00516 g004
Figure 5. Triaxial test results of the filling soil.
Applsci 12 00516 g005
Figure 6. Post-construction deformation of the left blocks and right panel over time. (a) Lateral deformation of the left blocks; (b) lateral deformation of the right panel.
Applsci 12 00516 g006
Figure 7. Post-construction deformation of the left blocks and right panel by FEM along the height. (a) Lateral deformation of the left blocks; (b) lateral deformation of the right panel.
Applsci 12 00516 g007
Figure 8. Post-construction deformation of the left panel over time.
Applsci 12 00516 g008
Figure 9. Distribution of the geogrid strain with the time on-site. (a) 0 m high wall; (b) 2.4 m high wall; (c) 5.4 m high wall; (d) 7.5 m high wall.
Applsci 12 00516 g009aApplsci 12 00516 g009b
Figure 10. Comparison between the field test and simulated results on the geogrid strain. (a) 4.0 m left blocks; (b) 2.0 m right panel.
Applsci 12 00516 g010
Figure 11. Post-construction deformation with various reinforcement lengths. (a) Post-construction deformation on the left panel; (b) post-construction settlement at the top of the wall.
Applsci 12 00516 g011
Figure 12. Maximum tension with different reinforcement lengths. (a) Left side; (b) right side.
Applsci 12 00516 g012
Figure 13. Post-construction deformations with different reinforcement arrangements. (a) Post-construction deformation on the left panel; (b) post-construction settlement at the top of the wall.
Applsci 12 00516 g013
Figure 14. Maximum tension in the reinforcements. (a) Left side; (b) right side.
Applsci 12 00516 g014
Figure 15. Factor of safety with different reinforcement lengths and arrangements.
Applsci 12 00516 g015
Table 1. Details of the instruments.
TypeRangePrecision
VW earth pressure cell0–1 MPa±0.1% FS
Strain gauge0–30 mm±0.5% FS
Single point settlement meter0–200 mm±0.5% FS
Displacement meter0–50 mm±0.05% FS
Table 2. Physical and mechanical properties of the filling soil.
ItemsIndexes
Particle diameter (mm)d10d30d60
0.320.841.95
Coefficient of uniformity6.09
Curvature coefficient1.13
Saturated unit weight (kN·m−3)19.2
Cohesion (kPa)3.1
Friction angle (°)37.3
Moisture content (%)5.7
Optimum moisture content (%)7.8
Maximum dry density (g·cm–3)2.234
Elasticity modulus (MPa)12.00
Table 3. Technical specifications of the high-density polyethylene (HDPE) geogrid.
ItemsIndexes
Rib length/mm245
Rib spacing/mm16
Rib width/mm5.1
Rib thickness/mm1.3
Bar width/mm18.2
Bar thickness/mm3.5
Mass per unit area/(g·m–2)850
Tensile strength/(kN·m–1)141.6
Tensile strength at 2% strain/(kN·m–1)41.6
Tensile strength at 5% strain/(kN·m–1)85.9
Peak strain/%8.92
Axial stiffness at 2% strain/(kN·m−1)2080
Long-term stiffness/(kN·m−1)2200
Table 4. Input parameters of the soil properties from the BBGRSW.
ItemsFilling SoilClayey SiltsGravel SoilBed Rock
ModelHardened soil SmallSoft soilMohr–CoulombLinear elastic
Saturated unit weight (kN·m−3)19.222.420-
Peak plane strain friction angle (°)37.325.840.0-
Cohesion (kPa)3.19.20-
Angle of dilatancy (°)7.3---
Modified compression parameter-0.27--
E 50 r e f 4000---
E o e d r e f 5554---
E u r r e f 17,000---
m0.5---
G030,000---
γ0.70.0004---
Elasticity modulus (kPa)--15,00020,000,000
Poisson’s ratio--0.250.2
Table 5. Input parameters of the panel properties from the BBGRSW.
ItemsModule BlockConcrete
ModelLinear elasticLinear elastic
Elasticity modulus (kN·m−2)550,0002,000,000
Poisson’s ratio0.20.2
Publisher’s Note: MDPI stays neutral with regard to jurisdictional claims in published maps and institutional affiliations.

