1. Introduction
Sports coaches have widely used vertical jumping, scientists, and health care professionals as a pseudo measure of strength and assess the ability to produce power and body acceleration. Different methods have been proposed to evaluate an athlete’s vertical jump performance [
1]. Jump height is a parameter closely related to performance in individual and team sports [
2,
3] and is commonly used to assess athlete potential [
4]. Many professional sports organizations (i.e., NFL, NBA, etc.) use the vertical jump before drafts. The jump is also used to monitor athlete improvement during training, including differentiating athletes from different field positions [
5].
Several methods and protocols have been proposed to compute jump height when performing vertical jumps, which depending on the technology, can lead to different results [
6,
7,
8,
9,
10]. Moreover, in recent years we came across the rise of wearable devices with the technology to measure the vertical jump. Although they share the same components, the results are significative different due to the use of distinctive algorithms. The devices can be broadly grouped according to their domain of application, i.e., laboratory or field tests. Laboratory tests typically involve three-dimensional motion capture or ground reaction force measurement systems, while field tests typically incorporate contact mats, accelerometers, jump belts, and vertical jump reaching devices. Laboratory devices are by far more expensive and time-consuming. The literature demonstrates that there are significant differences among different jump height estimation methods [
8,
11] which can be described as direct methods such as (i) tape and (ii) marker tracking; and indirect methods such as (iii) flight-time, (iv) take-off velocity, (v) impulse-momentum and (vi) work energy. In the direct methods, the jump height is assessed by using a measurement tape, marking the maximum height, or tracking marker positions during the recording of the jump [
6,
12]. For the indirect approach, the jump height is estimated based on the kinematic parameters, such as flight-time and vertical acceleration of the subject’s centre of mass [
10].
Motion capture systems, such as Qualisys Motion System (QMS), are considered by many as the gold standard or reference equipment [
6,
11,
13]. However, due to their complexity, experienced investigators must operate them and analyse the data. Furthermore, set up and participant preparation time can be extensive. Such constraints make motion capture systems impractical when measurement involves many participants. Since the measurements rely on the infrared reflection of markers, the tests are often restricted to laboratory settings to prevent perturbations created by sunlight and to protect expensive equipment from other environmental conditions. On account of their accuracy in lab-based settings, motion capture systems have been used by several authors for the validation of alternative field-based jump height measurement methods [
6,
14].
Force platform (FP) measurement is one of the most accurate measurement technologies commonly used for biomechanical investigations, and these have been used to assess jump height using vertical ground reaction force [
3,
7,
11,
13]. Many authors consider them an alternative gold standard device to the motion capture approach [
8,
13]. FP’s are typically expensive, difficult to move to the field, and require a long time to analyse the data. From the ground reaction forces measured, jump height can be estimated using different parameters: flight-time, impulse-momentum, and work-energy. Flight-time is determined from the contactless interval with the FP [
7]. The impulse-momentum and work-energy methods both permit the calculation of the instantaneous take-off velocity, where jump height is calculated from the equations of motion of a projectile [
7]. The author found that flight-time is the most accurate, and the work-energy method is the least accurate. For better accuracy when using the impulse-momentum method, a positive displacement must be added to account for the contribution of ankle extension in the final period before take-off [
10,
11]. Moir [
10] compared the results from double integration of vertical ground reaction force, time in the air, and take-off velocity methods and found that take-off velocity, obtained from impulse-momentum, led to more reliable results when a positive displacement was added. Leard et al. [
6] validated jump height measurements obtained with FP’s and Vertec (height reaching/marking) devices by comparison with a motion capture system. Dias et al. [
14] found that applying flight-time and double integration methods to the FP measurements leads to systematic errors. A high degree of linearity existed when compared with the video-based measurement method. The study revealed better results for the double integration than for the flight-time method considering both the validity and reliability of the jump height calculation.
The search for simple and accurate ways to assess jump height in field-testing means new technologies continue to emerge, although typically employing only a few simple mechanical principles. Switch-mat tests were introduced [
15], with the Ergojump (EJ) device widely used for vertical jump measurement [
16,
17]. Their main advantage compared to laboratory devices is that they do not require extensive preparation or analysis time and are simple to operate. Furthermore, this allows for a large volume of participants to be measured in a small period of time. The jump mat approach uses flight-time (the duration without contact between participant and mat) and kinematic equations of uniform acceleration to assess jump height. Hatze [
18] questioned the validity of jump height measurements calculated from flight-time since the jump height could be artificially increased due to the athlete’s joint configuration at landing, which without clear instruction is typically more flexed to attenuate impact forces at landing. In addition, ankle extension during the two jump phases underestimates the maximum height attained during the jump [
19,
20]. The accuracy of flight-time given by a jump mat was analysed by comparing it with the FP, and it was found that flight-time was consistently larger for the jump mat than for FP [
19].
More recently, a new generation of technologies has gained wide-reaching use. Accelerometers are increasingly used for assessing human movement [
21]. Using an accelerometer (MP) device, the vertical acceleration is measured during the jump and is integrated over time to determine the vertical velocity. Jump height is derived from flight time, which is determined by considering the time interval between maximum and minimum vertical velocities. Due to small differences between MP and FP measurements, MP has been proposed to be a valid tool to assess jump height [
20], although other studies have identified an overestimation of the jump height from this type of device [
8]. Jump height validity, based on flight-time obtained through MP and Optojump systems, was also assessed concerning the FP measurements [
22], concluding that both systems can be accurately used for field-based measurements. Casartelli et al. [
22] analysed the validity and reliability of MP measurements, obtained with flight-time and an alternative approach of using the vertical take-off velocity to calculate jump height. They concluded that a flight-time method was reliable for field-based jump assessment. The systematic errors, the absolute and relative reliability, and heteroscedasticity for the contact mat, MP, and Vertec were further evaluated by Nuzzo et al. [
9]. They found MP to be the most reliable device but with high heteroscedasticity.
Many of the approaches to calculating or measuring vertical jump height presented in the literature are derived from the Sargent jump or Abalakow belt jump (ABJ) tests. They are very popular due to their low cost, quick implementation, fast data analyses, and simple enough to use in laboratory and field-based settings. In the ABJ test, a belt is used with measuring tape fastened around the athlete’s waist and attached to a metal or wooden plate fixed to the ground [
23]. To ensure the accuracy and reliability of the measurements, the athletes must take off and land inside the plate or within a delimited area. Jump height is directly determined by the difference in tape measurement before and after the vertical jump, where the athlete is initially in an upright position with the tape taught. Taking as reference the FP, ABJ demonstrated similar jump height measurements within 1 cm [
24].
Unfortunately, whilst existing literature has evaluated most measurement technologies and analytical approaches for measuring jump height, there is no comprehensive comparison of the predominant technologies and alternative analytical methods. Therefore, this study aimed to provide a single comprehensive evaluation of the various measurement and calculation methods available for jump height calculation, considering both complex and simple technologies.
2. Material and Methods
The following subsections describe the subjects that participate in the tests, the procedure of vertical jump, the data collecting from different devices, and the data analysis using different methods.
2.1. Subjects
Twenty-seven physical education students, 14 male and 14 female, age 23.5 ± 3.8 years, height 170 ± 9.1 cm and mass 69.1 ± 11.4 kg, participated in this study. All participants had competitive sporting backgrounds in either team sports, individual sports, or resistance training. Participants were required to be free from neuromuscular injuries in the lower limb and not take medications. All the participants gave written informed consent to participate in this study in agreement with the Declaration of Helsinki, which the local ethics committee approved.
2.2. Procedures
Data collection involved two visits to the laboratory. At the first visit, participants were met 24 h before the main session for familiarisation with the devices and testing procedures. Participants were instructed how to correctly perform the countermovement jump (see data collection). Body height, mass, and injury status were also recorded.
The second (main) session was dedicated to data collection using five different devices. Before the testing session, participants completed 5 min of self-selected warm-up on treadmill running, followed by self-administered dynamic exercises and finishing with three to five progressively larger jumps.
2.3. Data Collection
Data collection was performed using 5 devices simultaneously: Qualisys motion system (QMS), from Qualisys AB-Göteborg-Sweden, Force platform (FP), from Bertec FP6090, Ergojump (EJ), jump mat device from Junghans GMBH-Schramberg-Schramberg- Germany, Myotest Pro (MP), triaxial acceleration measurement device from Myotest® Inc.—Sion, Switzerland, and self-made Abalakow belt jump (ABJ).
QMS employed 12 infrared cameras to capture kinematic data at a sample rate of 200 Hz, with a spatial resolution of 1 mm, and calibrated following manufacturer guidelines. Two reflective markers with 12 mm diameter were placed over the left and right lateral femoral condyles to measure jump height. This was done for three purposes, (a) to be as close as possible to the whole-body centre of mass [
25], (b) to avoid tracking displacements in the sagittal plane associated with trunk flexion, and (c) to track predominantly the vertical position of the whole-body centre of mass.
The FP measured ground reaction force at 2000 Hz and was hardwire synchronised with the data acquisition of the QMS. All jumps were performed from an EJ mat placed on top of the force platform, with jump height automatically calculated by the device.
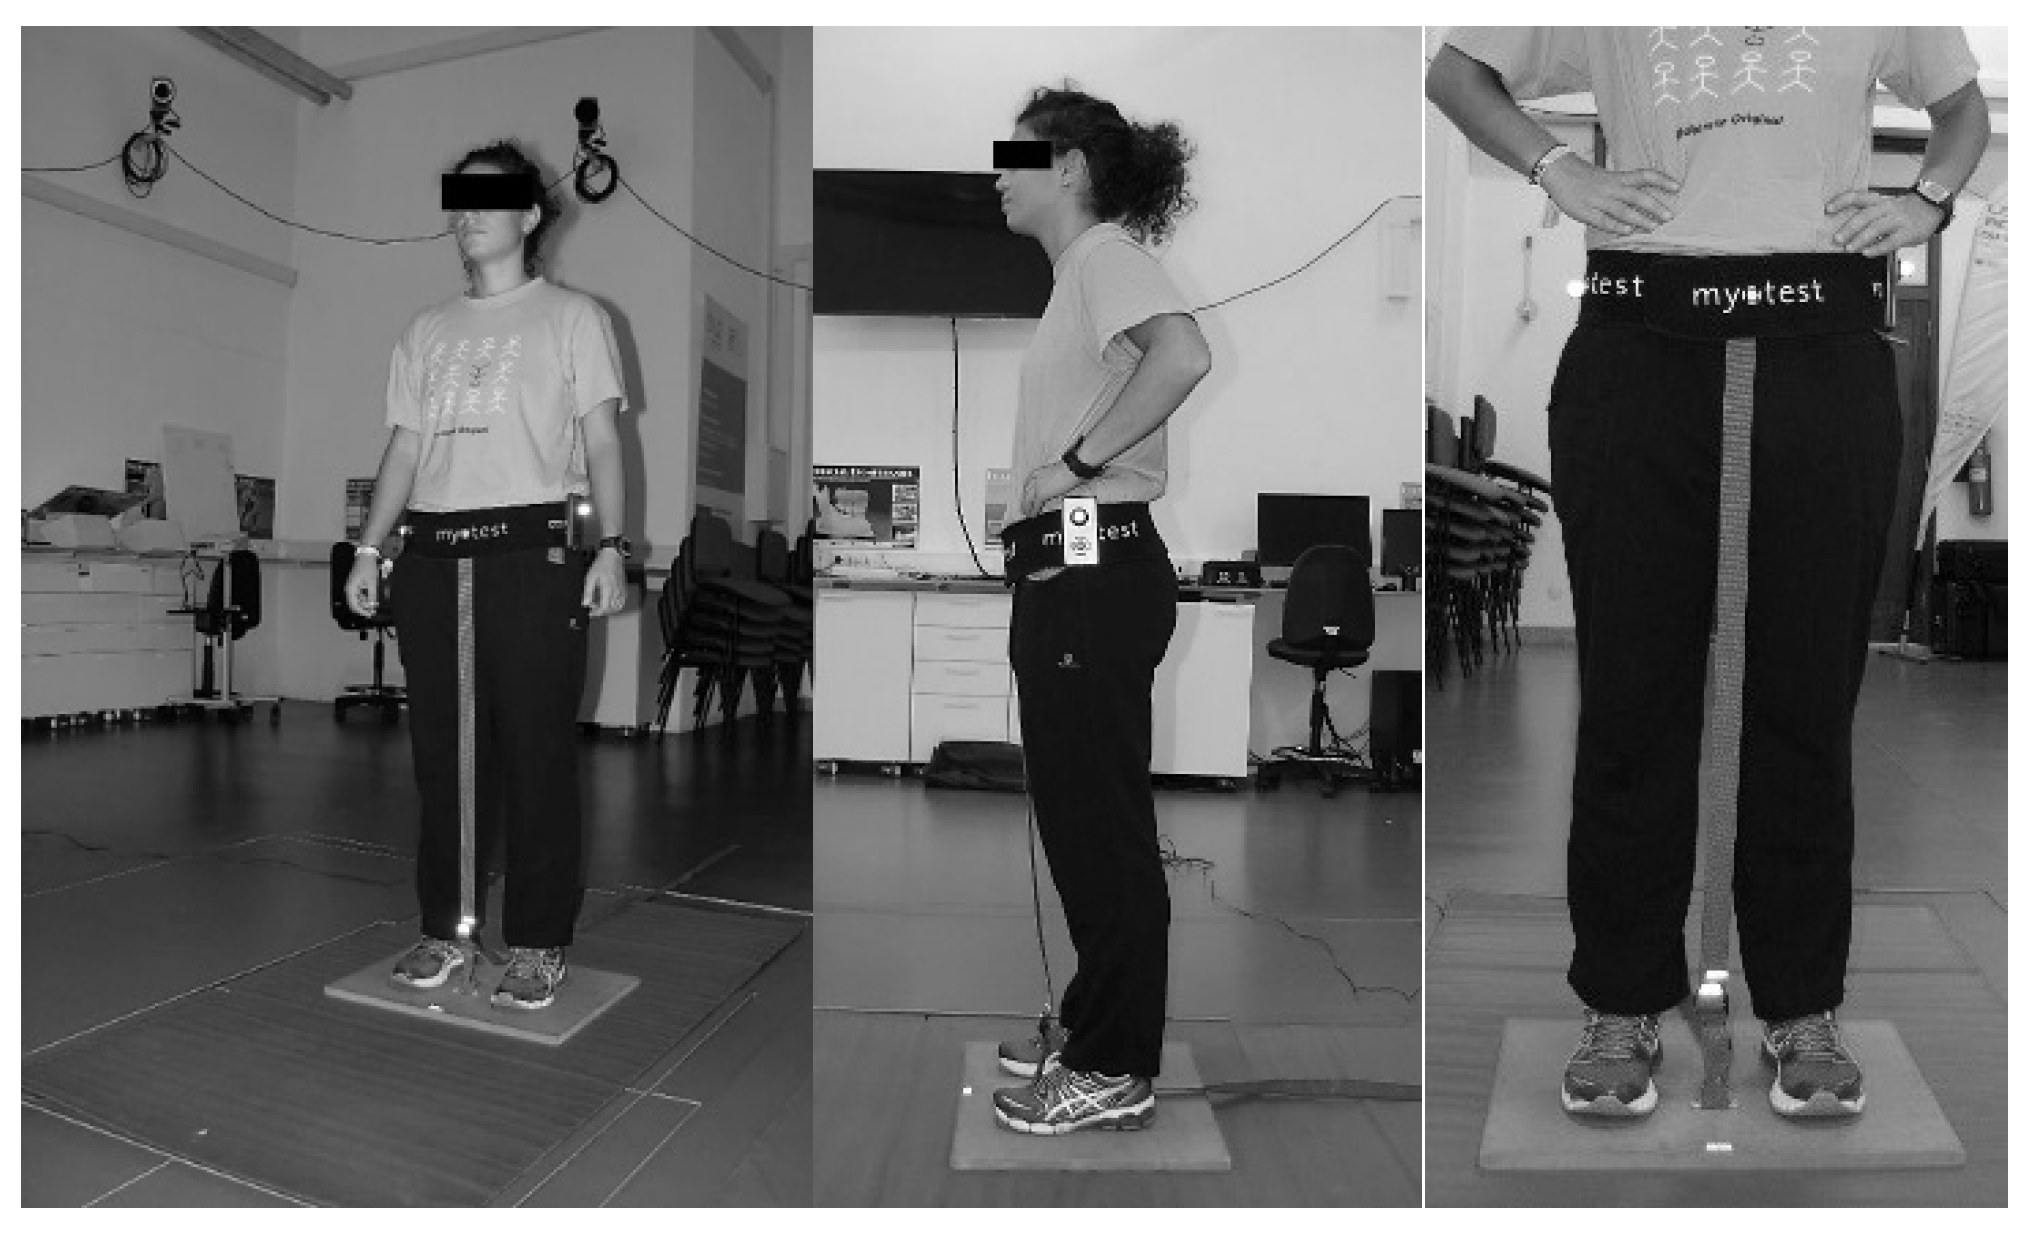
The MP device incorporated a tri-axial accelerometer to measure the global acceleration and was fixed to the left side of the pelvis at the level of the left lateral femoral head with a Velcro elastic belt shown in
Figure 1. Data were sampled at 200 Hz, stored in the device, and post-processed using manufacturer software.
The ABJ involved an inelastic tape passed through a floor-level roller attached to a board placed above the jump mat. The tape is attached to the waist belt and can freely pass through the floor level roller. As a participant jumps, the excess tape passes through the roller, and it is the difference in the tape length pre and post jump that is used as jump height.
For data collection, participants stood with straight legs upon the EJ mat, ABJ plate, and FP with the EJ and ABJ fixed to the FP with double-sided tape (
Figure 1). Then, holding hands on their hips, starting in an upright standing position, they would perform a jump beginning with a countermovement down to a knee angle of approximately 90 degrees, with take-off and landing always in the same position (with straight legs and plantarflexed ankles). The ABJ sliding tape was made taught between belt and floor whilst standing. The standard jump protocol of the MP system required five consecutive jumps to be performed after a starting signal with a five seconds interval between jumps. To overcome this software limitation, avoid fatigue, and be able to compare measurements obtained from the five devices, participants performed the highest jump as the first in the sequence of five and then undertook four submaximal jumps after this. Only the first jump in this sequence was used for the evaluation of devices. The participants repeated this procedure twice with a 40 s recovery in between to obtain three maximal height vertical jumps.
2.4. Data Analysis
The z-position profile acquired from the QMS incurs errors associated with system calibration, which were of the magnitude < 0.5 mm (consistent with human error in the measurements of the ABJ). As such, the signal is already very smooth, as shown in
Figure 2. Therefore, low-pass filters identified the maximum height from the data without further processing. Jump height was determined using different methods. From the ABJ, the jump height was directly measured by reading the values from the sliding tape.
For the QMS, the evaluation of jump maximum height is straightforward by tracking the reflective markers placed on the hip joint, calculating a mean marker position from both hip markers, then calculating the difference between the initial standing height and the vertical peak height of the jump. The jump height was also indirectly estimated based on flight-time, defined between the take-off and landing events, by considering as reference the mass centre starting position when standing.
From the FP, jump height was indirectly estimated by either (a) calculating the vertical trajectory of the whole-body mass centre or (b) by using the jump flight-time (contactless period). For the first approach, the vertical ground reaction force was normalised by subtracting the subject’s weight, and then the acceleration of the whole-body mass centre was calculated by dividing these forces by the body mass [
7]. The vertical trajectory of the jump was obtained by double integration in time of this acceleration data, from the initial movement until the landing (contact) of the jump, using Simpson’s rule [
7,
10]. The height was evaluated by selecting the displacement at the highest point of the trajectory. The jump height was also determined based on the elapsed time between the maximum and minimum vertical jump velocity (assumed flight time) calculated from the single integration of the acceleration data and by applying the kinematic equations for constant acceleration [
15].
The EJ directly calculates jump height, which is estimated based on the contactless period of the jump (assumed flight-time) and is triggered by contact pressure.
The MP device was placed upon the pelvis to closely represent the vertical acceleration of the whole-body mass centre and QMS markers. The system automatically computes the jump height based on the flight time corresponding to the elapsed time between the maximum and minimum vertical jump velocity. Similar to the FP, the jump height can also be estimated from the vertical trajectory of the mass centre by double numerical integration of vertical acceleration data.
The vertical trajectory of the jump based on the double integration of the acceleration is highly influenced by the selection of the jump-starting time. However, the presence of experimental noise within the acceleration profiles extracted from FP and MP makes identifying this event challenging. To overcome this problem, a 3-point moving average filter was applied 4 times to the acceleration profiles to remove high-frequency noise and to enable clearer identification of jump initiation. Applying a low-pass filter will lead to the attenuation of high-frequency noise and the removal of large-signal components of the jump associated with signal perturbations. However, these are essential for the correct identification of the jump-starting point. The balance between the attenuation of the noise and the removal of the signal components can be managed by the repetition of the moving average process. Thus, through the analysis of the filtered acceleration profiles, the multiple of 4 was found to be sufficient to attenuate high-frequency noise without removing the jump signal variation, which is necessary for the identification of initiation of the jump. Concerning subsequent calculations, the experimental noise is naturally attenuated by the process of numerical integration, and therefore, no further data smoothing was applied since the resulting vertical trajectories are naturally very smooth as for QMS.
The measurement accuracy is defined as the proximity of the measurement to the real value, and the measurement precision is the repeatability of this measurement for the same experimental conditions. Therefore, the accuracy and the precision of jump height obtained with the combination of device and method can be statistically demonstrated by computing, respectively, the mean differences to the true value and the standard deviation of the mean differences. The maximum vertical position derived from the mean QMS marker positions at the pelvis was considered the true jump height for all further analyses.
3. Results
Jump height from 84 valid trials performed by the participants using the five devices and different methods are shown in
Figure 3. High dispersion of jump height was observed due to participant-specific variations. Values range from 250 mm to 650 mm, with the mean and the standard deviation of 381 ± 76 mm, when considering the measurements from the QMS markers position.
A direct comparison between jump height obtained through QMS markers position, FP double integration, and ABJ displacement is presented in
Figure 3a. Many authors consider the first two as the gold standard techniques, and the third can provide an easy, low cost, and direct measurement of jump height. Jump height was also determined from flight-time (
Figure 3b). The values obtained from QMS flight-time compared closely to the values of the QMS marker position. Flight-time determined from the maximum and minimum vertical velocity or from the contactless time with the EJ mat always led to an underestimation of jump height. For FP and MP, the vertical trajectory of the centre of mass was determined by double integration of the body’s vertical acceleration, and jump height was obtained by taking the position at the highest point of this trajectory. The results from the FP and MP were compared with the QMS marker’s position, as shown in
Figure 3c. It can be observed that, except for a few cases, there is a good agreement between the results from the FP and the QMS; the same is not seen for the results from MP.
According to the results in
Table 1, ABJ presents the highest accuracy and precision with 1 mm and ±15 mm, respectively. This is closely followed by FP using the double integration method and QMS using the flight-time method. However, one should mention that the results from FP could be better if we remove the outlier of trial 23 shown in
Figure 3a,c, which would improve the accuracy to 1.5 mm and the precision to ±13.9 mm. The flight-time method for all devices except QMS resulted in an underestimation of jump height. The difference was largest for EJ, followed by MP and FP devices.
To verify the degree of agreement between the jump height reference values (
), obtained from QMS markers position, and the results from different devices and methods, the Bland–Altman plots are presented in
Figure 4. For this analysis, the outlier of trial 23 was excluded from FP: double integration results. A positive bias is identified for the ABJ: displacement, QMS: flight-time and FP: double integration, and a negative bias for the other cases. High dispersion of the differences around the mean value is also observed.
The linear regression line is also shown to investigate the presence of proportional bias. Except for the QMS: flight-time, we observed a significant slope. The Pearson correlation coefficient () and the p-value of the mean variable are also shown. The correlation coefficient revealed a negligible correlation for QMS: flight-time, a moderate correlation for MP: double integration, and a weak correlation for the other cases. The p-value lower than 0.05 was identified for the ABJ: displacement and MP: double integration, meaning the correlation coefficient was statistically significant and, therefore, it is assumed there is proportional bias. The ABJ: displacement presented a negative proportional bias, which would tend to underestimate the jump height for higher jumps. On the other hand, the MP double integration had a proportional bias with a high positive slope, corresponding to a tendency to strongly overestimate the jump height.
The true flight-time is identified by considering the take-off and landing instants represented in
Figure 5. This shows the contactless interval (flight-time) identified from the vertical acceleration is shorter than the elapsed time determined from the maximum and minimum velocity approach.
Flight-time can be directly measured using contact with the EJ mat or estimated from elapsed time between the maximum and minimum velocity (
Figure 5) or by time integration of the vertical acceleration from FP or MP data. There appears to be an underestimation of the flight-time and subsequent jump height values obtained from EJ, which presented lower accuracy than those obtained from FP and MP devices. However, when the flight-time is defined using the method of QMS, jump height can be closely approximated to the true value.
Concerning the results obtained from the double integration method, MP presents much lower accuracy and precision than FP. To investigate the reason for these differences, a comparison between the accelerations measured by the two devices was made. The vertical acceleration measured by MP and determined from ground reaction force measured by FP are presented in
Figure 6.
For FP acceleration, it was possible to identify a stable negative baseline equal to the gravitational acceleration, which corresponded to the situation where there is an absence of contact with the platform. The same was not observed for MP acceleration that showed some fluctuations over the same interval and less distinct data events at initiation and ending of the flight phase (i.e., a slower slew rate at the transitions). By applying the double integration method to the two accelerations the respective mass centre vertical flight trajectory could be compared, as in
Figure 7, with the vertical trajectory of the pelvis markers tracked by QMS.
The FP path follows the QMS vertical trajectory closely, but MP presents a very different path. A possible explanation for this difference is the lower slew rate and the deviation in vertical orientation of the acceleration measured by the MP device. This last deduction is supported by fluctuations in the vertical acceleration observed during the flight phase, where these would be expected to be constant and equal to the gravitational acceleration.
4. Discussion
The video-based marker tracking system (QMS) is here considered the reference value since it allows tracking of the trajectory of the jump with both high accuracy and precision. This is also considered the gold standard method by many authors [
6,
11]. Analysis of ABJ results reveals high accuracy and good precision (0.8 ± 14.7 mm). This was somewhat surprising since it is difficult to guarantee solely vertical displacement of the jump to avoid an overestimate of the vertical jump height by adding anterior or posterior motion of the body. Researchers wishing to assume the accuracy and precision found in this study should emphasise to their participants the importance of a predominantly vertical displacement.
The accuracy and precision results obtained from the flight-time methods using EJ, MP and FP devices data are consistent with those in the literature [
7,
10,
14,
26]. Considering the underestimation of the jump height, Kibele [
26] found the smallest difference of 2 cm between video-based marker measurements and the flight-time method, but little difference for the take-off velocity method. Taking video analysis as a reference, Dias et al. [
14] found differences in jump height with the flight time method of 10.32 cm and 1.5 cm for the double integration method using a force platform. In contrast, Moir [
10] identified differences of 10.9 cm and 9.1 cm for men and women, respectively, between flight-time and the double integration methods applied to force platform data. A take-off velocity method provided the smallest difference.
One of the main sources of error described in the literature for the flight-time method is the body posture in the aerial phase since the method assumes that the position of the centre of mass is the same at take-off and landing. Therefore, identifying the true instant of take-off, which is related to the device used for this purpose, is crucial, and so too is an understanding of the participant’s landing technique. Typically, flight-time is increased by the participant landing with flexed lower-limb joints [
10,
11] to attenuate landing impact forces [
27]. The vertical jump trajectory’s position, velocity, and acceleration (a representative example of which is presented in
Figure 5) revealed that participants complied with the countermovement protocol since the touchdown and the minimum velocity occur at approximately the same time the mass centre reaches the standing height reference. From the take-off instant, we can see that the calculated maximum velocity occurs before there is no contact with the floor and after the centre mass vertical movement starts. For this reason, the jump height in EJ has less accuracy than those obtained with the MP and FP. The double integration jump height measurement method used in this study was performed by time integration of the vertical acceleration extracted from the FP device or the vertical component of the tri-axial accelerometer data of the MP device. The numerical integration was performed from the jump movement’s initiation until beyond the vertical trajectory’s apex. Researchers have found that the double integration method is one of the most reliable and accurate when using ground reaction force data [
10,
11,
14].
Although the double integration method can provide good accuracy when using ground reaction force data, the same was not observed when using acceleration data collected using the MP device. Analysis of the two vertical acceleration signals, as shown in
Figure 6, demonstrate similar behaviour, but the acceleration obtained from the MP, which has a lower sampling frequency than the FP (200 Hz versus 2000 Hz), contains some fluctuations and less defined events at take-off and landing. Therefore, the acceleration signal from MP does not follow the signal recorded by the FP, such as take-off and landing events, and contains oscillations throughout the flight phase.
Comparing the vertical position of MP, QMS, and FP, as shown in
Figure 7, we found that the MP device exhibits a very different path. In relation to the mass centre acceleration approximated by the MP device, it should be noted that a strict protocol must be followed to minimise potential sources of errors. It must be a priority that all movement be as much as feasible isolated in the vertical direction. Mauch et al. [
8] indicated that the device’s location could be a source of error since rotational effects of the pelvis are included in the data pertaining to be the motion of the mass-centre. However, it was found that one of the predominant sources of errors was from using a low sampling frequency. This can affect the accurate identification of the data to be used in the integration approach [
7,
10].
Only the vertical component of the ground reaction forces was selected for the FP, removing some of the challenges discussed above for the tri-axial accelerometer (MP). Constant gravitational acceleration can be assumed during the aerial phase, and vertical acceleration can be established independent of body orientation during the jump.
Considering the results presented in
Table 1, the ABJ represents the best accuracy and precision (0.8 ± 14.7 mm) compared to marker tracking with a 3D motion capture system. Height estimation by the double integration method using the vertical ground reaction force is the second most accurate and precise (1.5 ± 13.9 mm), and the third most accurate result was the QMS fight-time method (6.1 ± 17.1 mm). A lower precision was obtained from flight-time for EJ, MP, and FP devices since the physical principle used to determine flight-time underestimated its true value. Interestingly, the double integration method with the MP device led to the fourth most accurate measurement of jump height but was accompanied by a poor demonstration of precision (−31.4 ± 122.7 mm). This suggests a lack of frequency resolution, and the sensitivity of the method to sensor orientation may heavily affect the results.
A low precision of the jump height is observed in all the devices and methods. This limitation can be overcome by taking the average value of several jumps, which requires the athlete’s performance to be the same in all the jumps. The flight time is underestimated when using EJ, MP, and FP devices. Therefore, the athlete’s performance can only be evaluated by comparing measurements from the same device since the jump height presents low accuracy. The low-frequency resolution of vertical acceleration, measured with the MP device, limits the evaluation of jump height to the flight-time method, which is determined from the maximum and minimum velocity. The jump height can be evaluated from the highest point of the vertical trajectory, which is determined by double-time integration of acceleration obtained from the ground reaction force, measured with the FP device. However, the accuracy of the result is highly dependent on the post-processing of the reaction force, which involves the determination of vertical acceleration, the correct identification of the jump-starting point, and the double-time integration of acceleration.


