Communication

A Novel, Automated, and Real-Time Method for the Analysis of Non-Human Primate Behavioral Patterns Using a Depth Image Sensor

1
Robotics R&D Department, Korea Institute of Industrial Technology, Ansan 15588, Korea
2
National Primate Research Center, Korea Research Institute of Bioscience and Biotechnology (KRIBB), Cheongju 28116, Korea
3
BK21 FOUR KNU Creative BioResearch Group, School of Life Sciences and Biotechnology, Kyungpook National University, Daegu 41566, Korea
4
Kinetic Lab Inc., Seongnam 13487, Korea
*
Authors to whom correspondence should be addressed.
These authors contributed equally to this work.
Appl. Sci. 2022, 12(1), 471; https://doi.org/10.3390/app12010471
Submission received: 23 November 2021 / Revised: 22 December 2021 / Accepted: 30 December 2021 / Published: 4 January 2022
(This article belongs to the Topic Applied Computer Vision and Pattern Recognition)

Abstract

:
By virtue of their upright locomotion, similar to that of humans, motion analysis of non-human primates has been widely used in order to better understand musculoskeletal biomechanics and neuroscience problems. Given the difficulty of conducting a marker-based infrared optical tracking system for the behavior analysis of primates, a 2-dimensional (D) video analysis has been applied. Distinct from a conventional marker-based optical tracking system, a depth image sensor system provides 3-D information on movement without any skin markers. The specific aim of this study was to develop a novel algorithm to analyze the behavioral patterns of non-human primates in a home cage using a depth image sensor. The behavioral patterns of nine monkeys in their home cage, including sitting, standing, and pacing, were captured using a depth image sensor. Thereafter, these were analyzed by observers’ manual assessment and the newly written automated program. We confirmed that the measurement results from the observers’ manual assessments and the automated program with depth image analysis were statistically identical.

1. Introduction

The motion analysis of non-human primates provides vital data of animal behavior for neuroscience studies. [1,2,3,4,5] Non-human primates serve as the important animal models for behavioral and cognitive studies because of their similarity to humans. They also serve as crucial models of degenerative brain diseases, such as Alzheimer’s disease, Parkinson’s disease, and stroke [6,7,8,9]. In all of these studies, behavioral data were essential to support the hypothesis of the studies. Since behavior and neural activity are related, it is possible to verify what kind of neural activity changes have occurred through behavior observation [10,11]. Therefore, many studies have measured non-human primate behavior through video recording or direct observation by researchers [12,13,14,15]. These conventional methods are limited in that it is difficult to reproduce the measurement results due to human errors and the subjective decisions made by individual researchers, given that the researchers did not complete all of the measurements of all of the behavioral events.
To address these limitations, behavioral research methods have been gaining traction and evolving as such. Computer-based methods have been developed to overcome the limitations of conventional methods [16,17,18,19]. There is a commercially available marker-based motion capture system with a very high accuracy; however, it is not applicable to non-human primates. Flexible skin prevents the tight, correct attachment of markers, and, even if attached, long and dense fur makes it difficult for the machine to detect markers [20]. Animals can also freely move their hands to remove markers attached to their skin as a result of their instinctive curiosity. To address these challenges, advanced markerless research methods have been developed. Markerless measurement methods based on deep neural networks (DNNs), which are calculation algorithms made by simple units consisting of one layer and then stacked in series to form deep networks, have been developed [21,22,23,24,25]. The generated skeleton model and multiple cameras were used to measure the movement of freely moving monkeys without using markers; in a recent study, motion capture was performed in a separate monkey studio with 62 cameras [9,20]. These methods construct 3D images by overlapping 2D images captured by multiple cameras, and then measure behaviors by applying this to a pre-made skeleton model. These methods are limited in that researchers have to intervene during measurements to minimize the free joint movement of monkeys and to avoid one body part covering another. Research intervention as such affects reproducibility of the measurement. In addition, multiple cameras are required for multiple angles, and dissimilar to a home cage, a specific measurement cage is also required, incurring a high cost.
The aim of this study was to develop an automated behavioral pattern analysis program for a non-human primate in a home cage based on a single depth image camera. From the depth images, it is possible to obtain spatial information about the orthogonal direction of the 2-D object plane, which is a very important factor in measuring the behavior of monkeys moving in three dimensions. We designed the program to automatically measure the monkey’s behavior by tracking and calculating the center of the object and height information obtained from the depth images. There are three types of measurable behaviors: sitting, standing, and pacing. The duration of each behavior was measured using the automated program. To verify the reliability of the program, we measured the behaviors of a total of nine monkeys and compared the results with the manual measurements of two observers. In this method, a single depth image camera was used, and measurements were performed in individual home cages in which the monkeys originally resided.

2. Materials and Methods

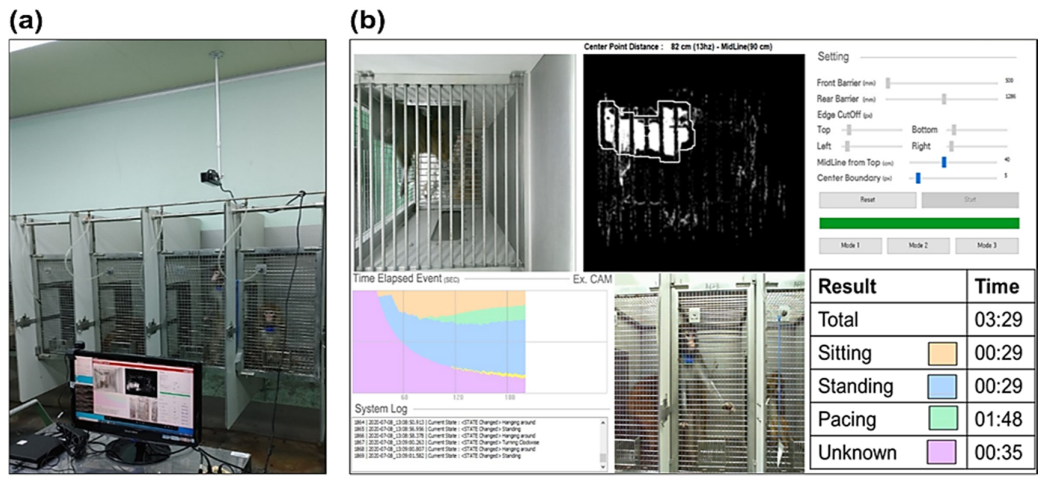
2.1. Development of an Automated Behavioral Pattern Analysis Program

The automated behavioral pattern analysis program, using a depth-image camera, was developed as follows. The automated analysis program for classifying behavioral patterns was mainly based on background elimination and object tracking algorithms, which include the Gaussian mixture model, morphological filtering, centroid, noise reduction, and classification algorithms. To eliminate unnecessary parts around the cage from the depth image, a 3-D region of interest was defined inside the volumetric area of the cage (width × depth × height = 50 cm × 100 cm × 84 cm).
The automated program consisted of the following procedures (Figure 1).
  • Importing real time image frames: a camera (Microsoft Kinect V2 Window) we used for capturing motions of object has 2 types of camera module, one is a RGB images sensor for gathering ColorFrame and the other is depth sensor for acquiring DepthFrame images. Both were utilized as raw images and imported to the analysis computer in real time;
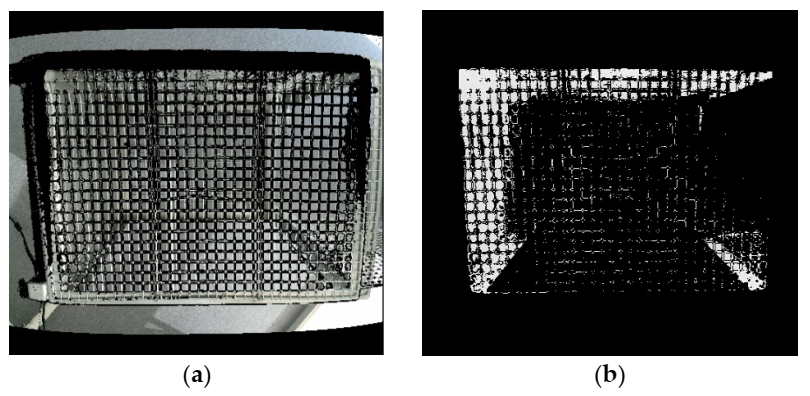
  • Image mapping: the ColorFrame, obtained from RGB image sensor module, and Depth Frame from a depth sensor have different image resolutions. The MS Kinect V2 provides 1920 × 1080 resolution by RGB images and 512 × 424 resolution by depth images. For mapping two different resolution images, we merged ColorFrame with DepthFrame as Figure 1a. Both merged images and raw images from a depth camera were utilized in following steps;
3.
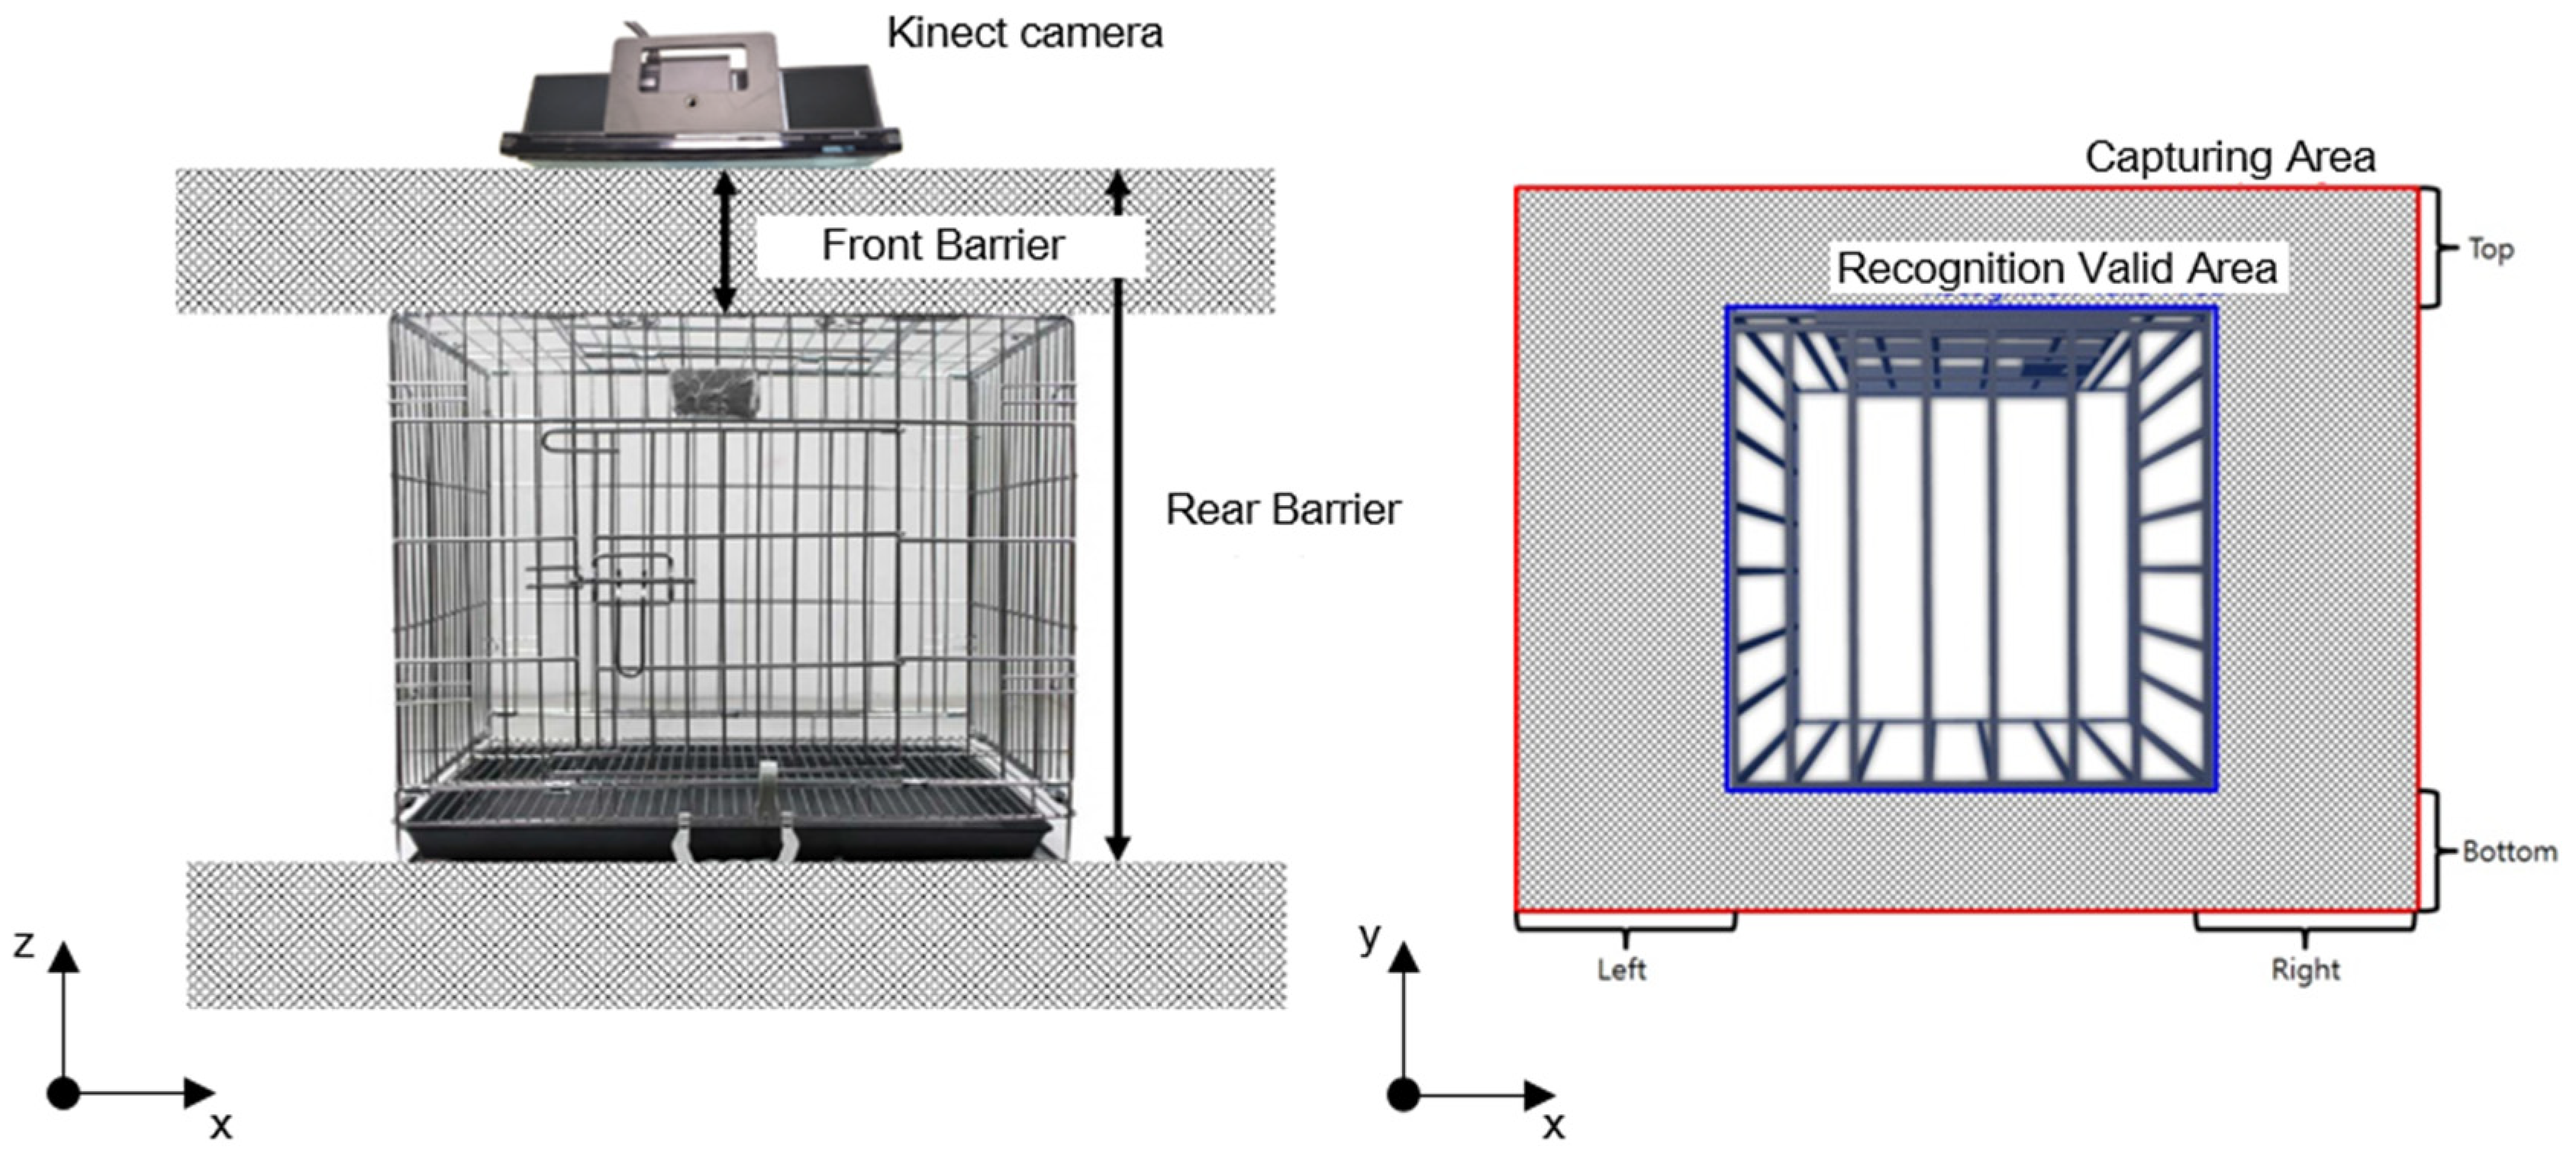
Region of interest selection: in order to select the region of interest (ROI) inside a cage in the z direction, image data between the depth camera and the top of cage denoted as “Front Barrier” and image data below the bottom of the cage denoted as “Rear Barrier” were eliminated (Figure 2);
4.
In order to select the ROI inside a cage in the z-y plane, image data outside a cage were eliminated. The removal area is shown as a grey rectangular box in which each side is denoted as “Top,” “Bottom,” “Left,” and “Right” (Figure 2). Figure 1b depicted processed images after applying step 3 and step 4 to raw images;
5.
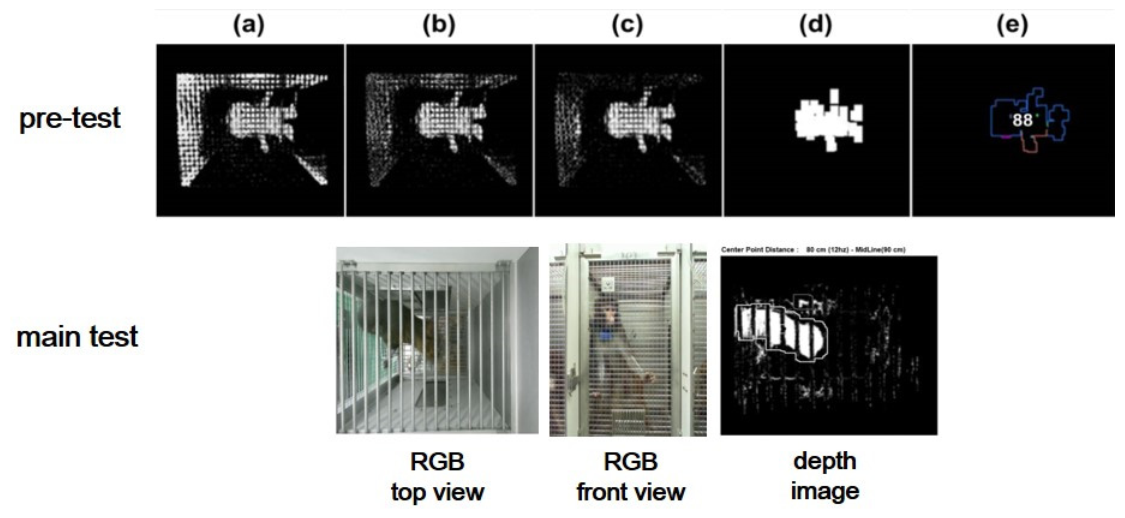
Noise reduction: after recording 30 frames of image data, the pixels which underwent a small change equal to the specified value were removed (Figure 3a). Then, the “blur” function was used to eliminate minor noise in the image data (Figure 3b). The minor noise is defined as unnecessary pixels for object identification and disregarded for enhancing following image processing steps;
6.
Background elimination: the “BackgroundSubtractorMOG2” in OpenCV was used for separating the targeted object from raw images based on Gaussian mixture method to eliminate background (Figure 3c). We can acquire a clear object image through this processing step;
7.
2nd noise reduction: any group of pixels smaller than 5-pixel size of processing image were considered as a noise and replaced by black (0 value) pixels. Then, we applied a “Morphology method” three times from “dilate” to “erode” for obtaining clear object image. The “dilate” processing converted the positive pixels into the most bright value of the image while the “erode” processing changed negative pixels to the darkest value (Figure 3d);
8.
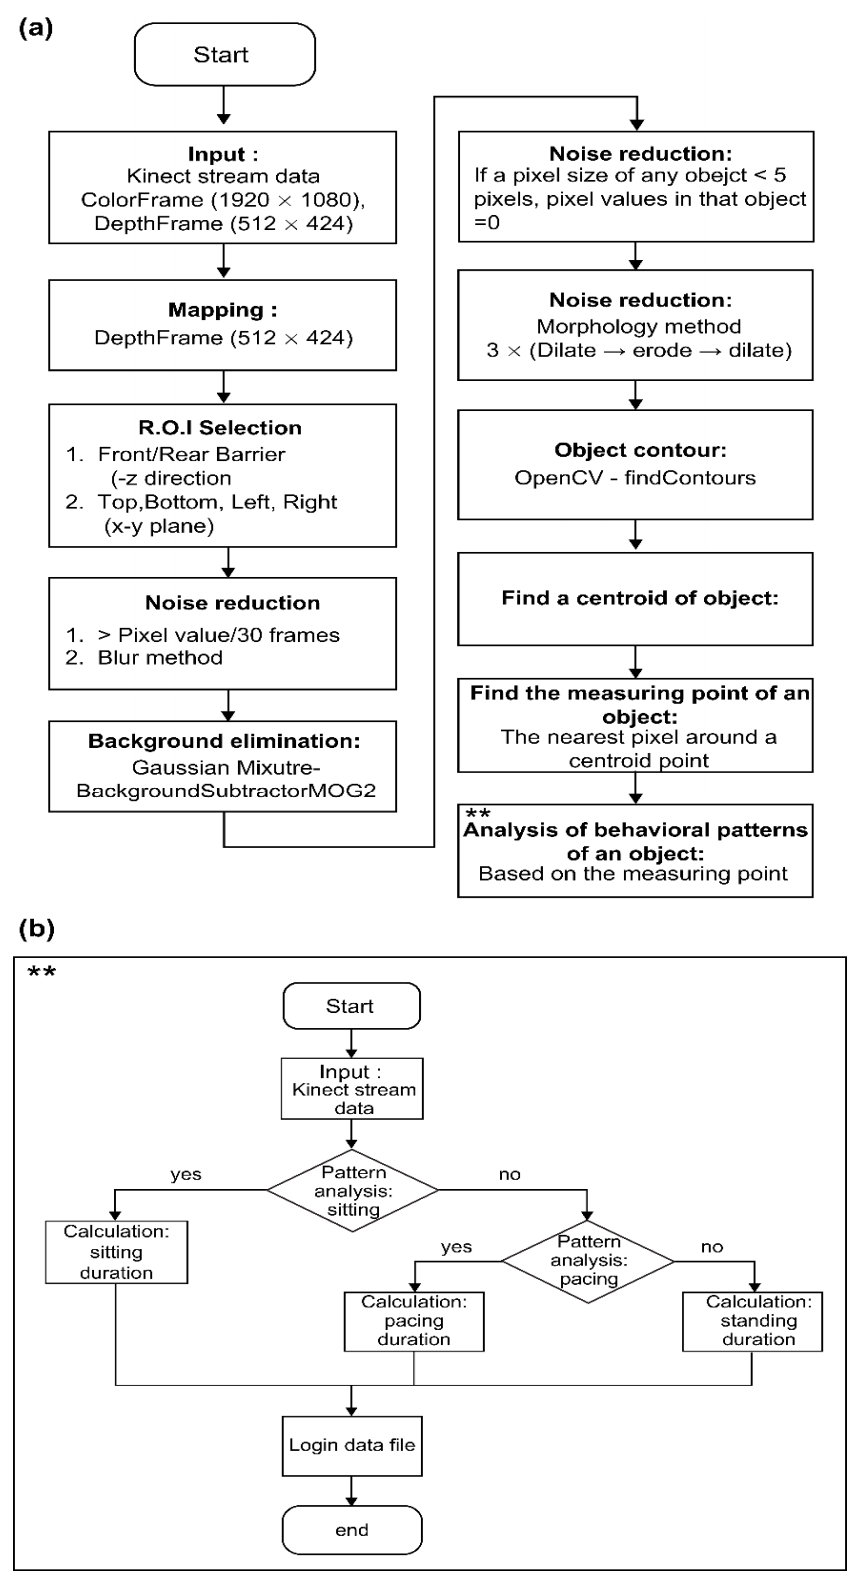
Creating contour and a center spot: the “findCountours” in OpenCV was used to create the contour of an object. After adopting contouring algorithm to the images, we were able to get a refined shape of the object. Then, we applied “Centroid Based” algorithm in Open CV for finding a center spot of the image;
9.
Find the representing point of an object: rhe centroid of an object was tracked in real time and the pixel of the smallest depth value inside the centroid area as the measuring point of an object was found. “The centroid area” is defined by the rectangular area which has one side measuring 5~10 pixels, and “the smallest depth value” inside the centroid area approximately represents the head of an experimental monkey (Figure 3e).
10.
Calculating behavioral patterns: based on the measurement point of an object obtained (9), we classified sitting, standing, and pacing by measuring the duration of each behavior. The classifying criteria of each pattern were defined based on being maintained for 1 s. The corresponding logical flow chart is shown in Figure 4.

2.2. Behavior Pattern Experiment and Analysis

For the behavioral pattern analysis, nine monkeys (aged approximately nine years) were used in this study. The subjects were considered “young,” according to the age classification standards for humans to macaques. All of the procedures were approved by the K Korea Research Institute of Bioscience and Biotechnology Institutional Animal Care and Use Committee. Behavioral data of monkeys in a stainless-steel-wire-mesh home cage were collected for 15 min using a Kinect camera (Figure 5). Three activities were classified: sitting, standing, and pacing. Each activity pattern is defined as shown in Table 1. All of the activities were quantified for duration (in seconds). The data were also analyzed by two trained examiners for verification.

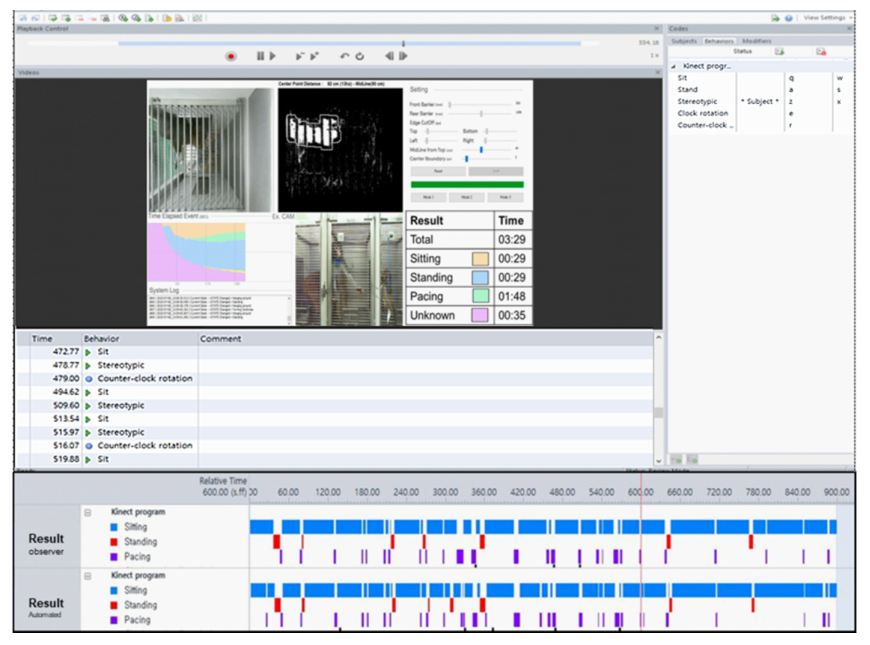
2.3. Manual Analysis Using Observer XT

To confirm the accuracy of the program, two observers manually rated the behavioral patterns using “Observer XT” software (Noldus Information Technology, Wageningen, The Netherlands) for the same measurement section as the automated program, and compared the durations of each behavioral pattern with those rated by the automated program. Observer XT is a semi-automated software used for behavioral event coding and data analysis. The user has to manually decide behavioral patterns while watching a video clip. It can perform all processes, such as target behavior setting, event coding, and result analysis (Figure 6).

3. Results

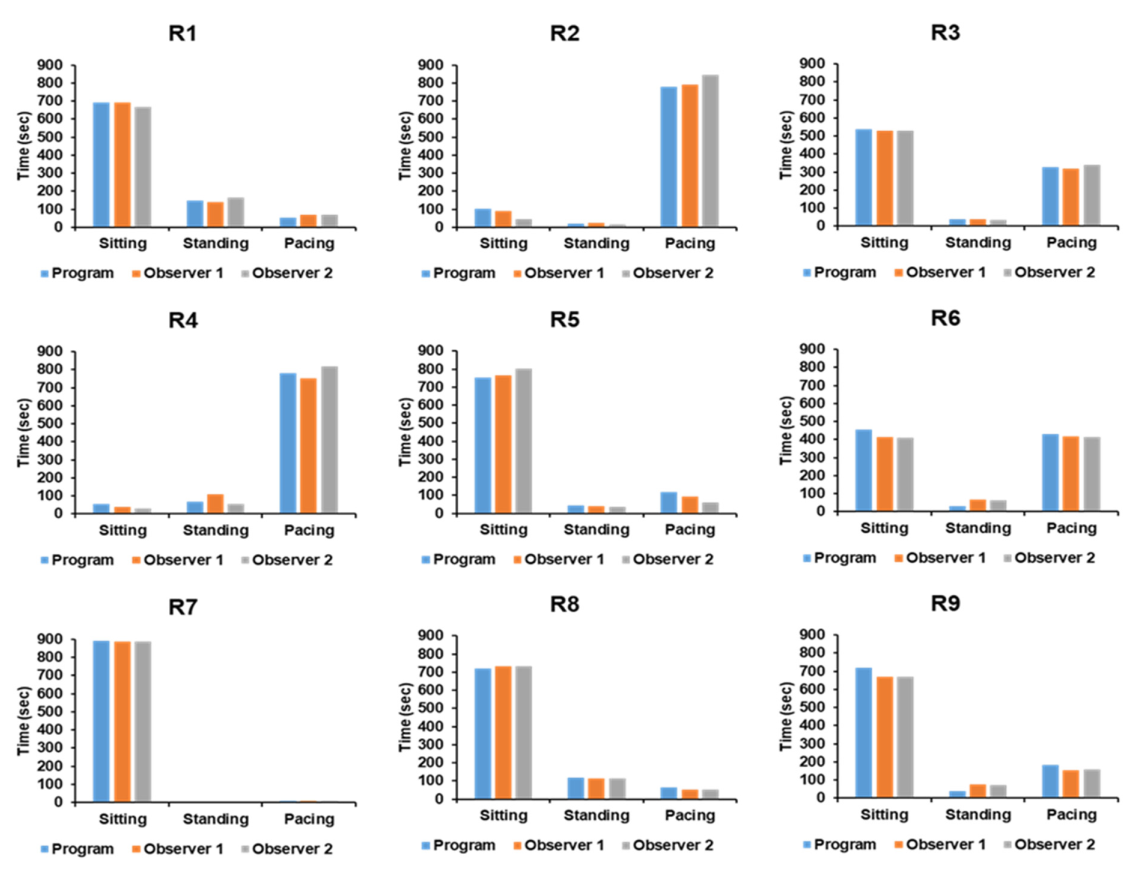
3.1. Measurement Results of Observer #1 and the Automated Program

The observer #1 and the automated program for analyzing depth images measured 535.89 s and 543.78 s for total sitting time, respectively. There were no significant differences between the 2 measurements (Table 2. N = 9, t = −1.268, p = 0.240). Observer #1 and the automated program for analyzing depth images measured 68.00 s and 55.67 s for total standing time, respectively. There were no significant differences between the 2 measurements (Table 2. N = 9, t = 1.933, p = 0.089). Observer #1 and the automated program for analyzing depth images measured 296.00 s 304.78 s for the total pacing time, respectively. There were no significant differences between the 2 measurements (Table 2. N = 9, t = −1.963, p = 0.085). As shown above, there was no statistical difference between the results of observer #1 and the program measurement in the action time of the monkeys’ behavioral patterns, including sitting, standing, and pacing. These two measurements were statistically identical.

3.2. Measurement Results of Observer #2 and the Automated Program

Observer #2 and the automated program for analyzing depth images measured 529.67 s and 543.78 s for total sitting time, respectively. There was no significant difference between the 2 measurements (Table 3, N = 9, t = −1.324, p = 0.222). Observer #2 and the automated program for analyzing depth images measured 62.00 s and 55.67 s for total standing time, respectively. (Table 3, N = 9, t = 1.115, p = 0.297). Observer #2 and the automated program for analyzing depth images measured 308.33 s and 304.78 s for total pacing time, respectively. There were no significant differences between the two measurements (Table 3, N = 9, t = 0.340, p = 0.743). As shown above, there was no statistical difference between the values of observer #2 and the program measurement in the action time of the monkeys’ behavioral patterns, including sitting, standing, or pacing. The two measurements were statistically identical (p > 0.05).
The measurement results of two observers and the automated program for analyzing depth images were revealed to be statistically identical (Table 4, Figure 7).

3.3. Statistical Analysis

The data collected in this study were statistically analyzed using SPSS Win (ver. 25.0) program. Before data analysis, Kolmogorov-Smirnov and Shapiro-Wilk tests were performed to confirm the normality of measurements. If normality was satisfied, the paired t-test was tested; if not, the Wilcoxon signed-rank test was used. The significance level for all of the statistical analyses was p < 0.005.

4. Discussion

We developed an automated analysis program for behavioral patterns of non-human primates on the basis of depth image video. The program developed in this study was able to measure selected behavioral patterns of non-human primates in a home cage with a single low-cost depth image camera. The program measured “sitting” and “standing” according to the information of the depth image, and measured “pacing” according to the movement of the center of objects.
Non-human primates are important experimental models for a wide range of scientific fields. Therefore, conducting a quantitative analysis of their behavior is of great relevance. Since primates move in three-dimensional space, have joints that move freely, and use hands, motion capture data using conventional methods are consequently very difficult to analyze. Recently, markerless motion capture systems have been developed not only for humans, but also for various experimental animals, such as flies, mice, and rats [9,10,20,21,26,27]. In previous studies, motion capture of non-human primates was achieved using a Kinect camera and skeleton image [9]. Although researcher intervention was necessary, the motion capture of primates was effectively accomplished using this method. However, these studies had the disadvantage of requiring a large number of cameras and a specific measurement space. To provide an alternative method, this study proposed measuring the behavioral patterns of primates in a private cage in which they were housed with a single depth image camera. In this study, the analysis results of the automated program were not statistically different from those measured by the two observers. Therefore, our automated program is highly reliable for measuring and classifying selected behaviors of non-human primate in their home cages.
Behavioral research is also important in many studies of degenerative brain diseases [28]. In many diseases, symptoms related to behavior, such as hyperactivity, bradykinesia, tremor, and gait disorder, progressively emerge. When developing animal models of disease, it is crucial to reproduce behavioral symptoms similar to that of humans, and it is also important to quantitatively evaluate the symptoms. These behavioral symptoms are generally diagnosed through questionnaires or observer evaluations in humans. However, since these methods are not applicable to primates, a method of evaluating behaviors that reflects the emotions and intentions of primates is needed. In many previous studies, behavioral evaluations were performed to assess the motor and cognitive abilities of animal models, and, in some cases, behavioral measurement results were used as an indicator of modeling [4,5,29]. Our automated program correctly classified selected behavior, and may be used as a powerful evaluation tool in disease models, such as Parkinson’s and ataxia, characterized by prominent behavioral symptoms. Moreover, since our cost effective system is a relatively simple and easy to install on each cage, one of applications would be monitoring multiple cages simultaneously in a large animal facility.
The automated program developed in this study could not measure the small movements of body parts, such as the hands or head. The program categorized and measured the selected large movements such as sitting, standing, pacing based on the height information obtained from the depth image and the movement speed of the center of an object. In addition, it is not able to measure the rotation of an object using the automated program in this study since the algorithm in the program tracks and only calculates the center of the object. To classify a rotation in the further study, it is necessary to detect the overall shape of an object and measure the relative movement of the front with regard to the tail.
In addition, this automated program was limited in that only a single object could be measured at a time. Social interactions are essential for species that form social groups. Since primates are animals that form social groups, it is important to identify social interactions; however, our program measured only a single individual. By continuing to address these problems, it will eventually be possible to simultaneously measure the behaviors of several primates using the program. Furthermore, only three major behaviors are automatically classified in the proposed program. Pacing can be specified as translation and circulation. Circulation should also be classified in the further study.
In this study, we proposed an automated behavioral pattern analysis program based on depth images captured by a single low-cost depth image camera. There was no significant difference in the measurement results between the automated program and the observers. The automated program categorized and measured the selected behaviors of primates such as sitting, standing, and pacing well. Therefore, it is expected that the automated program will provide an effective analytical measurement tool for the selected behavior of non-human primate in individual cage for future behavior studies.

Author Contributions

Conceptualization, S.K.H., Y.R., Y.L. and K.J.C.; Data curation, S.K.H., K.K., Y.R. and M.H.; Formal analysis, S.K.H., K.K., Y.R. and M.H.; Funding acquisition, S.K.H., Y.L. and K.J.C.; Investigation, S.K.H., K.K., Y.R., M.H., Y.L., S.-H.P. and W.S.C.; Methodology, S.K.H., K.K., Y.R., M.H., S.-H.P. and W.S.C.; Resources, S.-H.P. and W.S.C.; Software, S.K.H., Y.R. and M.H.; Supervision, S.K.H., Y.L. and D.-S.L.; Validation, K.K.; Visualization, K.K. and Y.R.; Writing—original draft, S.K.H., K.K., Y.R., M.H., Y.L., K.J.C. and D.-S.L.; Writing—review & editing, S.K.H., K.K., Y.L. and D.-S.L. All authors have read and agreed to the published version of the manuscript.

Funding

This work was supported by the Korea Medical Device Development Fund grant funded by the Korea government (the Ministry of Science and ICT, the Ministry of Trade, Industry and Energy, the Ministry of Health & Welfare, the Ministry of Food and Drug Safety) (Project Number: 9991006929, KMDF_PR_20200901_0264), Korea Research Institute of Bioscience and Biotechnology Research Initiative Program (KGM4562121, NBW6862122) and the Korea Institute of Industrial Technology (IJ170004).

Institutional Review Board Statement

This study was approved by the Korea Research Institute of Bioscience and Biotechnology Institutional Animal Care and Use Committee (approval no. KRIBB-AEC-15031).

Informed Consent Statement

Not applicable.

Data Availability Statement

The data presented in this study are available on request from the corresponding author.

Acknowledgments

We would like to thank to Ho Yong Choi and Seon Su Jang for helping us evaluate the behavior as observers, and to Sang-Rae Lee at the Ajou University in Korea and Kyu-Tae Chang, the past president of Korea Research Institute of Bioscience and Biotechnology, for designing and advising this study.

Conflicts of Interest

The authors declare no conflict of interest.

References

  1. Rhesus Macaque Genome, S.; Analysis, C.; Gibbs, R.A.; Rogers, J.; Katze, M.G.; Bumgarner, R.; Weinstock, G.M.; Mardis, E.R.; Remington, K.A.; Strausberg, R.L.; et al. Evolutionary and biomedical insights from the rhesus macaque genome. Science 2007, 316, 222–234. [Google Scholar] [CrossRef] [Green Version]
  2. Bailey, J.; Taylor, K. Non-human primates in neuroscience research: The case against its scientific necessity. Altern. Lab. Anim. 2016, 44, 43–69. [Google Scholar] [CrossRef] [PubMed] [Green Version]
  3. Kessler, M.J.; Berard, J.D.; Rawlins, R.G. Effect of tetanus toxoid inoculation on mortality in the Cayo Santiago macaque population. Am. J. Primatol. 1988, 15, 93–101. [Google Scholar] [CrossRef] [PubMed]
  4. Watson, K.K.; Platt, M.L. Of mice and monkeys: Using non-human primate models to bridge mouse- and human-based investigations of autism spectrum disorders. J. Neurodev. Disord. 2012, 4, 21. [Google Scholar] [CrossRef] [PubMed] [Green Version]
  5. Seo, J.; Lee, Y.; Kim, B.S.; Park, J.; Yang, S.; Yoon, H.J.; Yoo, J.; Park, H.S.; Hong, J.J.; Koo, B.S.; et al. A non-human primate model for stable chronic Parkinson’s disease induced by MPTP administration based on individual behavioral quantification. J. Neurosci. Methods 2019, 311, 277–287. [Google Scholar] [CrossRef]
  6. Kalin, N.H.; Shelton, S.E. Nonhuman primate models to study anxiety, emotion regulation, and psychopathology. Ann. N. Y. Acad. Sci. 2003, 1008, 189–200. [Google Scholar] [CrossRef] [PubMed]
  7. Capitanio, J.P.; Emborg, M.E. Contributions of non-human primates to neuroscience research. Lancet 2008, 371, 1126–1135. [Google Scholar] [CrossRef]
  8. Nelson, E.E.; Winslow, J.T. Non-human primates: Model animals for developmental psychopathology. Neuropsychopharmacology 2009, 34, 90–105. [Google Scholar] [CrossRef]
  9. Nakamura, T.; Matsumoto, J.; Nishimaru, H.; Bretas, R.V.; Takamura, Y.; Hori, E.; Ono, T.; Nishijo, H. A Markerless 3D Computerized Motion Capture System Incorporating a Skeleton Model for Monkeys. PLoS ONE 2016, 11, e0166154. [Google Scholar] [CrossRef] [Green Version]
  10. Dell, A.I.; Bender, J.A.; Branson, K.; Couzin, I.D.; de Polavieja, G.G.; Noldus, L.P.; Perez-Escudero, A.; Perona, P.; Straw, A.D.; Wikelski, M.; et al. Automated image-based tracking and its application in ecology. Trends Ecol. Evol. 2014, 29, 417–428. [Google Scholar] [CrossRef]
  11. Krakauer, J.W.; Ghazanfar, A.A.; Gomez-Marin, A.; MacIver, M.A.; Poeppel, D. Neuroscience Needs Behavior: Correcting a Reductionist Bias. Neuron 2017, 93, 480–490. [Google Scholar] [CrossRef] [Green Version]
  12. Schwarz, D.A.; Lebedev, M.A.; Hanson, T.L.; Dimitrov, D.F.; Lehew, G.; Meloy, J.; Rajangam, S.; Subramanian, V.; Ifft, P.J.; Li, Z.; et al. Chronic, wireless recordings of large-scale brain activity in freely moving rhesus monkeys. Nat. Methods 2014, 11, 670–676. [Google Scholar] [CrossRef]
  13. Courellis, H.S.; Nummela, S.U.; Metke, M.; Diehl, G.W.; Bussell, R.; Cauwenberghs, G.; Miller, C.T. Spatial encoding in primate hippocampus during free navigation. PLoS Biol. 2019, 17, e3000546. [Google Scholar] [CrossRef]
  14. Labuguen, R.; Bardeloza, D.; Negrete, S.; Matsumoto, J.; Inoue, K.-I.; Shibata, T. Primate Markerless Pose Estimation and Movement Analysis Using DeepLabCut. In Proceedings of the 2019 Joint 8th International Conference on Informatics, Electronics & Vision (ICIEV) and 2019 3rd International Conference on Imaging, Vision & Pattern Recognition (icIVPR), Washington, DC, USA, 30 May–2 June 2019; pp. 297–300. [Google Scholar]
  15. Liu, S.; Iriate-Diaz, J.; Hatsopoulos, N.G.; Ross, C.F.; Takahashi, K.; Chen, Z. Dynamics of motor cortical activity during naturalistic feeding behavior. J. Neural. Eng. 2019, 16, 026038. [Google Scholar] [CrossRef]
  16. Crall, J.D.; Gravish, N.; Mountcastle, A.M.; Combes, S.A. BEEtag: A Low-Cost, Image-Based Tracking System for the Study of Animal Behavior and Locomotion. PLoS ONE 2015, 10, e0136487. [Google Scholar] [CrossRef] [Green Version]
  17. Cao, Z.; Hidalgo, G.; Simon, T.; Wei, S.E.; Sheikh, Y. OpenPose: Realtime Multi-Person 2D Pose Estimation Using Part Affinity Fields. IEEE Trans. Pattern. Anal. Mach. Intell. 2021, 43, 172–186. [Google Scholar] [CrossRef] [Green Version]
  18. Mathis, A.; Mamidanna, P.; Cury, K.M.; Abe, T.; Murthy, V.N.; Mathis, M.W.; Bethge, M. DeepLabCut: Markerless pose estimation of user-defined body parts with deep learning. Nat. Neurosci. 2018, 21, 1281–1289. [Google Scholar] [CrossRef]
  19. Fitzsimmons, N.A.; Lebedev, M.A.; Peikon, I.D.; Nicolelis, M.A. Extracting kinematic parameters for monkey bipedal walking from cortical neuronal ensemble activity. Front Integr. Neurosci. 2009, 3, 3. [Google Scholar] [CrossRef] [Green Version]
  20. Bala, P.C.; Eisenreich, B.R.; Yoo, S.B.M.; Hayden, B.Y.; Park, H.S.; Zimmermann, J. Automated markerless pose estimation in freely moving macaques with OpenMonkeyStudio. Nat. Commun. 2020, 11, 4560. [Google Scholar] [CrossRef]
  21. Mathis, M.W.; Mathis, A. Deep learning tools for the measurement of animal behavior in neuroscience. Curr. Opin. Neurobiol. 2020, 60, 1–11. [Google Scholar] [CrossRef]
  22. Graving, J.M.; Chae, D.; Naik, H.; Li, L.; Koger, B.; Costelloe, B.R.; Couzin, I.D. DeepPoseKit, a software toolkit for fast and robust animal pose estimation using deep learning. Elife 2019, 8, e47994. [Google Scholar] [CrossRef]
  23. Gunel, S.; Rhodin, H.; Morales, D.; Campagnolo, J.; Ramdya, P.; Fua, P. DeepFly3D, a deep learning-based approach for 3D limb and appendage tracking in tethered, adult Drosophila. Elife 2019, 8, e48571. [Google Scholar] [CrossRef]
  24. Libey, T.; Fetz, E.E. Open-Source, Low Cost, Free-Behavior Monitoring, and Reward System for Neuroscience Research in Non-human Primates. Front Neurosci. 2017, 11, 265. [Google Scholar] [CrossRef]
  25. Wang, Z.; Mirbozorgi, S.A.; Ghovanloo, M. Towards a kinect-based behavior recognition and analysis system for small animals. In Proceedings of the 2015 IEEE Biomedical Circuits and Systems Conference (BioCAS), Atlanta, GA, USA, 22–24 October 2015; pp. 1–4. [Google Scholar] [CrossRef]
  26. Foster, J.D.; Nuyujukian, P.; Freifeld, O.; Gao, H.; Walker, R.; Ryu, S.I.; Meng, T.H.; Murmann, B.; Black, M.J.; Shenoy, K.V. A freely-moving monkey treadmill model. J. Neural. Eng. 2014, 11, 046020. [Google Scholar] [CrossRef]
  27. Sellers, W.I.; Hirasaki, E. Markerless 3D motion capture for animal locomotion studies. Biol. Open 2014, 3, 656–668. [Google Scholar] [CrossRef] [Green Version]
  28. Emborg, M.E. Nonhuman Primate Models of Neurodegenerative Disorders. ILAR J. 2017, 58, 190–201. [Google Scholar] [CrossRef]
  29. Kim, K.; Jeon, H.A.; Seo, J.; Park, J.; Won, J.; Yeo, H.G.; Jeon, C.Y.; Huh, J.W.; Kim, Y.H.; Hong, Y.; et al. Evaluation of cognitive function in adult rhesus monkeys using the finger maze test. Appl. Anim. Behav. Sci. 2020, 224, 104945. [Google Scholar] [CrossRef]
Figure 1. (a) Merged image from ColorFrame + DepthFrame and (b) Image after applying step 3 and 4.
Applsci 12 00471 g001
Figure 2. A three dimensional R.O.I selection inside a cage.
Applsci 12 00471 g002
Figure 3. Automated program process for pre-test: (ad) background reduction and noise elimination, (e) centroid, centroid area and measuring point identification. RGB and depth images from main test.
Applsci 12 00471 g003
Figure 4. (a) Flow chart representing object contour creation, (b) Flow chart representing the behavioral pattern analysis. ** symbols in (a) and (b) indicate the process for the analysis of behavioral patterns.
Applsci 12 00471 g004
Figure 5. (a) Camera and computer system setting in the experiment: the camera was installed above the home cage and the number and during of the three behaviors were measured using the automate program. (b) User interface for the automated behavioral pattern analysis program.
Applsci 12 00471 g005
Figure 6. Program verification through Observer XT. Manual ratings of behaviors using Observer XT software and results including behavioral event and time.
Applsci 12 00471 g006
Figure 7. Comparison of measurement analysis from the automated program against two observers for each subject.
Applsci 12 00471 g007
Table 1. Ethogram (definition of behavior).
Definition
ProgramObserver
SittingWhen positioned for more than 1 s below the specified height without movementSitting without pacing and lasting longer than 1 s
StandingWhen positioned for more than 1 s above the specified height without movementStanding without pacing and lasting longer than 1 s
PacingWhen the measuring point moves more than 1 sPacing lasting more than 1 s
Table 2. Comparison of the measurement analysis between the automated program and the observer #1.
ActionObserver #1Programtp-Value
Mean ± SEMean ± SE
Sitting535.89 ± 99.92543.78 ± 98.19−1.2680.240
Standing68.00 ± 14.9455.67 ± 15.931.9330.089
Pacing296.00 ± 100.10304.78 ± 100.38−1.9630.085
Mean ± SE: mean ± standard error. t: paired t-test.
Table 3. Comparison of the measurement analysis between the automated program and the observer #2.
ActionObserver #2Programt/zp-Value
Mean ± SEMean ± SE
Sitting529.67 ± 103.99543.78 ± 98.19−1.3240.222
Standing62.00 ± 16.7655.67 ± 15.941.1150.297
Pacing 308.33 ± 108.80304.78 ± 100.380.3400.743
Mean ± SE: mean ± standard error. t: paired t-test. †(z): Wilcoxon signed ranks test.
Table 4. Comparison of raw data between measurement analysis from the automated program and two observers for each subject.
Subject #R1R2R3R4R5R6R7R8R9
SittingProgram69010253654751456891719717
Observer #16918853138766414887732671
Observer #26674652814801408889734669
StandingProgram1481938684232011737
Observer #113823411084066611574
Observer #21641434573662511572
PacingProgram54780326779116432964184
Observer #17178932175295419753155
Observer #26984433982661412852159
Publisher’s Note: MDPI stays neutral with regard to jurisdictional claims in published maps and institutional affiliations.

