
A Self-Attention Augmented Graph Convolutional Clustering Networks for Skeleton-Based Video Anomaly Behavior Detection


Abstract
:1. Introduction
2. Related Work
2.1. Video Anomaly Detection
2.2. Skeleton-Based Action Recognition
2.3. Transformer
2.4. Graph Convolutional Neural Networks
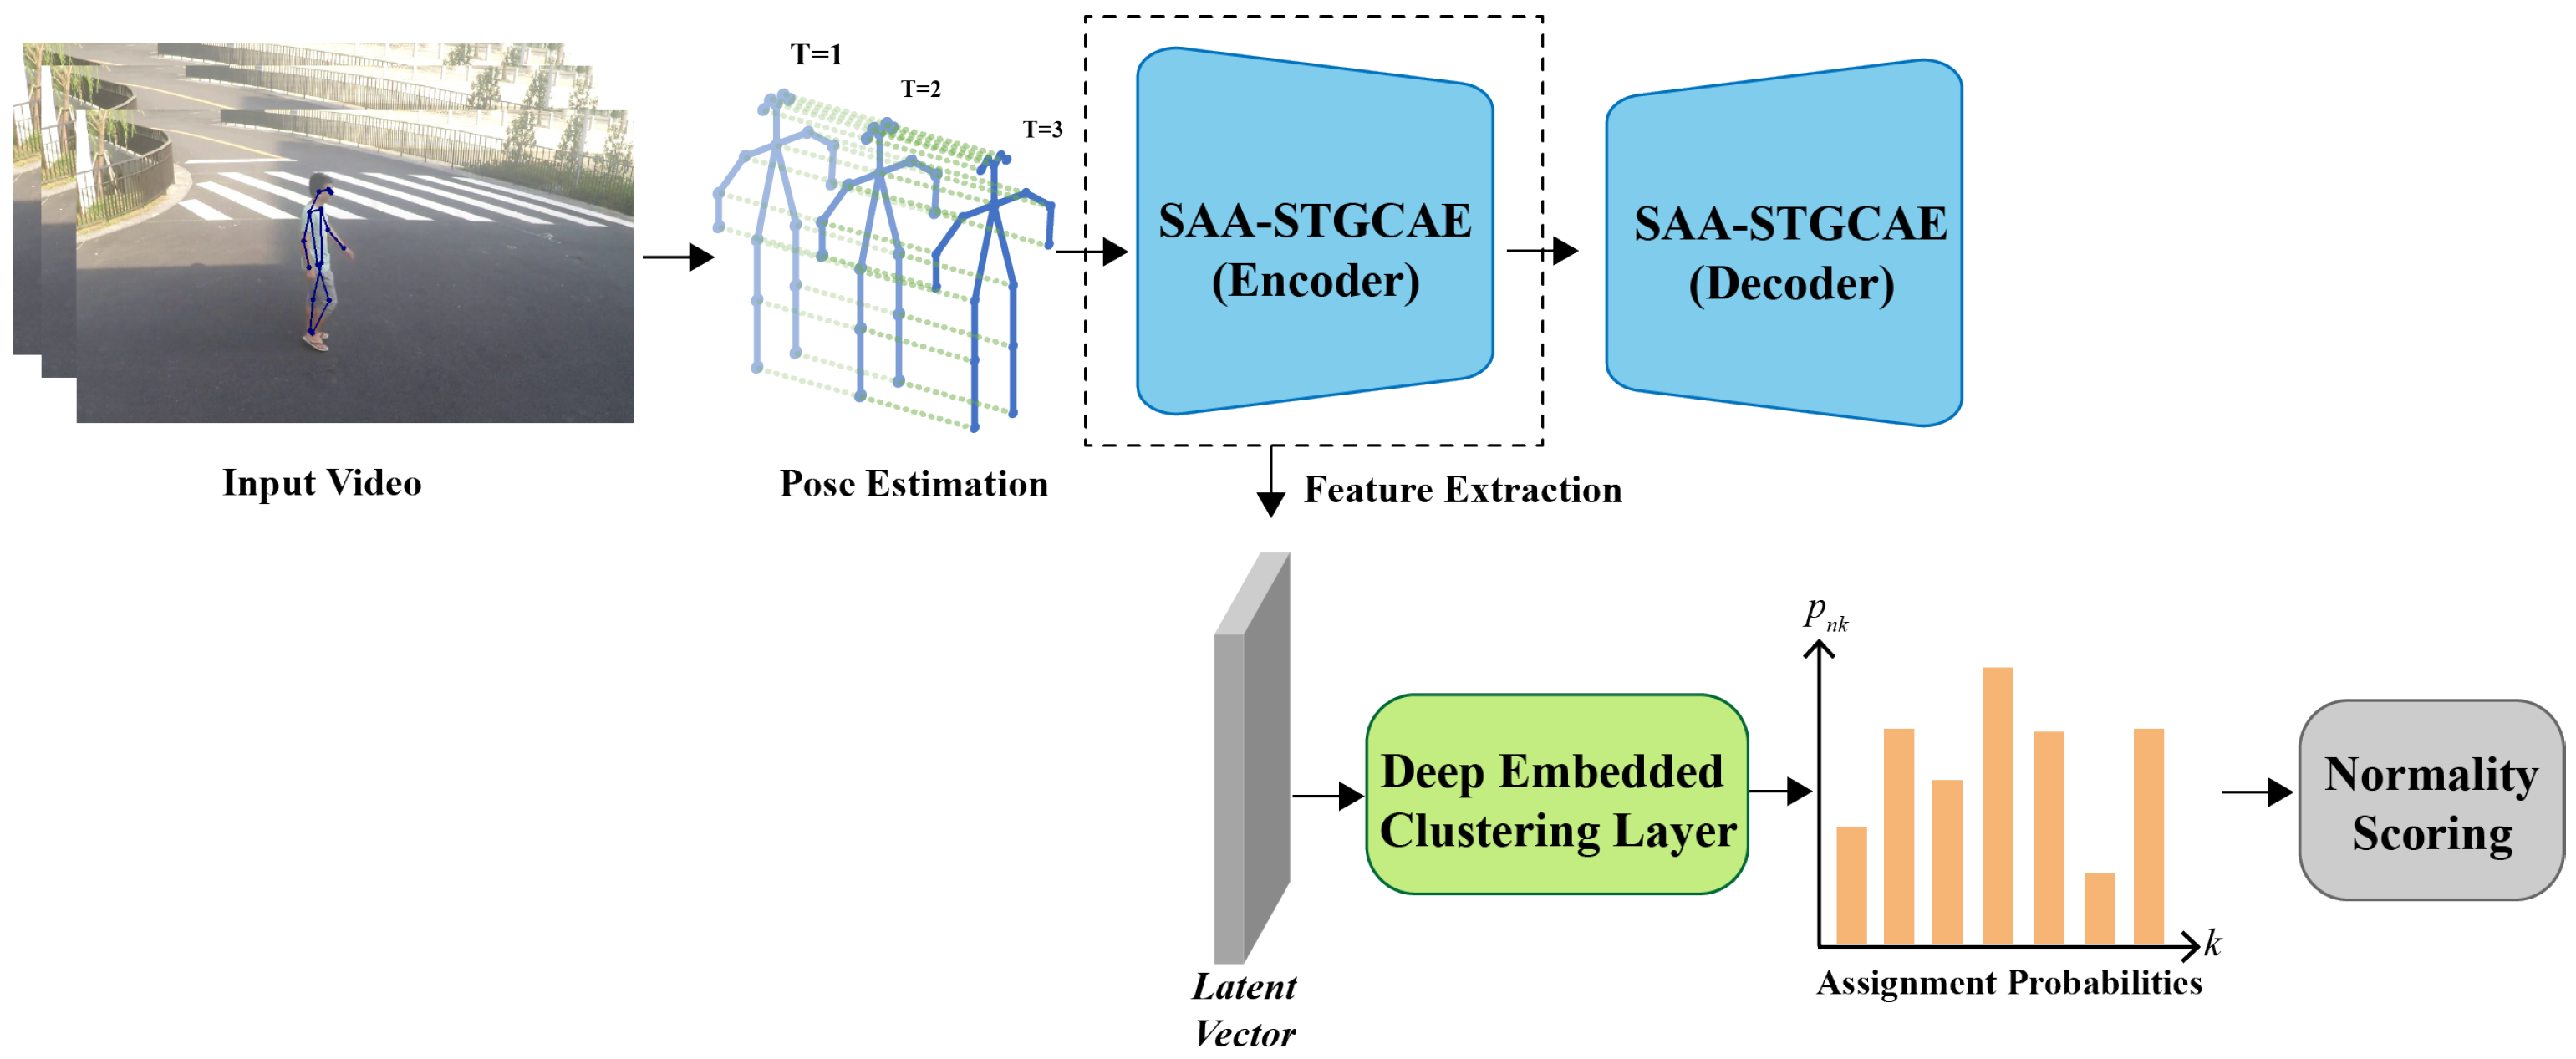
3. Proposed Method
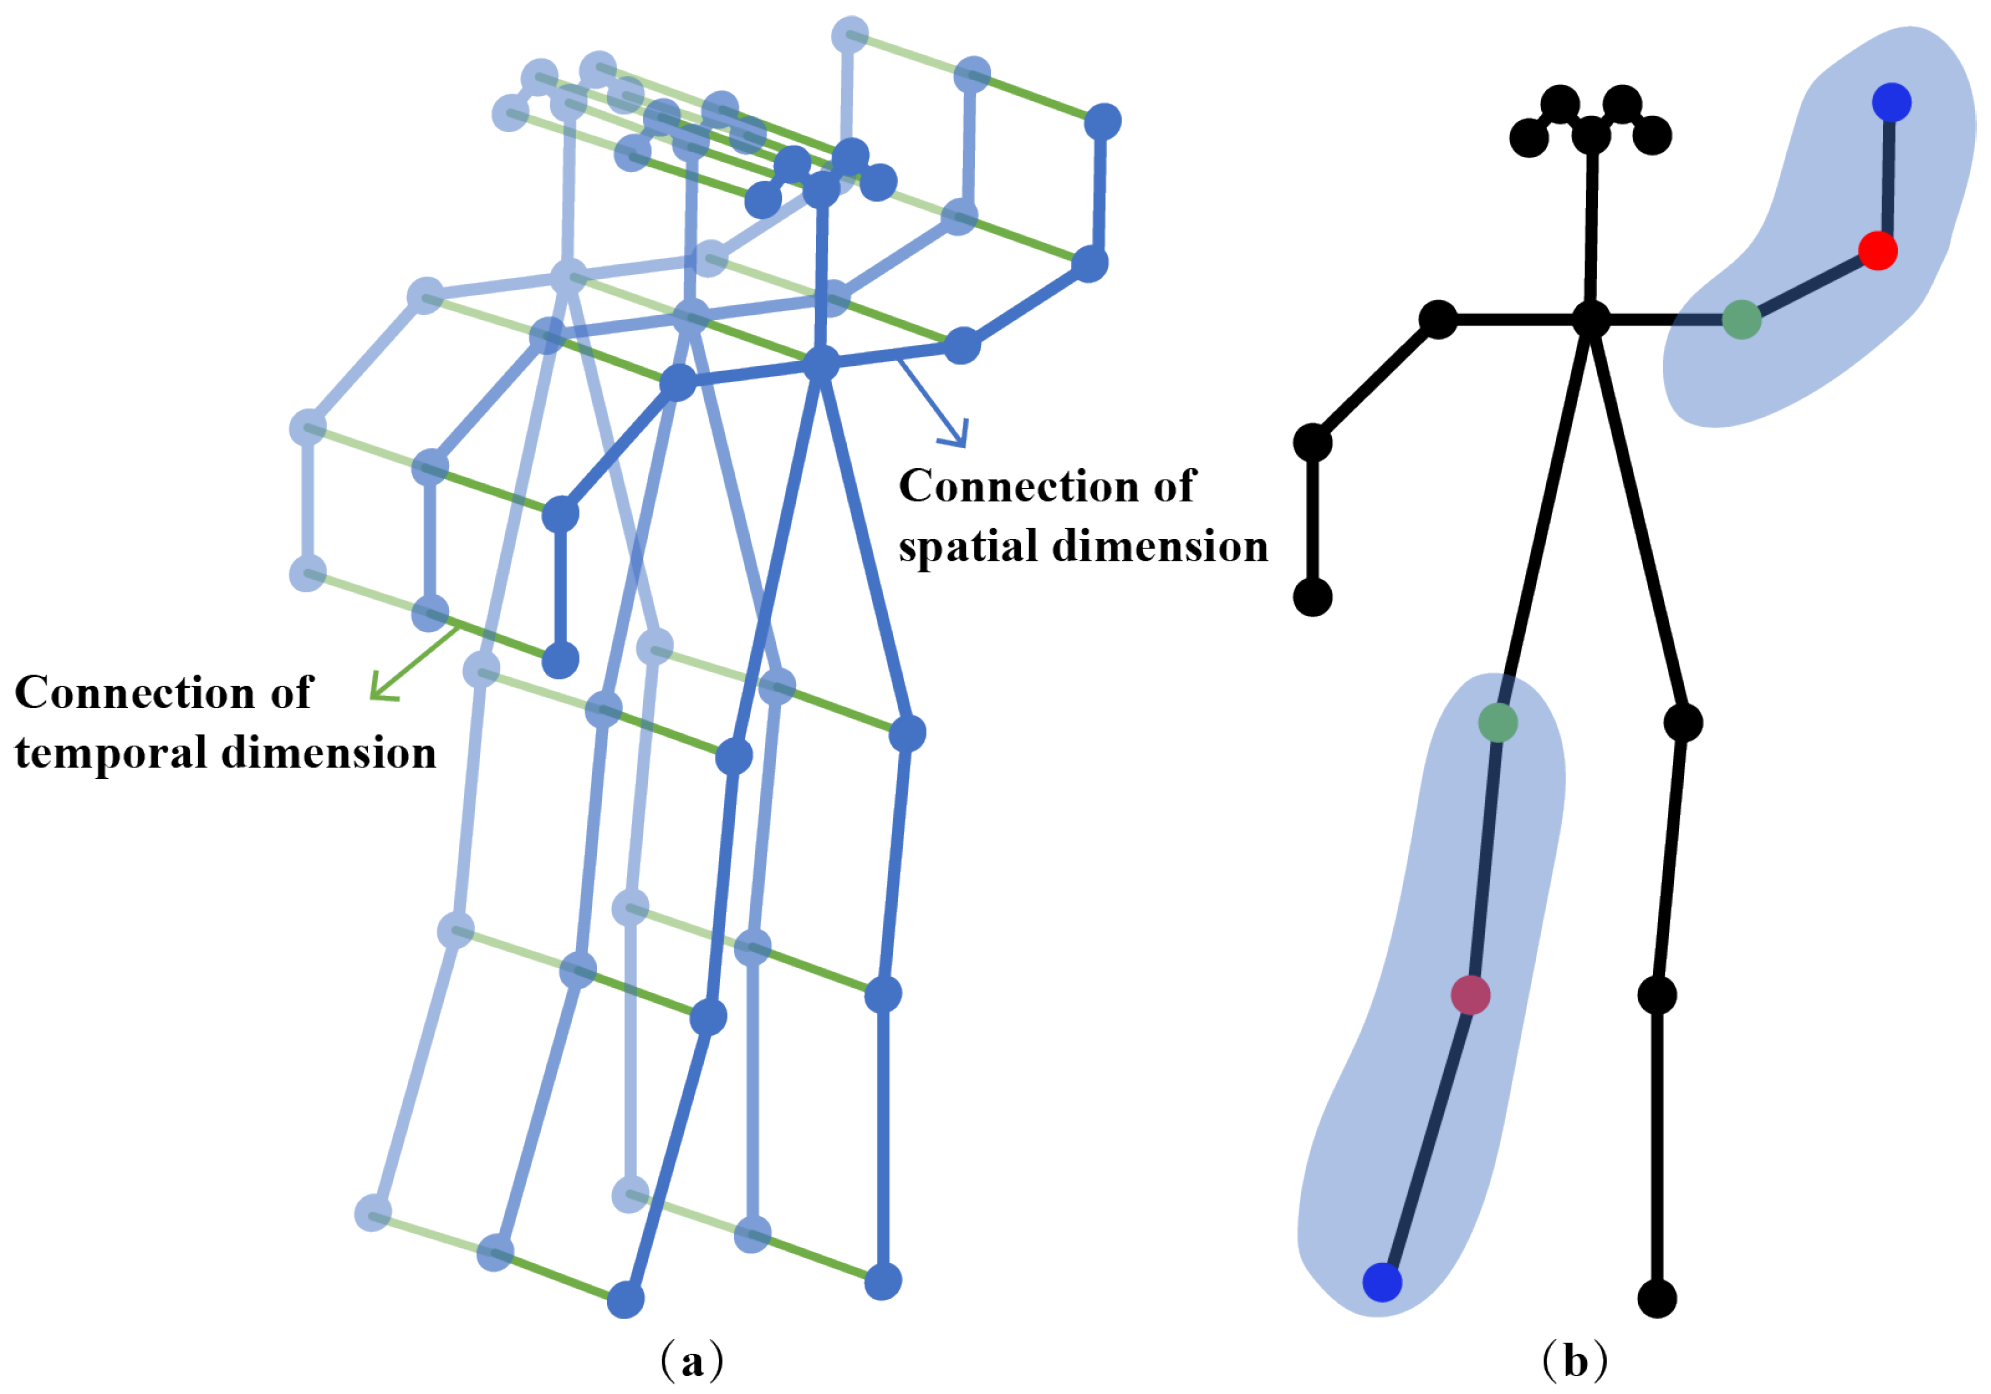
3.1. Spatiotemporal Graph Connection Configuration for Skeleton
3.2. Feature Extraction
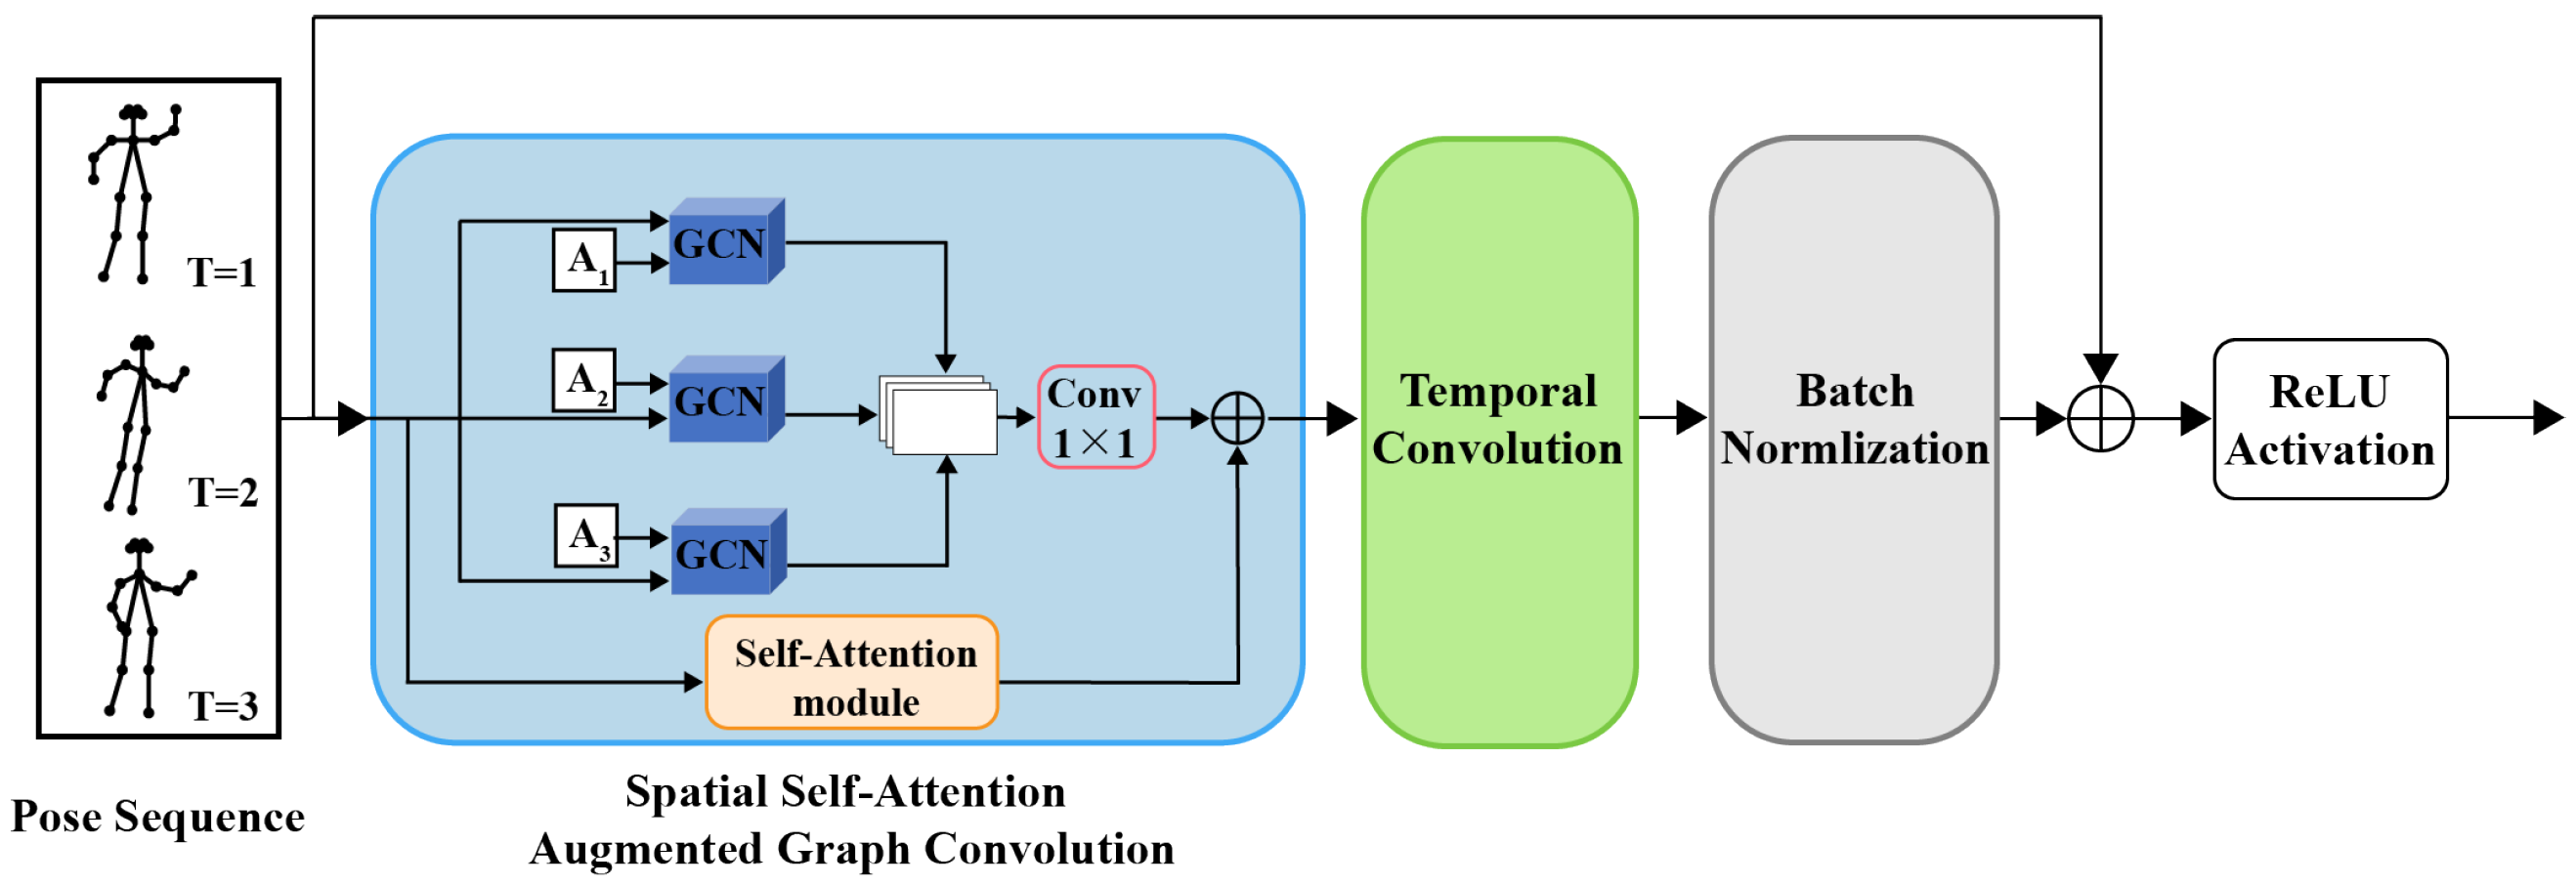
3.3. Spatial Self-Attention Augmented Graph Convolution
3.3.1. Spatial Graph Convolution
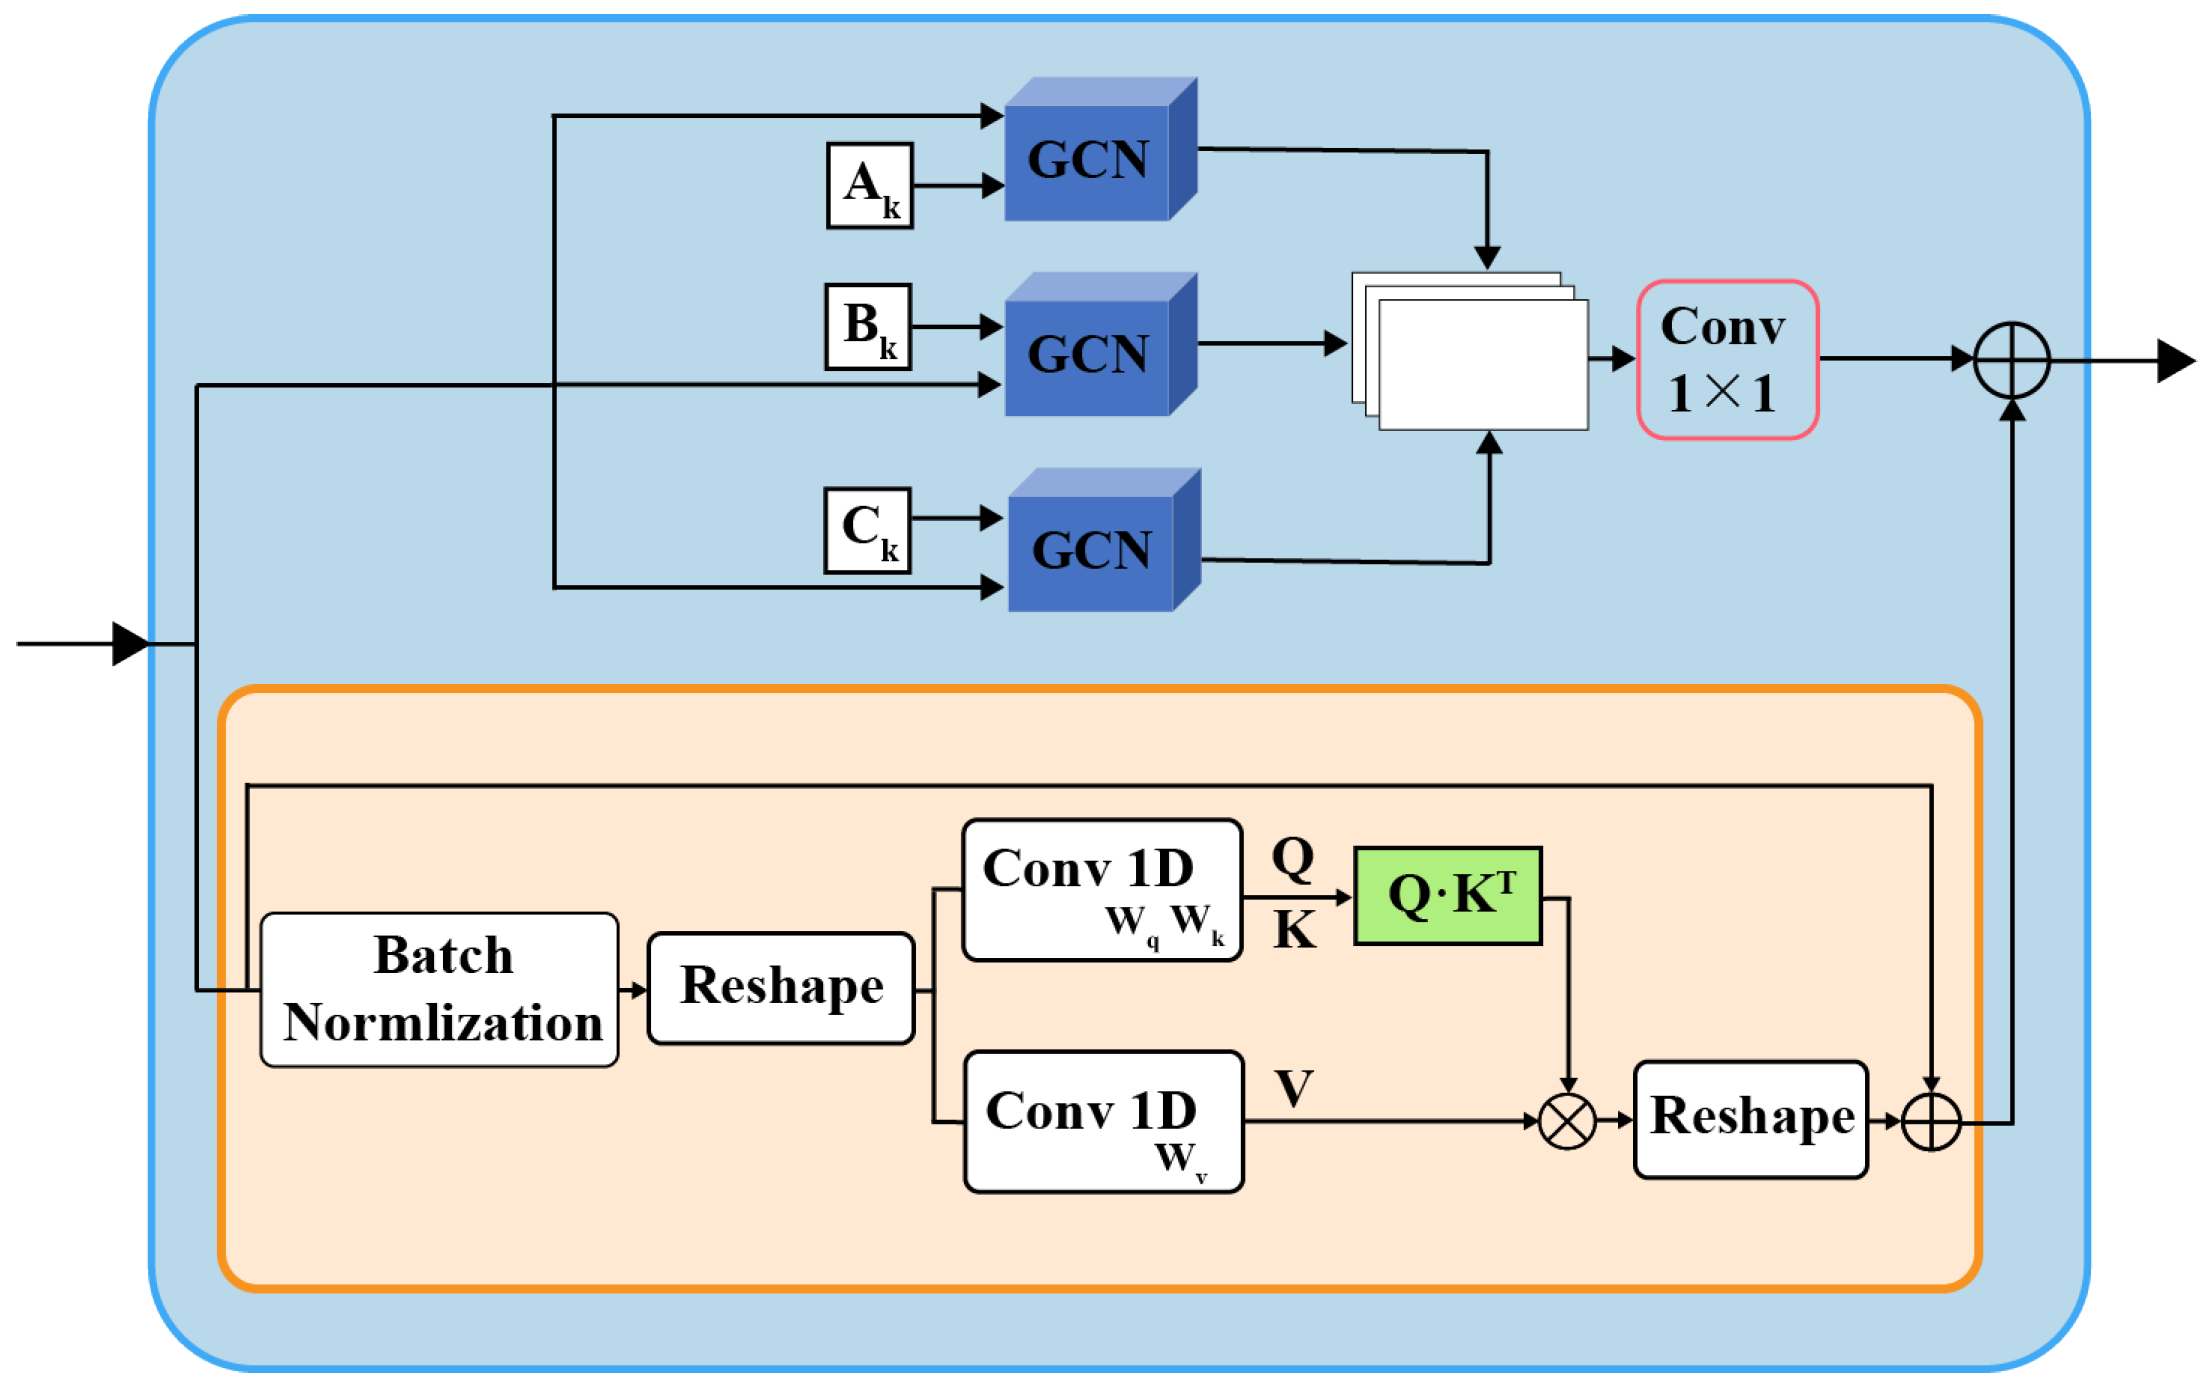
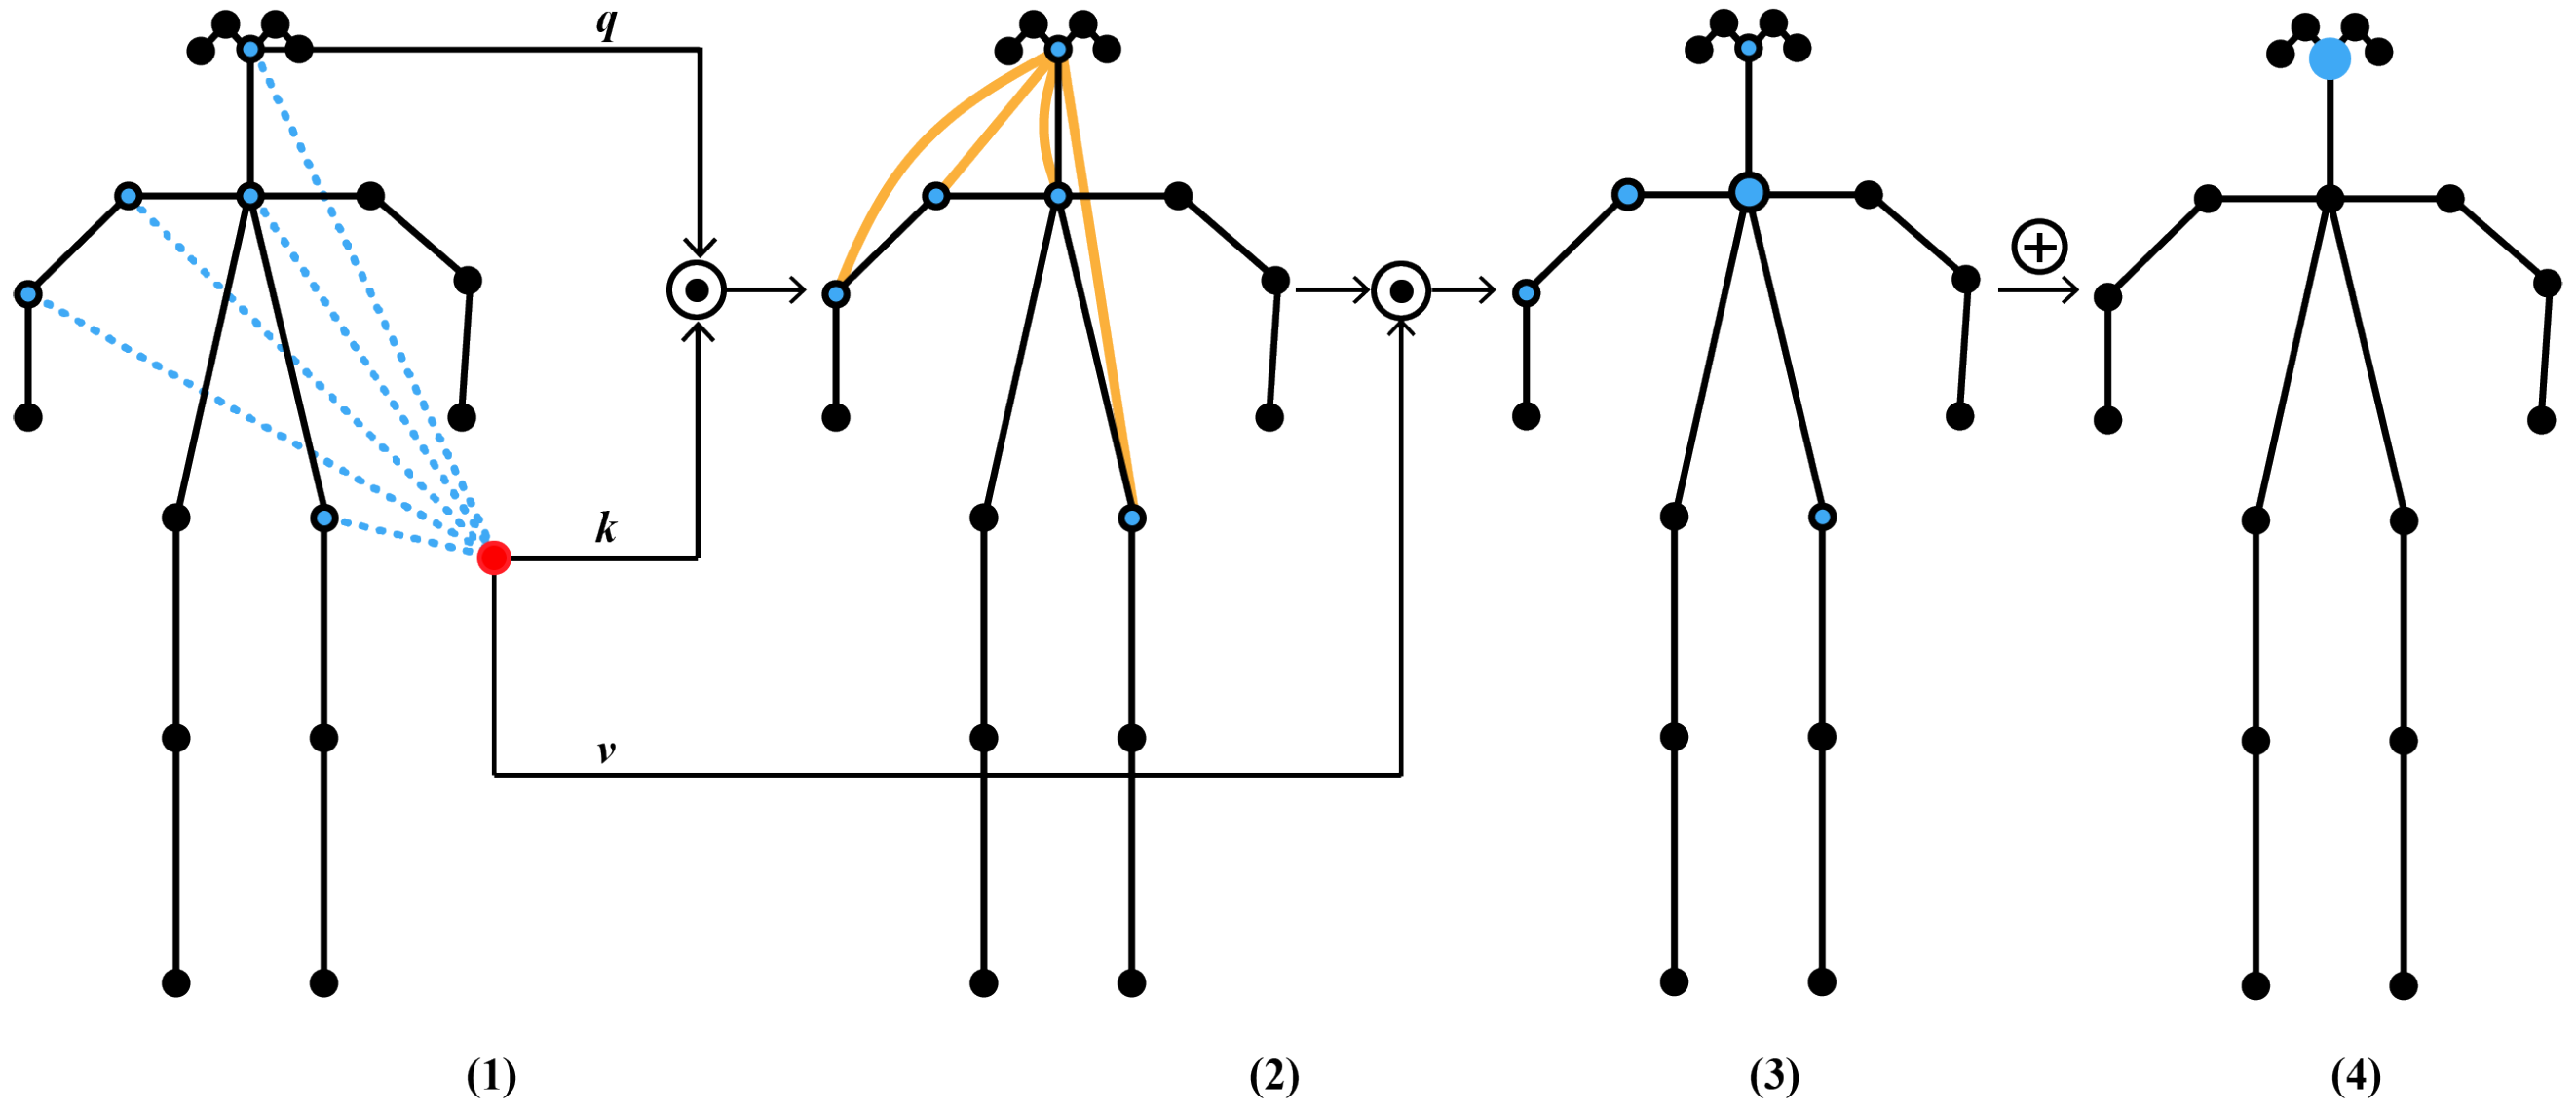
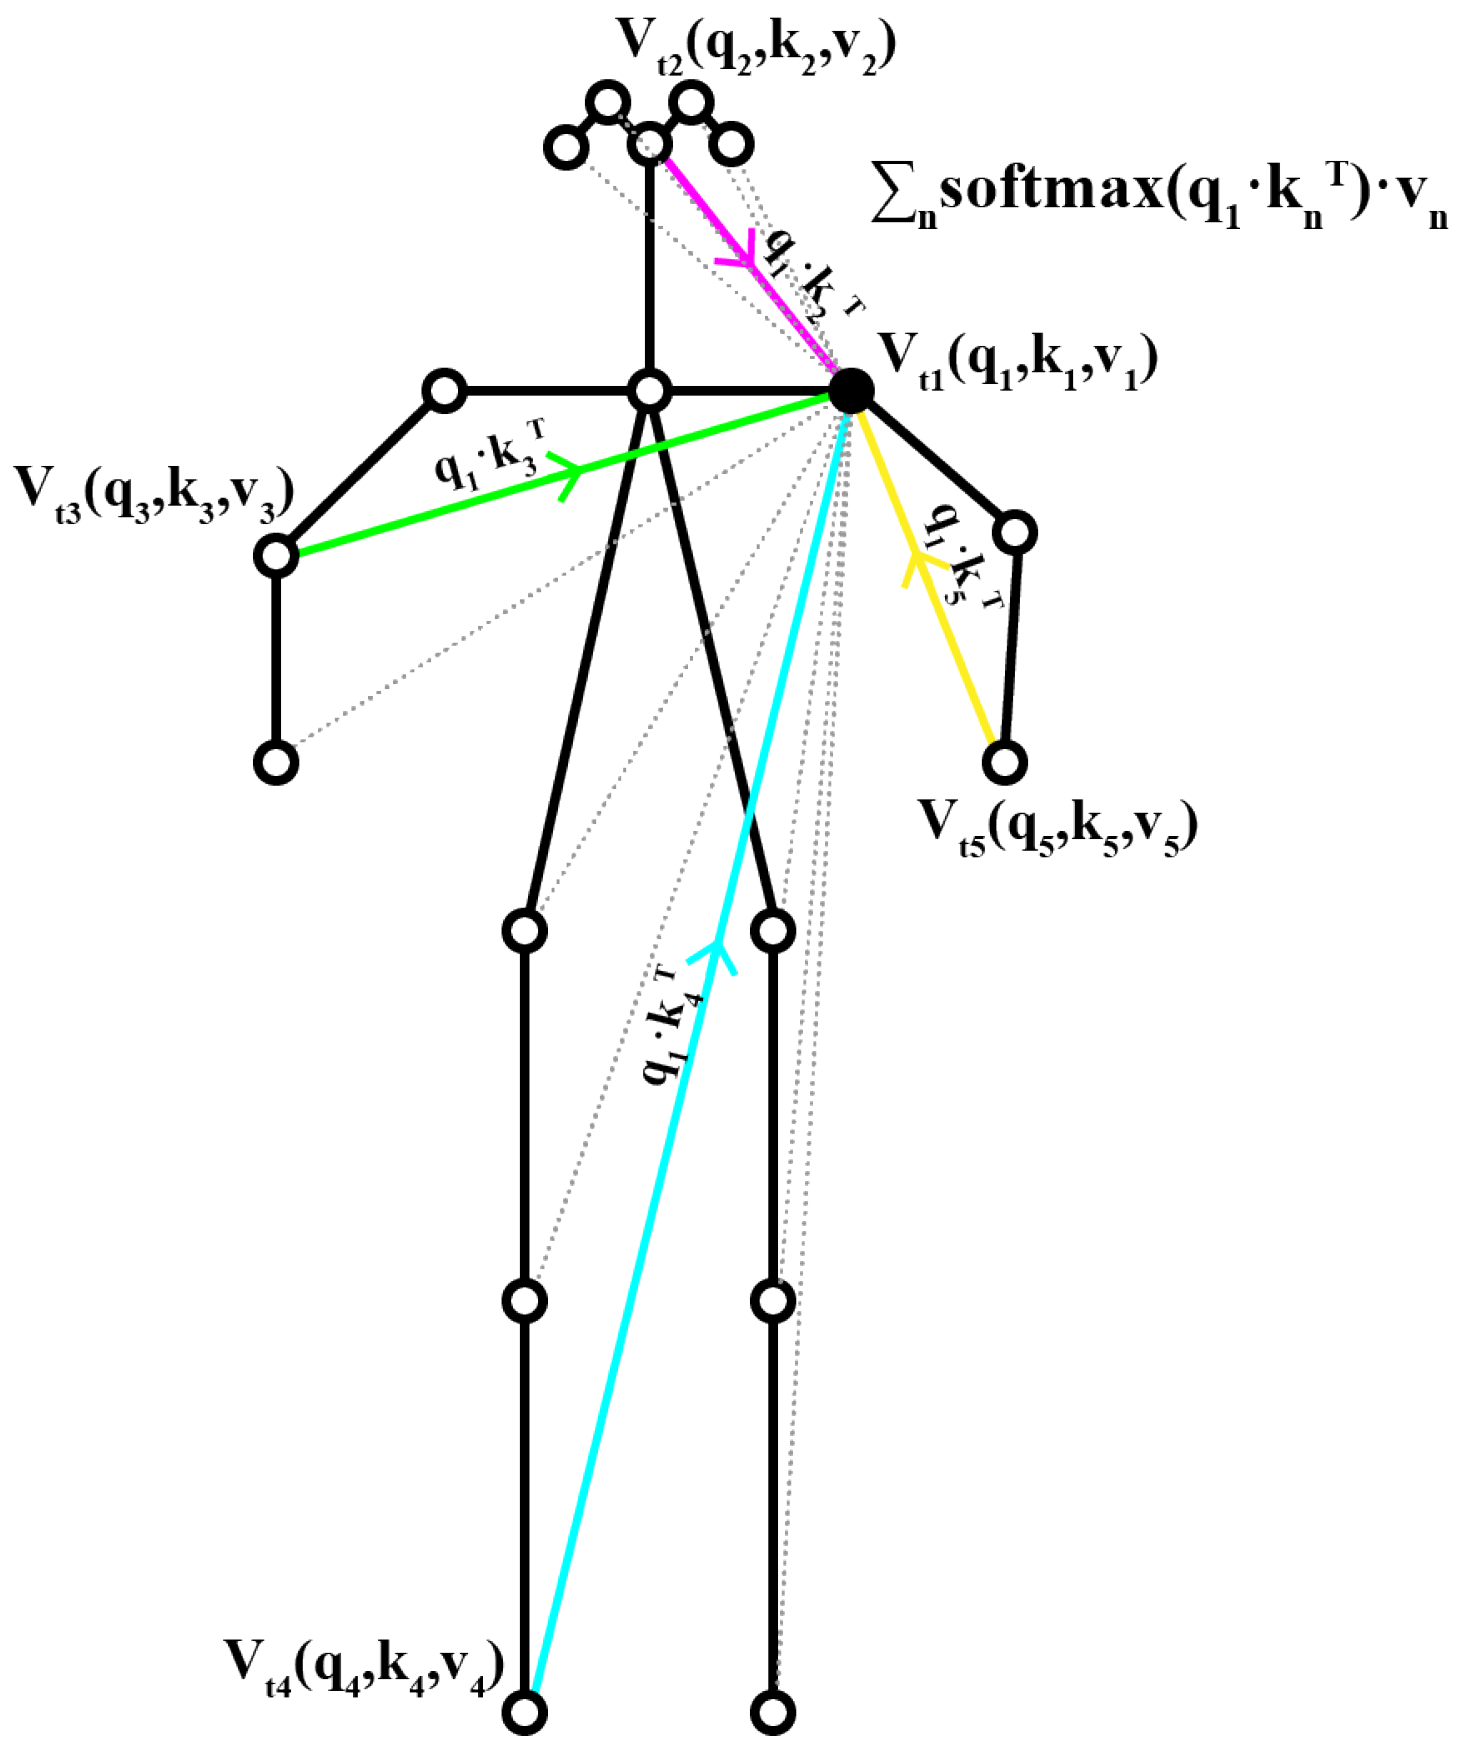
3.3.2. Spatial Self-Attention (SAA) Module
3.4. Deep Embedded Clustering
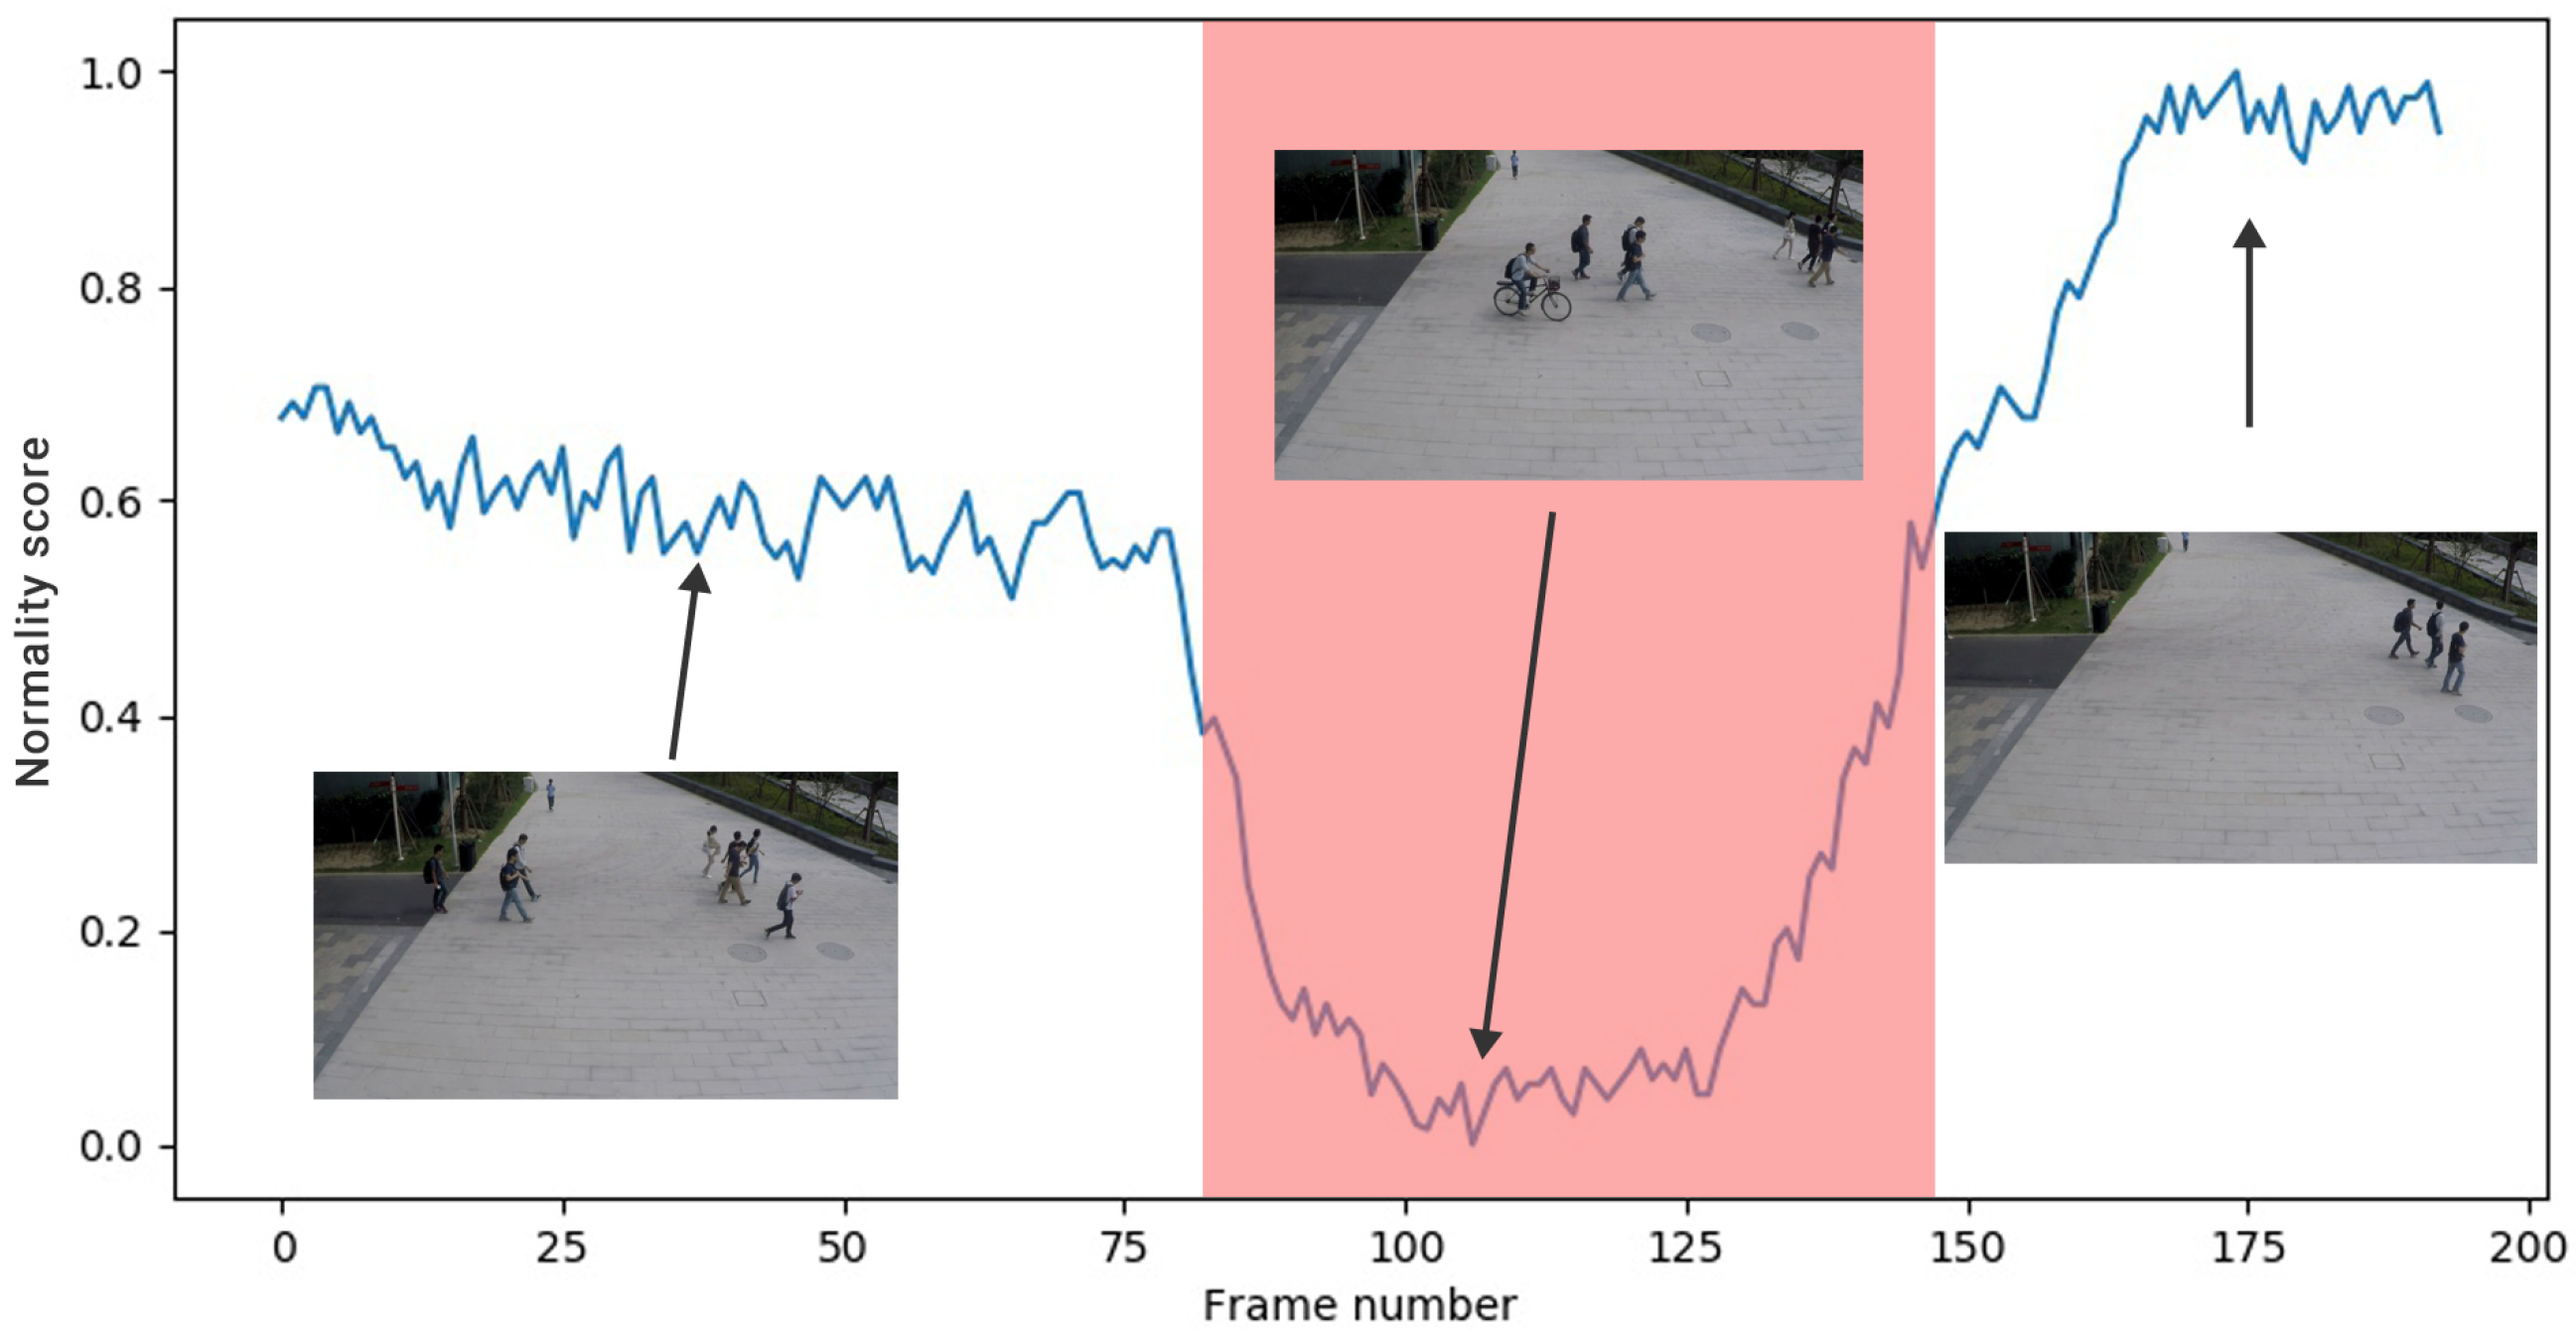
3.5. Normality Score
4. Experiment
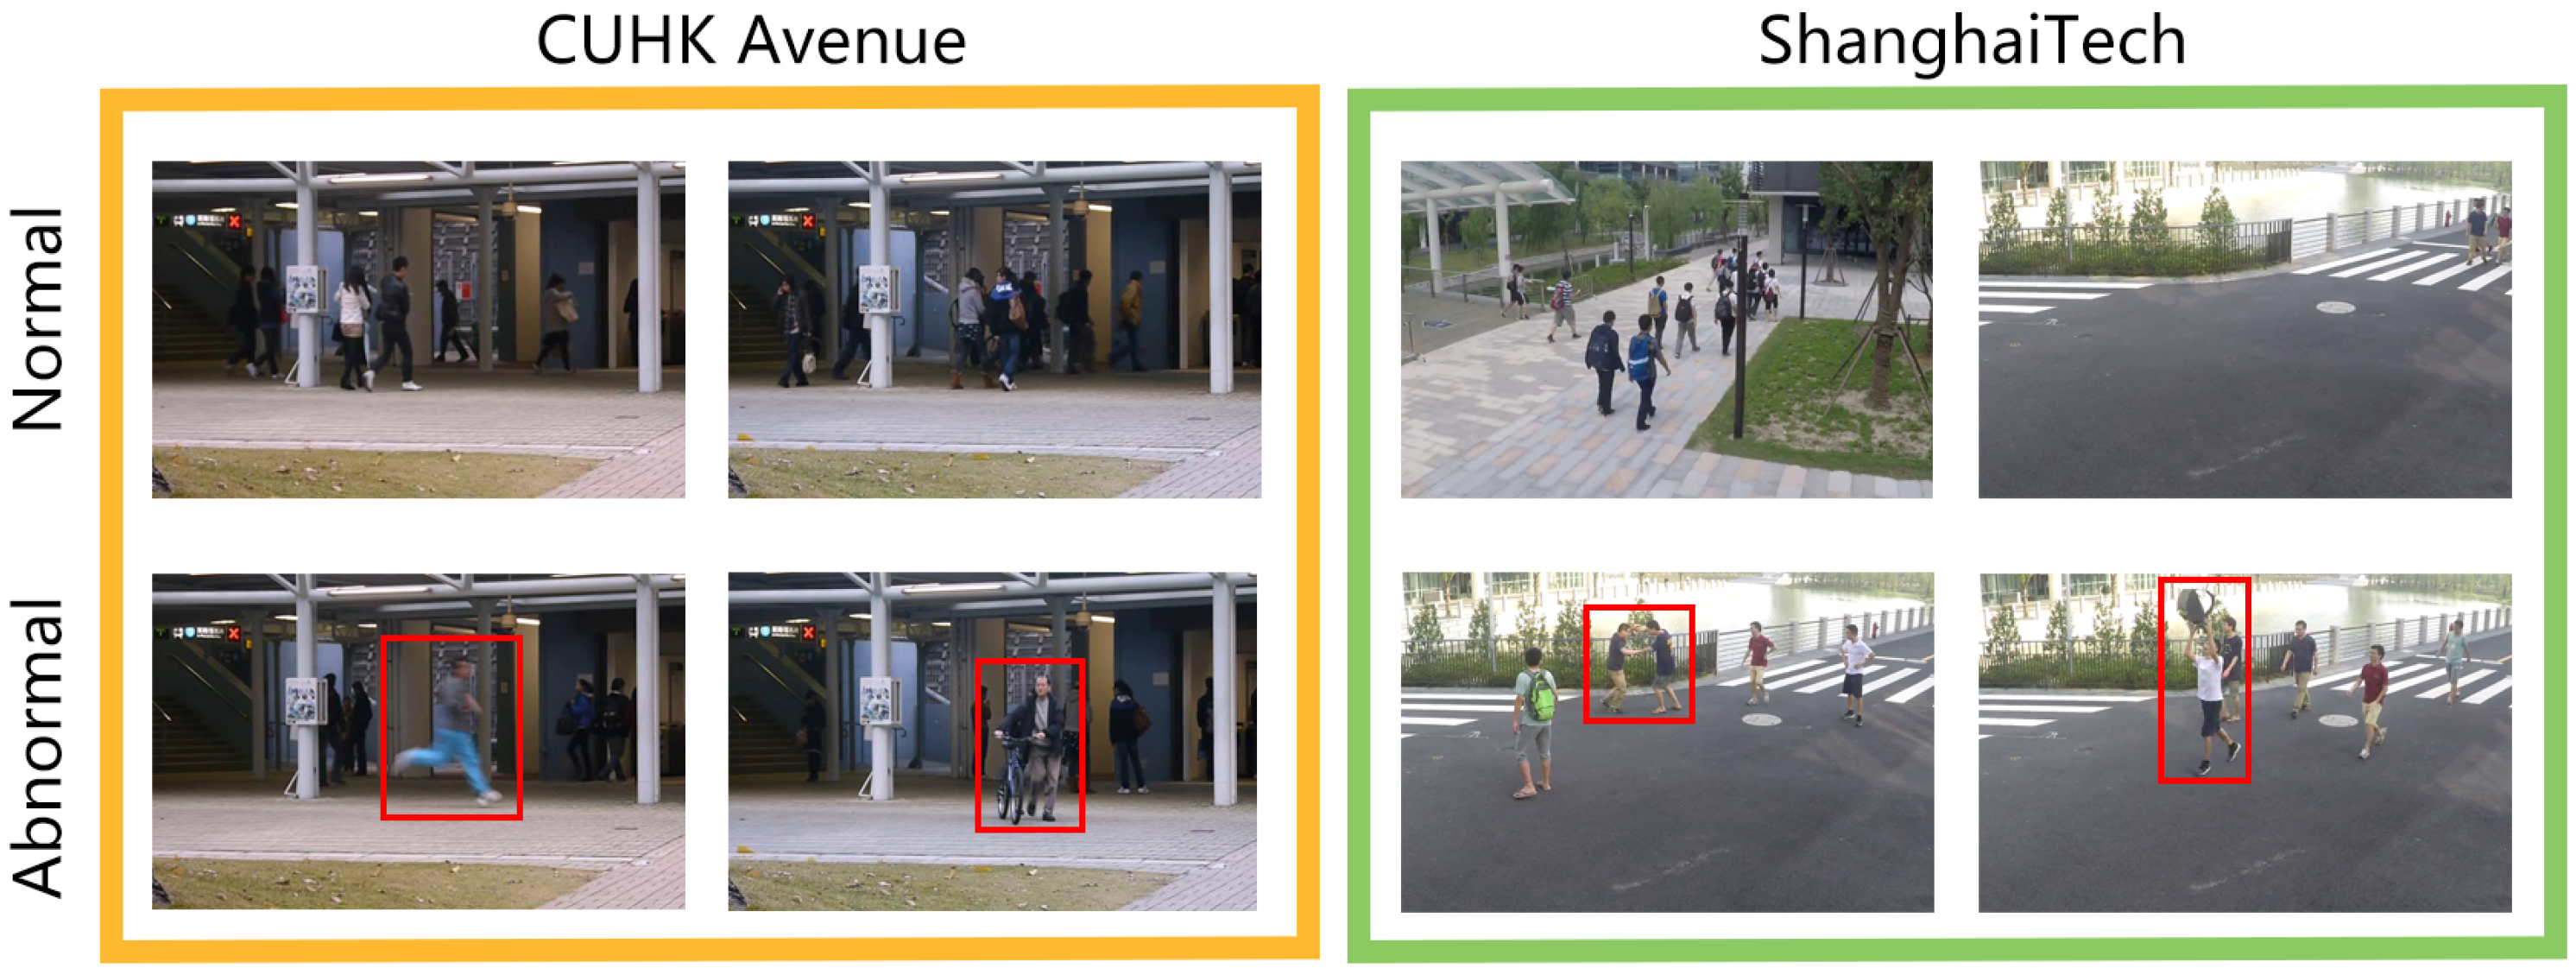
4.1. Dataset
4.2. Implementation Details
4.3. Comparison with State-of-the-Art Methods
4.4. Ablation Study
4.5. The Visualization of SAA-Graph
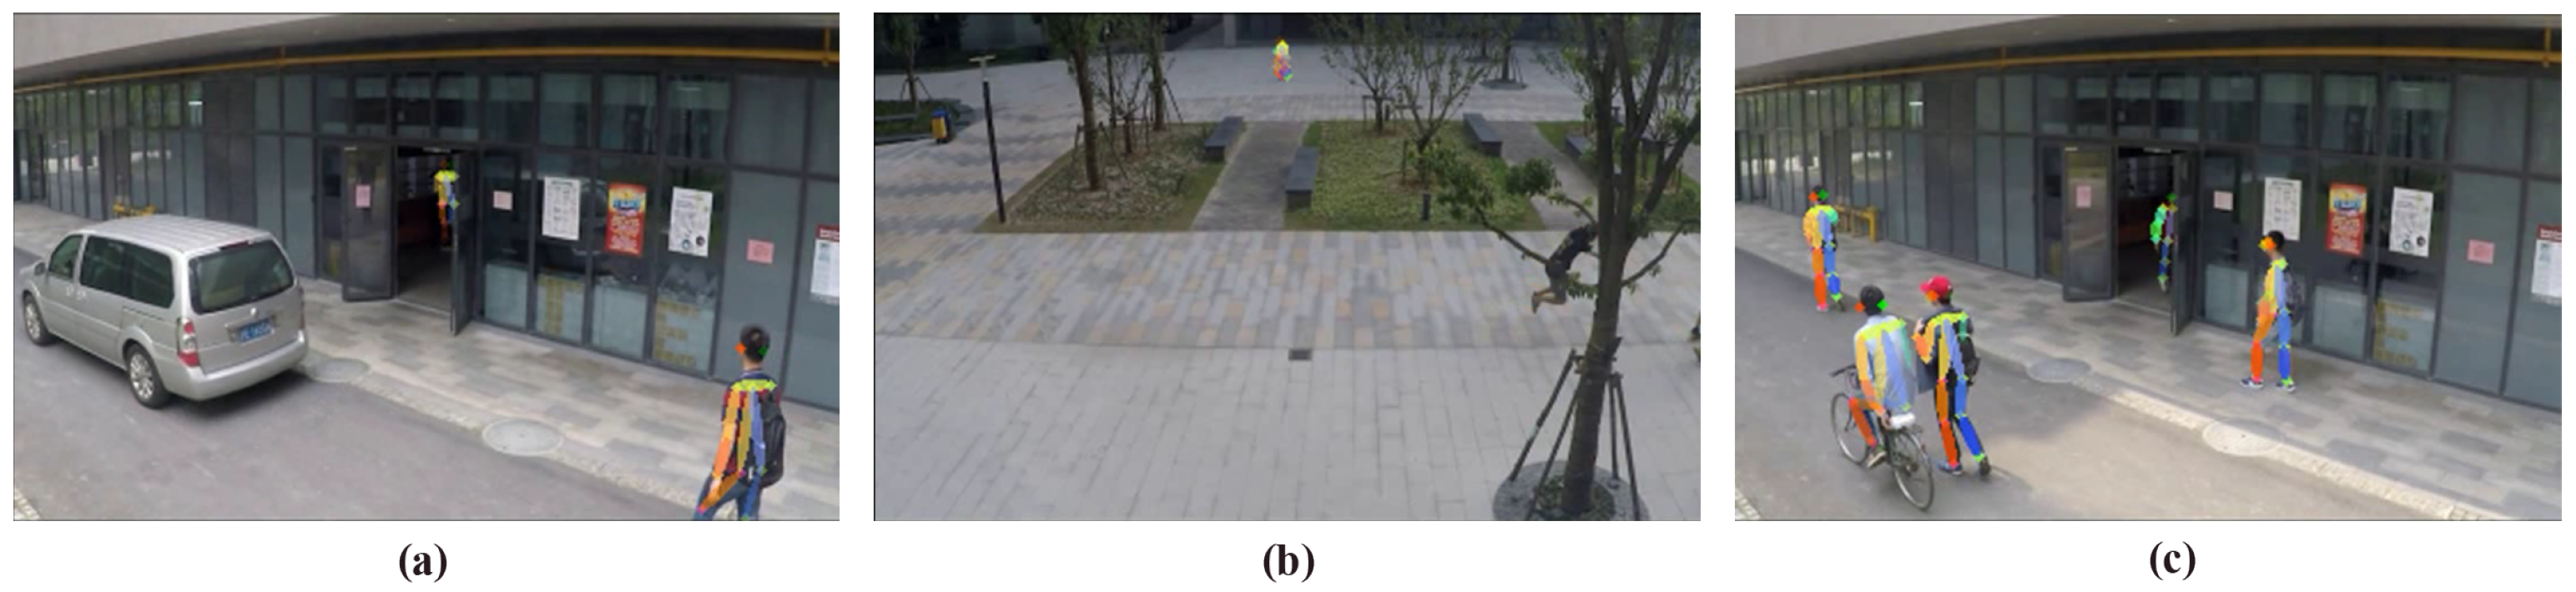
4.6. Fail Cases Analysis
5. Conclusions
Author Contributions
Funding
Institutional Review Board Statement
Informed Consent Statement
Data Availability Statement
Conflicts of Interest
References
- Yan, S.; Xiong, Y.; Lin, D. Spatial Temporal Graph Convolutional Networks for Skeleton-Based Action Recognition. In Proceedings of the Thirty-Second AAAI Conference on Artificial Intelligence, New Orleans, LA, USA, 2–7 February 2018. [Google Scholar]
- Li, M.; Chen, S.; Chen, X.; Zhang, Y.; Wang, Y.; Tian, Q. Actional-Structural Graph Convolutional Networks for Skeleton-based Action Recognition. In Proceedings of the 2019 IEEE/CVF Conference on Computer Vision and Pattern Recognition (CVPR), Long Beach, CA, USA, 15–20 June 2019. [Google Scholar]
- Shi, L.; Zhang, Y.; Cheng, J.; Lu, H. Skeleton-Based Action Recognition with Directed Graph Neural Networks. In Proceedings of the 2019 IEEE/CVF Conference on Computer Vision and Pattern Recognition (CVPR), Seattle, WA, USA, 14–19 June 2020; pp. 7912–7921. [Google Scholar]
- Shi, L.; Zhang, Y.; Cheng, J.; Lu, H. Two-Stream Adaptive Graph Convolutional Networks for Skeleton-Based Action Recognition. In Proceedings of the IEEE/CVF Conference on Computer Vision and Pattern Recognition, Long Beach, CA, USA, 15–20 June 2019; pp. 12026–12035. [Google Scholar]
- Vaswani, A.; Shazeer, N.; Parmar, N.; Uszkoreit, J.; Jones, L.; Gomez, A.N.; Kaiser, L.; Polosukhin, I. Attention Is All You Need. Advances in Neural Information Processing Systems. In Proceedings of the First 12 Conferences, 2017; pp. 5998–6008. Available online: https://mitpress.mit.edu/books/advances-neural-information-processing-systems (accessed on 13 December 2021).
- Bello, I.; Zoph, B.; Le, Q.; Vaswani, A.; Shlens, J. Attention Augmented Convolutional Networks. In Proceedings of the 2019 IEEE/CVF International Conference on Computer Vision (ICCV), Seoul, Korea, 27–28 October 2019; pp. 3286–3295. [Google Scholar]
- Clausi, Z. Goal-based trajectory analysis for unusual behaviour detection in intelligent surveillance. Image Vis. Comput. 2011, 29, 230–240. [Google Scholar]
- Anjum, N.; Cavallaro, A. Multifeature Object Trajectory Clustering for Video Analysis. IEEE Trans. Circuits Syst. Video Technol. 2008, 18, 1555–1564. [Google Scholar] [CrossRef]
- Dalal, N.; Triggs, B. Histograms of Oriented Gradients for Human Detection. In Proceedings of the IEEE Computer Society Conference on Computer Vision & Pattern Recognition, San Diego, CA, USA, 20–25 June 2005. [Google Scholar]
- Dalal, N.; Triggs, B.; Schmid, C. Human Detection Using Oriented Histograms of Flow and Appearance. In European Conference on Computer Vision; Springer: Berlin/Heidelberg, Germany, 2006. [Google Scholar]
- Fischer, P.; Dosovitskiy, A.; Ilg, E.; Husser, P.; Hazrba, C.; Golkov, V.; Patrick, V.; Cremers, D.; Brox, T. FlowNet: Learning Optical Flow with Convolutional Networks. In Proceedings of the 2015 IEEE International Conference on Computer Vision (ICCV), Amsterdam, The Netherlands, 11–14 October 2016. [Google Scholar]
- Zhang, X.; Yang, S.; Zhang, J.; Zhang, W. Video anomaly detection and localization using motion-field shape description and homogeneity testing. Pattern Recognit. 2020, 105, 107394. [Google Scholar] [CrossRef]
- Hasan, M.; Choi, J.; Neumann, J.; Roy-Chowdhury, A.K.; Davis, L.S. Learning Temporal Regularity in Video Sequences. In Proceedings of the 2016 IEEE Conference on Computer Vision and Pattern Recognition (CVPR), Las Vegas, NV, USA, 27–30 June 2016. [Google Scholar]
- Chong, Y.S.; Tay, Y.H. Abnormal Event Detection in Videos Using Spatiotemporal Autoencoder; Springer: Cham, Switzerland, 2017. [Google Scholar]
- Medel, J.R.; Savakis, A. Anomaly Detection in Video Using Predictive Convolutional Long Short-Term Memory Networks. arXiv 2016, arXiv:1612.00390. [Google Scholar]
- Luo, W.; Wen, L.; Gao, S. Remembering history with convolutional LSTM for anomaly detection. In Proceedings of the 2017 IEEE International Conference on Multimedia and Expo (ICME), Hong Kong, China, 10–14 July 2017. [Google Scholar]
- Luo, W.; Wen, L.; Gao, S. A Revisit of Sparse Coding Based Anomaly Detection in Stacked RNN Framework. In Proceedings of the 2017 IEEE International Conference on Computer Vision (ICCV), Venice, Italy, 22–29 October 2017. [Google Scholar]
- Leo, M.; D’Orazio, T.; Spagnolo, P.; D’Orazio, T. Human activity recognition for automatic visual surveillance of wide areas. In Proceedings of the ACM International Workshop on Video Surveillance & Sensor Networks, New York, NY, USA, 15 October 2014. [Google Scholar]
- Liu, W.; Luo, W.; Lian, D.; Gao, S. Future Frame Prediction for Anomaly Detection—A New Baseline. In Proceedings of the IEEE Conference on Computer Vision and Pattern Recognition, 2018; pp. 6536–6545. Available online: https://openaccess.thecvf.com/content_cvpr_2018/papers/Liu_Future_Frame_Prediction_CVPR_2018_paper.pdf (accessed on 13 December 2021).
- Wu, P.; Liu, J.; Li, M.; Sun, Y.; Shen, F. Fast Sparse Coding Networks for Anomaly Detection in Videos. Pattern Recognit. 2020, 107, 107515. [Google Scholar] [CrossRef]
- Morais, R.; Le, V.; Tran, T.; Saha, B.; Mansour, M.; Venkatesh, S. Learning Regularity in Skeleton Trajectories for Anomaly Detection in Videos. In Proceedings of the IEEE/CVF Conference on Computer Vision and Pattern Recognition, Seattle, WA, USA, 14–19 June 2020. [Google Scholar]
- Luo, W.; Liu, W.; Gao, S. Normal Graph: Spatial Temporal Graph Convolutional Networks based Prediction Network for Skeleton based Video Anomaly Detection. Neurocomputing 2020, 444, 332–337. [Google Scholar] [CrossRef]
- Markovitz, A.; Sharir, G.; Friedman, I.; Zelnik-Manor, L.; Avidan, S. Graph Embedded Pose Clustering for Anomaly Detection. In Proceedings of the 2020 IEEE/CVF Conference on Computer Vision and Pattern Recognition (CVPR), Seattle, WA, USA, 13–19 June 2020. [Google Scholar]
- Vemulapalli, R.; Arrate, F.; Chellappa, R. Human Action Recognition by Representing 3D Skeletons as Points in a Lie Group. In Proceedings of the 2014 IEEE Conference on Computer Vision and Pattern Recognition (CVPR), Columbus, OH, USA, 23–28 June 2014. [Google Scholar]
- Hussein, M.E.; Torki, M.; Gowayyed, M.A.; El-Saban, M. Human Action Recognition Using a Temporal Hierarchy of Covariance Descriptors on 3D Joint Locations. In Proceedings of the International Joint Conference on Artificial Intelligence, Beijing, China, 3–9 August 2013. [Google Scholar]
- Fernando, B.; Gavves, E.; Oramas, J.; Ghodrati, A.; Tuytelaars, T. Modeling video evolution for action recognition. In Proceedings of the 2015 IEEE Conference on Computer Vision and Pattern Recognition (CVPR), Boston, MA, USA, 7–12 June 2015. [Google Scholar]
- Lei, W.; Du, Q.H.; Koniusz, P. A Comparative Review of Recent Kinect-based Action Recognition Algorithms. IEEE Trans. Image Process. 2019, 29, 15–28. [Google Scholar]
- Xu, Y.; Cheng, J.; Wang, L.; Xia, H.; Feng, L.; Tao, D. Ensemble One-dimensional Convolution Neural Networks for Skeleton-based Action Recognition. IEEE Signal Process. Lett. 2018, 25, 1044–1048. [Google Scholar] [CrossRef]
- Ding, Z.; Wang, P.; Ogunbona, P.O.; Li, W. Investigation of Different Skeleton Features for CNN-based 3D Action Recognition. In Proceedings of the 2017 IEEE International Conference on Multimedia & Expo Workshops (ICMEW), 2017; pp. 617–622. Available online: https://arxiv.org/pdf/1705.00835.pdf (accessed on 13 December 2021).
- Banerjee, A.; Singh, P.K.; Sarkar, R. Fuzzy Integral-Based CNN Classifier Fusion for 3D Skeleton Action Recognition. IEEE Trans. Circuits Syst. Video Technol. 2021, 31, 2206–2216. [Google Scholar] [CrossRef]
- Xie, J.; Girshick, R.; Farhadi, A. Unsupervised Deep Embedding for Clustering Analysis. In Proceedings of the International Conference on Machine Learning, 2016; pp. 478–487. Available online: http://proceedings.mlr.press/v48/xieb16.pdf (accessed on 13 December 2021).
- Blei, D.M.; Jordan, M.I. Variational inference for Dirichlet process mixtures. J. Bayesian Anal. 2006, 1, 121–143. [Google Scholar] [CrossRef]
- Lu, C.; Shi, J.; Jia, J. Abnormal Event Detection at 150 FPS in MATLAB. In Proceedings of the IEEE International Conference on Computer Vision, 2013; pp. 2720–2727. Available online: https://www.cv-foundation.org/openaccess/content_iccv_2013/papers/Lu_Abnormal_Event_Detection_2013_ICCV_paper.pdf (accessed on 13 December 2021).
- Fang, H.S.; Xie, S.; Tai, Y.W.; Lu, C. RMPE: Regional Multi-person Pose Estimation. In Proceedings of the 2017 IEEE International Conference on Computer Vision (ICCV), Venice, Italy, 22–29 October 2017. [Google Scholar]
- Plizzari, C.; Cannici, M.; Matteucci, M. Skeleton-based Action Recognition via Spatial and Temporal Transformer Networks. Comput. Vis. Image Underst. 2021, 208, 103219. [Google Scholar] [CrossRef]
- Yang, C.; Yuan, J.; Ji, L. Sparse reconstruction cost for abnormal event detection. In Proceedings of the 2011 IEEE Conference on Computer Vision and Pattern Recognition (CVPR), Colorado Springs, CO, USA, 20–25 June 2011. [Google Scholar]


| Method | ShanghaiTech Campus | HR-ShanghaiTech Campus | Avenue | |
|---|---|---|---|---|
| Appearance | Conv-AE [13] | 0.704 | 0.698 | 0.848 |
| TSC sRNN [17] | 0.680 | N/A | N/A | |
| Liu et al. [19] | 0.702 | 0.727 | 0.862 | |
| Skeleton | MPED-RNN [21] | 0.734 | 0.754 | 0.863 |
| Normal Graph [22] | 0.734 | 0.765 | 0.873 | |
| GEPC [23] | 0.749 | 0.756 | 0.876 | |
| Ours | 0.789 | 0.793 | 0.884 |
| ShanghaiTech Campus | HR-ShanghaiTech Campus | |
|---|---|---|
| SAA-Graph/Graph | 0.749 | 0.756 |
| SAA-Graph/SA | 0.746 | 0.749 |
| SAA-Graph | 0.789 | 0.793 |
Publisher’s Note: MDPI stays neutral with regard to jurisdictional claims in published maps and institutional affiliations. |
© 2021 by the authors. Licensee MDPI, Basel, Switzerland. This article is an open access article distributed under the terms and conditions of the Creative Commons Attribution (CC BY) license (https://creativecommons.org/licenses/by/4.0/).
Share and Cite
Liu, C.; Fu, R.; Li, Y.; Gao, Y.; Shi, L.; Li, W. A Self-Attention Augmented Graph Convolutional Clustering Networks for Skeleton-Based Video Anomaly Behavior Detection. Appl. Sci. 2022, 12, 4. https://doi.org/10.3390/app12010004
Liu C, Fu R, Li Y, Gao Y, Shi L, Li W. A Self-Attention Augmented Graph Convolutional Clustering Networks for Skeleton-Based Video Anomaly Behavior Detection. Applied Sciences. 2022; 12(1):4. https://doi.org/10.3390/app12010004
Chicago/Turabian StyleLiu, Chengming, Ronghua Fu, Yinghao Li, Yufei Gao, Lei Shi, and Weiwei Li. 2022. "A Self-Attention Augmented Graph Convolutional Clustering Networks for Skeleton-Based Video Anomaly Behavior Detection" Applied Sciences 12, no. 1: 4. https://doi.org/10.3390/app12010004