Article

Development of a Reliable Vibration Based Health Indicator for Monitoring the Lubricating Condition of the Toggle Clamping System of a Plastic Injection Molding Machine

1
Graduate School of Mechanical and Energy Engineering, Kun Shan University, Tainan 71070, Taiwan
2
Department of Mechanical Engineering, Kun Shan University, Tainan 71070, Taiwan
*
Author to whom correspondence should be addressed.
Appl. Sci. 2022, 12(1), 196; https://doi.org/10.3390/app12010196
Submission received: 29 November 2021 / Revised: 19 December 2021 / Accepted: 21 December 2021 / Published: 25 December 2021
(This article belongs to the Special Issue Condition Monitoring and Their Applications in Industry)

Abstract

:
Plastic injection molding has become one of the most widely used polymer processing methods due to its ability to viably produce large volumes of complex parts in a short time frame. Most of the plastic injection molding machines currently used in industry possess a toggle clamping mechanism that undergoes a repeated clamping and unclamping cycle during operation. This toggle must therefore be properly lubricated to avoid catastrophic failure and eventual machine downtime. To overcome this limitation, the industry currently relies on the experience of a skilled operator, paired with a fixed empirical value, to determine the timing for re-lubrication. This method often leads to the machine operator either wasting lubricant by over-lubricating the toggle, or damaging the toggle by failing to re-lubricate when needed. Herein, we explore the use of vibration analysis to perform real-time condition monitoring of the lubrication condition of the toggle clamping system. In this study, our novel structural response analysis out performed both traditional time domain and frequency domain analyses in isolating the vibrational signatures indicative of lubricant degradation. Additionally, this study confirms that the vibration generated during the unclamping period of the toggle, proved to contain more valuable information relevant to the instantaneous lubricant quality than provided by its corresponding clamping period.

1. Introduction

Plastic is one of the most widely used synthetic materials in the world [1]. This wide- spread use can be attributed to its unique properties, which allows it to be easily processed and integrated into end-user products. Being light weight and relatively low cost make plastics more suitable than its metal counterpart for many industrial applications. Today, plastic plays a dominant role in industries such as automotive, packaging, home appliances, and medical. A large percentage of these plastic parts are produced via injection molding, thereby making this polymer processing method one of the most important processes in the plastic industry [2]. The popularity of the plastic injection molding process stems from its ability to viably produce high volumes of plastic parts of varying complexity in a short time frame [3].
Plastic injection molding is a process in which molten plastic material is injected into a shaping mold, cooled, solidified, and ejected [4]. An injection molding machine consists of three major parts, namely; the injection unit, the mold assembly unit, and the clamping unit [5]. There are two types of clamping units commonly used in the plastic injection molding industry. These units are the ram clamping unit and the toggle clamping unit [6,7]. The ram clamping unit is used to produce precision parts while the toggle clamping unit is used for high-speed injection molding. Toggle clamping units are typically more energy efficient than ram clamping units, and hence are predominantly used in industry. The scope of this research focuses on the toggle clamping unit of the injection molding machine.
The plastic injection molding process begins when the shaping mold is closed via the toggle clamping system. Once the mold is closed, molten plastic material is injected and packed into the mold cavity. The plastic material then undergoes a cooling process, resulting in the formation of a solid part. In the final step, the toggle clamping system opens the shaping mold, allowing for the easy ejection of the molded part.
In an industrial setting, the plastic injection molding machine is required to operate for extended periods. Given the nature of the injection molding process, the toggle clamping system must undergo repetitive clamping–unclamping cycles. To maintain optimum productivity, the toggle must therefore always be properly lubricated. If the lubrication condition deteriorates beyond the hydrodynamic regime, the friction generated due to metal to metal contact will accelerate the wear of the toggle, eventually causing failure and ultimately, machine downtime [8]. Gleaner reported that poor lubricant maintenance practices of the injection molding machine can reduce a factory’s productivity by 5–20% [9].
To date, substantial research effort has been dedicated to understanding and improving the toggle mechanism design and lubricant circulation. Lin and Hsiao investigated and proposed improvements for the friction effect at pin joints for the five-point double-toggle clamping mechanisms of injection molding machines [10,11]. Huang et al. explored the key design parameters of a five-point, double-toggle clamping mechanism [12]. Unfortunately, to date there has been little or no published literature on systems or methods capable of performing real-time monitoring of the lubricating condition of the toggle clamping system.
To avoid catastrophic lubricant failure of the toggle, machine operators have traditionally relied on their experience paired with pre-calculated empirical lubricant life estimation, as a guide for determining the re-lubrication timing of the toggle. By adhering to this approach, machine operators often adapt improper lubrication practices. Machine operators often find themselves either wasting lubricant by over lubricating the toggle, or damaging the toggle by failing to provide sufficient lubricant on a timely basis. This approach lacks robustness as it does not provide any information on the real-time lubrication condition of the toggle clamping system. The traditional operator-monitored approach is therefore unsuitable for industry 4.0 and hinders targeted lean manufacturing.
It has been proven that a proper lubrication regime acts as a damping system that reduces the overall vibration of a machine [13,14]. It can therefore be hypothesized that the vibrational behavior of a machine will inevitably change as its lubrication condition deteriorates. In general, when the operating condition is healthy, the machine generates relatively low vibrations. The opposite occurs when the lubrication condition deteriorates. Vibration analysis has therefore shown feasible potential for use in condition monitoring and fault diagnosis of industrial machines. Xiao et al. [15] showed that vibrational analysis accurately performed fault diagnosis and provided insights to improve the fatigue designs of wind turbines. Shah et al. [16] developed an online condition monitoring technique capable of identifying cracks in a rotor’s shaft by monitoring the vibrational changes in the rotor’s dynamic behavior. Although vibrational analysis has thus far proven to be a powerful tool for condition monitoring, it has been mainly used for the monitoring of rotating machines.
This study explored the use of vibration analysis for condition monitoring of a toggle clamping system of a plastic injection molding machine. Two commonly used vibration analysis health indicators (HI) were initially implemented to observe their abilities to isolate vibrational signatures indicative of lubricant degradation in the toggle clamping system. These two health indicators (HI) included a time domain-based root mean square (RMS) health indicator, and a frequency domain-based frequency center (FC) health indicator. Due to their limitations, we derived a third, structural response-based shock response spectrum health indicator. This final approach proved to be the most suitable for monitoring the lubrication condition of the toggle clamping system.

2. Materials and Methods

2.1. Experimental Instruments

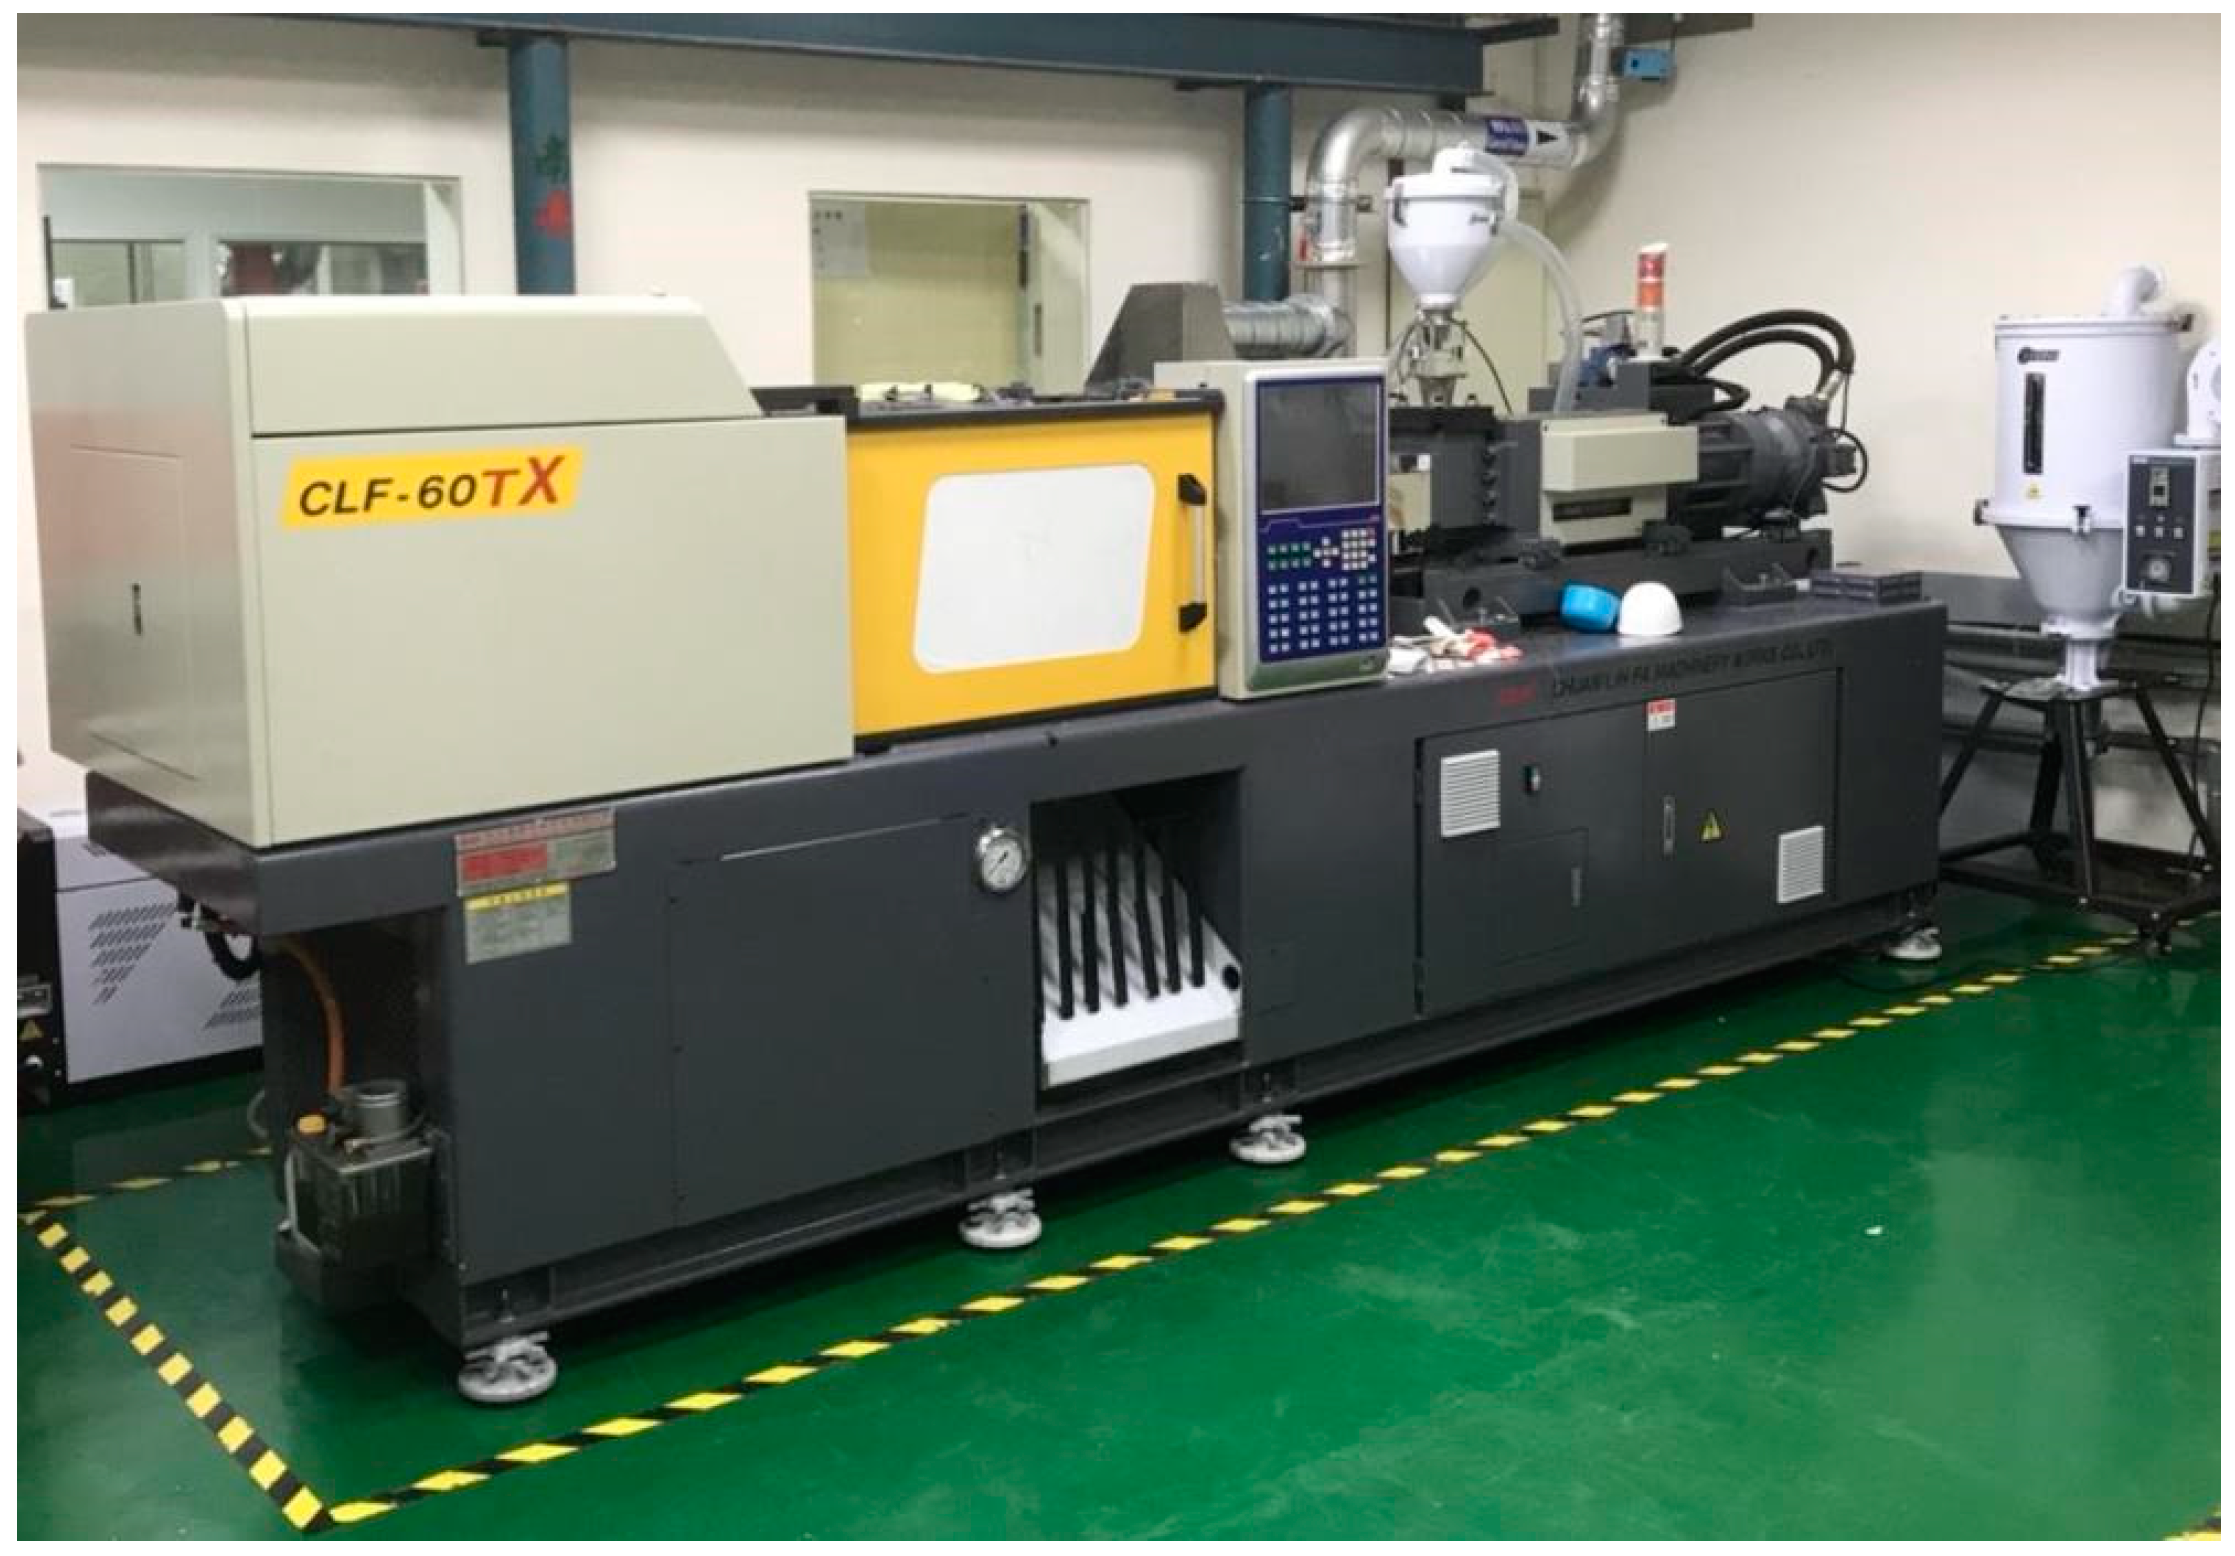
2.1.1. Injection Molding Machine

This study was conducted using the CLF-60TX plastic injection molding machine as shown in Figure 1. This system was a hydraulically controlled, toggle-type, plastic injection molding machine. It possessed a maximum clamping force of 600 kN, an ECO STAR servo system of 22 kW, a shot rate of 115 cm3/s, a maximum system pressure of 170 bar, and maximum injection pressure of 2951 kg/cm2. The machine’s controller was produced by MIRLE Automation Corporation (Hsinchu, Taiwan).

2.1.2. Data Acquisition System

The IMC CRONOSflex was the data acquisition system (DAQ) used for this research project. This frameless modular DAQ allows for simultaneous recording of analog and digital signals. This system has a total of 8 channels, allowing each channel to sample data with a maximum sampling rate of 100 KS/s.

2.2. Methodology

2.2.1. Experimental Setup

  • A PCB Piezotronics accelerometer (Model:352A24) of sensitivity 100 mV/g and a measurement range of ±50 g was mounted onto the stationary pin of the toggle clamping system as shown in Figure 2.
  • A strain gauge was mounted across the tie bar of the injection molding machine.
  • The accelerometer and strain gauge were connected to an IMC CRONOSflex DAQ.
  • The vibration and strain data were sampled at a rate of 50 kHz and 100 Hz, respectively.
  • The logged data was finally transferred and stored onto a PC via an RJ45 cable for further data analysis.

2.2.2. Experimental Procedures

  • The clamping force of the injection molding machine was set to 240 kPa. The toggle clamping system was completely lubricated for 40 s with BETTA anti-stick, extreme pressure oil.
  • The toggle was clamped and unclamped repeatedly until a screeching sound was detected by the experienced machine operator.
  • At the onset of the screeching sound, the toggle was completely re-lubricated for another 40 s while allowed to continue its opening and closing motion.
  • The re-lubrication points were selected to be at cycles of 150, 330, and 530. The toggle clamping system was monitored over a total of 560 cycles.

2.2.3. Data Acquisition

Figure 3 shows the profile of the signal acquired by the DAQ system for a single clamping–unclamping cycle. The orange profile represents the changes in the strain across the tie bar while the blue profile represents the vibration collected by the accelerometer. From positions a–b the toggle begins closing the shaping mold. From positions b–c the toggle clamps the shaping mold. Positions c–d encompasses the injection, cooling, and packing of the molded part. Positions d–e show where the toggle unclamps the shaping mold, and finally, positions e–f is where the toggle opens the shaping mold and retracts to its origin position. This study extracts and analyzes the vibrational signal collected during the clamping and unclamping periods of each cycle, as highlighted by the dashed black boxes in Figure 3. The signal collected by the strain gauge was used as a guide to extract the acceleration signal generated during the clamping and unclamping of the toggle. The time constant for the clamping period was therefore determined to be 0.88 s. This was the time period that elapsed as the strain increased from its base value (b) to its maximum value (c) as shown in Figure 3. Likewise, the time constant for the unclamping period was determined to be 0.2 s. This value represented the time elapsed as the strain decreased from its maximum value (d) to its base value (e).

2.2.4. Data Treatment

The PCB 352A24 acceleration sensor having a frequency bandwidth of 1.0 to 8 kHz was used to collect the vibrational responses of the toggle clamping system. To accurately represent frequencies present in the bandwidth of this sensor, the Nyquist theory must be fulfilled. The Nyquist theorem explains that sampling rate must be at least twice as high as the maximum frequency captured by the sensor. Increasing the sampling rate beyond this twofold threshold improves the quality of the acquired signal. For this reason, we sampled the acceleration signal at 50 kHz. This value was sufficiently large to satisfy the Nyquist theorem while not overloading the buffer of the data acquisition system. Prior to performing further data analysis, the acquired signal was subjected to a bandpass filter. This filter passed frequencies from 1 to 8 kHz while attenuating frequencies greater than 8 kHz, essentially keeping only the frequency range that the acceleration sensor accurately captured.

2.2.5. Data Analysis

  • The vibration signals generated during the clamping an unclamping period for each of the 560 cycles were extracted.
  • The extracted clamping and unclamping vibrations were analyzed using three classes of vibration analysis techniques. These three classes include (a) time domain analyses, (b) frequency domain analysis, and (c) structural response analysis.
  • Health indicators (HI) representative of the instantaneous lubricating condition of the toggle clamping system were derived from all three classes of vibration analysis techniques.
  • Figure 4, below, shows a flowchart detailing the data analysis conducted in this study.

3. Basic Theory

3.1. Vibration Analysis Techniques Used as Condition Indicators

Vibration analysis techniques analyze time series data by highlighting subtle changes in the data’s distribution [17]. These subtle changes often indicate faults in a mechanical system. Faults, however, do not always self-manifest in the time domain but rather often in the frequency domain and at other times as a transient impulse [18]. A major challenge in condition monitoring therefore lies in identifying suitable vibration analysis techniques capable of highlighting these vibrational signatures representative of machine faults. This study explored the use of time domain analysis, frequency domain analysis, and structural response analysis, respectively, to monitor the vibrational signals generated by the toggle clamping system during its clamping and unclamping periods. Health indicators (HI) were further derived from these analyses. A more detailed description of these vibration analysis techniques and health indicators derivation is provided below.

3.2. Time Domain Analysis

3.2.1. Description

The vibration signal generated during the clamping and unclamping of the toggle was collected by the accelerometer in the time domain. Time domain is defined as a collection of time-indexed data points collected over a historical time [19]. In practice, time domain signals are generally complex, as they capture a wide range of vibrational responses from other moving components in machine paired with Gaussian noise [20]. This high complexity makes it difficult for the raw signal to be directly used for condition monitoring. In order to derive a useful health indicator from the complex time signal, statistical features capable of describing the essence of the signal can be computed. Past literature has supported the root mean square (RMS) algorithm as a suitable approach for extracting signatures indicative of progressive failure [21].

3.2.2. Root Mean Square

The RMS of a signal is defined as the signal’s normalized second statistical moment [18]. It is typically used to describe the steady-state or continuous magnitude of a time-varying signal. This study uses the RMS as the first of three “health indicators” (HI) to monitor the lubrication condition of the toggle clamping system. The RMS of a time domain signal is calculated as shown in Equation (1):
H I R M S = x R M S = 1 N i N ( x i 2 )
where,
H I R M S Health index derived using RMS algorithm
x R M S the RMS value of dataset x
x i the ith member of dataset x
Nthe number of points in dataset x

3.3. Frequency Domain Analysis

3.3.1. Description

Frequency domain analysis has proven to be a useful tool for condition monitoring of industrial machines [22]. This technique uses a function such as a sign wave or a wavelet to represent the spectral content present in a time domain signal [23]. This approach is particularly useful as it is capable of highlighting the frequency characteristics of a signal that are not easily observed in the time domain. Frequency domain analysis has excelled in performing condition monitoring of rotating machines such as bearings, shafts, and fans, since their motion produce a sine wave of a particular frequency and amplitude [24,25]. We therefore explore the use of frequency domain analysis for monitoring the lubrication condition of the toggle clamping system. The well-established fast Fourier transform algorithm was used as the medium to transform the vibrational signals generated during the clamping and unclamping periods into their corresponding frequency domain representations.

3.3.2. Fast Fourier Transform (FFT)

Fast Fourier transform is an efficient method for calculating the discrete Fourier transform of time series data [26,27]. The discrete Fourier transform is a useful mathematical tool as it describes the relationship between the time domain and frequency domain representation of discrete signals. FFT has proven to be capable of performing fault detection in bearings as many of these faults are more apparent in the frequency domain as compared with that of the time domain [18]. The discrete Fourier transform X ¯ k of a time series data xm of N terms is defined as in Equation (2):
X ¯ k = m = 0 N 1 x m W m k ,   k = 0 , 1 , , N 1 W = e j 2 π / N ,   j = 1
The sequence x m represents N consecutive samples x ( m t ) of a continuous time series signal x(t). Conversely, the sequence X ¯ k represents N consecutive samples X ¯ ( k f ) in the frequency domain. Since x m and X ¯ k are uniquely related by a transform pair, the inverse of the above transformation can be represented as in Equation (3):
y l = 1 N k = 0 N 1 X ¯ k W l k , l = 0 , 1 , , N 1 , y l x m
As described in Equation (3), the discrete Fourier transform of a sequence of data x m yields a sequence of frequency responses X ¯ k . To perform condition monitoring, this sequence of frequency responses must undergo data compression to yield a single representative health indicator value. Yang and Widodo [28] have shown that extracting statistical features from the frequency domain can provide useful insights as to when the operating condition of a machine changes. A commonly used statistical feature for condition monitoring is the frequency center (FC). The FC indicates position changes of the characteristic frequencies as in Equation (4).
H I F C = F C = k = 2 N X ¯ k X ¯ k 2 π k = 1 N X ¯ k 2

3.4. Structural Response Analysis

3.4.1. Description

Structural response analysis is a condition monitoring technique used to determine the maximum value of displacements, stresses, or acceleration in a structure during a short transient event. This analysis makes it possible to estimate the excitation induced on a structure by an input acceleration. Structural response analysis is based on a superposition of eigenmodes, and assumes that the response of the structure is predominantly linear. This analytical model has its origins in earthquake engineering, but has shown good potential in determining shock damage to components in other fields of engineering [29]. A commonly used tool for performing the structural response analysis is the shock response spectrum (SRS). Here, SRS is used as a tool to monitor the lubricating condition of the toggle clamping system.

3.4.2. Shock Response Spectrum (SRS)

Shock response spectrum is a vibration analysis technique that characterizes the frequency content of an acceleration-time history, and thereby estimates the dynamic response of structures [29]. This algorithm shows how single degree of freedom (SDOF) systems of varying natural frequencies ( ω ) would respond to an input shock. The SRS is represented in the form of a graph as shown in Figure 5, with the x-axis showing the natural frequency of varying hypothetical SDOF, and the y-axis showing the peak acceleration which these SDOF systems undergo when actuated by the shock input. This technique has been shown to be very effective when used to estimate damage induced by transient and pyrotechnic pulses such as earthquakes and transportation shocks [30]. An in-depth mathematical derivation and an open source MATLAB® code for the absolute acceleration of a spring mass system was provided by Tom Irvine [31]. The shock response spectrum can then be derived by plotting the maximum acceleration obtained from Equation (5), against its corresponding natural frequency:
x ¨ k = + 2 e ξ ω N Δ t c o s ( ω d Δ t ) x ¨ k 1 e 2 ξ ω N Δ t x ¨ k 2 + 2 ξ ω N Δ t y ¨ k + ω N Δ t e ξ ω N Δ t ( [ ω N ω d ( 1 2 ξ 2 ) ] s i n [ ω d Δ t ] 2 ξ c o s [ ω d Δ t ] ) y ¨ k 1
where,
k Spring constant of each SDOF system
x ¨ ( t ) Absolute acceleration of each SDOF system
y ¨ ( t ) Input shock
ξ Damping ratio of each SDOF system
NNumber of SDOF systems
ω Oscillation frequency
In order to obtain a more descriptive indicator capable of monitoring the lubricating condition of the toggle clamping system, a relationship between acceleration ( x ¨ k ) and velocity ( x ˙ k ) must first be established as shown in Equation (6):
| x ˙ k | = 1 2 π f | x ¨ k |
Given that each SDOF system exhibits a simple harmonic motion, its kinetic energy (KE) can be defined as shown if Equation (7):
K E = 1 2 m v 2 = 1 2 m ω 2 A 2 s i n 2 ( ω t + φ )
The systems elastic potential energy ( U ) is stored in the spring as it is displaced a distance x from its equilibrium position. It is hence calculated using Equation (8):
U = 1 2 k x 2 = 1 2 m ω 2 x 2 = 1 2 m ω 2 A 2 c o s 2 ( ω t + φ )
The total mechanical energy of the system is expressed as shown in Equation (9):
E = K E + U = 1 2 m ω 2 A 2 ( s i n 2 ( ω t + φ ) + c o s 2 ( ω t + φ ) ) = 1 2 m ω 2 A 2
The maximum velocity x ˙ m a x is expressed as shown in Equation (10):
x ˙ m a x = ω A
Finally, an index representative of the lubricating condition of the toggle clamping system can be expressed as the sum of the maximum energy of each SDOF system of different natural frequencies as shown by Equation (11).
E = H I S R S = m = 1 m = n 1 2 m ( x ˙ m a x ) 2
Simplifying the above expression by omitting the constants yields the final health indicator expression as shown by Equation (12):
E = H I S R S = m = 1 m = n 1 2 m ( x ˙ m a x ) 2 = m = 1 m = n ( x ˙ m a x ) 2

4. Results and Discussion

Our objective was to derive a reliable vibration-based health indicator (HI), capable of monitoring the real-time lubricating condition of the toggle clamping system of a plastic injection molding machine. The experimental procedures mandated that the toggle clamping system be repeatedly clamped and unclamped for a total of 530 cycles. The toggle was completely re-lubricated for 40 s at the start of testing and thereafter at cycles 150, 330, and 530. These re-lubrication points were selected by the experienced machine operator as at these points screeching sounds were detected. The re-lubrication of the toggle clamping system resulted in the subsiding of the screeching sound.
Given that lubricant both deteriorates and depletes over time, it was expected that the lubrication condition would be inversely related to the increasing cycle number. A reliable condition monitoring health indicator should hence be able to identify the optimal timing for addition of lubricant to the toggle clamping system. The same HI should also be able to capture the gradual degradation of the lubrication condition resulting from progressive cycles.
Tribological researchers have shown that surface velocity is inversely proportional to coefficient of friction [32,33]. Additionally, it has been widely accepted that frictional force is proportional to normal force [34]. It can therefore be postulated that the toggle clamping system is susceptible to its highest frictional forces during its clamping and unclamping periods, since its surface velocity during these periods is relatively low while being subjected to extremely high clamping forces. It is therefore reasonable to surmise that lubricant failure or depletion will first be manifested in either or both of these periods. Given this hypothesis, the vibration generated during these two periods were extracted and analyzed using time domain, frequency domain, and structural response analyses.
Figure 6 shows the results of the time domain analysis of the clamping and unclamping periods. The RMS algorithm was used to extract a descriptive health indicator to monitor the lubrication condition of the toggle clamping system. The vertical dotted blue lines indicate where lubricant was added to the toggle. Analysis of both the clamping and unclamping periods showed a seemingly random distribution of the health indicator ( H I R M S ) values over the duration of the experiment. Since the RMS algorithm is best suited to capture changes in the amplitude of time series data, it is evident that vibrational signatures relating to the lubrication condition of the toggle clamping system did not manifest in the form of increasing acceleration magnitude only, rendering the RMS time domain indicator not suitable for condition monitoring.
Figure 7 shows the results of the frequency domain analysis of the clamping and unclamping periods. In this analysis, the FFT algorithm was used to transform the time domain vibration into its frequency domain representation. This transformation showed that the characteristic frequencies of the vibration generated during the clamping and unclamping periods appeared to be in the frequency range of 335 Hz to 342 Hz. The FC algorithm was then used to derive a health indicator to monitor the lubricating condition of the toggle clamping system. The FC algorithm monitored the changes of the characteristic frequency of the vibration signal generated during each cycle. By observing the resulting plots, subtle changes to the data distribution were observed throughout the experiment. Particularly, the FC health indicator ( H I F C ) for the clamping period displayed more activity than for the corresponding unclamping period. The displayed behavior, however, poorly responded to the addition of lubricant to the toggle clamping system, displaying no consistent trend indicative of lubricant degradation. For this reason, it was evident that changes in the characteristic frequency of the vibration over time did not adequately capture the vibrational signatures corresponding to the inherent nature of lubricant degradation.
Figure 8 shows the results of using the structural response algorithm to analyze the vibration emitted during the clamping and unclamping of the toggle clamping system. This approach used the shock response spectrum to estimate the maximum acceleration imparted into a series of SDOF systems of varying natural frequencies. A singular energy value was then calculated and used as a health indicator ( H I S R S ) to monitor the real-time lubrication condition of the toggle clamping system. Like the previously explored vibration analysis techniques, the H I S R S of the clamping period (Figure 8a) showed no consistent trend indicative of changes in the lubrication condition of the toggle clamping system. On the contrary, the SRS health indicator of the vibration generated during the unclamping period (Figure 8b) proved to be a feasible solution for condition monitoring. The results obtained by using this approach stands in agreement with the widely published bathtub curve [35]. As described by the bathtub curve, the lifecycle of a lubricant has three stages, namely, a decreasing failure rate, a low failure rate, and an increasing failure rate. Figure 8b is in agreement with this behavior as the H I S R S assumed a relatively low value at the start of experimentation, due to a freshly re-lubricated toggle. As the cycle-number increased, the H I S R S remained relatively stable indicating a state of “low failure rate” as shown by the green arrows. After a number of cycles elapsed, the system transitioned to a state of “increasing failure rate” as shown by the red arrow. Upon the introduction of new lubricant to the system, at cycles 150, 330, and 530, the H I S R S rapidly returned to its baseline. This consistent reaction indicated that a state of “decreasing failure rate” was being achieved as shown by the yellow arrows. This bathtub-like pattern proved to be consistent throughout the experiment. Given this finding, the optimal lubrication regime was to re-lubricate the toggle when the system transitions from a “low failure rate” to a “high failure rate”. In doing so, the life of the lubricant life is maximized while vibrational damage to the toggle is maintained at a low state.
The above results confirm that vibration analysis is a novel approach for monitoring the lubrication condition of the toggle clamping system. It was observed that vibrational signatures pertaining to lubrication condition were more profound in the unclamping period than in the clamping period. This observation was supported by the fact that the toggle needed to overcome static friction each time the system was unclamped, while during clamping, it was only subjected to kinetic friction. Since static friction is much larger than kinetic friction, higher energy vibrational signatures relating to a deteriorating lubricating condition was emitted during the unclamping period.
The optimal condition monitoring approach did not come in the form of individually monitoring changes in the wave amplitude (RMS health indicator) nor the changes in characteristic frequencies (FC health indicator), but rather by monitoring the changes in the energy excitation potential which were dependent on a non-linear combination of amplitude and frequency (SRS health indicator). It therefore is apparent that these vibrational signatures indicative of lubricant degradation were transient in nature, paralleling the dynamic behavior of friction-induced vibrations [33]. These transient responses generated during the unclamping of the toggle clamping system were therefore induced by an increase in friction between the shaft and bearing-liner of the toggle. As cycle number progressed, the lubricating barrier separating the shaft and bearing liner gradually deteriorated due to heat and leakage, resulting in direct contact of these two metal components. This direct contact resulted in a random collision of surface asperities, generating a series of complex oscillations of varying amplitudes and frequencies.
Given this new found understanding of how lubricant deteriorates in the toggle, we can further improve our analytical framework by exploring an in-depth relationship between friction and vibrational energy dissipation. Our future work aims to devise a standalone, unsupervised system capable of monitoring the lubricating conditions of all toggle-type injection molding machines.

5. Conclusions

The toggle clamping system plays an integral part of an injection molding machine. In order to avoid catastrophic failure and unwanted downtime, the toggle must be properly lubricated. This study, hence, used vibration analysis to propose a method of monitoring the changes in the lubrication condition of the toggle for the purpose of determining the optimal timing for re-lubrication. From this study it was observed that it was the unclamping, rather than the clamping of the toggle, that provided the most useful information related to lubrication condition. This study also showed that the structural response algorithm (SRS) outperformed both the time domain (RMS) and frequency domain (FC) algorithms in analyzing the transient vibrational signatures generated as the lubrication condition of the toggle clamping system deteriorates from cycle to cycle.

6. Patents

A patent detailing a method for lubrication monitoring was developed as a result of this study. The patent’s application number is 109134808. Revision and approval were completed on October 2021.

Author Contributions

Conceptualization, H.-Y.C. and W.J.M.; methodology, H.-Y.C.; software, W.J.M.; validation, H.-Y.C. and W.J.M.; formal analysis, W.J.M.; investigation, W.J.M.; resources, H.-Y.C.; data curation, W.J.M.; writing—original draft preparation, W.J.M.; writing—review and editing, H.-Y.C.; visualization, W.J.M.; supervision, H.-Y.C.; project administration, H.-Y.C.; funding acquisition, H.-Y.C. All authors have read and agreed to the published version of the manuscript.

Funding

This research was funded by Taiwan’s Ministry of Science and Technology with grant number MOST 109-2218-E-035-008.

Institutional Review Board Statement

Not applicable.

Informed Consent Statement

Not applicable.

Data Availability Statement

Not applicable.

Acknowledgments

The authors would like to thank Chuan Lih Fa Machinery Works Co. Ltd. (Tainan, Taiwan) for providing us with the injection molding machine and their technical expertise.

Conflicts of Interest

The authors declare no conflict of interest.

References

  1. He, W.; Zhang, Y.F.; Lee, K.S.; Liu, T.I. Development of a Fuzzy-Neuro System for Parameter Resetting of Injection Molding. J. Manuf. Sci. Eng. 2000, 123, 110–118. [Google Scholar] [CrossRef]
  2. Tang, S.H.; Tan, Y.J.; Sapuan, S.M.; Sulaiman, S.; Ismail, N.; Samin, R. The Use of Taguchi Method in the Design of Plastic Injection Mould for Reducing Warpage. J. Mater. Process. Technol. 2007, 182, 418–426. [Google Scholar] [CrossRef]
  3. López, A.; Aisa, J.; Martinez, A.; Mercado, D. Injection Moulding Parameters Influence on Weight Quality of Complex Parts by Means of Doe Application: Case Study. Measurement 2016, 90, 349–356. [Google Scholar] [CrossRef]
  4. Ajay Shevale, R.S. Design and Analysis of Shutter in Injection Molding Machine. Int. J. Recent Technol. Mech. Electr. Eng. 2018, 5, 5. [Google Scholar]
  5. Sheikh, M. Study & Review of Design and Manufacturing of Vertical Injection Moulding Machine Prototype Parts. Available online: https://www.ijtre.com/images/scripts/16196.pdf (accessed on 28 November 2021).
  6. Chen, W.-C.; Tai, P.-H.; Wang, M.-W.; Deng, W.-J.; Chen, C.-T. A Neural Network-Based Approach for Dynamic Quality Prediction in a Plastic Injection Molding Process. Expert Syst. Appl. 2008, 35, 843–849. [Google Scholar] [CrossRef]
  7. Kumar, C.S.; Srikanth, S.; Das, S.K. Analysis of Premature Failure of a Tie Bar in an Injection Molding Machine. Eng. Fail. Anal. 2006, 13, 1246–1259. [Google Scholar]
  8. Sander, D.E.; Allmaier, H.; Priebsch, H.H.; Witt, M.; Skiadas, A. Simulation of Journal Bearing Friction in Severe Mixed Lubrication–Validation and Effect of Surface Smoothing Due to Running-In. Tribol. Int. 2016, 96, 173–183. [Google Scholar] [CrossRef] [Green Version]
  9. Plastic Injection Moulding Lubricants; Gleaner: Milnefield Ave, Elgin, UK, 2019.
  10. Lin, W.-Y.; Hsiao, K.M. Investigation of the Friction Effect at Pin Joints for the Five-Point Double-Toggle Clamping Mechanisms of Injection Molding Machines. Int. J. Mech. Sci. 2003, 45, 1913–1927. [Google Scholar] [CrossRef]
  11. Lin, W.Y.; Hsiao, K.M. Study on Improvements of the Five-Point Double-Toggle Mould Clamping Mechanism. Proc. Inst. Mech. Eng. Part C J. Mech. Eng. Sci. 2004, 218, 761–774. [Google Scholar] [CrossRef]
  12. Huang, M.-S.; Lin, T.-Y.; Fung, R.-F. Key Design Parameters and Optimal Design of a Five-Point Double-Toggle Clamping Mechanism. Appl. Math. Model. 2011, 35, 4304–4320. [Google Scholar] [CrossRef]
  13. Dietl, P.; Wensing, J.; van Nijen, G.C. Rolling Bearing Damping for Dynamic Analysis of Multi-Body Systems—Experimental and Theoretical Results. Proc. Inst. Mech. Eng. Part K J. Multi-Body Dyn. 2000, 214, 33–43. [Google Scholar] [CrossRef]
  14. Ankouni, M.; Lubrecht, A.; Velex, P. Modelling of Damping in Lubricated Line Contacts—Applications to Spur Gear Dynamic Simulations. Proc. Inst. Mech. Eng. Part C J. Mech. Eng. Sci. 2016, 230, 1222–1232. [Google Scholar] [CrossRef]
  15. Xiao, F.; Tian, C.; Wait, I.; Yang, Z.; Still, B.; Chen, G.S. Condition Monitoring and Vibration Analysis of Wind Turbine. Adv. Mech. Eng. 2014, 12, 1687814020913782. [Google Scholar] [CrossRef]
  16. Shah, B.A.; Vakharia, D.P. Online Condition Monitoring for Detection of Crack in the Shaft Using Vibration Analysis Method. Ind. Lubr. Tribol. 2018, 70, 1193–1200. [Google Scholar] [CrossRef]
  17. Vishwakarma, M.; Purohit, R.; Harshlata, V.; Rajput, P. Vibration Analysis & Condition Monitoring for Rotating Machines: A Review. Mater. Today Proc. 2017, 4, 2659–2664. [Google Scholar]
  18. Caesarendra, W.; Tjahjowidodo, T. A Review of Feature Extraction Methods in Vibration-Based Condition Monitoring and Its Application for Degradation Trend Estimation of Low-Speed Slew Bearing. Machines 2017, 5, 21. [Google Scholar] [CrossRef]
  19. Fu, T.-C. A Review on Time Series Data Mining. Eng. Appl. Artif. Intell. 2011, 24, 164–181. [Google Scholar] [CrossRef]
  20. Mohd Ghazali, M.H.; Rahiman, W. Vibration Analysis for Machine Monitoring and Diagnosis: A Systematic Review. Shock Vib. 2021, 2021, 9469318. [Google Scholar] [CrossRef]
  21. Igba, J.; Alemzadeh, K.; Durugbo, C.; Eiriksson, E.T. Analysing Rms and Peak Values of Vibration Signals for Condition Monitoring of Wind Turbine Gearboxes. Renew. Energy 2016, 91, 90–106. [Google Scholar] [CrossRef] [Green Version]
  22. Ahmed, H.; Nandi, A. Time-Frequency Domain Analysis. In Condition Monitoring With Vibration Signals; Wiley: Hoboken, NJ, USA, 2019; Volume 5, pp. 79–114. [Google Scholar]
  23. Feng, Z.; Liang, M.; Chu, F. Recent Advances in Time–Frequency Analysis Methods for Machinery Fault Diagnosis: A Review with Application Examples. Mech. Syst. Signal Process. 2013, 38, 165–205. [Google Scholar] [CrossRef]
  24. Yan, R.; Gao, R.X.; Chen, X. Wavelets for Fault Diagnosis of Rotary Machines: A Review with Applications. Signal Process. 2014, 96, 1–15. [Google Scholar] [CrossRef]
  25. Khadersab, A.; Shivakumar, S. Vibration Analysis Techniques for Rotating Machinery and Its Effect on Bearing Faults. Procedia Manuf. 2018, 20, 247–252. [Google Scholar] [CrossRef]
  26. Bergland, G.D. A Guided Tour of the Fast Fourier Transform. IEEE Spectr. 1969, 6, 41–52. [Google Scholar] [CrossRef]
  27. Cochran, W.T.; Cooley, J.W.; Favin, D.L.; HelmsH, D.; Kaenel, R.A.; Lang, W.W.; Maling, G.C.; Nelson, D.E.; Rader, C.M.; Welch, P.D. What Is the Fast Fourier Transform? Proc. IEEE 1967, 55, 1664–1674. [Google Scholar] [CrossRef]
  28. Yang, B.S.; Widodo, A. Introduction of Intelligent Machine Fault Diagnosis and Prognosis; Nova Science Publishers: New York, NY, USA, 2009; pp. 1–351. [Google Scholar]
  29. Alexander, J. The Shock Response Spectrum—A Primer. Sound Vib. 2009, 43, 6–14. [Google Scholar]
  30. Gaberson, H. Shock Severity Estimation. Sound Vib. 2012, 46, 12–20. [Google Scholar]
  31. Irvine, T. An Introduction to the Shock Response Spectrum, Rev S. Available online: https://www.vibrationdata.com/tutorials2/srs_intr.pdf (accessed on 28 November 2021).
  32. Ando, J.; Yamaguchi, T.; Hokkirigawa, K. Improvement in Mixed Lubrication Characteristics of Electromagnetic Clutch Coated with Dlc-Si Film by Controlling Surface Roughness and Providing Micro-Groove. Toraibarojisuto/J. Jpn. Soc. Tribol. 2013, 58, 685–694. [Google Scholar] [CrossRef] [Green Version]
  33. Chen, G. Fundamentals of Contact Mechanics and Friction. In Handbook of Friction-Vibration Interactions; Woodhead Publishing: Swaston, Cambridge, UK, 2014; Volume 3, pp. 71–152. [Google Scholar]
  34. Li, Q.; Dimaki, A.; Popov, M.; Psakhie, S.G.; Popov, V.L. Kinetics of the Coefficient of Friction of Elastomers. Sci. Rep. 2014, 4, 5795. [Google Scholar] [CrossRef] [Green Version]
  35. Wu, T.; Mao, J.; Dong, G.; Xu, H.; Xie, Y. Journal Bearing Wear Monitoring Via on-Line Visual Ferrography. Adv. Mater. Res. 2008, 44–46, 189–194. [Google Scholar] [CrossRef]
Figure 1. CLF 600TX Plastic Injection Molding Machine.
Applsci 12 00196 g001
Figure 2. A schematic of the (a) clamped and (b) unclamped injection molding machine and the mounted sensors.
Applsci 12 00196 g002
Figure 3. Profile of signal collected by the DAQ system.
Applsci 12 00196 g003
Figure 4. Flowchart of the data analysis procedure.
Applsci 12 00196 g004
Figure 5. Shock response spectrum.
Applsci 12 00196 g005
Figure 6. Time domain analysis for monitoring of the toggle’s lubricating condition: (a) Plot of RMS health indicator vs. cycle number for the clamping period; (b) plot of RMS health indicator vs. cycle number for the unclamping period.
Applsci 12 00196 g006
Figure 7. Frequency domain analysis for condition monitoring of the toggle’s lubricating condition: (a) plot of FC health indicator vs. cycle number for the clamping period; (b) plot of FC health indicator vs. cycle number for the unclamping period.
Applsci 12 00196 g007
Figure 8. Structural response analysis for monitoring the lubricating condition of the toggle clamping system: (a) plot of SRS health indicator vs. cycle number for the clamping period; (b) plot of SRS health indicator vs. cycle number for the unclamping period.
Applsci 12 00196 g008
Publisher’s Note: MDPI stays neutral with regard to jurisdictional claims in published maps and institutional affiliations.

