1. Introduction
Brownout is the name of the limited visual field of a helicopter pilot after environmental impact, which easily occurs in a sand-dust environment. The main influence area of brownout is the circle around the helicopter which is several times of the radius of the rotor. The hovering flow field will entrain many sandy particles from the ground into the air, thus reducing the pilot’s visibility of the surrounding environment. The degree of visual limitation depends on the type of helicopter (single rotor or coaxial twin-rotor), and the operation condition (helicopter landing posture or flight trajectory). In this environment, the pilot can easily lose a sense of space and direction, and can become unable to judge the ground position, horizontal attitude and other information accurately. The pilot will then make mistakes in the control of the helicopter, which can cause the helicopter to crash and result in injury to the pilot.
As early as the 1940s, Bagnold [
1] started to study the problem of wind-drift sand in the desert of Libya. Combined with wind tunnel experiments, he produced a series of formulas for the efficiency of wind-drift sand transportation. Wachspress et al. [
2] established a dusty entrainment model using Bagnold’s method. In the 1960s, Sutherland [
3] studied the way that turbulence carries sand from the ground. An entrainment hypothesis that turbulent eddy currents destroy the viscous layer and directly impact on the sand surface was proposed. Leese and others of the US Army [
4] studied the entrainment of the downwash flow when the helicopter is near the ground, which is called the blast effect. Subsequently, Rodgers [
5] carried out several large-scale experimental studies using a twin-rotor helicopter which hovered near the ground with a dust collector. As a result, it was found that the entrainment particles are larger when the helicopter is closer to the ground.
In the 21st century, particle image velocimetry (PIV) have become the mainstream methods for researchers to analyze brownout. Leishman et al. [
6] used PIV to study the two-phase flow environment caused by a helicopter hovering on sands. It was found that in the process of the viscous merging of an adjacent wake vortex, the velocity of the upward flow increases significantly. It was observed that the sandy particles with enough height will recycle into the rotor wake and spray to the ground, causing dusty entrainment through the process of bombardment. Lee et al. [
7] conducted experiments based on PIV and found that the viscous diffusion process, strain-induced vorticity enhancement process and the generations of turbulence are the factors that affect the flow field characteristics. Nathan and Green [
8] used PIV to observe the flow structure in front of and under the helicopter rotor during forward flight and found that forward flight has a significant effect on the wake compared with hovering, and the rotor wake will be closer to the blade and smaller.
Ramasamy and Leishman [
9] studied the effects of vortex filament deformation and viscous diffusion. Syal and Leishman [
10] used the Lagrangian method to calculate the movement of particles in the flow field, and simulated the two-phase flow containing sand. Milluzzo et al. [
11] used PIV to study the scaled model with four different tip shapes, and measured the vortex core size and the vortex sheet velocity at 800° azimuth. The results show that there are some common flow characteristics among the four different tip shapes, and the difference of flow may ultimately affect the evolution of brownout. The slotted tip is especially effective in diffusing the tip vortex.
Polzin et al. [
12] used a computational fluid dynamics (CFD) method to study the influence of a discrete rotor blade model in the dusty cloud caused by helicopter downwash. The results of the wake velocity profile, ground shear force profile and dusty cloud density at different heights of the independent rotor in hover are given and compared with the steady model. Hance et al. [
13] added fuselage to the simulation to study the influence of the fuselage on rotor flow field in the brownout phenomenon.
Whitehouse et al. [
14] conducted brownout experiments using a scaled model (chord length of 1 inch, tip velocity of 200 ft/s) with the same strength as the full-scale helicopter tip vortex. It was found that the dissipation of the tip vortex can be accelerated by adding a winglet at the trailing edge of the blade. Subsequently, they [
15] established the key relationship between the rotor wake and tip vortex characteristics in the brownout phenomenon and developed a method to reduce the entrainment effect of the brownout phenomenon without changing the aerodynamic performance of the rotor.
Taking UH60 as an example, we study the factors affecting brownout during hovering, which can provide suggestions to pilots flying in relevant environments. We analyze a kind of blade structure, and discuss its effect on suppressing brownout.
2. Numerical Simulation Theory
2.1. Governing Equation
In computational fluid dynamics, the computer obtains the physical parameters of the flow field by solving the governing equations, which are generally considered as the mass conservation equation, momentum conservation equation and energy conservation equation [
16].
The mass conservation equation is also called a continuity equation. According to the law of mass conservation, the mass of fluid passing through the surface of volume in the flow field is consistent with the variable controlling the mass of fluid in the volume.
where
is the density of the fluid,
is the normal velocity,
is the surface area of the control volume, and
is the volume The continuity equation of any point in the flow field can be deduced by using the above integral form of mass conservation equation:
This is the continuous differential equation of unsteady compressible flow.
For incompressible flow,
is a constant
In the following cases, the rotor tip Mach number is much less than 1, and it could be approximately considered as an unsteady incompressible flow.
A momentum conservation equation, known as a Navier–Stokes (N-S) equation, refers to the change rate of fluid momentum relative to time in the fluid micro cluster, which is the sum of external forces on the fluid micro cluster. The formula is as follows:
where
is the volume force,
is the mass flow rate,
is the pressure, and
is the shear stress tensor.
For incompressible fluid, the above formula can be simplified and expressed as follows:
where the kinematic viscosity
is the ratio of dynamic viscosity to density.
The above are the governing equations of continuous medium hydrodynamics. The computer divides the flow field into a large number of grids based on the finite volume method and solves them. In some cases, it is necessary to add other equations for closure.
2.2. Turbulence Model
Turbulence is an inevitable problem in the simulation of flow field. The rotor flow field of helicopter is a highly nonlinear turbulent flow, so before conducting the numerical simulation of a rotor flow field, it is necessary to study the turbulence model and add an appropriate turbulence model in the flow-governing equation to obtain a reasonable solution and complete the flow field simulation.
The
two-equation model uses the
model in the boundary layer, which has better treatment effect in the viscous sublayer region. It is transformed into a
model in the outer layer, which avoids the problem that the
model is too sensitive to the turbulent characteristics. The viscous formula is modified by considering the shear stress in the turbulent flow. It is more suitable for high curvature flow, flow with obvious separation and jet flow, and more accurate for the rotor flow field model. The turbulent kinetic energy
, turbulent dissipation rate ε and specific dissipation rate
are as follows:
2.3. Gas-Solid Two-Phase Flow Model
For the description of the brownout phenomenon, the most appropriate model is the gas-solid two-phase flow model. In the simulation of the gas-solid two-phase flow, the force between fluid and solid, and the force between solid particles and the wall should be considered. At present, the research of the gas-solid two-phase flow has been more mature, and the main models used are the Euler–Euler method, Euler–Lagrange method, and the dynamic model of particle impingement.
The Euler–Lagrange method is usually used when considering the motion of a single particle or particles. The fluid phase is still described by the Euler method, and the particle motion is described by ordinary differential equations in Lagrange coordinates.
In recent years, a discrete element model (DEM) considering particle collision has been developed, and this can be applied to a dense gas-solid two-phase flow. In addition, the model does not directly solve the flow field around the particles and uses a suitable drag model to replace the force between the particles and flow field, which greatly reduces the calculation cost and can track a high number of particles.
When calculating the force between particles, it is necessary to consider the collision of particles. The common models are the soft ball model and the hard ball model. In this paper, the soft ball model is adopted. The basic assumption is that the particle collision will last for some time, and there will be slight deformation in the collision process (which is shown as overlapping phenomenon in the calculation). On this basis, the spring and damper are used to simulate the particle collision phenomenon.
The hard sphere model is based on the law of impulse conservation, and the basic assumption is that the collision process of particles is completed in an instant without considering the deformation of particles. In the mathematical model, the collision is completed in a time step, and the recovery coefficient is used to solve the velocity after collision.
The specific process of simulation is to calculate the kinetic energy loss through the material characteristics and the particle velocity at the time of collision, and to reflect the kinetic energy loss by applying a force in the opposite direction to the particle. The normal deformation and tangential deformation of particles are then calculated according to the material rigidity, particle velocity and resistance. At the same time, the normal resistance and tangential resistance are calculated from the deformation and kinetic energy loss. The normal force will make the particles rebound, and the tangential force will make the particles rotate.
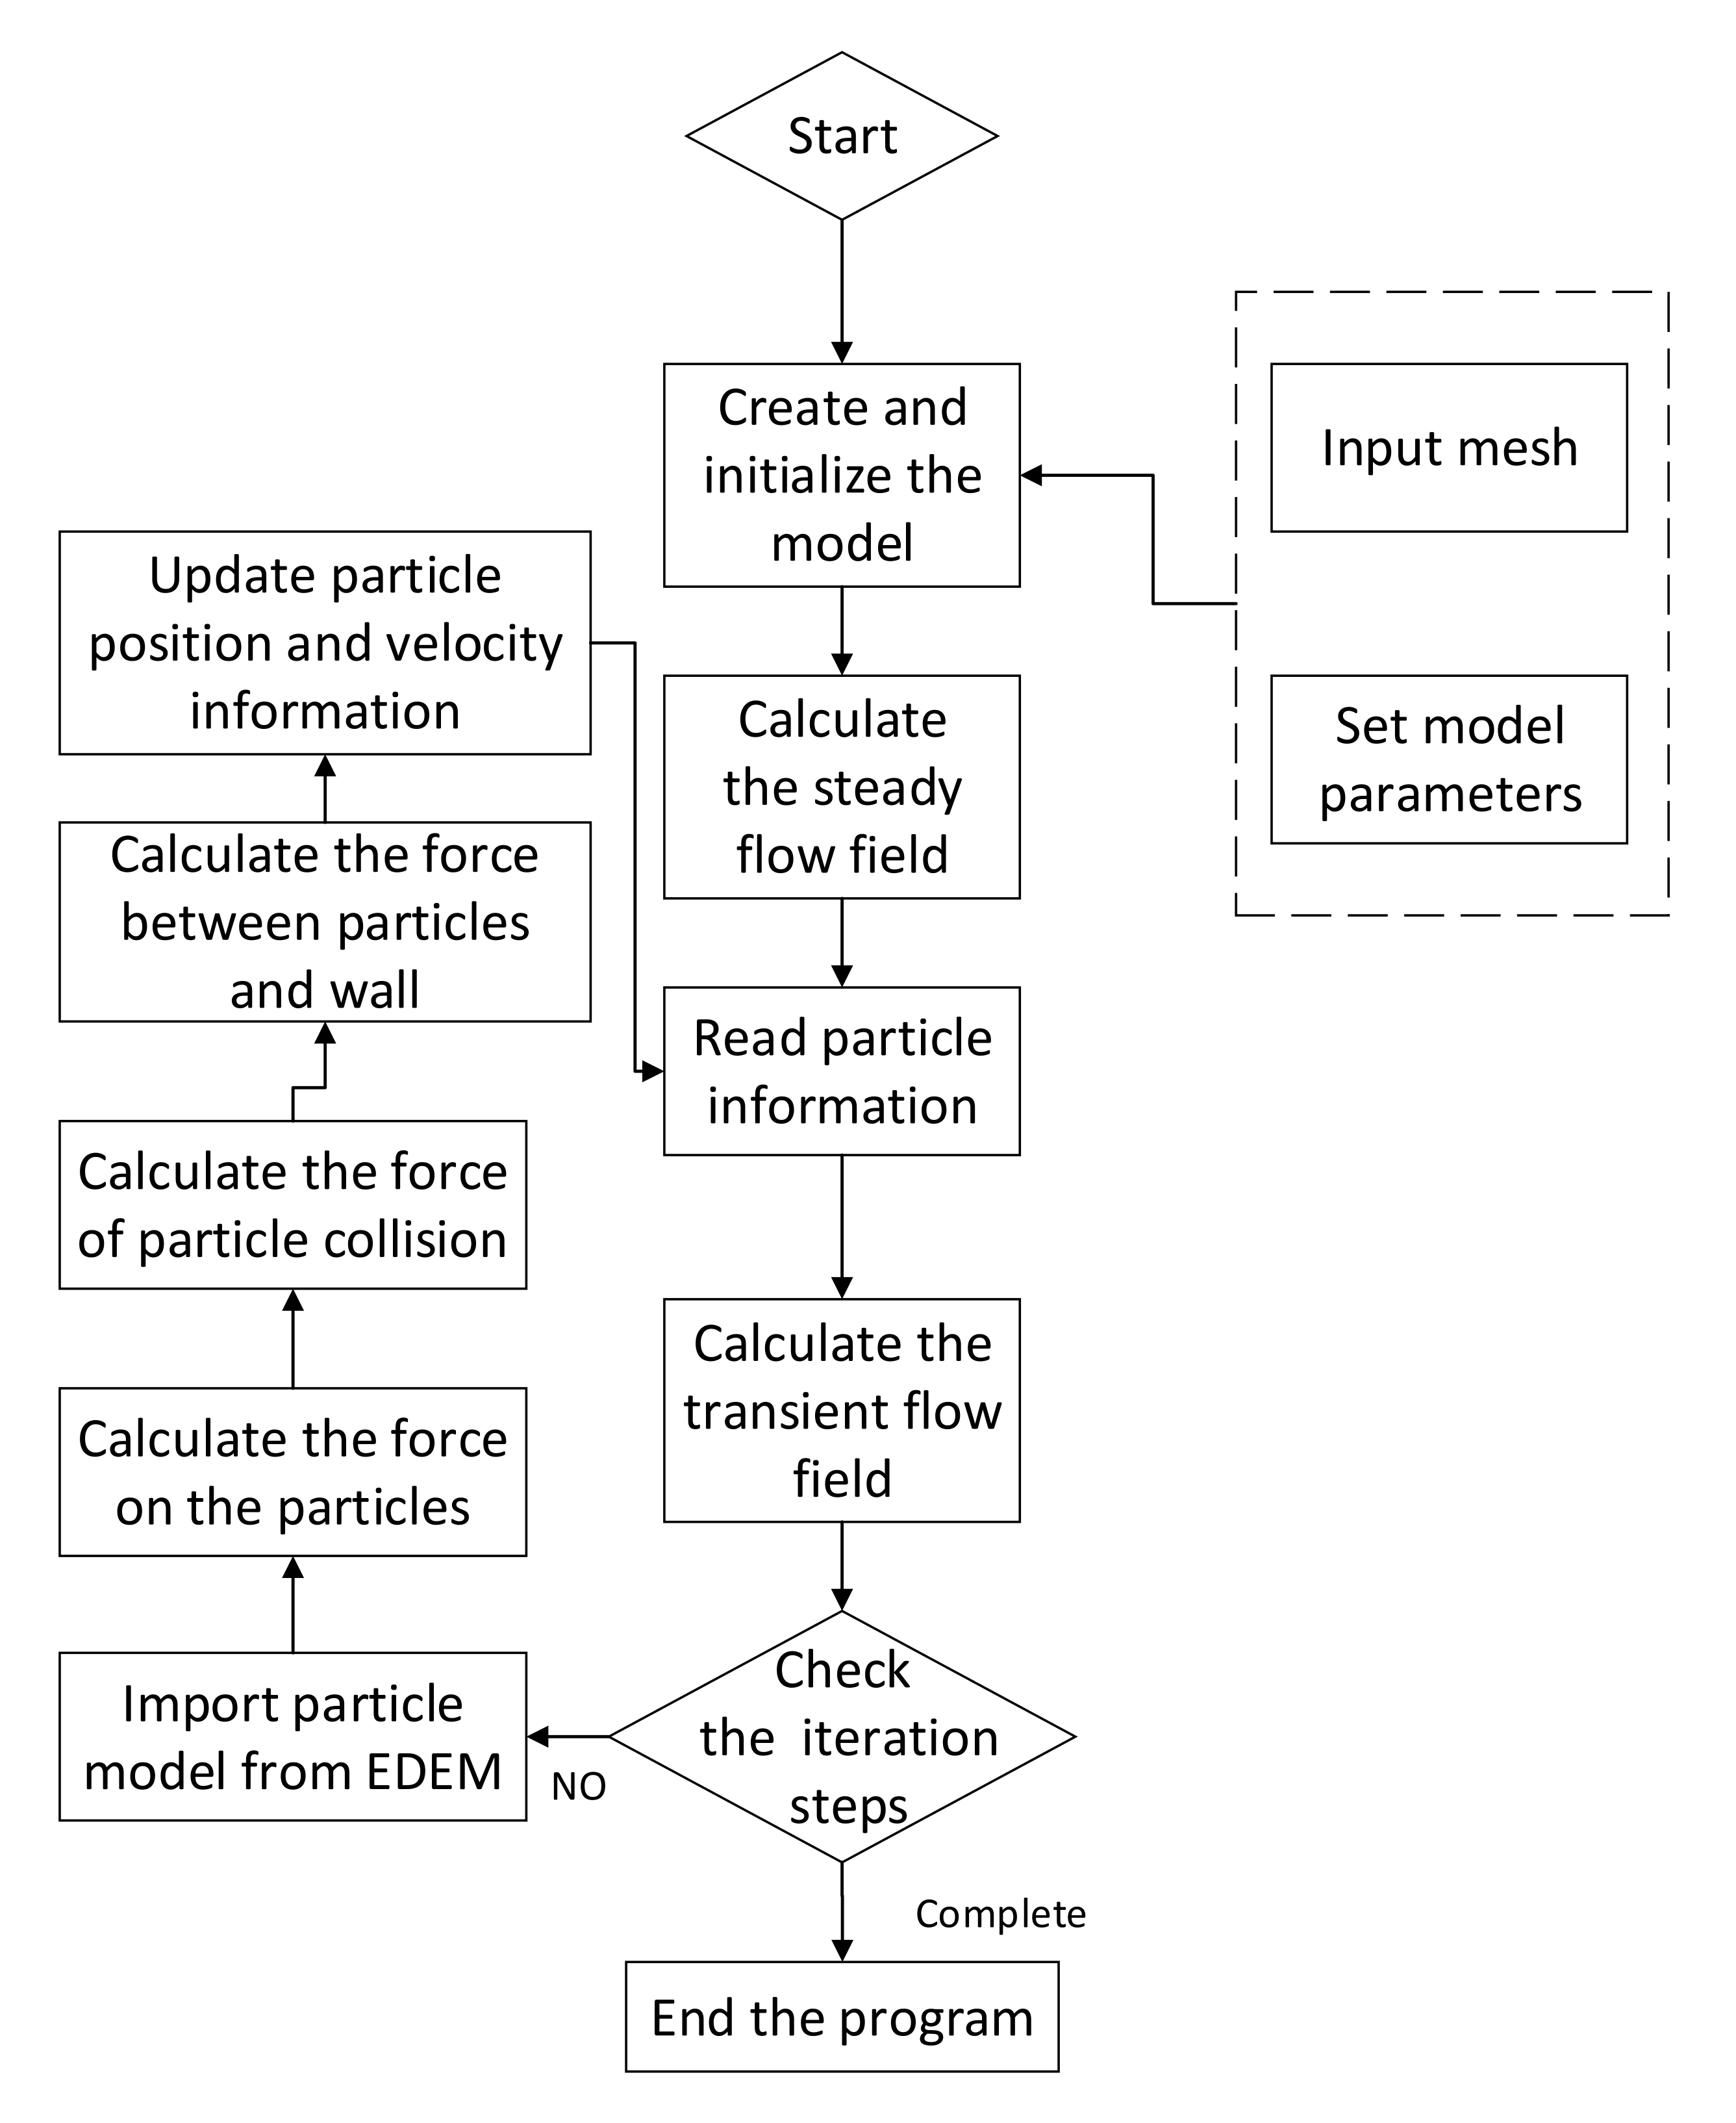
The gas-solid two-phase flow model’s calculation process is shown in
Figure 1:
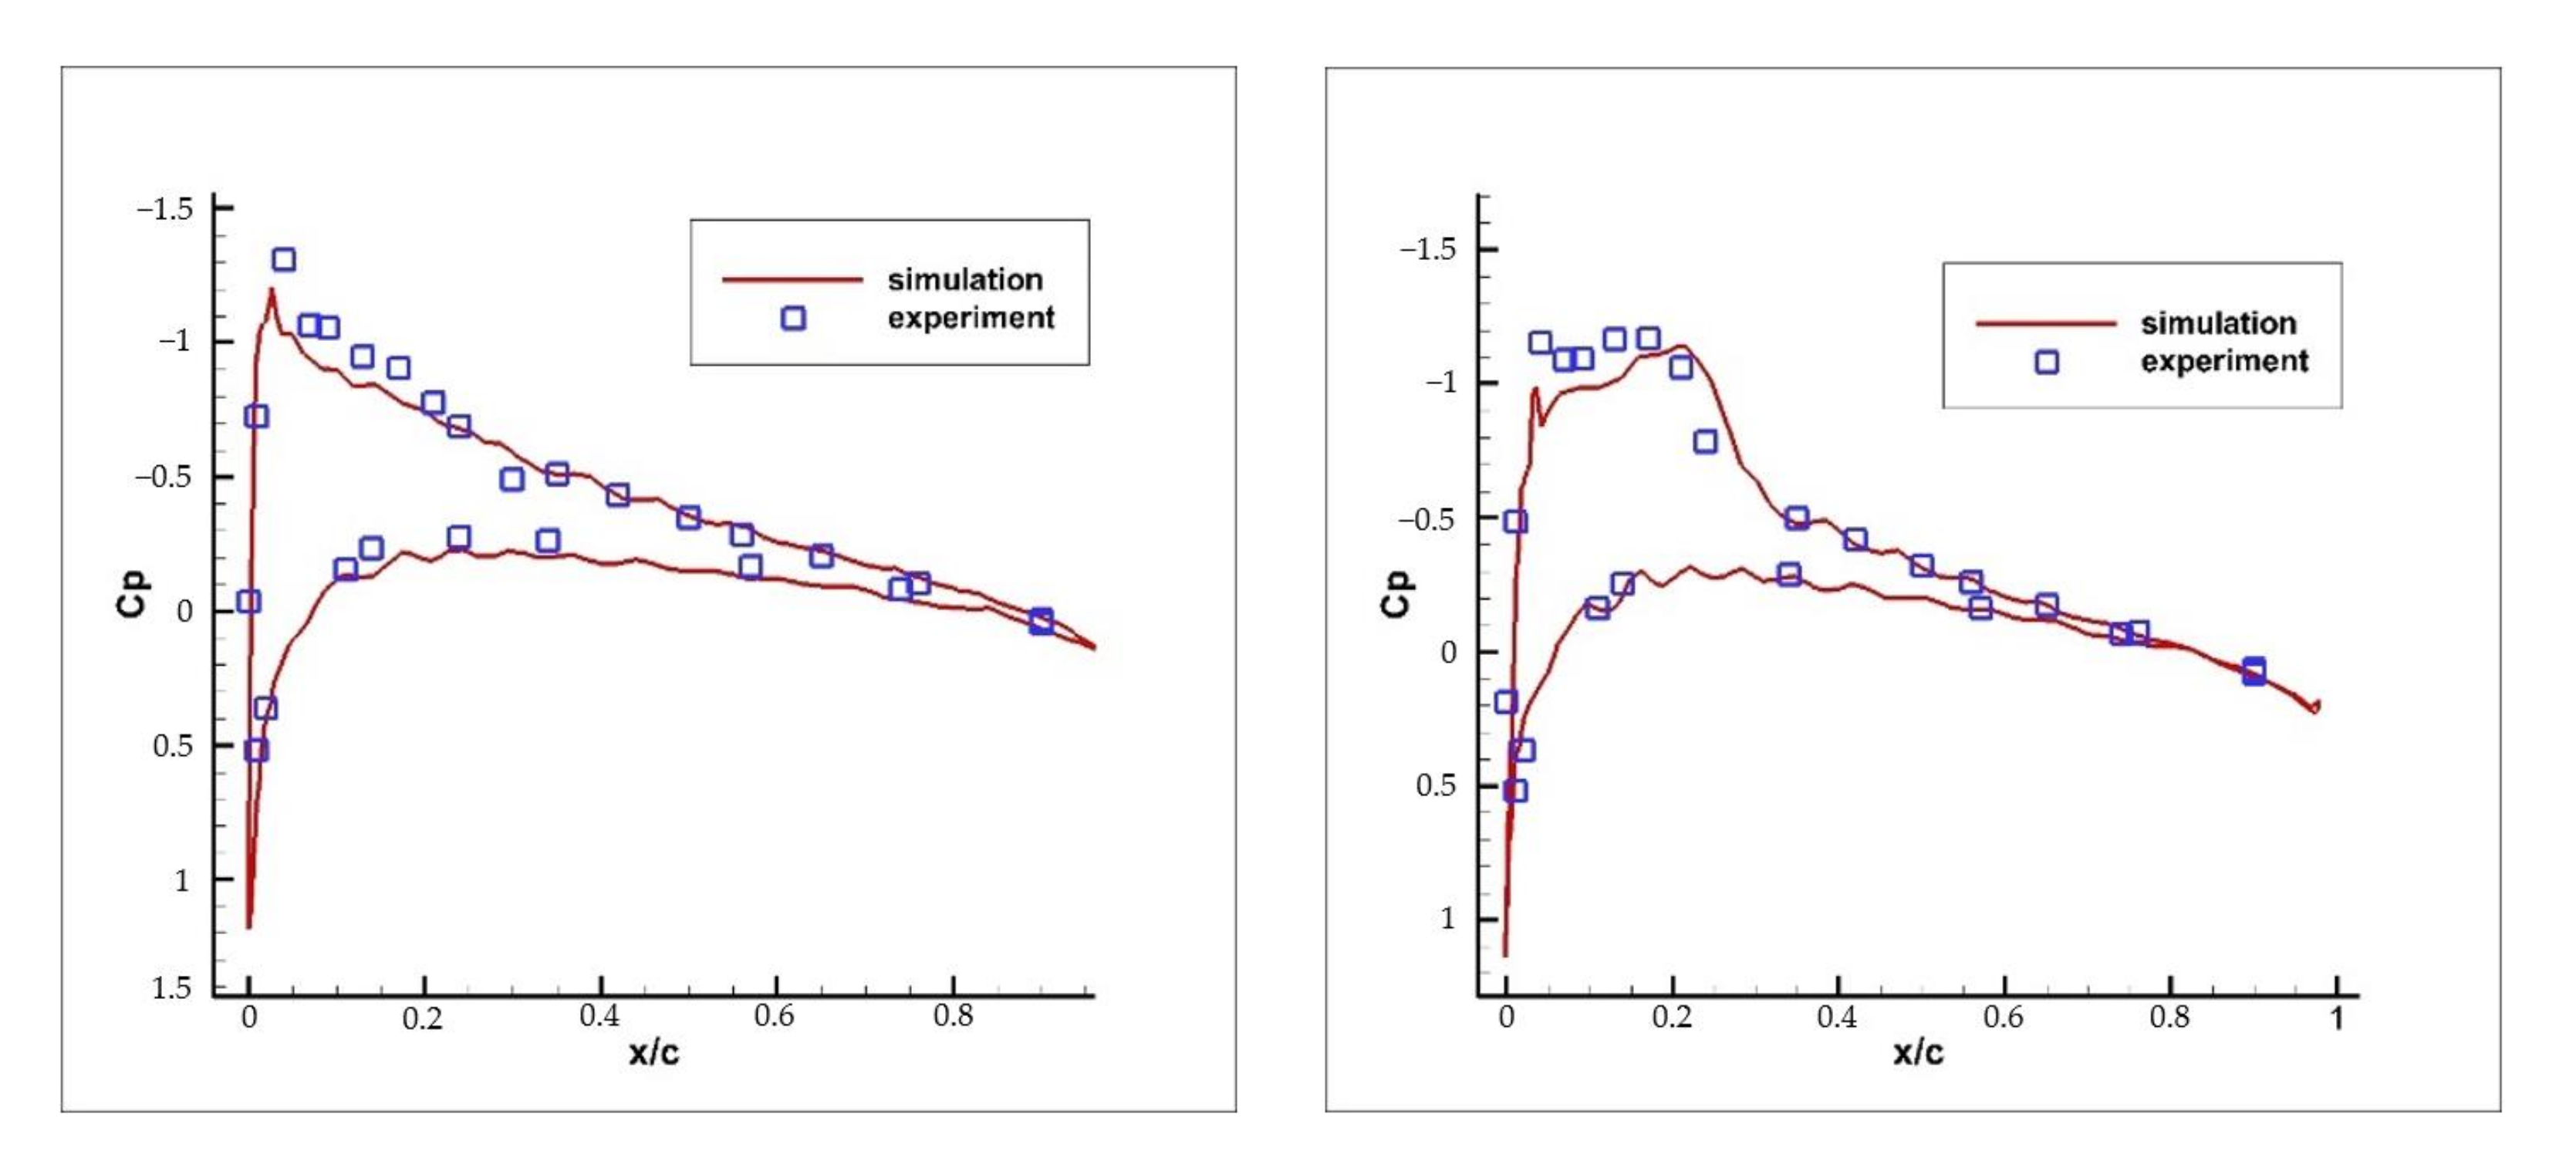
4. Coupling Simulation Analysis
The above two blades prove the reliability of the simulation model, but due to the lack of corresponding fuselage, the classic helicopter UH60 was selected to analysis the brownout. The discrete element model and computational fluid dynamics model were used for coupling calculation to analyze the formation and evolution of brownout. The software used are EDEM and FLUENT. The fluid solver is based on RANS with the turbulence model. The spatial discretization is second order upwind for momentum, turbulent kinetic energy and specific dissipation rate.
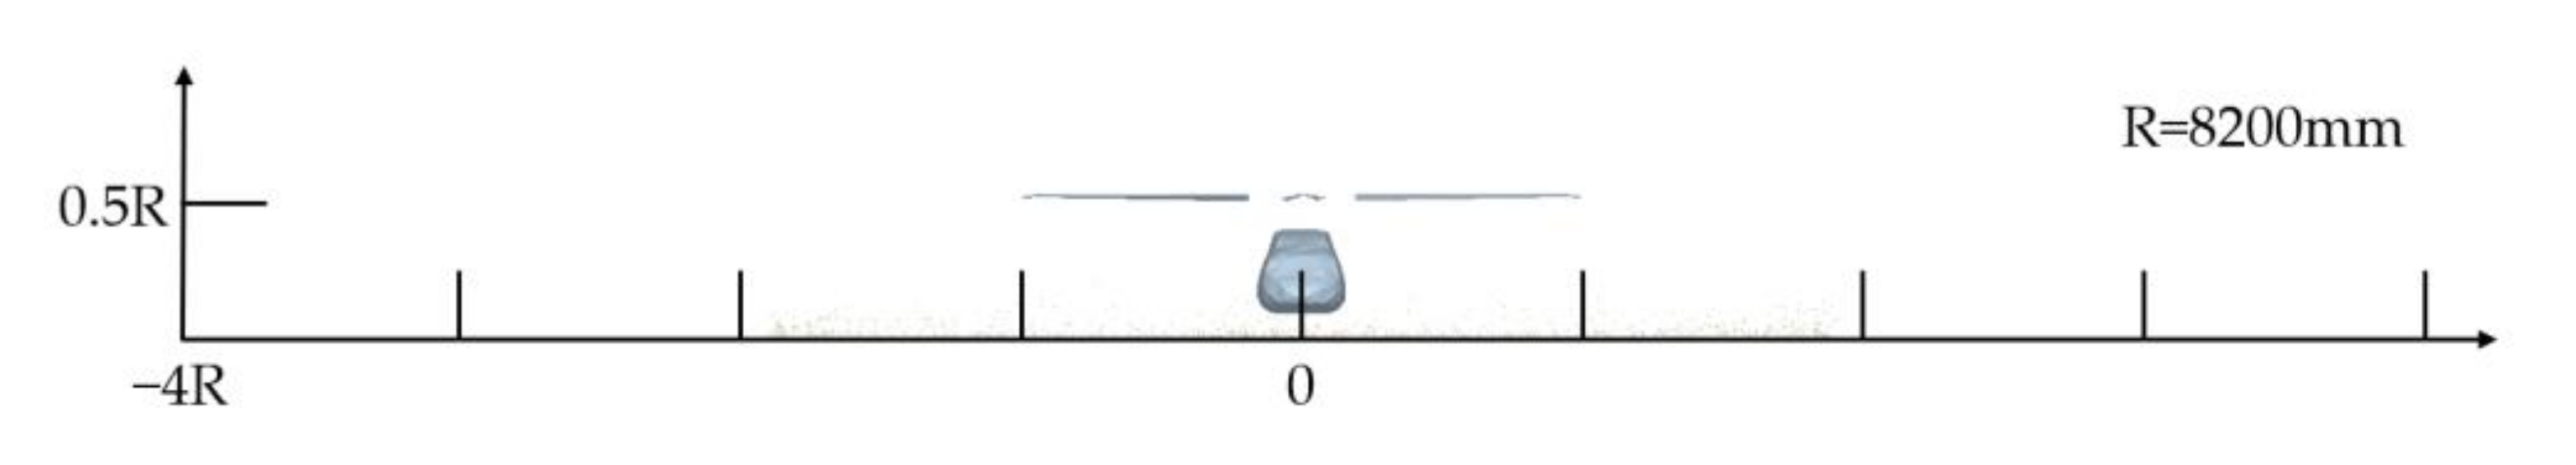
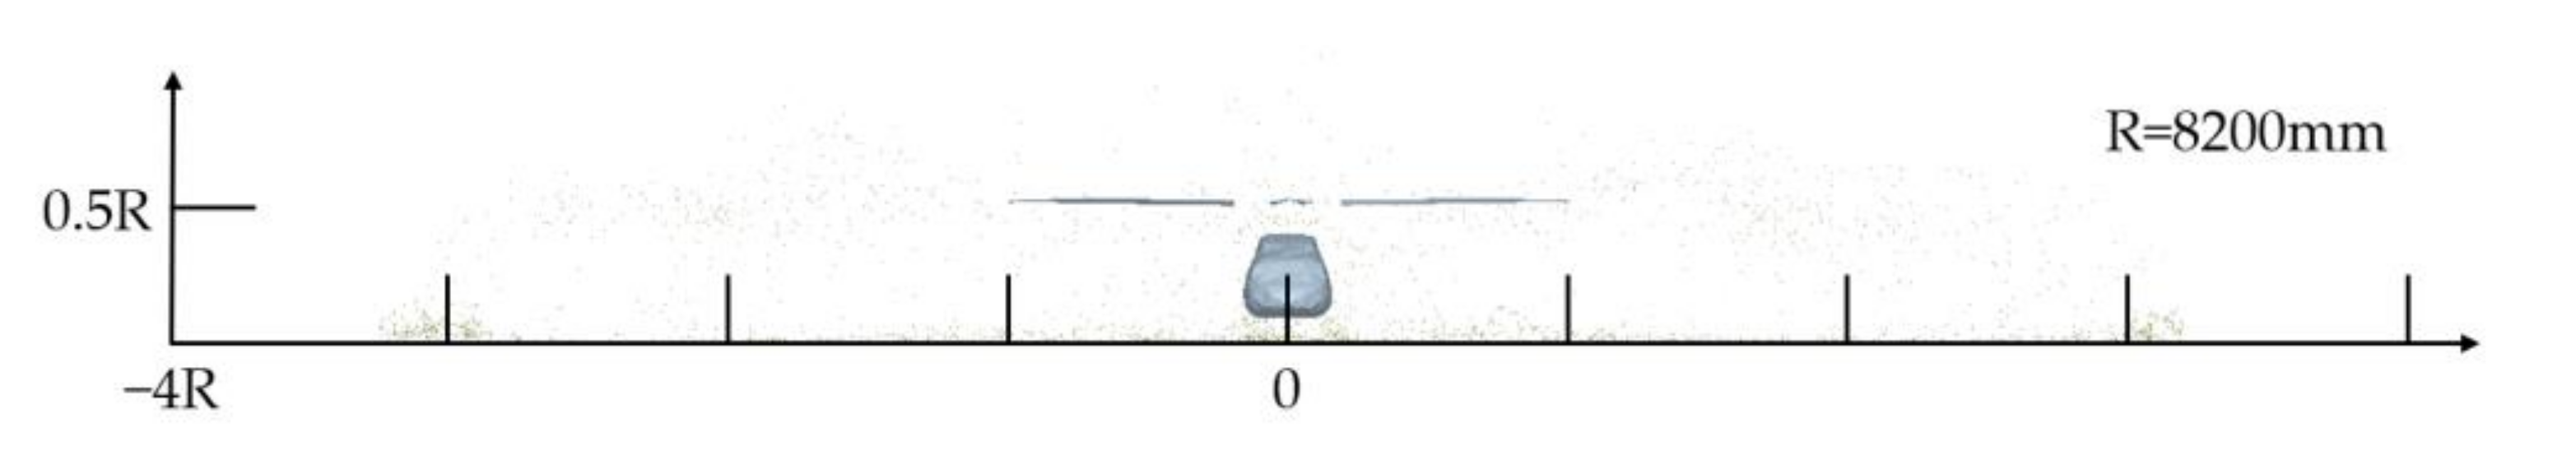
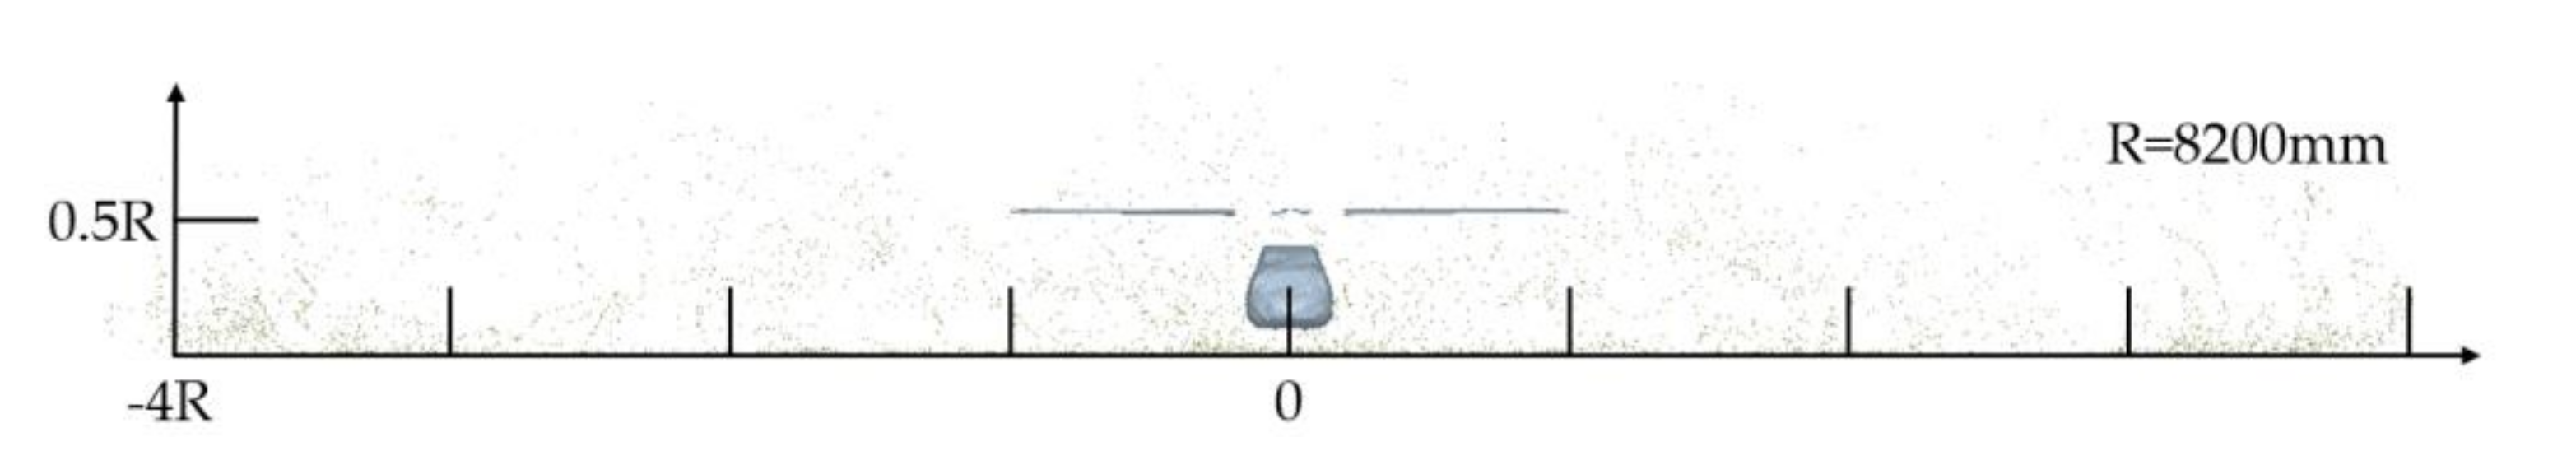
The UH60 adopts three-stage twist and swept rotor blades, with the airfoil of SC1095 and SC1094R8. The tip Mach number is 0.63, the collective pitch is 9°, the blade radius is 8200 mm, chord length is 530 mm, the tip swept angle is 20° and the negative twist angle is 13° [
20]. The model uses an unstructured grid with a total of 12 million. The time step size is the time taken for one degree per revolution of the blade tip.
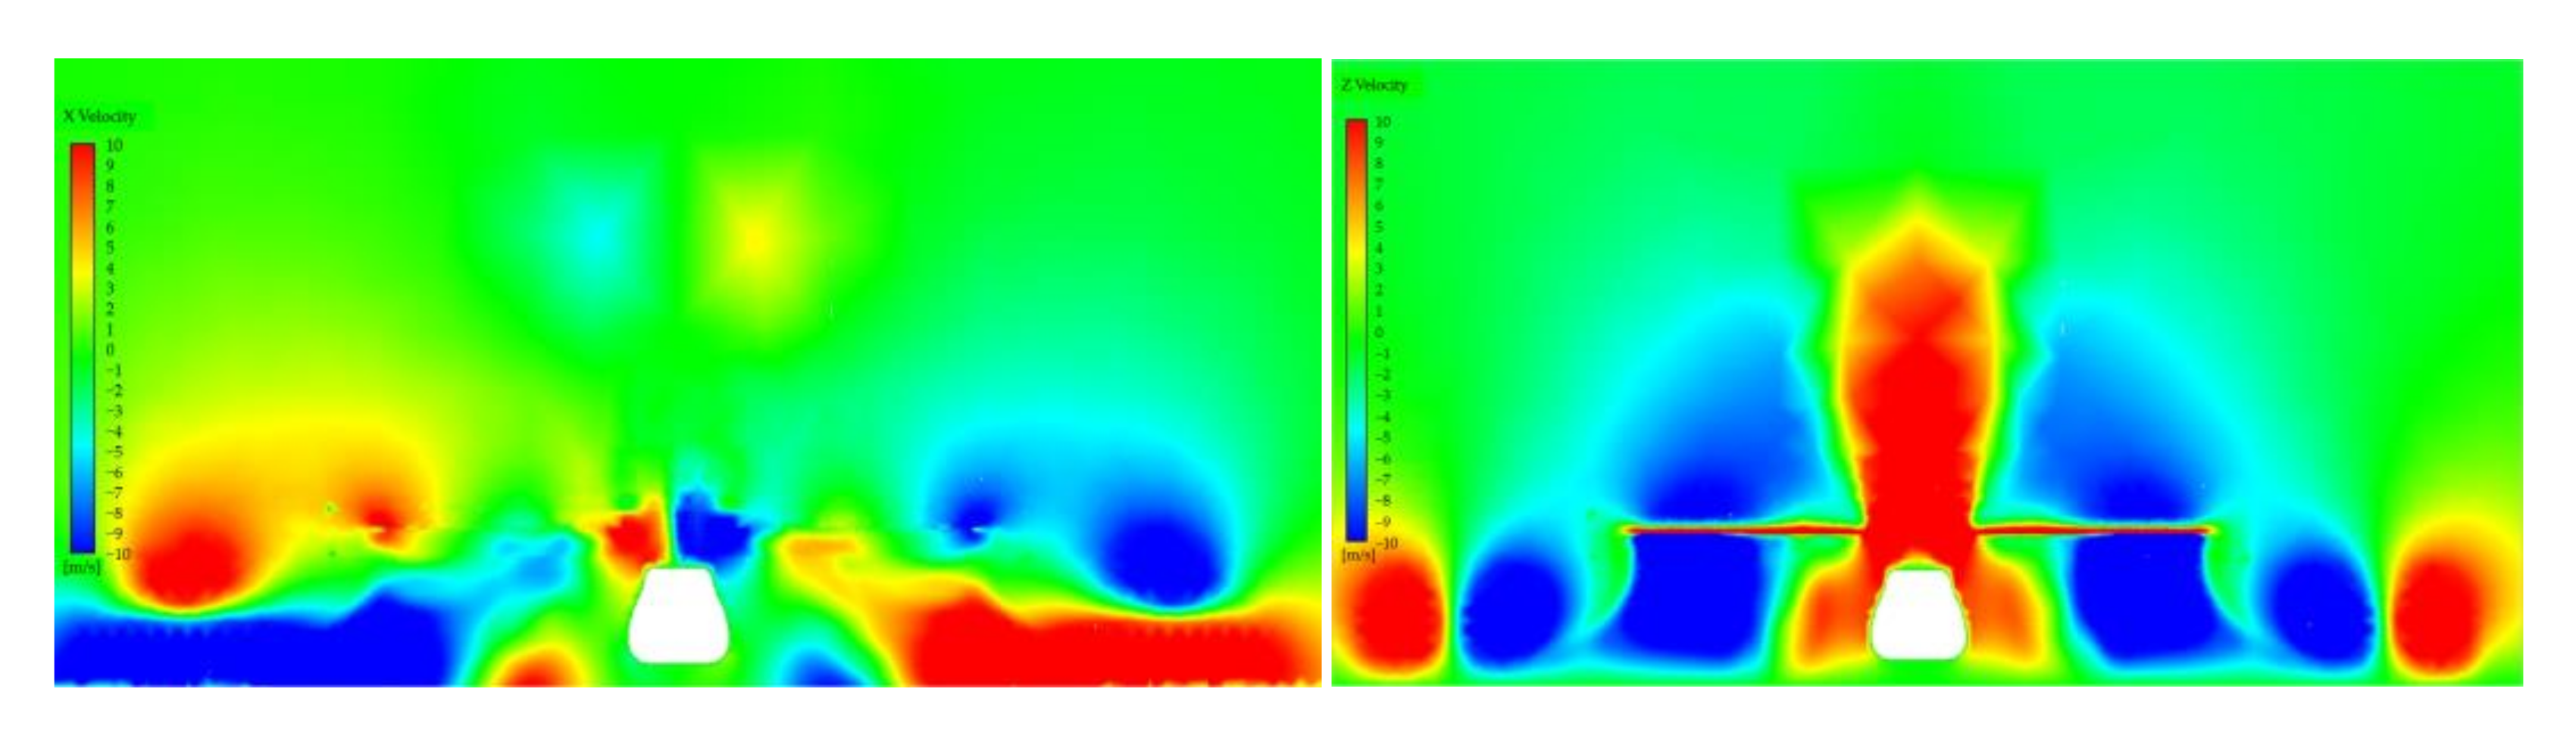
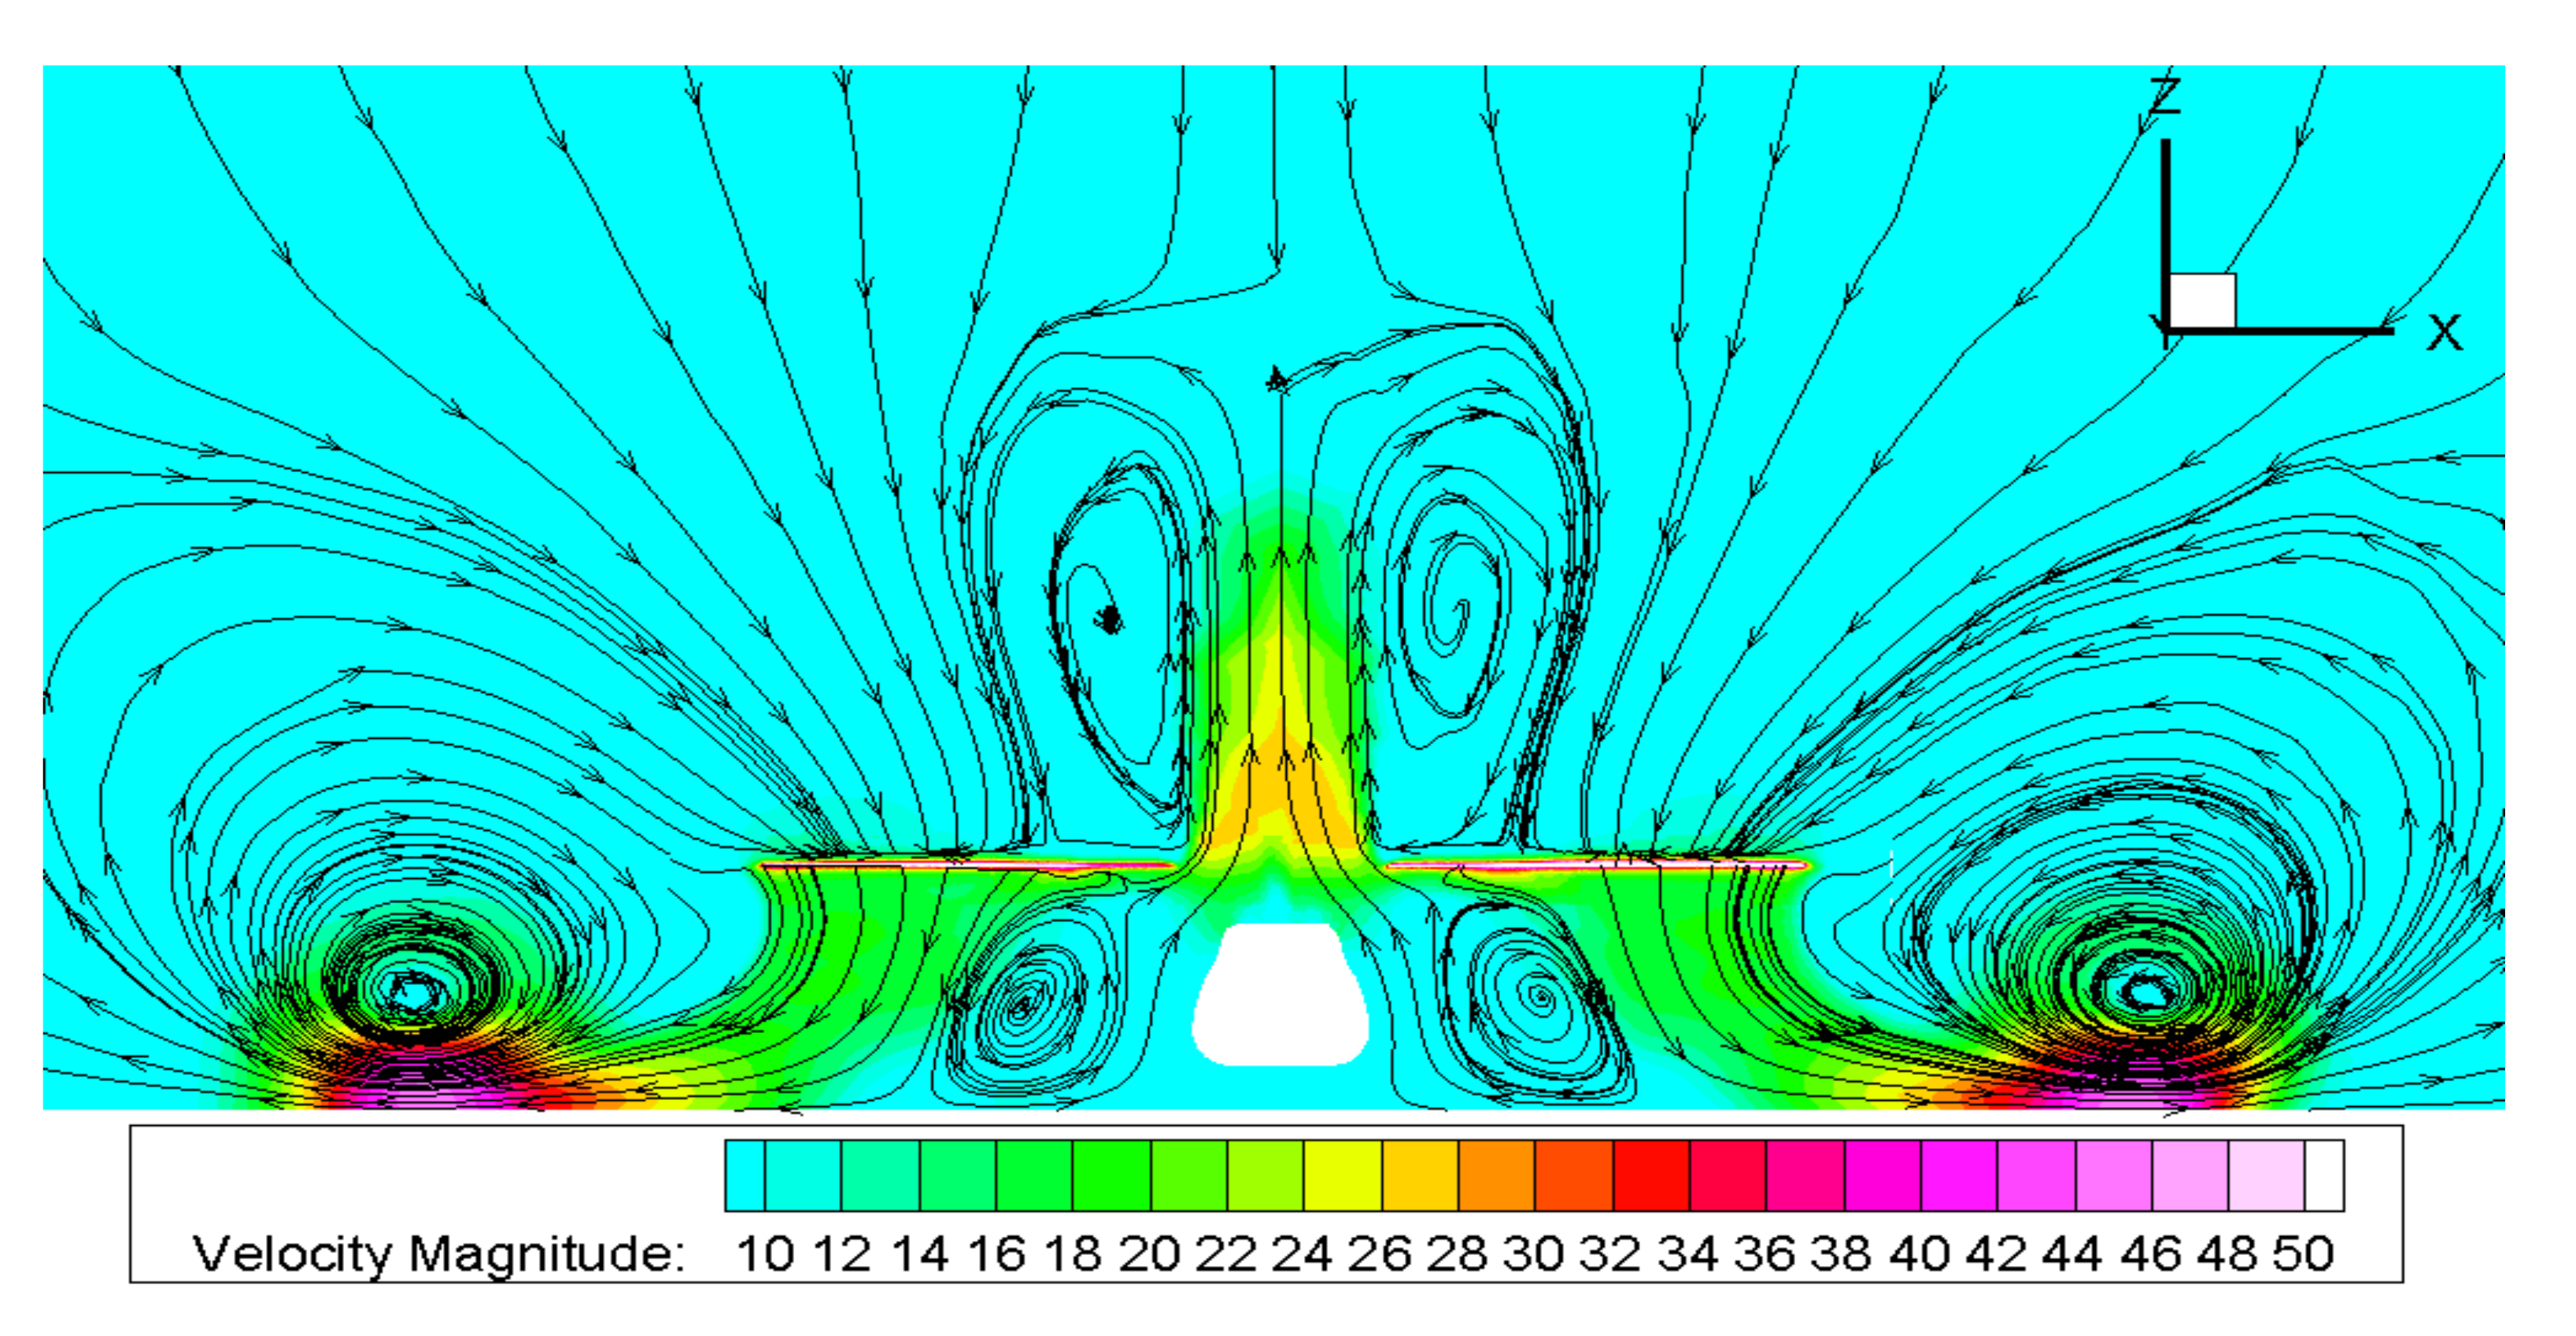
When the height is h/R = 0.52, the rotor ground effect flow field is calculated by using the sliding grid method. The time step size is the time required for each degree of blade rotation. The velocity and streamline distribution are shown in
Figure 6 and
Figure 7. The x direction is the in-coming flow direction, and the z direction is the direction perpendicular to the ground.
From the above figure it can be seen that there is obvious swirling air flows under the out-ward side of the blade, and that the air flows down from the tip of the blade and rolls back over the blade when it reaches the ground. There are also two smaller raceways above the blade root, which are judged to be caused by the high-intensity vortex.
In the process of the coupling simulation, the particles are simplified as spherical particles in the sand model, and the interaction between particles is solved by the Hertz Mindlin (no slip) model, and the interaction between particles and wall (including fuselage, blade and ground) is solved by the Hertz Mindlin with JKR (Johnson Kendall Roberts) contact model. The particles and the flow field exhibit two-way coupling. The flow field is solved for 0.5 s to achieve stability, then 5000 to 20,000 particles are added in the vicinity of the ground according to the time for calculation. The physical parameters of the particles are shown in
Table 5 [
21].
4.1. Result of Hovering Height 0.52R
The movement and distribution of simulated sand particles are studied.
Figure 8,
Figure 9 and
Figure 10 show the distribution of sand around the fuselage at different times when the hovering height of the UH60 is 0.52R, the particle radius is 10 um, and the number of increased particles is 2500 per second.
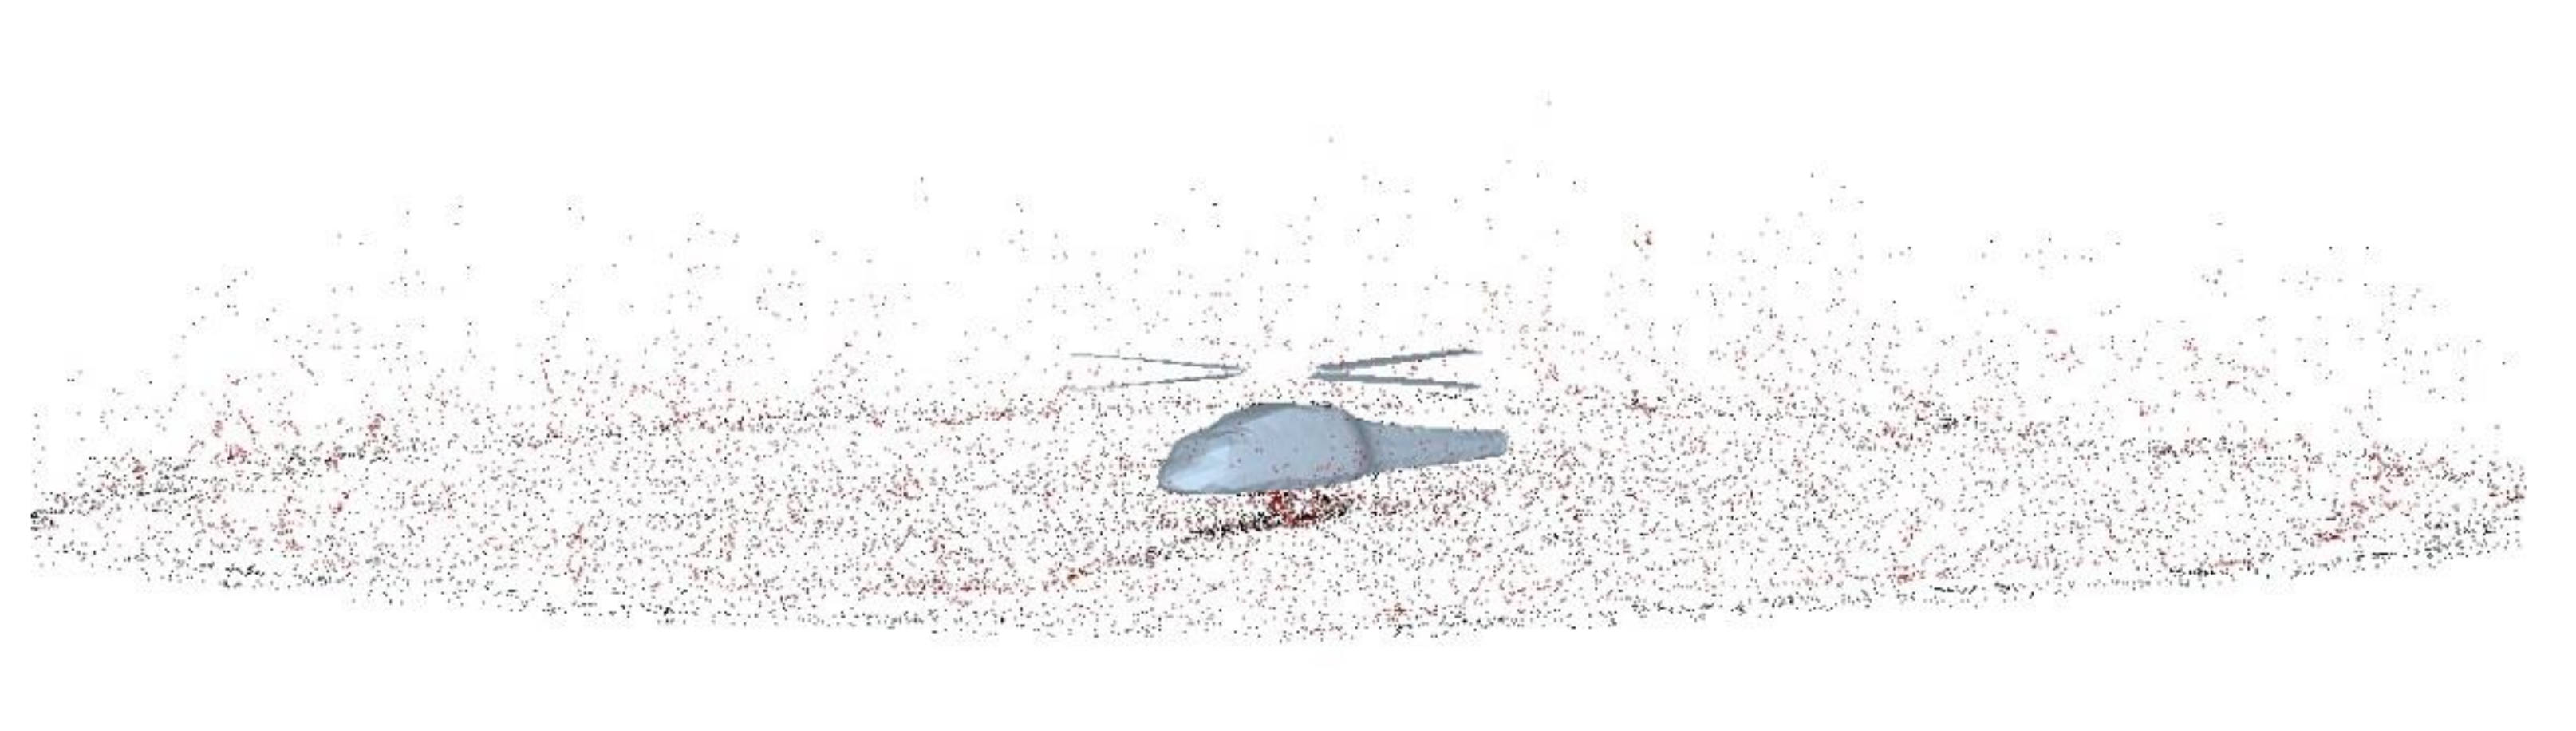
It can be seen from the above figure that, in a short time, the sand particles will be entrained into the air. Some particles will be suspended in the air under the influence of the ground eddy current, and will then contact the blade disk again to enter the downwash air flow cycle. A small number of particles will be suspended above the blade disk. In the following time, the sands mainly move in the spanwise direction, and the expansion speed gradually slows down. The sandy cloud has no significant change of height in the radial direction, which indicates that the main accumulation area of the dusty cloud is around this hovering height shown in
Figure 10. The particles under the fuselage will be carried to a higher position by the rising air over time.
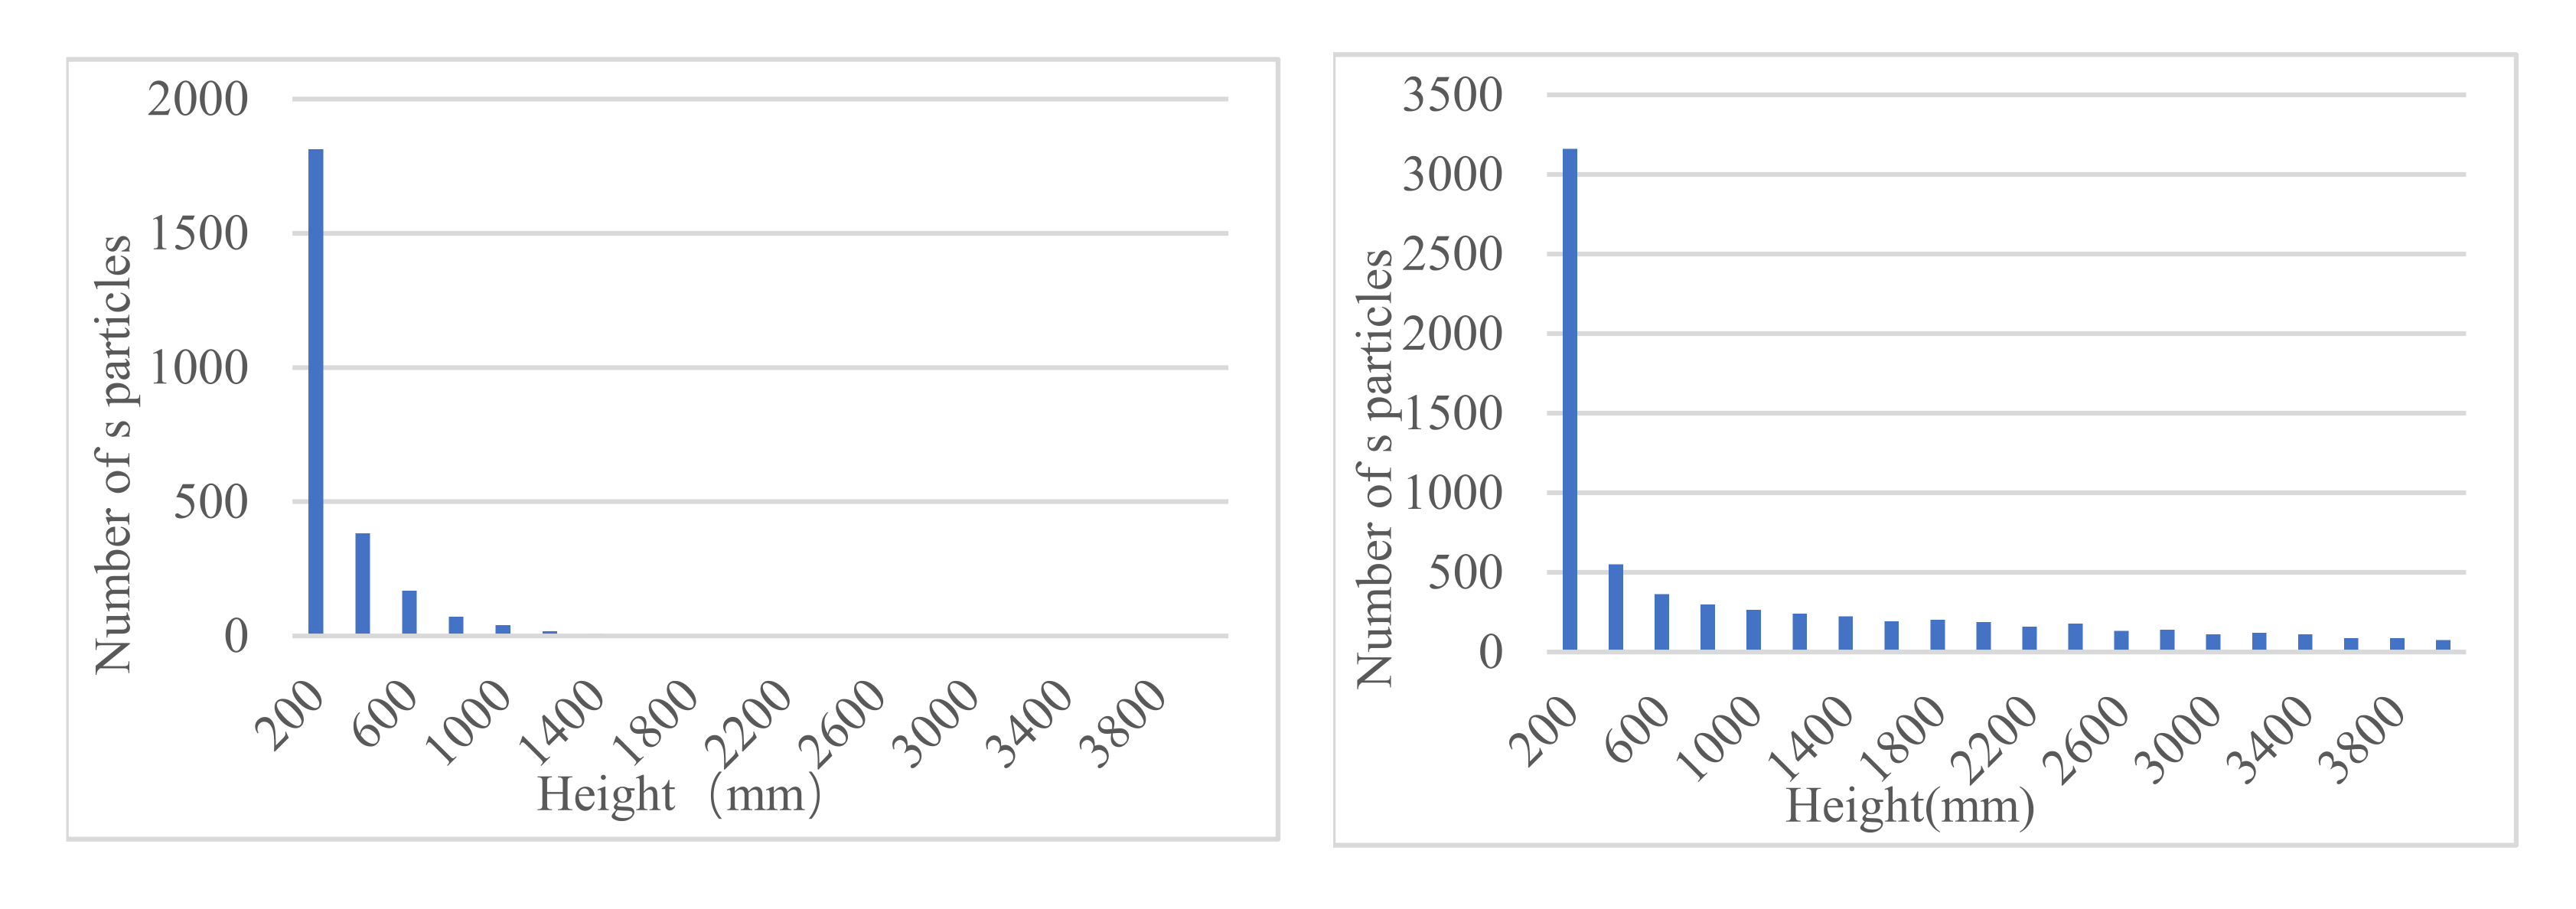
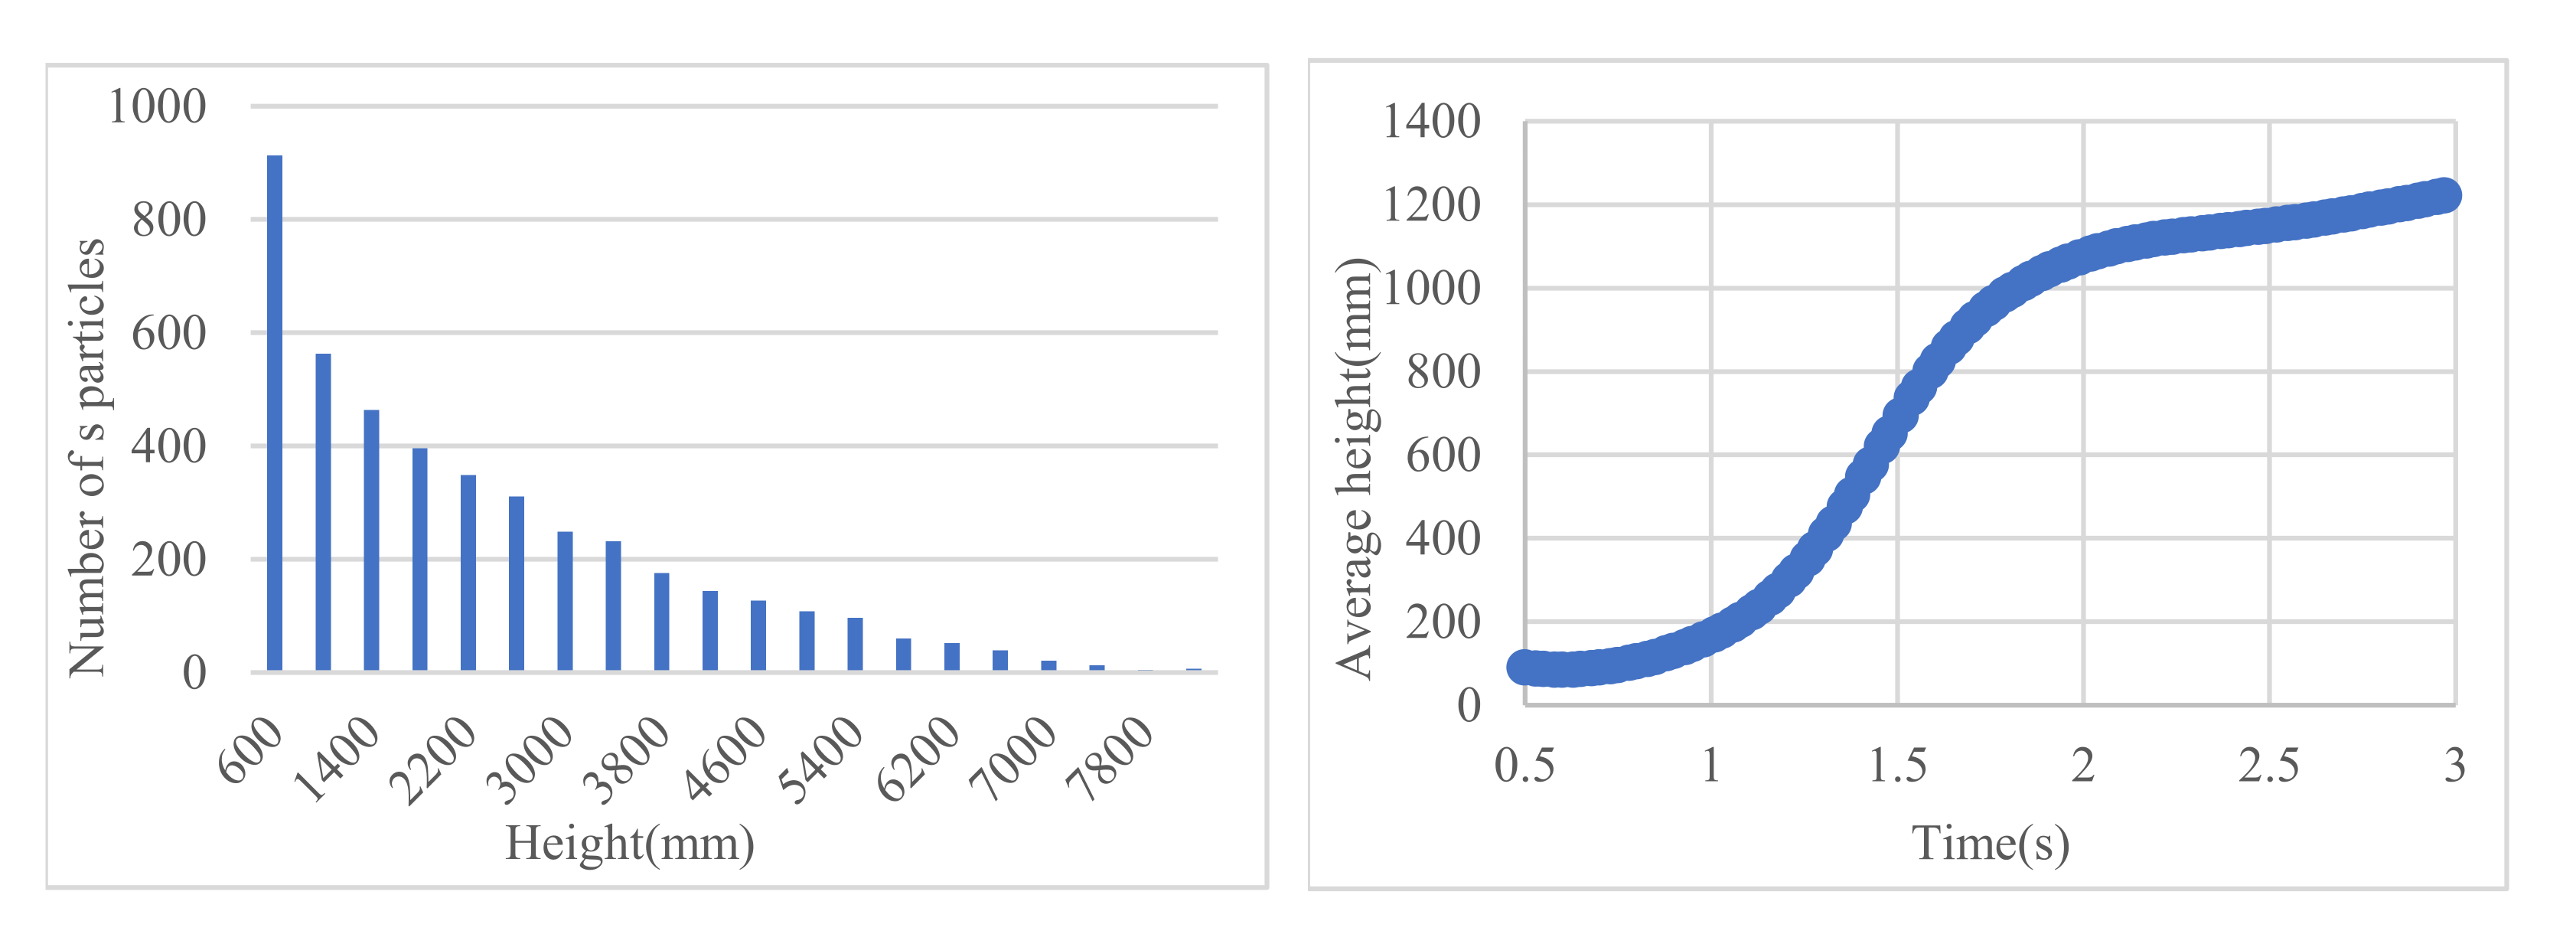
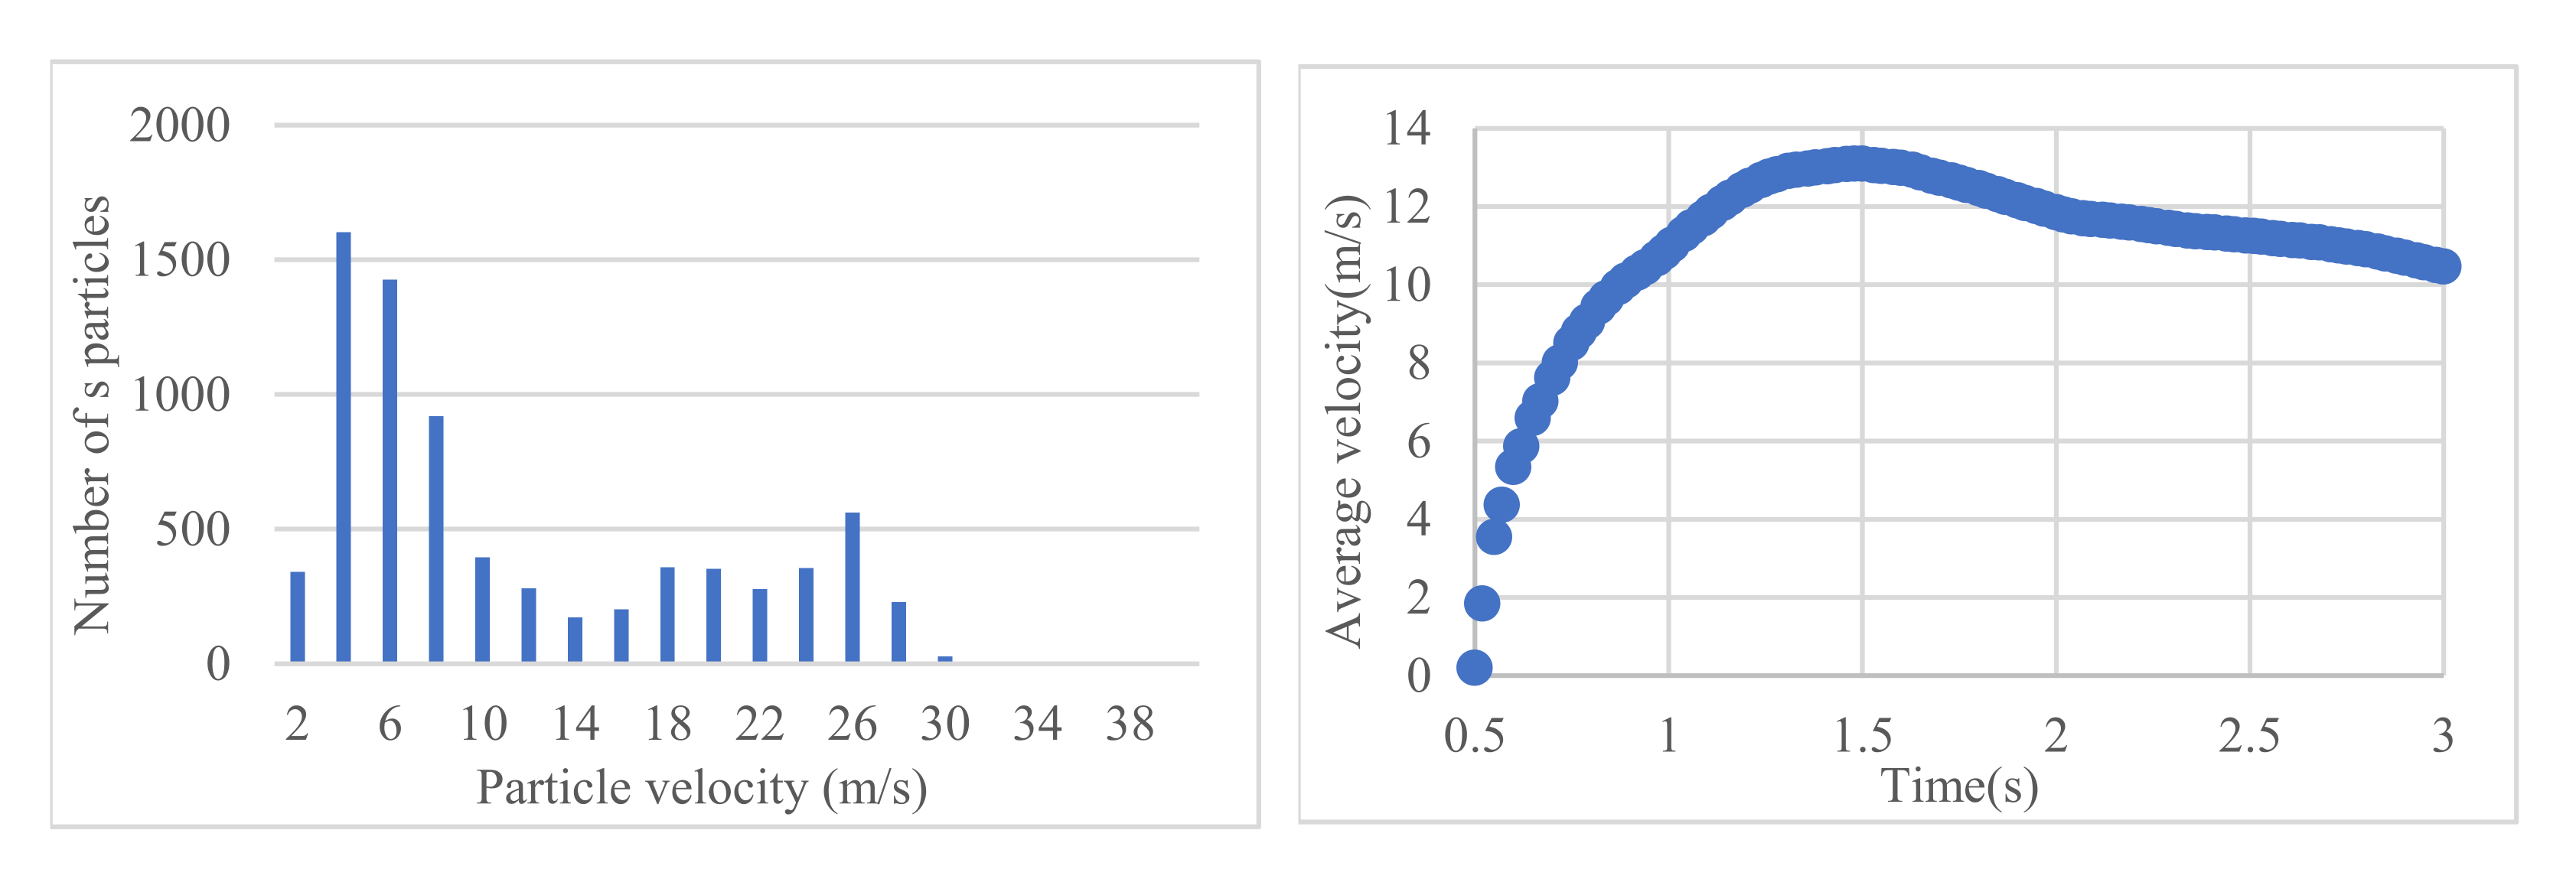
In the brownout phenomenon, the height of sand particles is related to the probability of dust collision with the fuselage or blade, and to the degree of wear and erosion of the blade surface. The height is also related to the visual field of the pilot in the cockpit. The height of particles from 0 mm to 4000 mm is counted; after this, every 200 mm is the interval. The particles leaving the ground (d > 200 mm) are analyzed separately, and the average height is counted. The results are shown in
Figure 11 and
Figure 12.
From
Figure 11, it can be seen that the height of particles from the ground increases gradually within 3 s, but more than 50% of the particles are still concentrated near the ground (0–0.1R) and are not entrained into the air by the airflow. The height of the other particles increases gradually in 3 s, and the vertical distribution is more uniform.
From
Figure 12 it can be seen that, when t = 3 s, the number of suspended particles starts from 200 mm above the ground, and the number of suspended particles is negatively correlated with the height above the ground, and gradually decreases. The higher part has exceeded the height of 1R, while the particles near the position of 0.5R (3800 mm–4600 mm) account for about 2%. This part of particles may cause erosion to the blades. Particles near the cockpit height of 0.3R (2200 mm–3000 mm) account for about 5%, which will affect the pilot’s vision. The average height of particles shows a rapid upward trend between 1 s to 2 s, and the average height gradually flattens after 2 s.
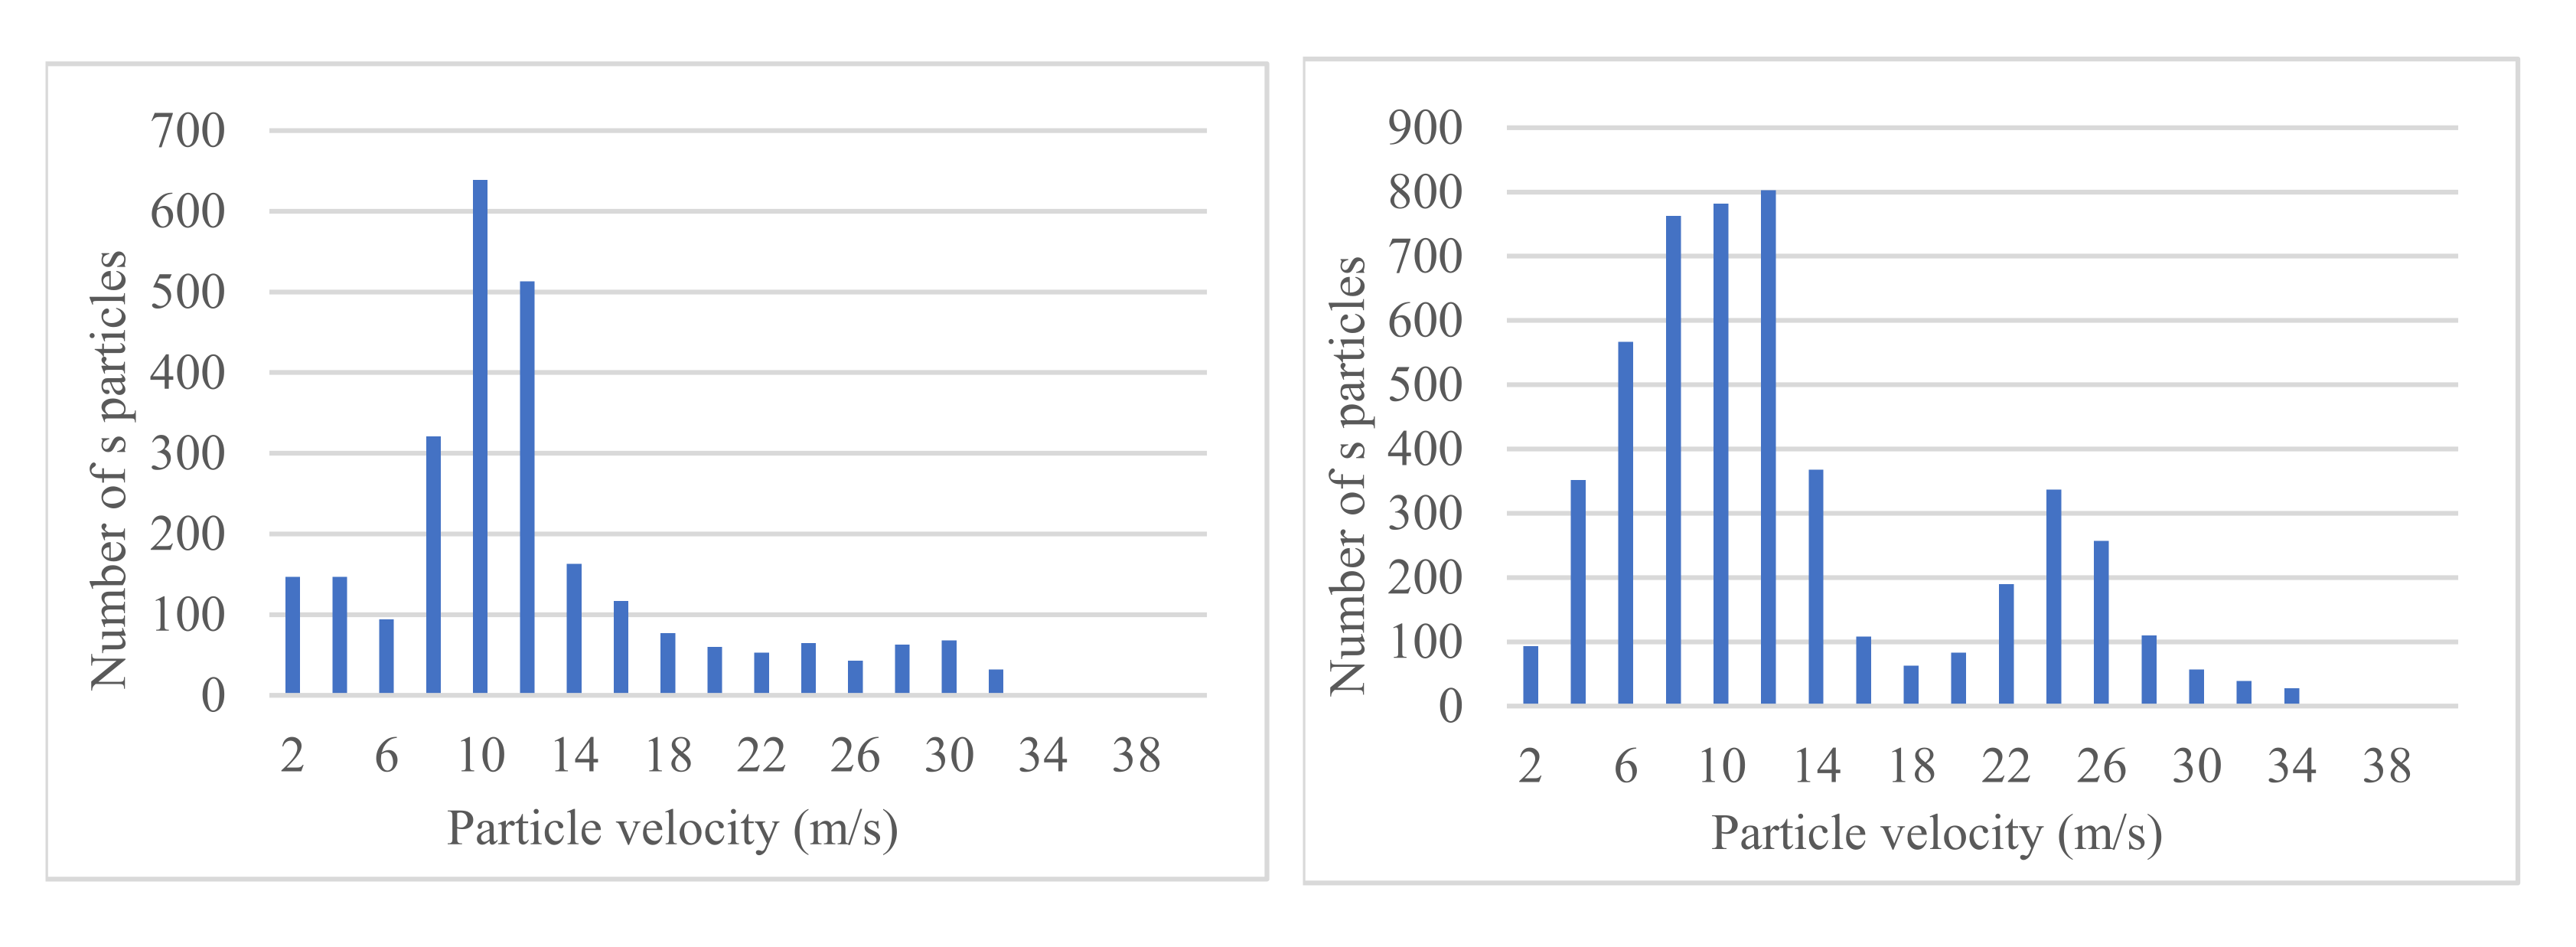
In addition to the height, the movement speed of sand particles is also the basis for judging the brownout phenomenon, and the movement speed is related to the severity of sand erosion on the fuselage and blades. The distribution of particle velocity and the relationship between the average velocity and time are shown in
Figure 13 and
Figure 14.
Just after the particles are entrained off the ground (t = 1 s), the velocity is mainly concentrated between 10 m/s and 14 m/s. The number of particles moving at a high speed is less, and the overall average velocity is not fast. With the passage of time, the average velocity of particles gradually increases. After 2 s, the number of high-speed particles gradually increases, and the number of particles with a velocity of about 25 m/s also increases, while the average velocity of the particles with the largest proportion begins to decrease. When t = 3 s, the trend is more obvious; some particles have a longer time to experience the acceleration of air flow, the proportion of particles with high-speed motion increases significantly, and the other particles will be affected by the air flow. The velocity begins to decrease after the particles suspend or sink to the bottom.
4.2. Results of Hovering Height 1R
When considering the influence of dust in the rotor flow field, the ground effect will have a great influence on the formation process of brownout, and the hovering height is the decisive factor of the ground effect. Therefore, changing the hovering height to observe the movement and distribution of dust is the research focus. The following is the calculation results when the hovering height is 1R, in which the number of dust growth is 5000 per second. The results are shown in
Figure 15 and
Figure 16.
Compared with the hovering height of 0.52R, when the height from the ground is 1R, most of the particles move near the ground in 4s (H < 250 mm), but the overall average height of particles will gradually increase with time, and the proportion of particles leaving the ground is also increasing.
4.3. Influence of Sand Particle Size
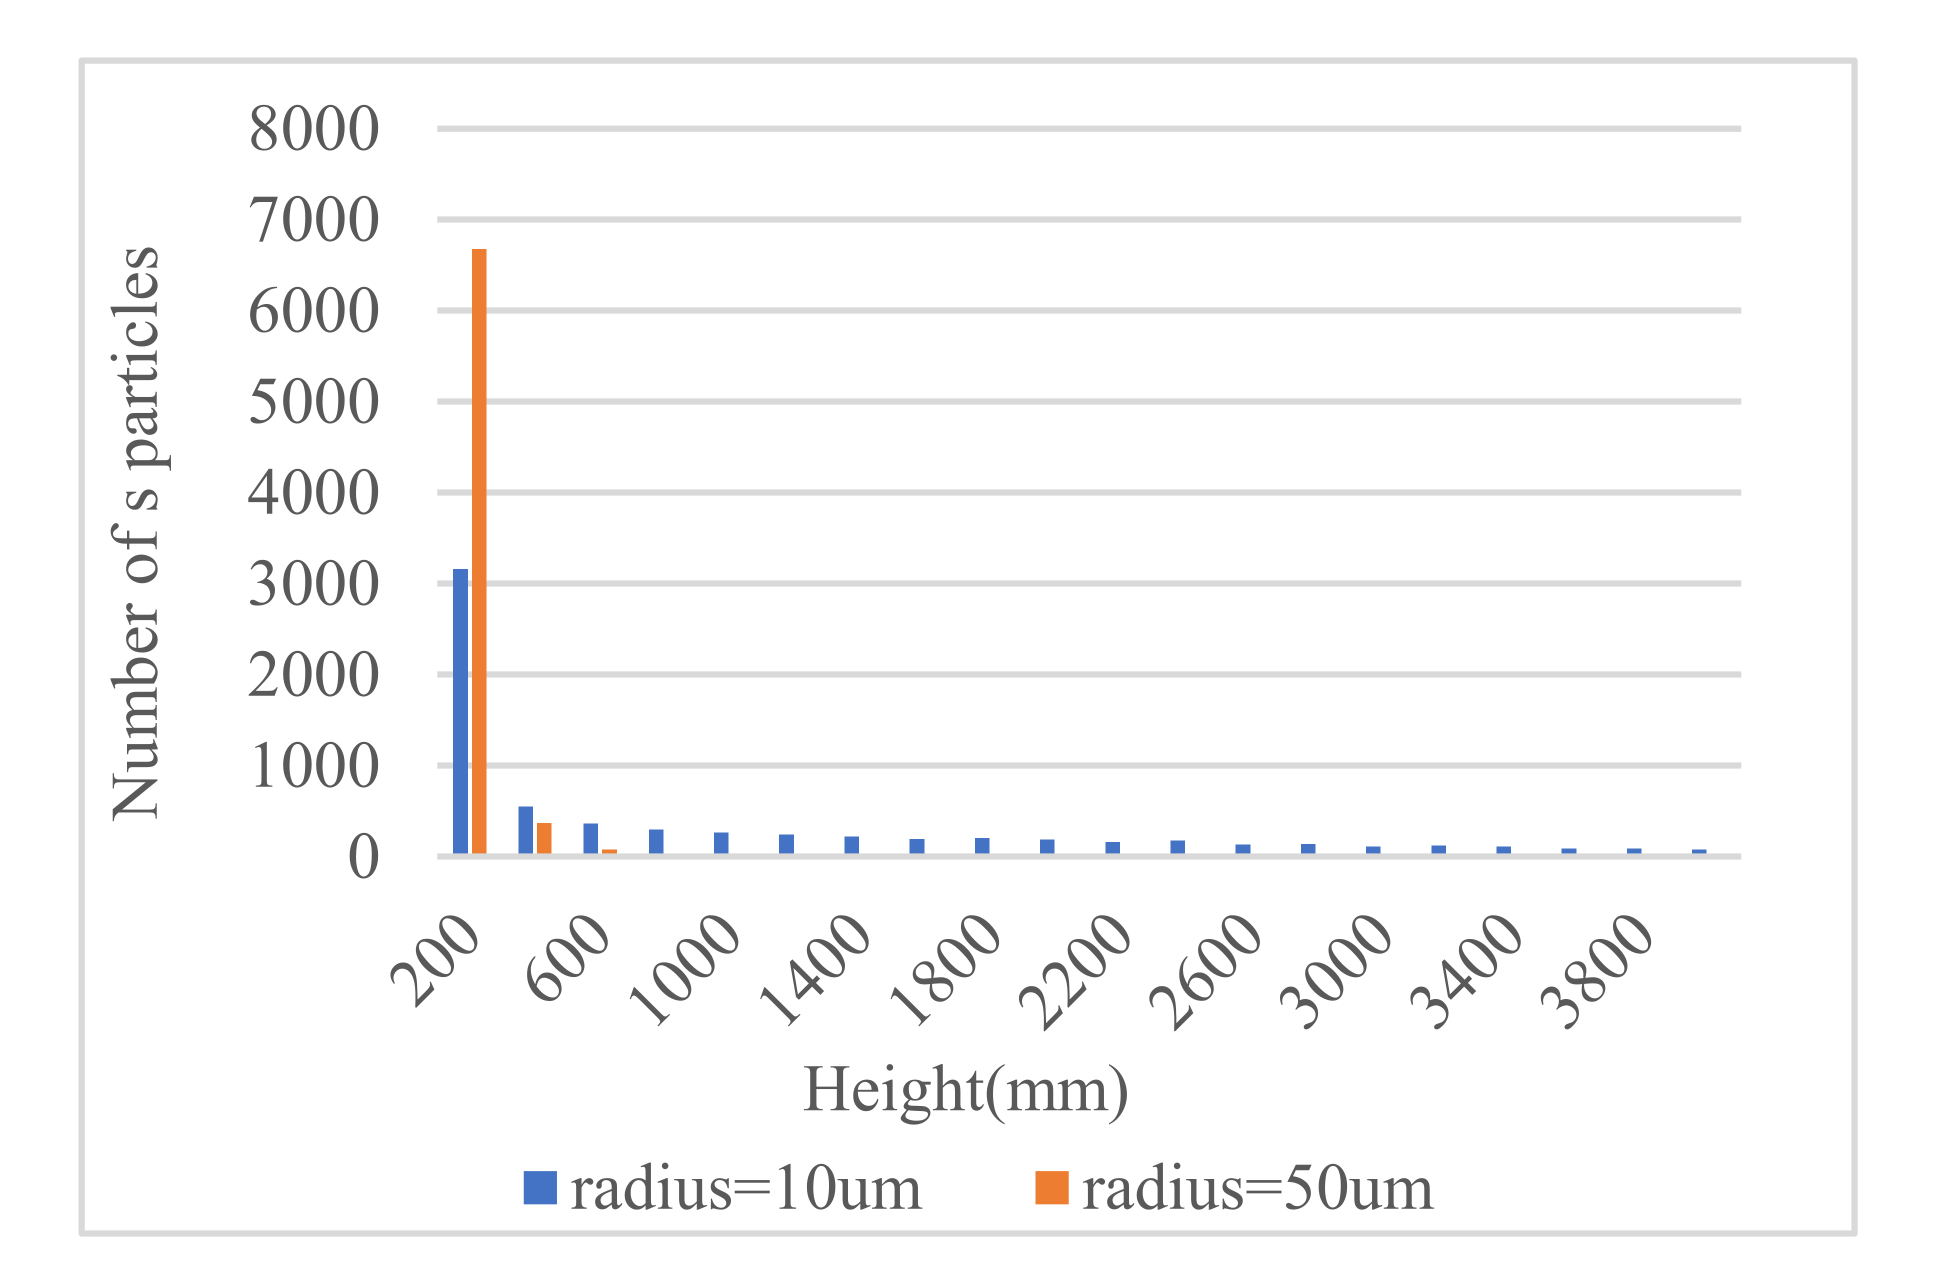
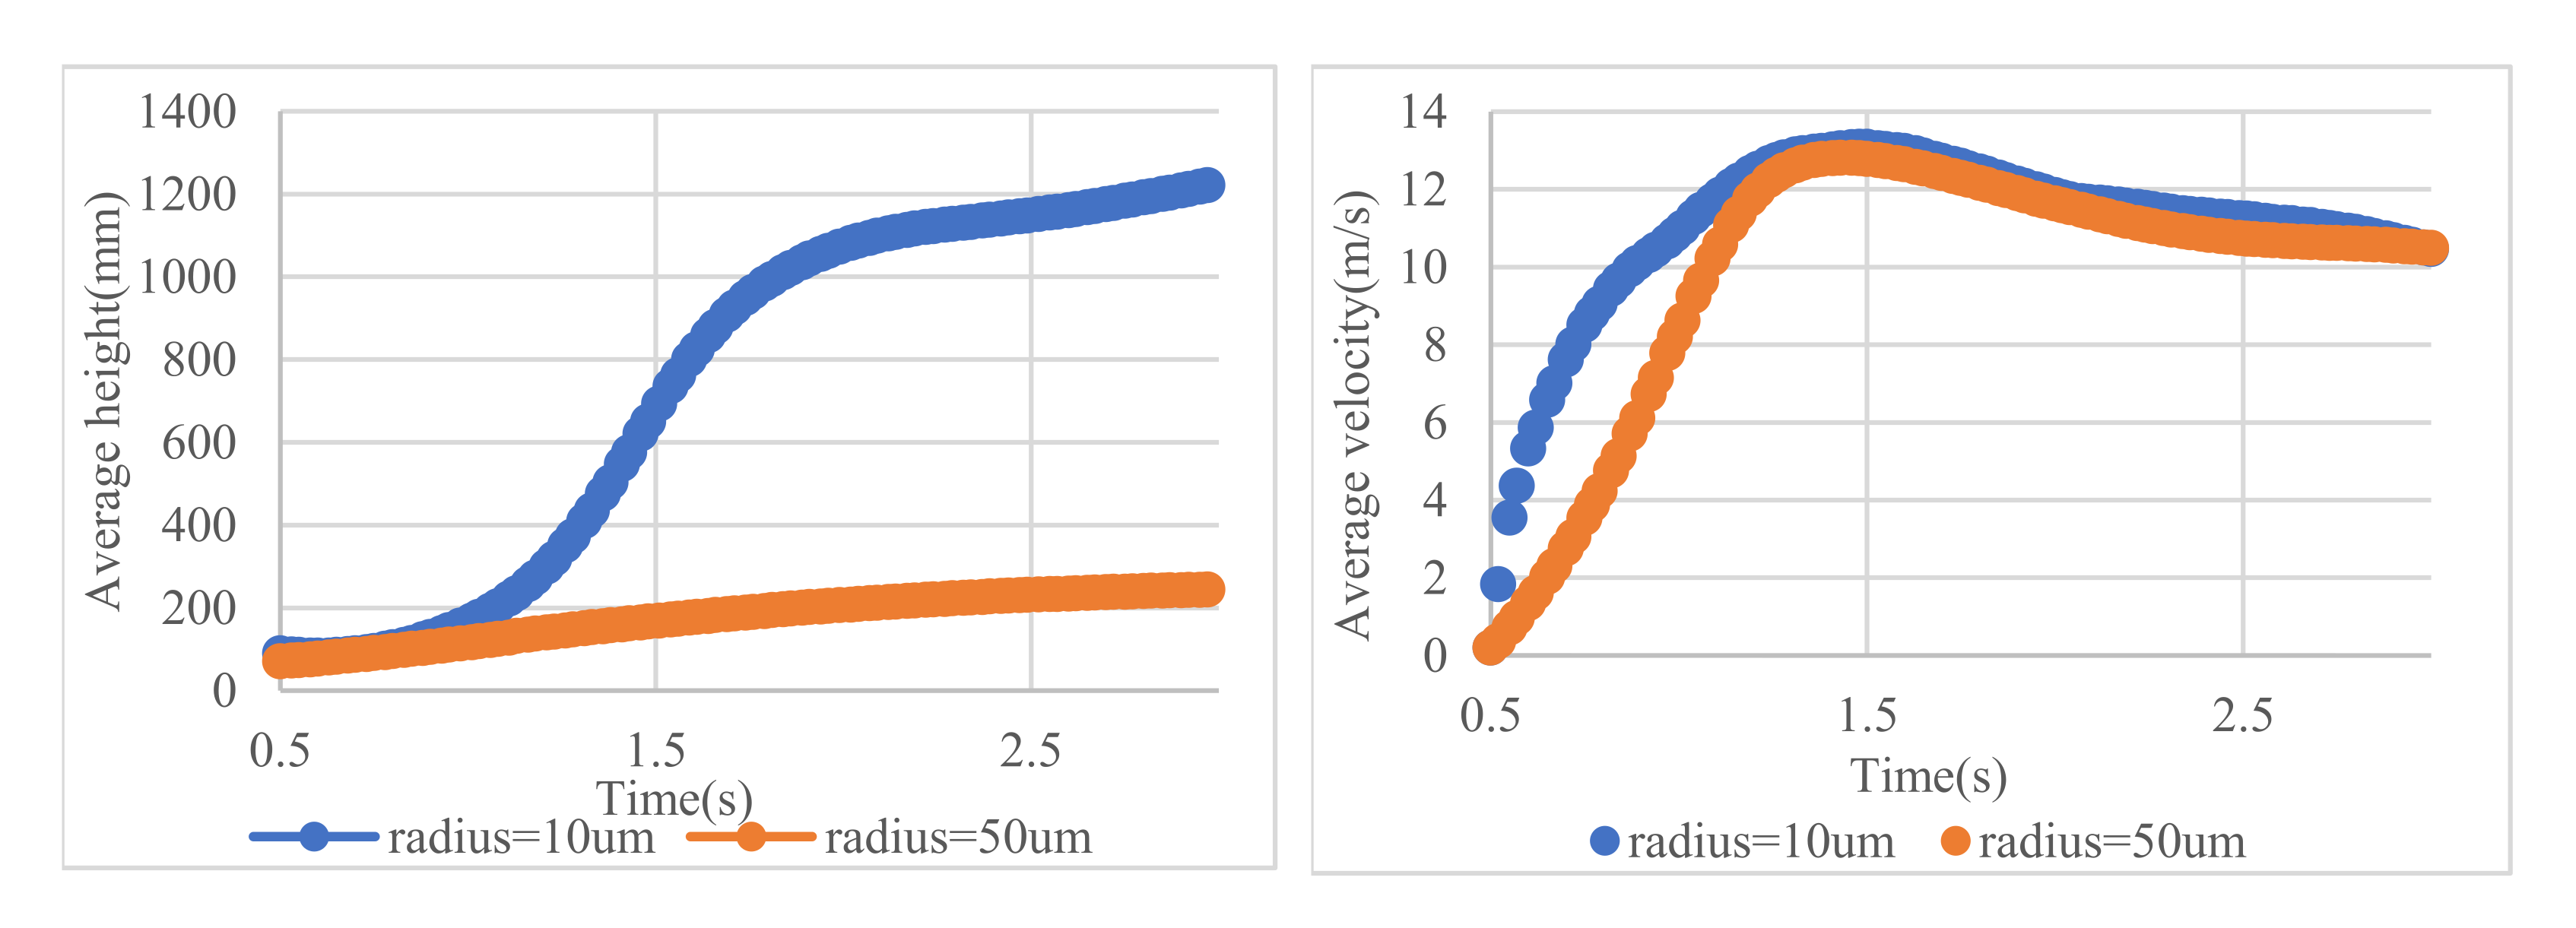
The size of sand particles will affect the force of dust in the flow field, and then affect the movement and distribution of dust. Considering that there are various particles of different sizes in the actual sand-dust environment, this paper compares the dust particle radius of 10 um and 50 um, and the results are shown in
Figure 17,
Figure 18 and
Figure 19.
The above Figure indicates that the sand particles with a radius of 50 um basically stay on the ground and a small part of them are suspended in the air. The particles staying on the ground will move with the air flow like 10 um particles, while 10 um particles will be suspended in the air. However, there is little difference in the velocity between the two types, which indicates that the radial motion affects the overall velocity.
4.4. Effect of Slotted-Tip in Brownout
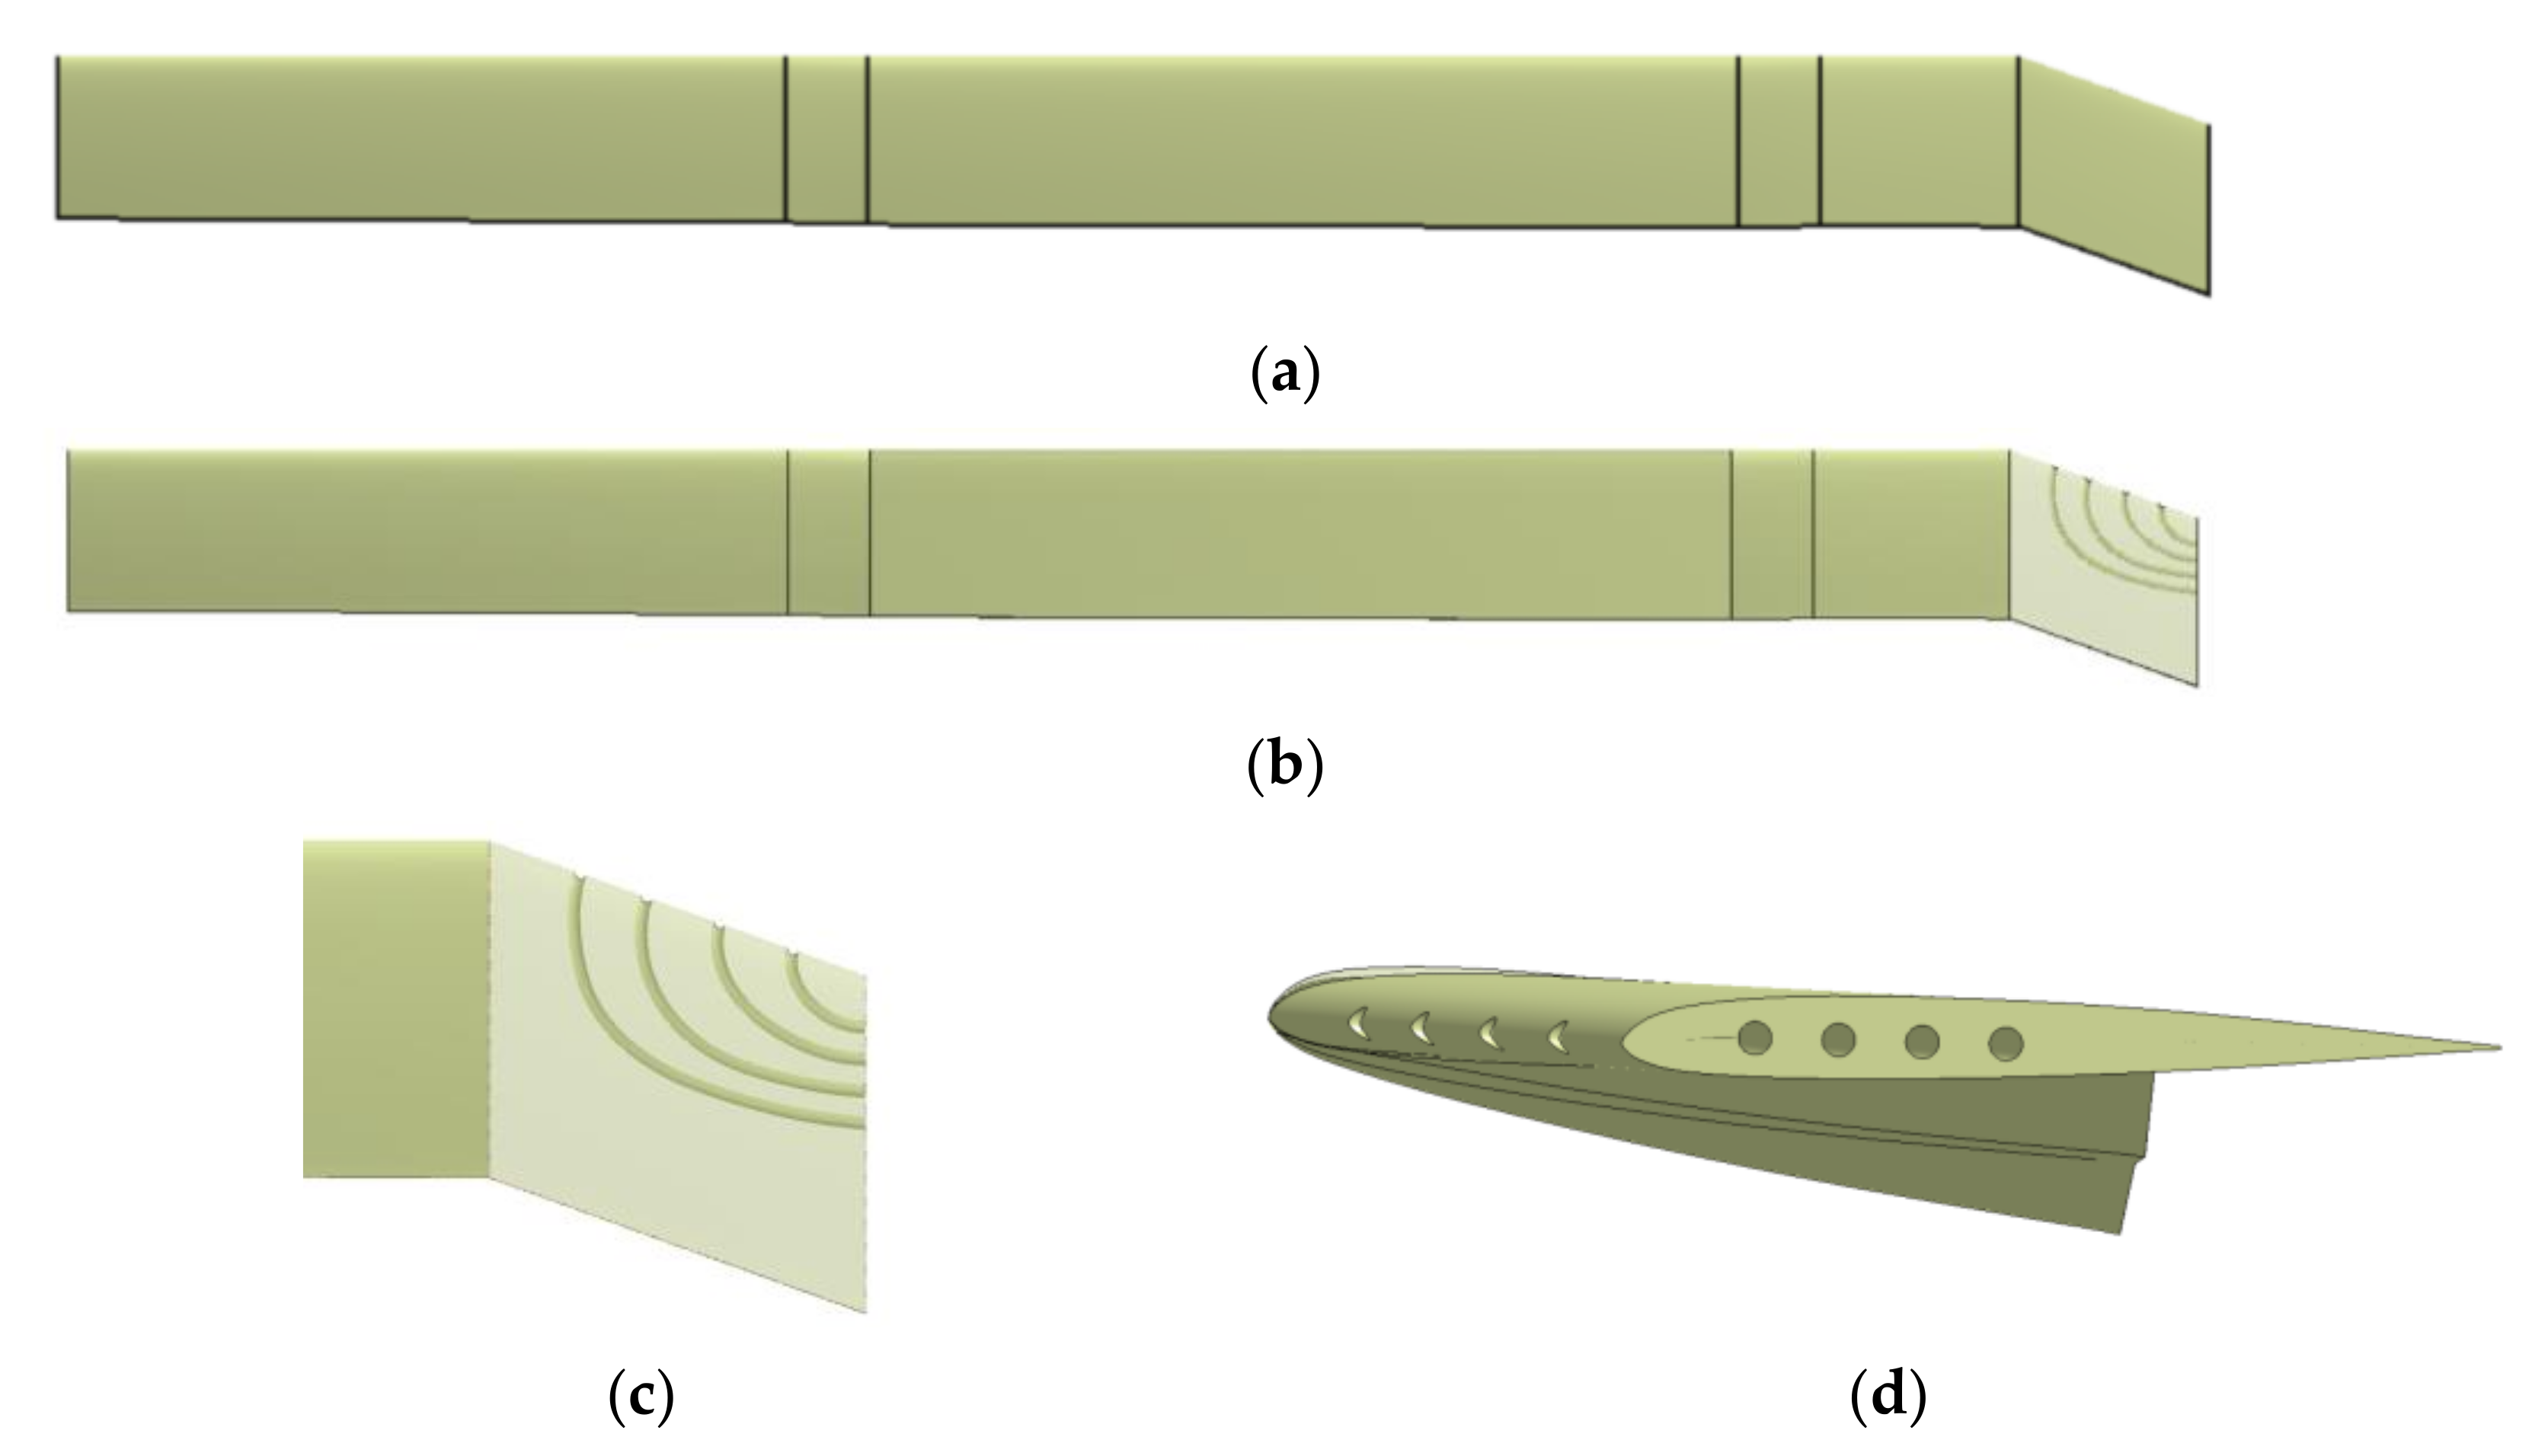
By slotting the blade tip and connecting the leading edge and side of the blade tip with a socket, the blade vortex interaction (BVI) noise of the blade can be effectively reduced. The principle is that the leading-edge slot guides the airflow to the side flow around the blade tip and flows in the core area of the blade tip vortex to form part of the turbulent region, which destroys the original layout of vortex’s high-speed rotating flow to inhibit the formation of turbulence in the blade tip region, also speeds up the dissipation of the blade tip vortex, and finally weakens the strength of the blade tip vortex.
The blade of the UH60 is improved by using this method. Four circular slots are added at the blade tip. The model is shown in
Figure 20.
Based on this model, other simulation parameters are consistent with the hovering state (hovering height is 0.52R, blade tip Mach number is 0.63, increased particle number is 5000 per second). The simulation results of the two types are compared and analyzed.
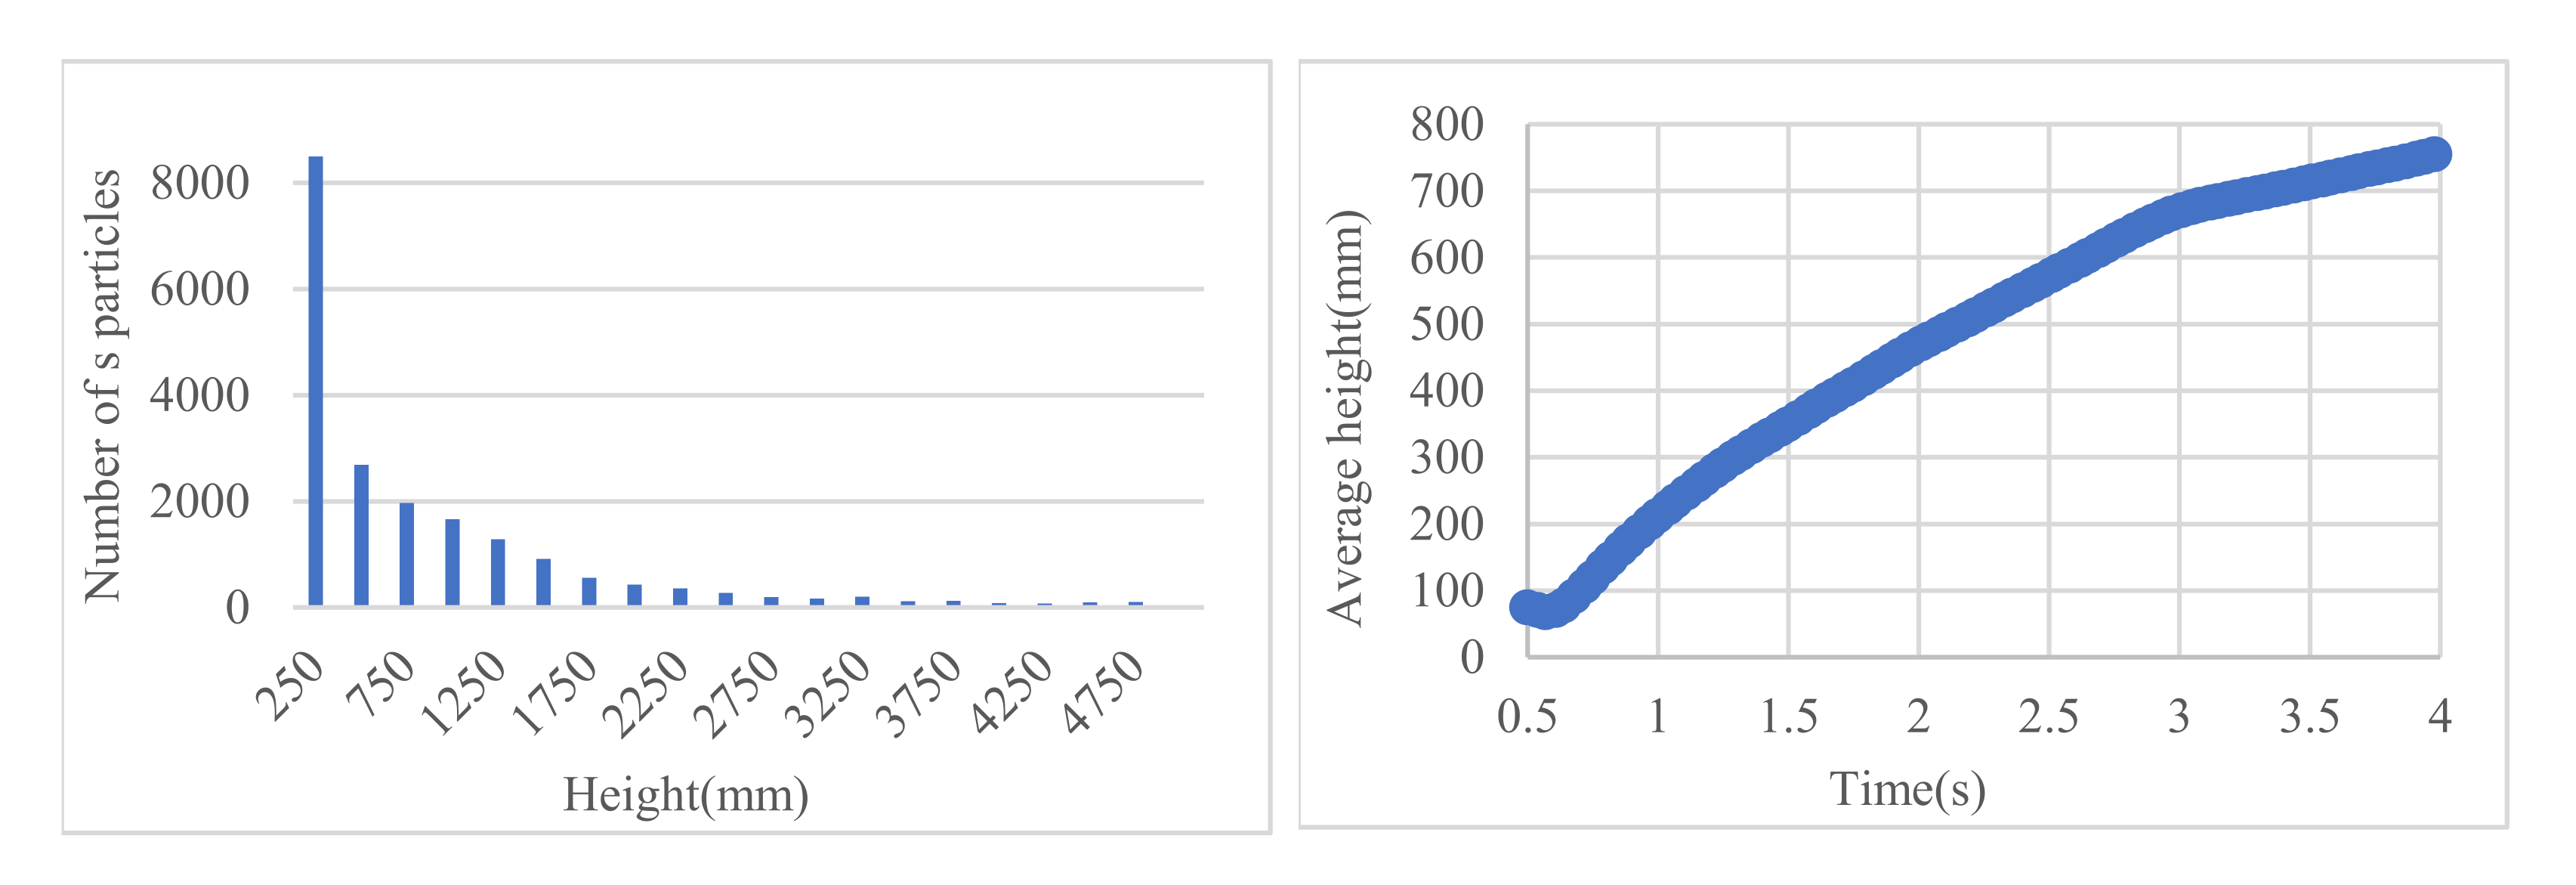
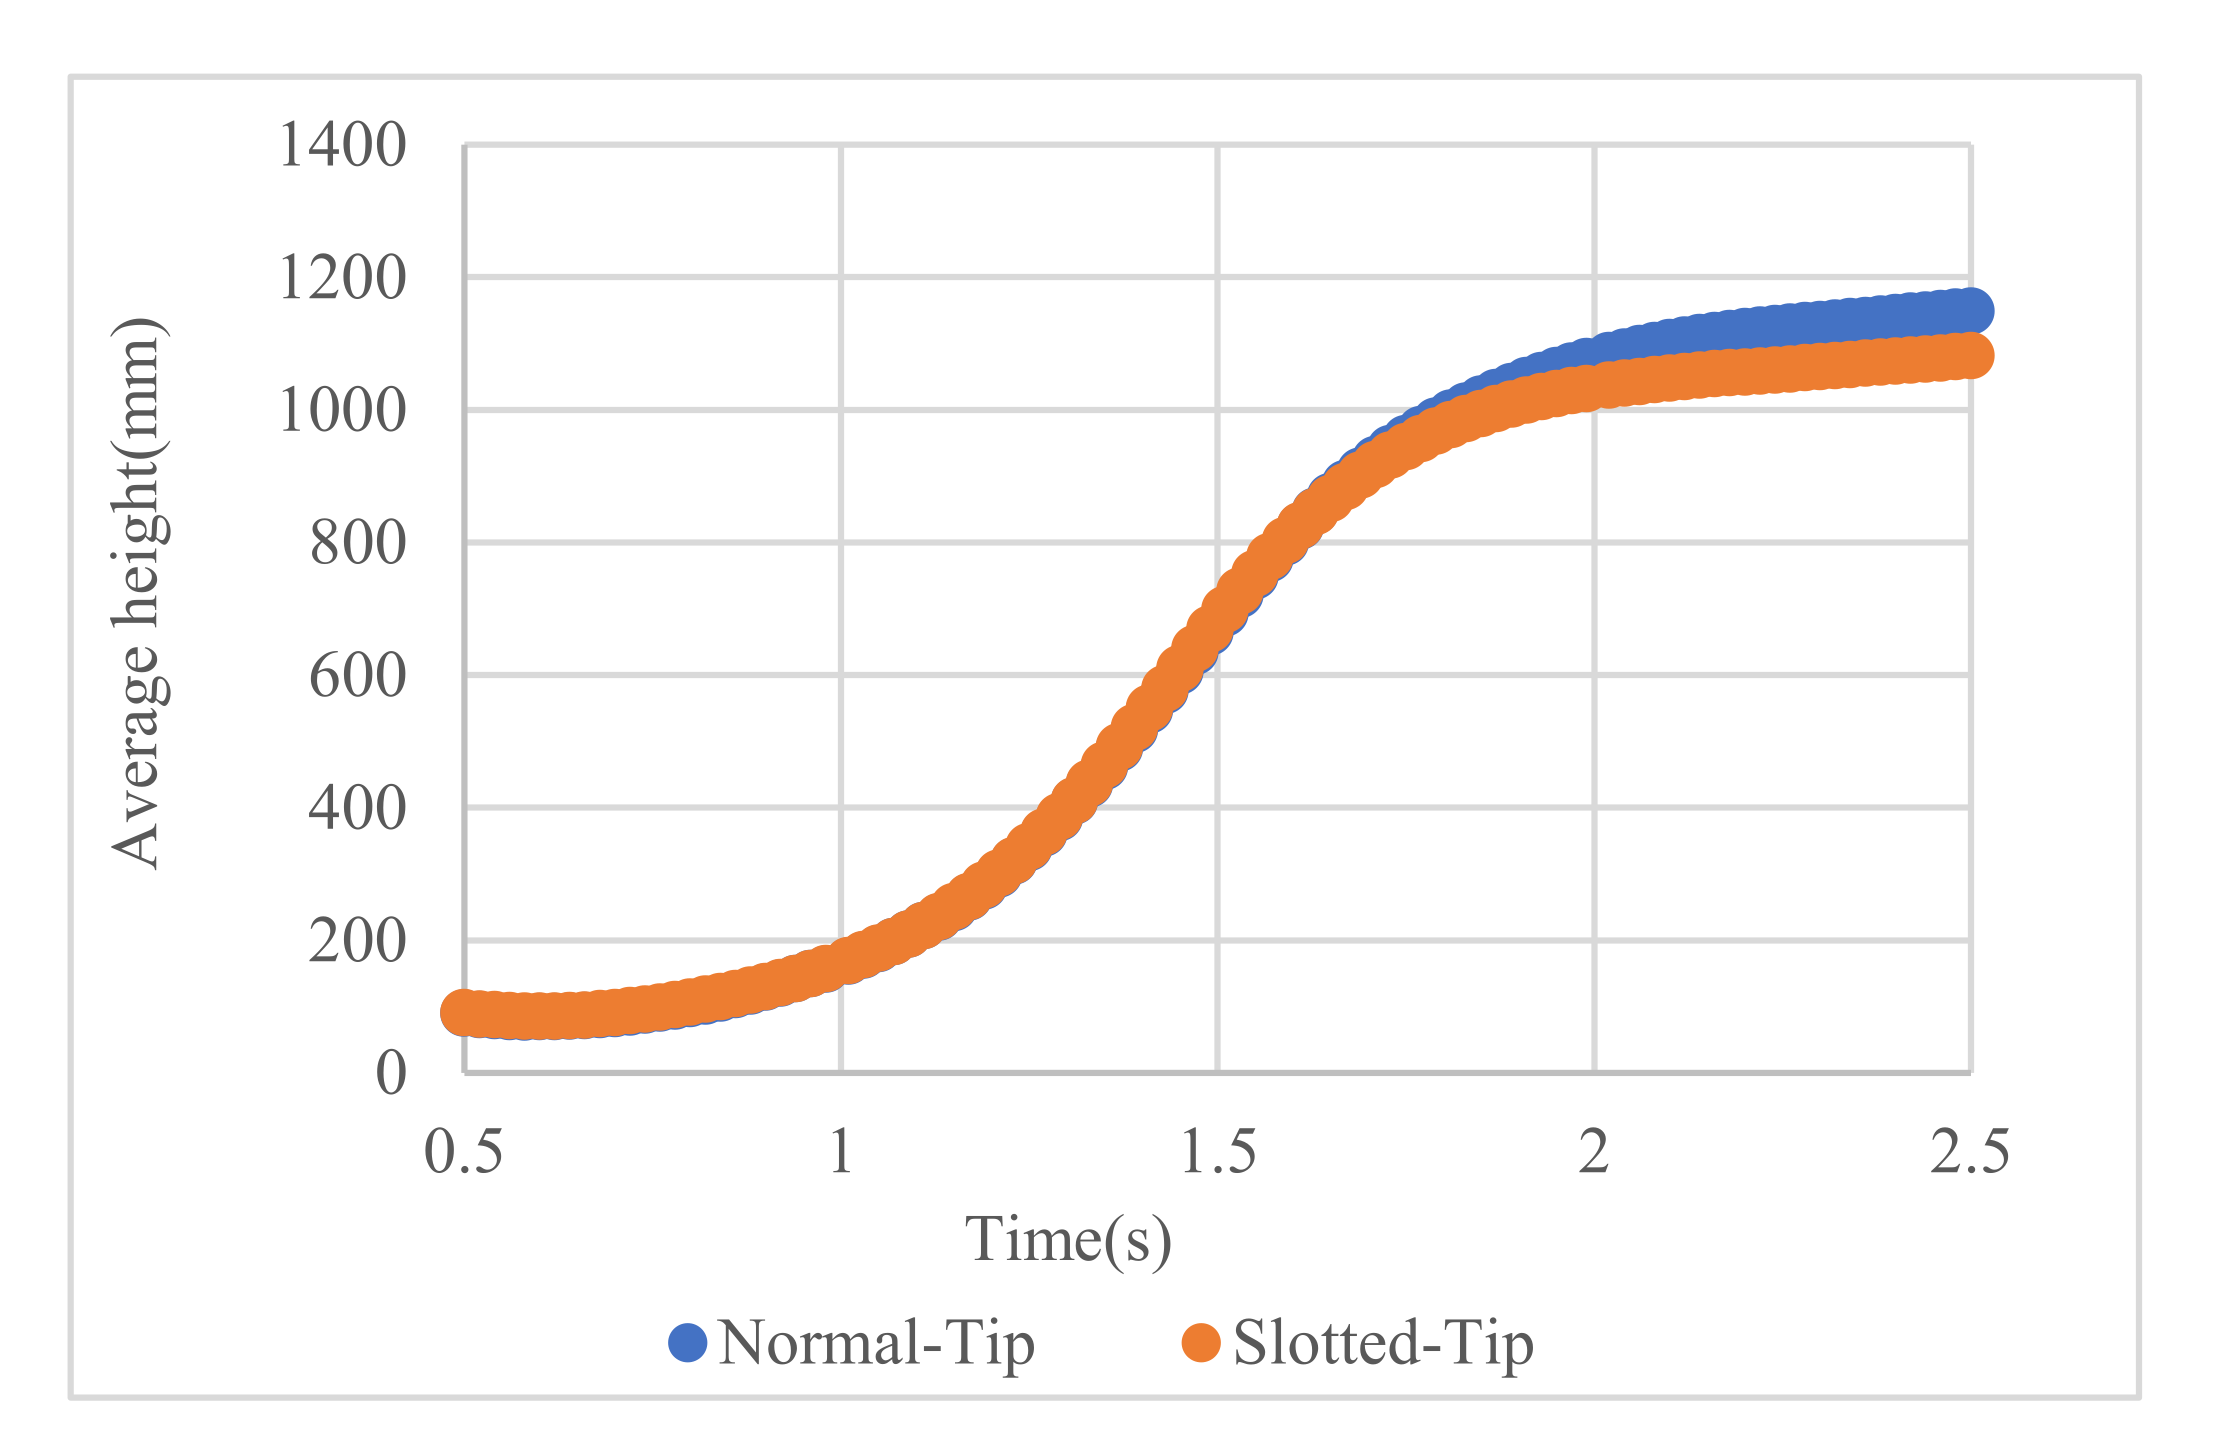
It can be seen from the
Figure 21 that after the time of t = 1.75 s, the average height of particles in the flow field affected by the blade slotting is lower than that of the normal blade, and gradually lags behind that of the normal blade. This situation can show that after the blade slotting, the sand particles in the sand-dust environment will reduce the suspension height because of the weakening of the blade tip vortex, reduce the impact of suspended dust on flight safety, and achieve the effect of restraining brownout.
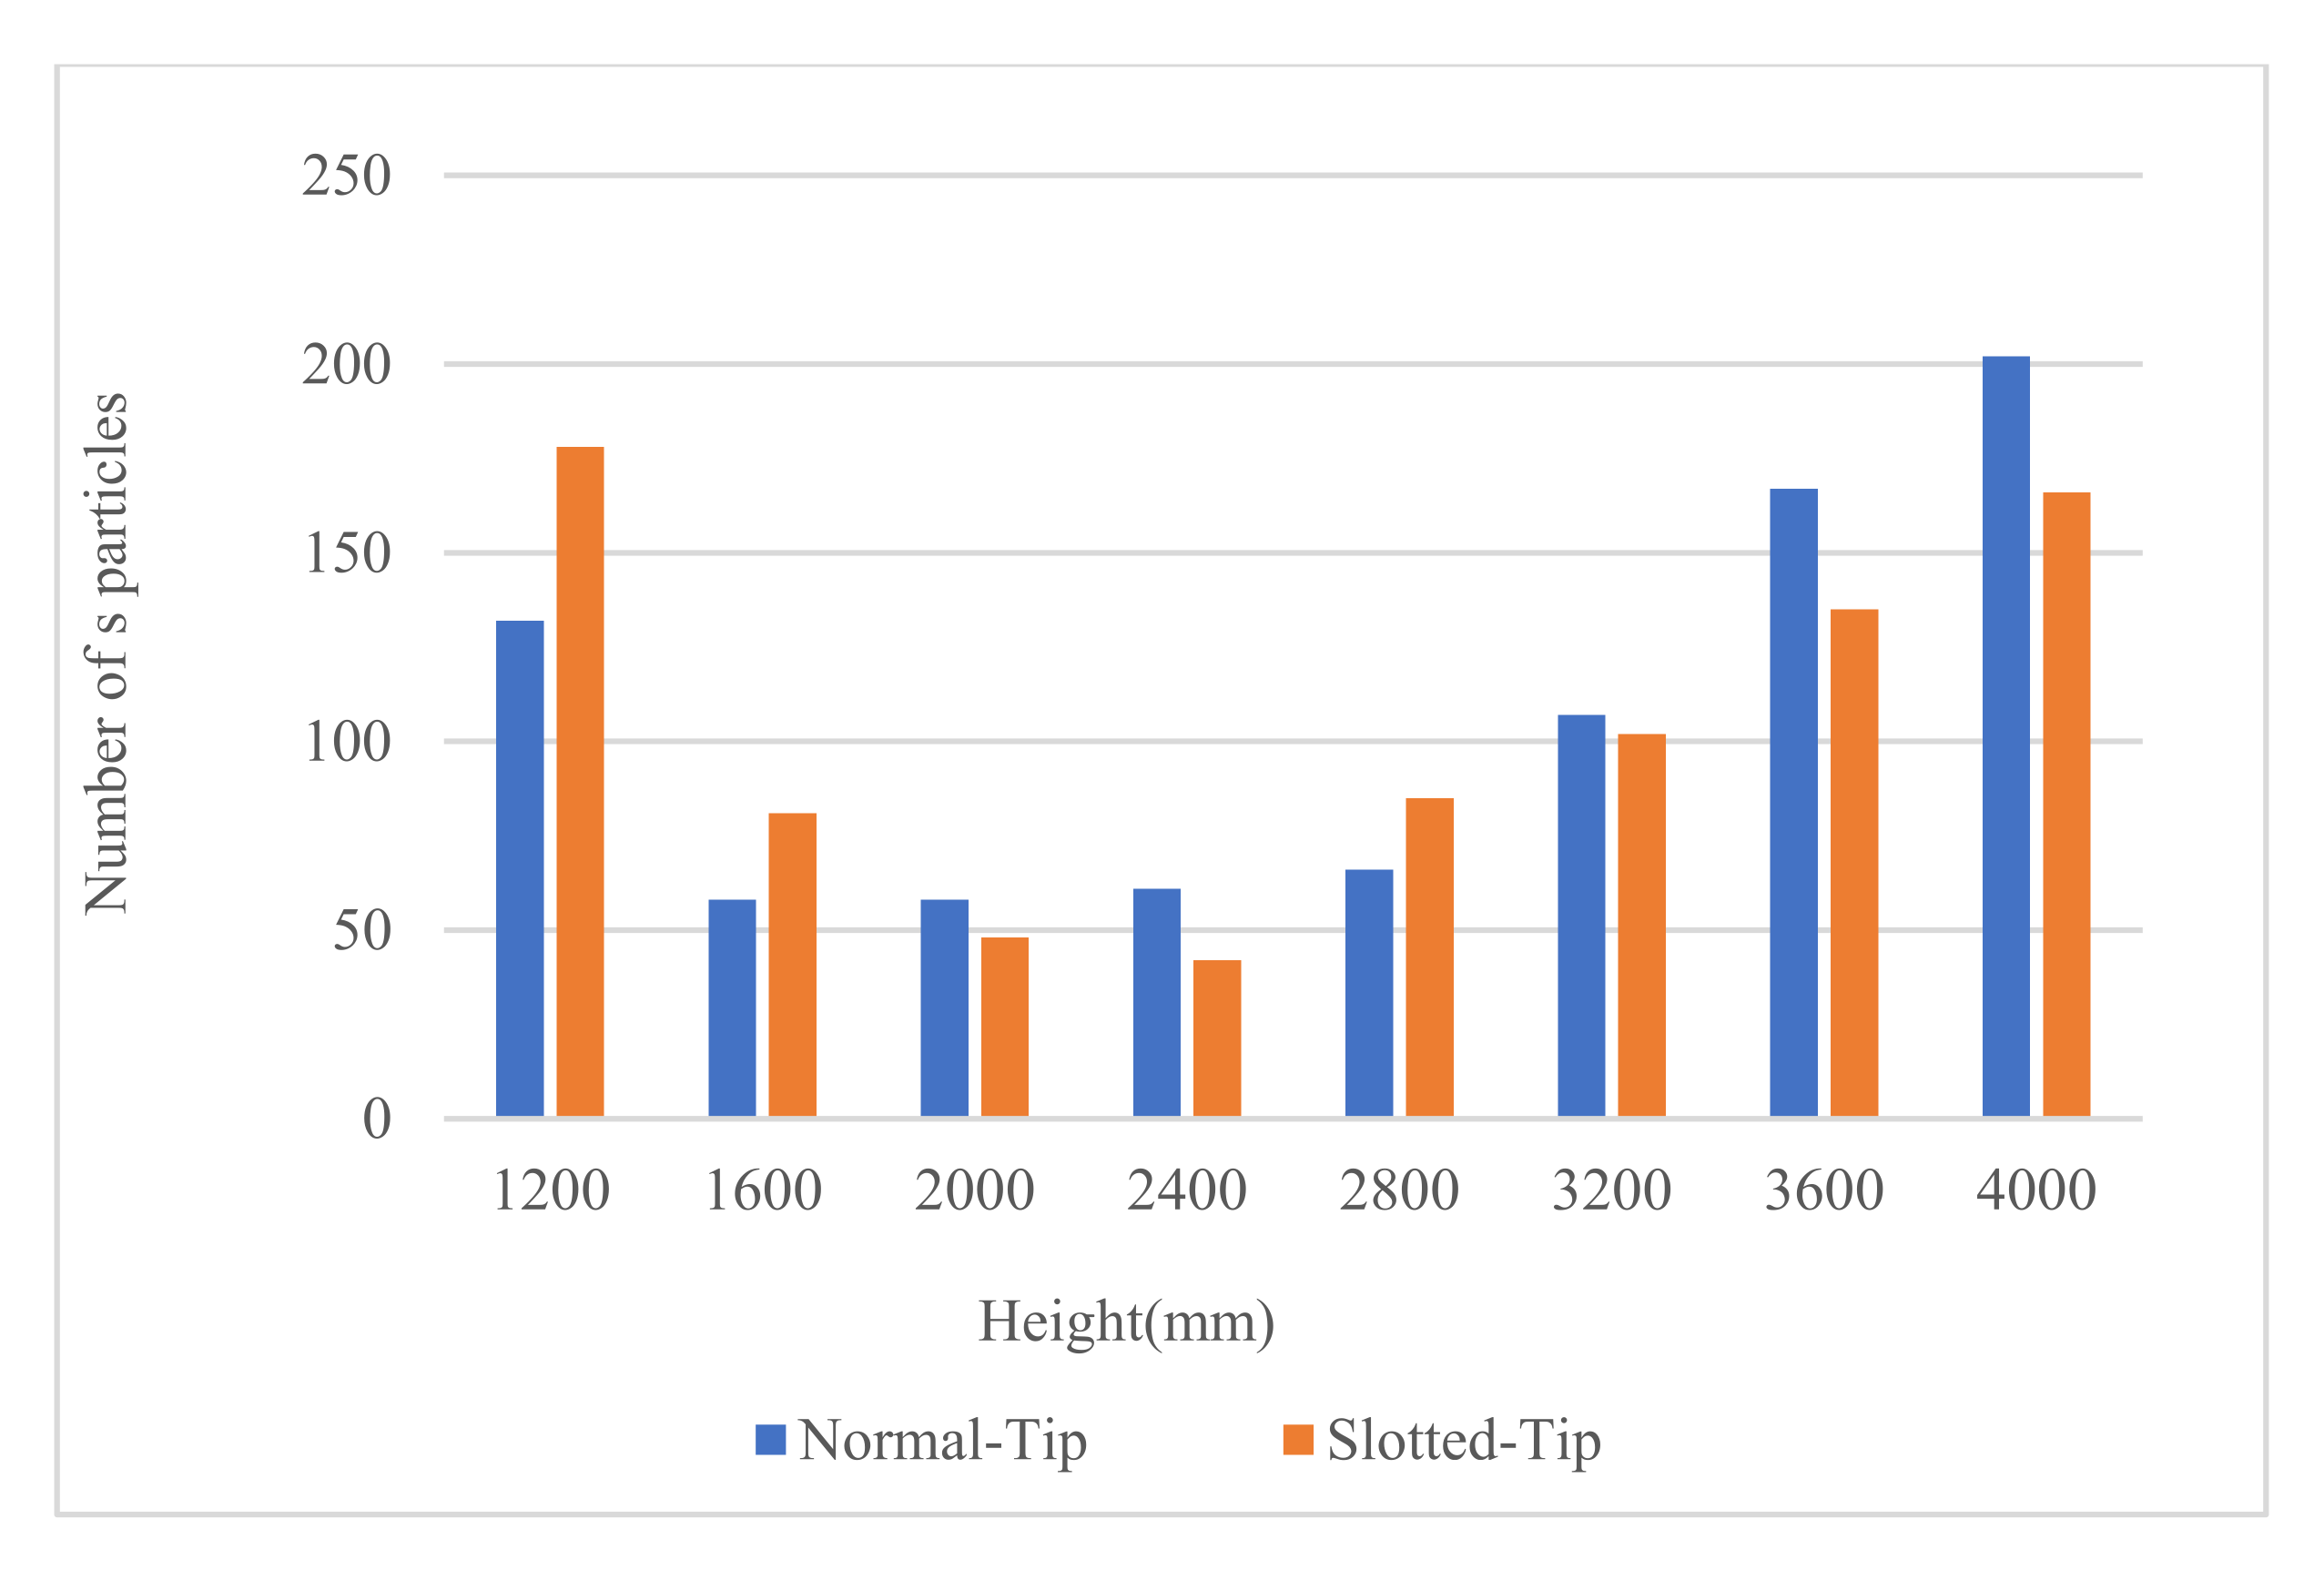
In order to further analyze the comparison of particle distribution in the air, the results of particle numbers in the height range of 600 mm–4000 mm at different times are compared.
It can be seen from the
Figure 22 that the number of particles in the normal blade group will be less than that in the slotted blade group when the height above the ground is low, and the number of suspended particles in the normal blade group will be more than that in the slotted blade group when the distance is more than 3000 mm. From the perspective of helicopter flight safety, the slotted blade can reduce the average height of particle suspension and the reduction of the number of suspended particles near the blade area (the blade height is 4250 mm) is more significant, which can effectively reduce the impact of brownout.


