Article

Potentially Toxic Trace Elements in the Urban Soils of Santiago de Compostela (Northwestern Spain)

by
Cecilia Herbón
,
María Teresa Barral
and
Remigio Paradelo
*
CRETUS Centre (Cross-Disciplinary Research in Environmental Technologies), Departamento de Edafoloxía e Química Agrícola, Universidade de Santiago de Compostela, 15782 Santiago de Compostela, Spain
*
Author to whom correspondence should be addressed.
Appl. Sci. 2021, 11(9), 4211; https://doi.org/10.3390/app11094211
Submission received: 20 April 2021 / Revised: 30 April 2021 / Accepted: 1 May 2021 / Published: 6 May 2021

Abstract

:
With the objective of increasing information inorganic pollutants in urban soils in Spain, we studied the presence of Cu, Pb, Zn, Ni, Cr, and As in 55 soils in the city of Santiago de Compostela (northwestern Spain). The soils were developed over diverse parent materials (granites, gneiss, schists, and amphibolites) and present different land uses, urban grasslands, urban forests, urban allotment gardens, and peri-urban agricultural soils. Total trace element concentrations, analyzed by XRF of ground samples, were correlated to physicochemical properties of the soils, and the influence of land use, lithology, and location on the degree of pollution was explored. In most soils, trace element concentrations followed the sequence Zn (55–484 mg kg−1) > Pb (20–566 mg kg−1) > Cr (17–277 mg kg−1) > Cu (17–188 mg kg−1) > As (13–205 mg kg−1) > Ni (11–91 mg kg−1). The concentrations were overall higher than regional backgrounds, but not high enough to class the soils as contaminated according to the Spanish regulation. Accordingly, the geoaccumulation index values indicate that most soils present low to moderate pollution levels. Among the elements studied, Cu, Pb, and Zn were correlated between them, with their highest concentrations happening in soils of the green areas in the city center; Cr and Ni concentrations were related to lithology of the parent material, with the highest concentrations in soils developed over amphibolite; finally, As concentrations are higher in two precise points without a clear connection to a known source of pollution.

1. Introduction

The intensification of urbanization is a key feature of our current society. The spectacular increase in agricultural productivity during the last century has increased global population and reduced the needs of workforce in agriculture, producing a generalized exodus from rural areas towards cities. The 2018 report of the U.N., the World Urbanization Prospects, indicates that the percentage of the world population living in cities increased from 50% in 2008 to 55% in 2018 and will be 68% in 2050 [1]. For example in Europe, the surface area covered by cities increased by 78% since the 1950s, a trend that is expected to continue globally. This spectacular growth in urban population represents a major challenge for the environment: urban areas are confronted by specific environmental issues (e.g., food dependency, local climate), as they concentrate population, activities and infrastructures. These issues have been recognized by the U.N. in their 2030 Agenda for Sustainable Development, in particular in the Sustainable Development Goal no. 11: “Sustainable cities and communities”, whose objective is “to make cities inclusive, safe, resilient and sustainable”.
Among the problems that cities must face in their way towards sustainability, one of the most challenging is the presence of a wide variety of contaminants in the urban environment, due to the presence of several sources of pollution near or within the cities (traffic, coal combustion, industrial facilities, urban waste treatment and disposal, etc.). Many of these substances end up by reaching the soils and accumulating in them. In consequence, urban soils are commonly polluted by organic and inorganic substances, including heavy metals (Cu, Pb) and metalloids (As), polycyclic aromatic hydrocarbons (PAHs), pesticides and antibiotics, or microplastics [2,3].
The presence of contaminants in urban soils represents risks for human health and well-being, as well as problems for the functioning of the urban ecosystems, in which soils play a key role. Urban soils prevent flooding by allowing infiltration of water, thus reducing surface water run-off; improve air quality, and are important for regulating the microclimate and the “heat island” effect through vegetation and evaporation. They store a considerable amount of soil organic carbon; can be a source of food through urban agriculture; and they serve as fertile islands for plants and animals in increasingly densified cities [4,5]. Several of these functions are negatively influenced by the presence of contaminants, in particular those more directly related to plant production or habitat for biodiversity, as contaminants can be mobilized towards other compartments of the environment, in especial waters or the food chain. Cultivating urban soils can increase human exposition to contaminants through consumption of vegetables grown on contaminated soil, incidental soil ingestion, soil resuspension, and subsequent exposure [6]. Urban soil contaminants can influence biodiversity by their impact on both aboveground flora and soil biota populations [7].
In summary, urban soil contamination compromises ecosystem functions, biodiversity, human health and food security and consequently the presence and location of contaminants in urban soils must be clearly established to ensure safe land uses, an essential condition for the development and planning of the sustainable cities of the future. Research about trace elements in urban soils in Europe include works in many cities, such as Karlsruhe (Germany) [8], Lisbon (Portugal) [9], Glasgow (UK) [10], Ljubljana (Slovenia) [10], Vienna (Austria) [11], Berlin (Germany) [12], Paris (France) [13], Naples (Italy) [14], Novi Sad (Serbia) [15], Zurich (Switzerland) [5], Uppsala (Sweden) [16], or Torun (Poland) [17]. In comparison, reports of trace element concentrations in urban soils in Spanish cities are still scarce, although they have been increasing in recent years [18,19,20,21,22,23,24]. With the objective of contributing information about urban soil contamination in Spain, in this work, we have studied the presence of heavy metals and arsenic in the soils of the city of Santiago de Compostela (Spain), for which these analyses have not been performed to date. We hypothesize that soils in this city will have higher trace element concentrations than surrounding natural and agricultural soils, yet lower values than soils in more industrialized and densely populated cities. The information gathered is important for planning of land uses in the city, in particular in what refers to urban agriculture.

2. Materials and Methods

2.1. Study Area

The city of Santiago de Compostela, located in the northwestern corner of the Iberian Peninsula, is the capital of the autonomous region of Galicia and an important political, administrative, religious, and tourist center. The municipality has an area of 222 km2 and counts 97,000 inhabitants. In addition to the permanent residents, the city has over 20,000 University students and receives over one million visitors every year, many of them in connection to the Way of Saint James, Europe’s first ever pilgrimage route.
The city has interesting factors potentially affecting accumulation and dynamics of trace elements: lithology diversity, land use change, short-scale change. Santiago de Compostela has over 5,000,000 m2 of managed green areas. In the city center, there are 25 green areas with surfaces that range from 1 to 40 hectares, including lawn areas, forest areas, and urban allotment gardens; three different land uses coexist at some places in very short distances.
The climate is warm and wet and, according to the Köppen−Geiger Climate Classification, the city is located in the temperate oceanic climate (Cfb) zone [25]. The mean annual air temperature of 13.0 °C, with August as the warmest month (mean air temperature 19 °C), and January the coldest (mean air temperature 8 °C). The average annual precipitation is 1787 mm. The relatively low values for potential evapotranspiration (<300 mm in summer and 50–100 mm in winter) results in a positive water balance (600–800 mm) [26].
The city is in the contact zone between a granitic area and the Santiago Unit of the metamorphic massif known as the Ordes Complex, and therefore presents an important geological diversity. There are four main lithological units in the city, arranged approximately in parallel bands with a N–S direction: (1) granitic rocks, mostly medium- to coarse-grained two-mica granites; (2) Santiago schists, rich in micas and poor in quartz; (3) orthogneisses, with a similar composition to granites; and (4) amphibolites, composed mainly of amphibole and plagioclase [27,28,29].

2.2. Soil Sampling and Analysis

We sampled soils at 55 points in the city, over several materials, and under different vegetations and land uses (Table 1). Composite samples (soil depth 0–20 cm) were obtained by mixing 4–5 subsamples taken with an auger at each point. Soils were taken to the laboratory, air-dried and sieved (<2 mm) before analysis. Edaphic properties of the soils, including pH, texture, OC, CEC, etc., were previously published [30].
For the analysis of total trace elements (Cu, Pb, Zn, Ni, Cr, As), air-dry sieved soils were ground in an agate mortar down to <250 µm. Ground samples were analyzed by X-ray fluorescence using an energy-dispersive Miniprobe Multielement Analyzer (EMMA-XRF) with two pieces of equipment. Copper, Ni, Zn, Pb, and As were analyzed using a Mo anode, whereas Cr was analyzed with an Ag tube and a secondary anode of pyrographite. The EMMA–XRF and its application for elementary analysis has been described elsewhere [31]. The instruments are hosted at the RIAIDT (Infrastructure Network for the Support of Research and Technological Development) facility of the University of Santiago de Compostela (Spain). The instruments were calibrated using several reference materials (NIST 1515, 1547, and 1575, BCR 60 and 62, and V-1). Standard reference materials CRM143R (sewage sludge-amended soil) and 320R (channel sediment), from the European Commission Community Bureau of Reference (BCR), were used for quality control. Detection limits for the technique in soil are as follows: 3 mg kg−1 for Ni and Pb, 4 mg kg−1 for Cu, 10 mg kg−1 for Cr, 5 mg kg−1 for Zn, and As. All analyses were performed in triplicates.

2.3. Pollution Assessment

The pollution status of the soils was first assessed taking into account the regulations in the region: trace element concentrations were compared to regional background levels and generic reference levels (GRLs) for the protection of human and ecosystem health, as established in the Spanish and Galician regulations on contaminated soils (Table 2 [32]). Four GRLs are established: industrial use, urban use, other uses (including agricultural) and ecosystem protection (from high to low). For a soil to be declared as polluted, the concentration of a given element should surpass the corresponding GRL by a factor of 100.
Besides, the geoaccumulation index, Igeo [33] was calculated for the six trace elements at each point as follows:
Igeo = log2[Cn/(1.5 × Bn)],
where Cn is the concentration of the element in the soil and Bn is the geochemical background value. Here we used background values for the soils of the region taking into account the lithology of the parent material at each point (Table 2). According to the Igeo values, soils are classed into six degrees: uncontaminated (Igeo ≤ 0); uncontaminated to moderately contaminated (0 < Igeo ≤ 1); moderately contaminated (1 < Igeo ≤ 2); moderately to heavily contaminated (2 < Igeo ≤ 3); heavily contaminated (3 < Igeo ≤ 4); heavily to extremely contaminated (4 < Igeo ≤ 5); and extremely contaminated (Igeo ≥ 5).

2.4. Statistics

ANOVA mixed model analysis was used to determine the influence of parent material and land use on trace element concentrations. Before analysis, the normality of data was checked using the Shapiro-Wilk test. Data that did not pass the normality test were log-transformed for ANOVA. The homogeneity of variance was tested using the Levene test. When a significant effect of land use or lithology at a level of significance of p < 0.05 was found, the Tukey’s multiple range test was used to separate groups. Pearson’s correlation analyses between the metal concentrations and main edaphic properties of the soils were also conducted. All statistical analyses were performed using the R statistical software for MacOSX version R 3.1.3 [34] and the package R Commander version 2.6-1 [35].

3. Results

As presented in a previous publication, the soils of the city of Santiago de Compostela are acid (pH in water from 4.7 to 6.9), coarse-textured (dominant texture is sandy loam) and rich in organic matter (13–137 g OC kg−1), with differences in soil composition and chemical properties that are influenced by the diversity of lithology and land use. Soils developed over amphibolites show heavier textures and higher Fe contents than soils developed over other parent materials, whereas soils of urban allotment gardens present higher nutrient contents, pH and salinity than soils under forest or lawn vegetation [30].

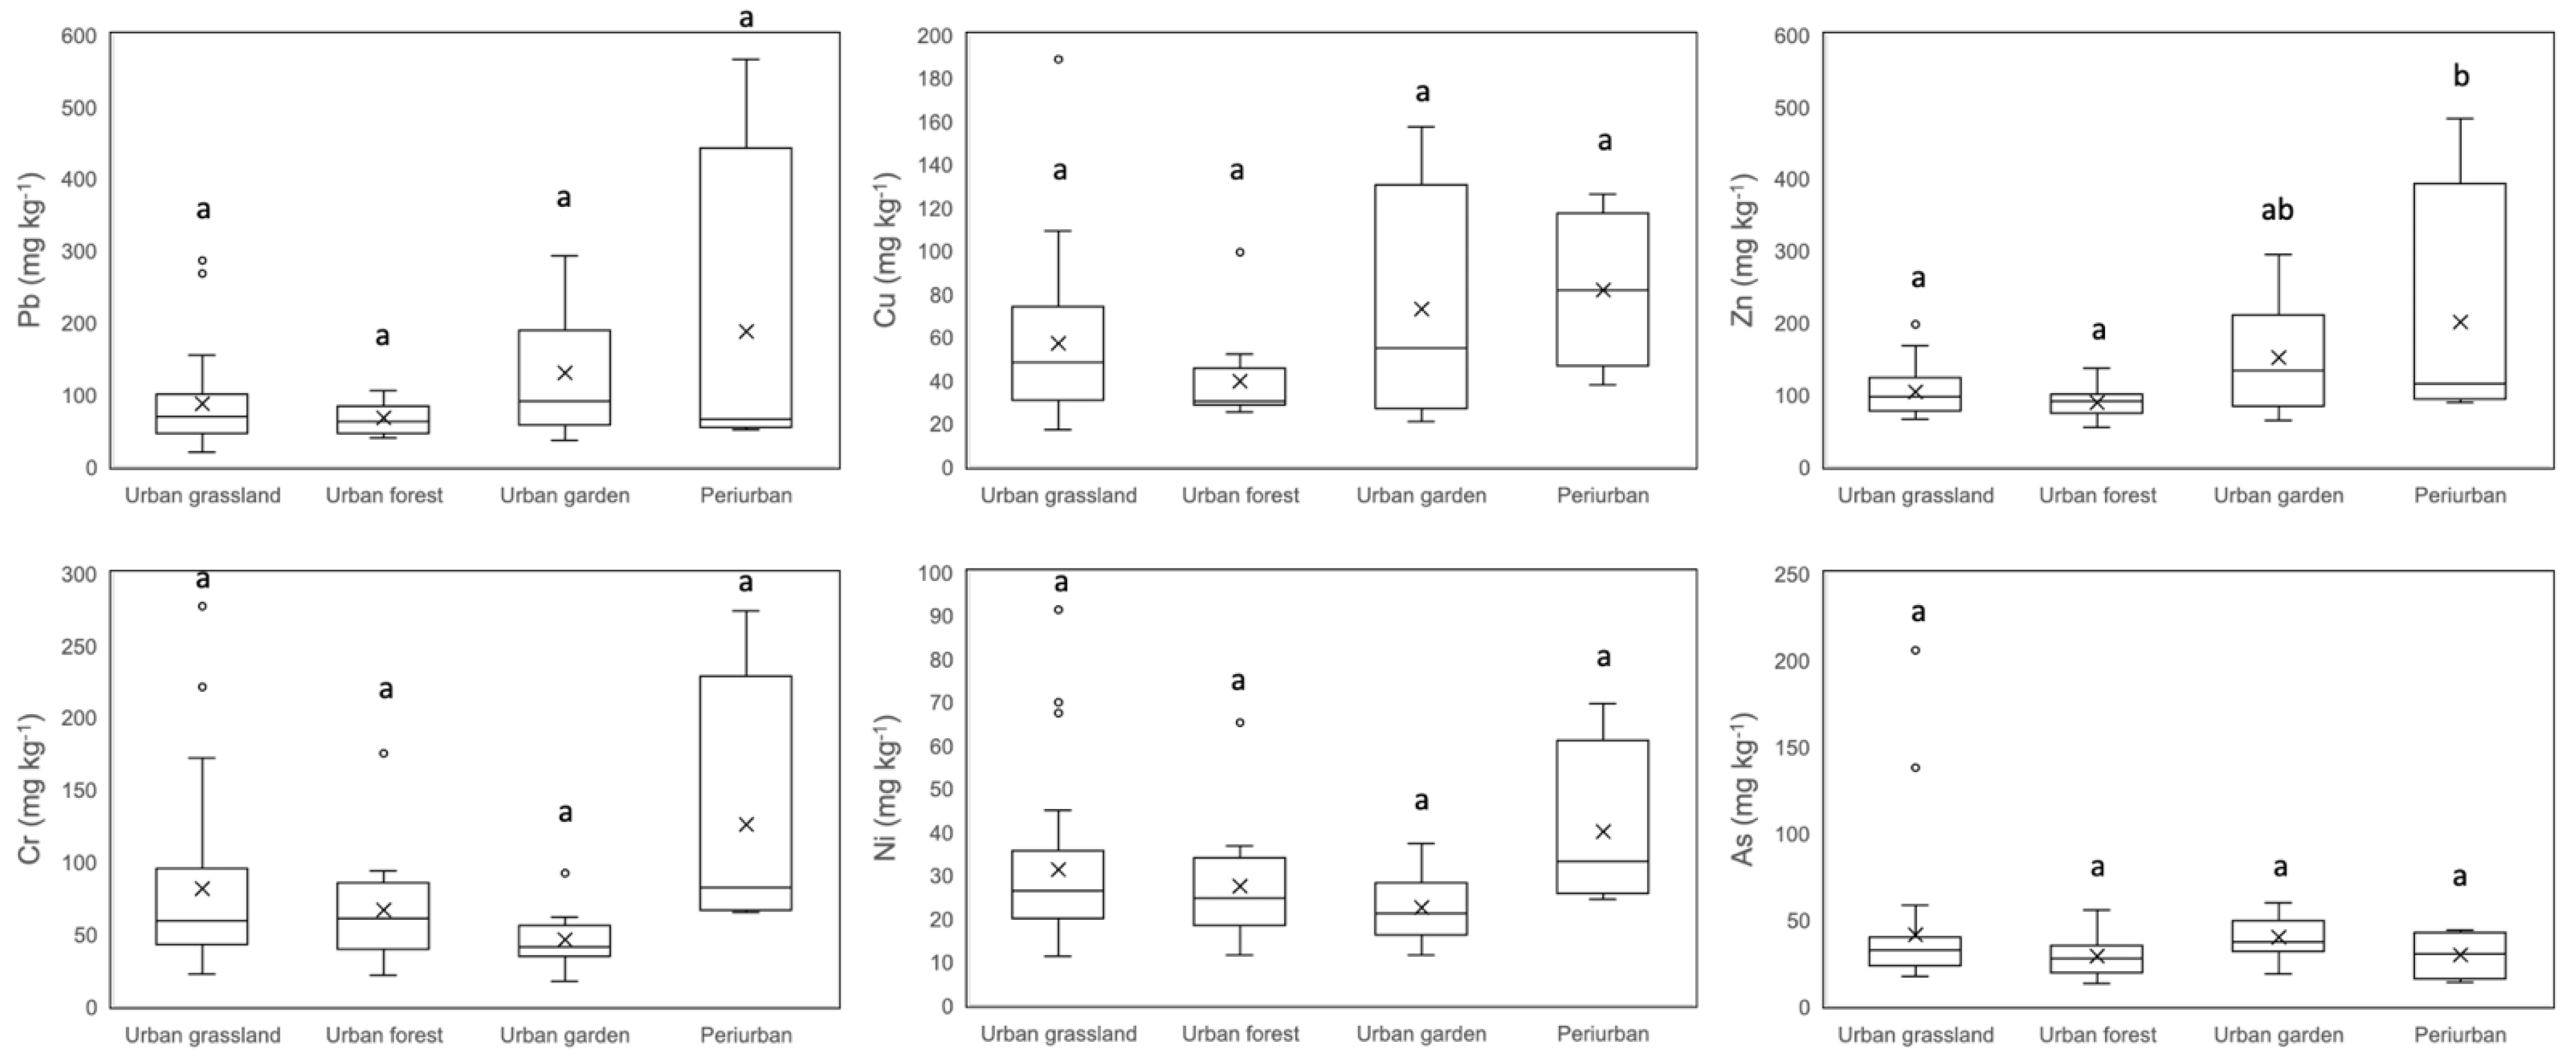
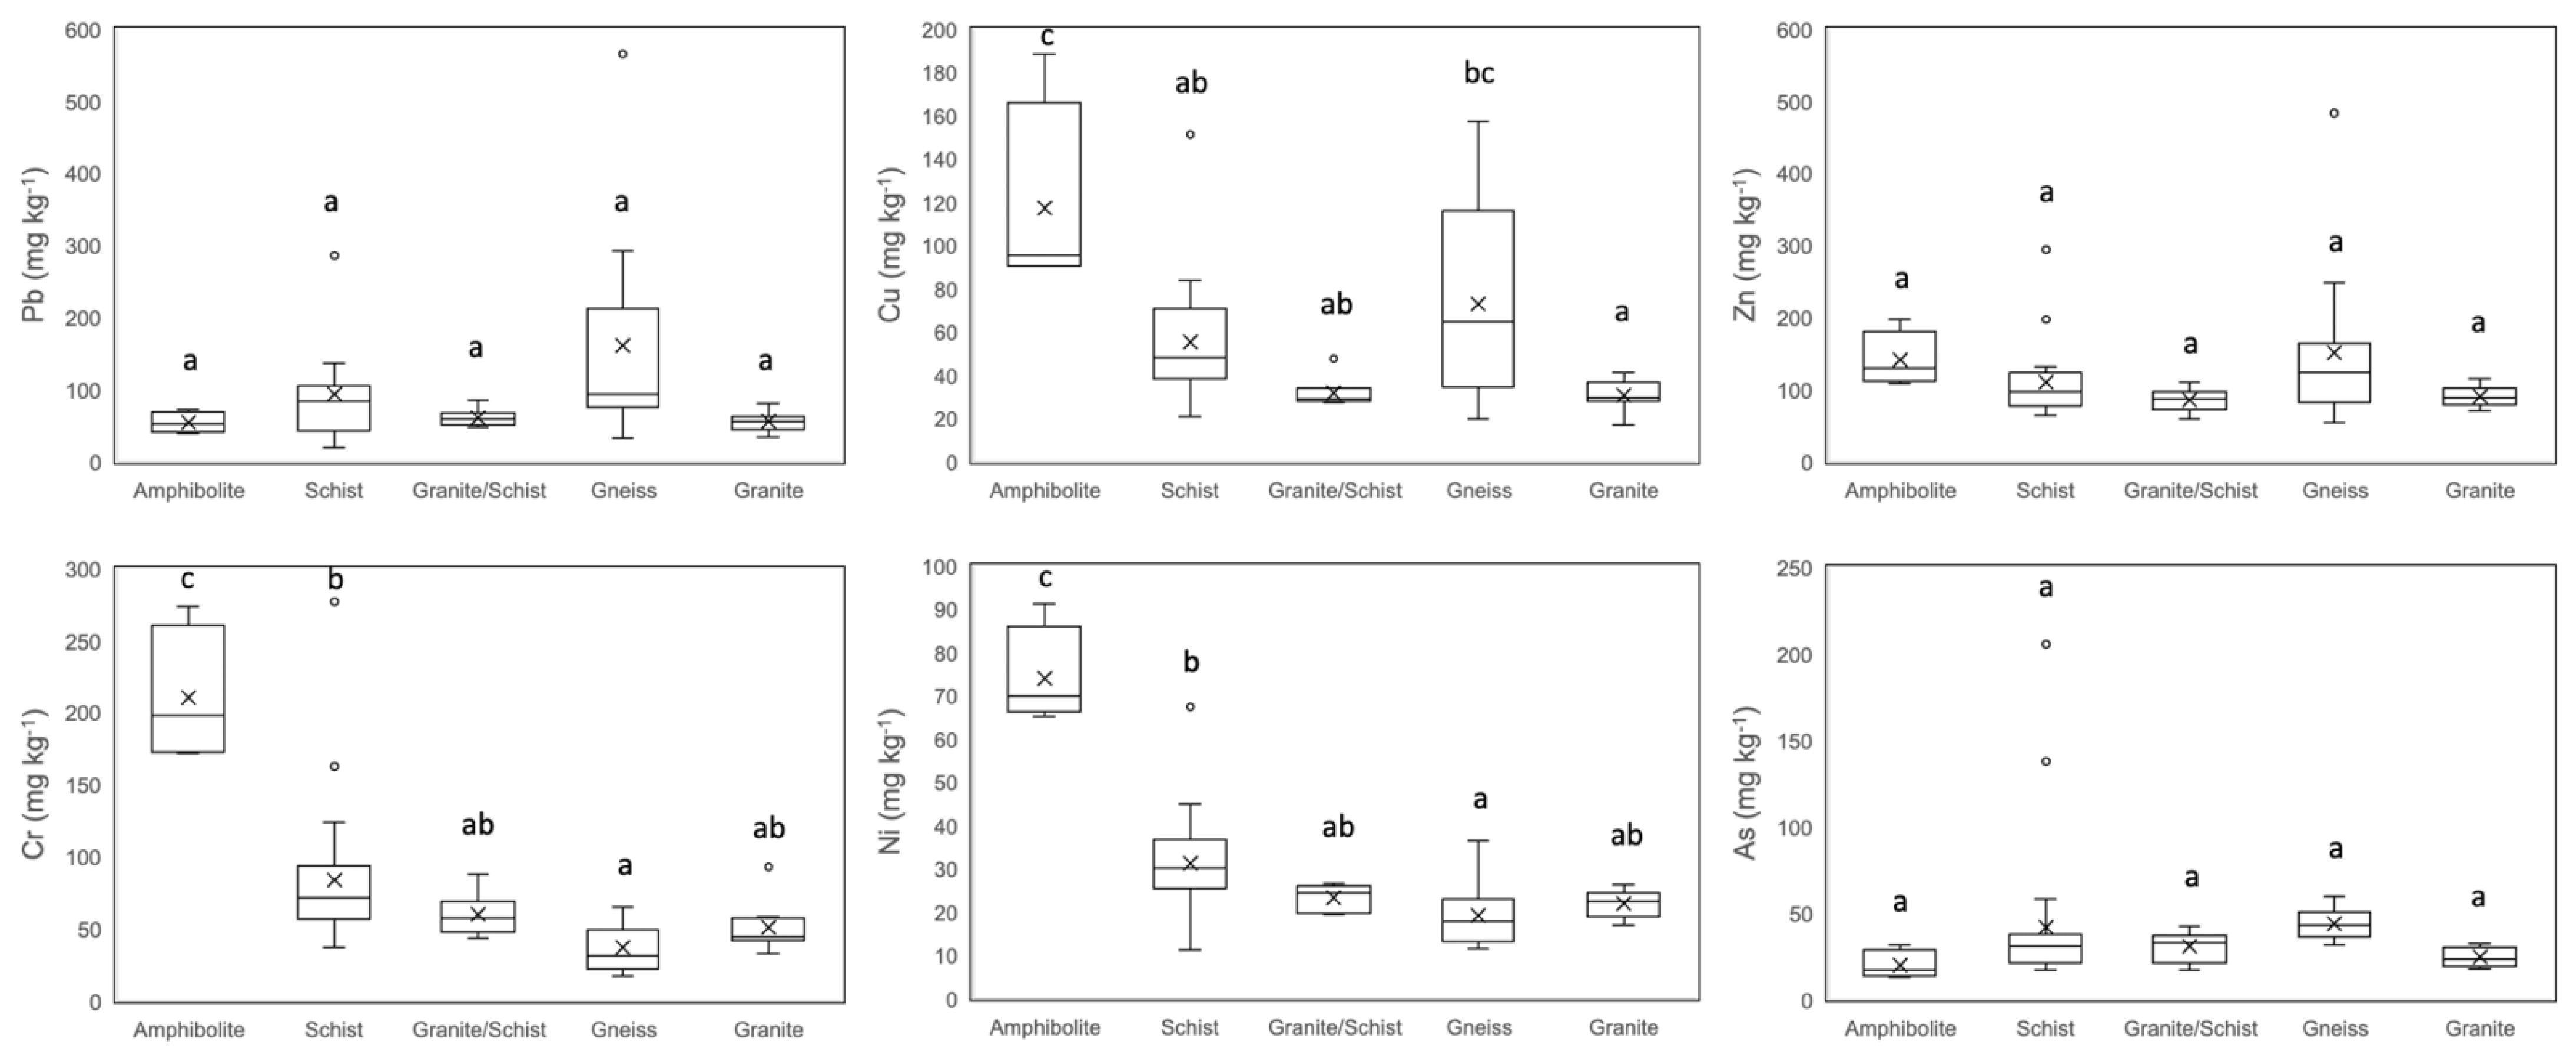
3.1. Trace Element Concentrations and Influence of Land Use and Lithology

The total concentrations of the six trace elements considered in all the soils are shown in Table 3. Figure 1 and Figure 2 show these concentrations grouped by land use and lithology, along with ANOVA results for the influence of land use and lithology, whereas their spatial distribution is shown in Figure 3. Table 4 presents correlations between trace elements contents and soils physicochemical properties.
In most soils, trace element concentrations followed the sequence Zn > Pb > Cr > Cu > As > Ni. Zinc was the most abundant element in 33 out of the 55 points, ranging from 55 to 484 mg kg−1 with a mean of 116 mg kg−1 and a median of 96 mg kg−1. A significant influence of lithology was not observed, but higher Zn concentrations were observed in agricultural soils (Figure 1, p = 0.004**) and if we look at the spatial distribution (Figure 3), Zn concentrations were clearly higher in the city center. Zn concentrations were positively correlated to Pb and Cu (Table 4). Zn was positively correlated to oxalate-extractable Fe but not total Fe or free iron (Table 4); thus, suggesting a preferential association to poorly-crystalline iron forms. Weak positive correlations were found with pH and clay content that could reflect Zn accumulation in the soil due to a reduction of mobility under conditions close to neutrality and interaction with clay minerals.
Lead was the element with the highest concentrations in 12 out of the 55 soils; its concentrations ranged from 20 to 566 mg kg−1, with an average of 97 mg kg−1 and a median of 71 mg kg−1. The point with the highest concentration could be related to past shooting activities, given that weathered bullets have been found in this soil. Overall, Pb concentrations were not significantly affected by land use or lithology, but a very clear pattern of spatial distribution was observed, with the highest concentrations found in the city center. Significant correlations with edaphic properties have not been found, but Pb was positively correlated to Cu and Zn concentrations.
Copper concentrations ranged between 17 and 188 mg kg−1, with an average of 58 mg kg−1 and a median of 46 mg kg−1, and it was the most abundant element in two soils. Lithology of the parent material has an influence on this element, with higher Cu contents in soils developed over amphibolites (p < 0.001 ***), whereas differences related to land use were not observed. Spatial distribution shows higher Cu concentrations in the city center, similarly to Zn and Pb, as well as in the eastern area of the city where the soil on amphibolites are located. Positive correlations observed with clay content and total and free Fe could be an indirect effect of the highest Cu contents in amphibolite soils, which are also the soils richer in iron compounds and clay, but also an effect of preferential association of Cu to iron compounds and clay minerals. In addition, Cu was positively correlated with Pb and Zn.
Chromium was the most abundant trace element considered in eight soils, with concentrations that ranged from 17 to 277 mg kg−1 (mean value of 74 mg kg−1 and median value of 58 mg kg−1). Influence of land use was not significant, whereas a very clear influence of lithology was observed (p < 0.001 ***), also reflected in the spatial distribution, with the soils on amphibolites as the richest ones. Significant positive correlations have been found with clay and free iron that, similarly to Cu, could reflect an actual association of this element to iron oxides and clay minerals or an indirect effect of the higher Fe and clay contents of the soils developed on amphibolites. Regarding the other trace elements, Cr concentrations were correlated with Ni, but not with other metals.
Nickel concentrations presented a very similar behavior to Cr, although they were lower. Total concentrations ranged between 11 and 91 mg kg−1, with a mean value of 29 mg kg−1 and a median value of 25 mg kg−1. Again, a very clear influence of lithology was found (p < 0.001 ***), with the soils on amphibolites as the richest ones, but no differences related to land use. Significant positive correlations to clay and several forms of iron (free, total, and oxalate-extractable) were found, and among the elements analyzed, it was only correlated to Cr.
Finally, arsenic concentrations ranged between 13 and 205 mg kg−1, with a mean of 37 mg kg−1 and a median of 33 mg kg−1. These concentrations were very unevenly distributed (only two points with much higher As contents than the rest), without a clear spatial pattern nor significant influence of land use and lithology. Significant correlations with soil properties or the rest of trace elements have not been found either.

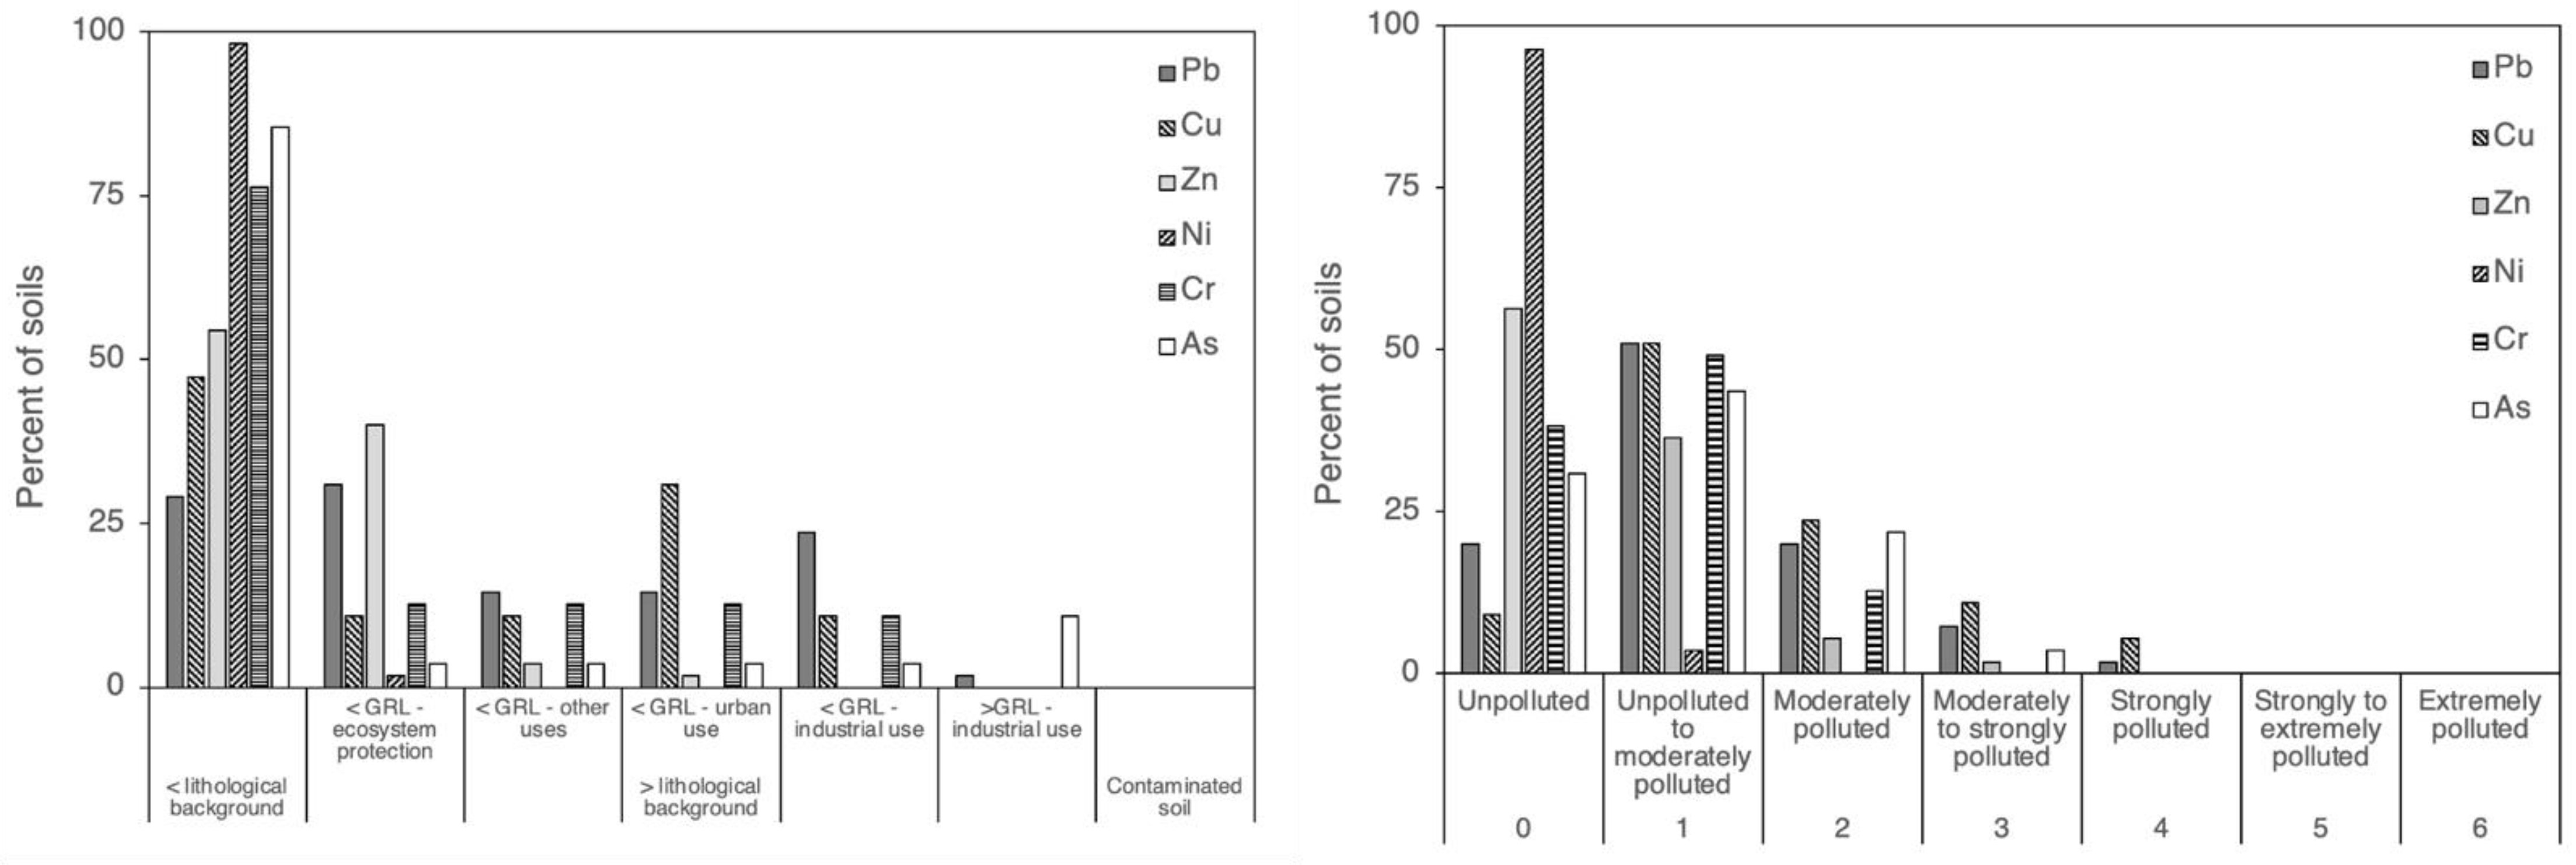
3.2. Assessment of Pollution Levels

Regarding the pollution assessment according to the geoaccumulation index, Igeo, the values obtained for each element are shown in Table 5, and the results summarized in Figure 4. In general, the highest values for Igeo were those for Cu and Pb (average Igeo of 0.98 and 0.74, respectively) followed by As (0.46), Cr (0.25), and Zn (0.22), with Ni presenting mean negative values (−0.90). Therefore, Pb and Cu would be the elements with the highest enrichment in these urban soils, whereas Ni would be the least with 96% soils non-polluted by this element. Taking into account the Igeo values in each soil for the six elements, 37% of the soils would be classed as unpolluted (class 0) or unpolluted to moderately polluted (class 1); 23 soils (42%) would be framed in class 2 (moderately polluted); 16% of the soils in class 3 (moderately to strongly polluted), and only three soils (5% of the total) as class 4—strongly polluted: in one case because of Pb and two other because of Cu. No soils are included in class 5 and 6 (strongly to extremely polluted soil).
In order to obtain further insights about the pollution levels of the soils, we have compared trace element concentrations to regional background values and to generic reference levels as established in the regulations for polluted soils (Table 2), with the results of this comparison summarized in Figure 4. In the case of Zn, 25 out of 55 soils exceeded the normal background values in soils of the region, but only three soils surpassed the generic reference level (GRL) for ecosystem protection, only one exceeded also the GRL set for other uses and none of the soils surpassed the levels established for urban or industrial use. Most soils exceed the background values for Pb concentrations (39 soils, 75% of the total). Among these, 21 soils surpassed the GRL for ecosystem protection, of which 15 also exceeded the urban use GRL and only one surpassed the GRL for industrial use. For Cu, 28 out of 55 soils present concentrations over the background values: of these, concentrations in 22 soils surpass the GRL for ecosystem protection and in six cases also exceed the GRL for urban use. None of the soils surpassed the Cu thresholds set for industrial use. Regarding Cr concentrations, only 11 soils surpass the lithological background established in the regulation: those soils also surpassed the levels for ecosystem protection and other uses, of which four surpassed the GRL for urban use, and none of the soils surpassed the thresholds set for industrial use. In the case of Ni, only two soils presented concentrations higher than the background set in the regulations and none of the soils surpassed other protection levels for contamination. Finally, arsenic concentrations in seven soils exceed the regional background, among which six also exceed all levels of protection for urban or industrial use (GRL values are set at the same value, 50 mg kg−1, for the three uses).
Overall, comparison of total concentrations to GRLs shows that no soil would be considered polluted by the Spanish Law (element concentration > 100 times the corresponding GRL), but an important number of the soils present contaminant levels that would require further investigation of risk assessment: 35 soils (64 % of the total) exceeded the level set for other uses for at least one element, 25 soils (45% of the studied soils) the urban use levels, and seven soils (13% of studied soils) the levels for industrial use (most of these because of As concentrations).

4. Discussion

Trace element concentrations are expected to be higher in urban soils than in natural and agricultural soils because pollution sources are usually more abundant in urban areas, including industrial facilities, waste disposal, and waste management activities, concentration of traffic and population, etc. Most trace elements are emitted to the atmosphere from these sources and associate to dust that is later deposited in the surface, reaching the soils where they accumulate because of their affinity for soil components that reduce their mobility [37]. In this sense, studies in cities all over the world have consistently shown that urban soils present higher concentrations of potentially toxic elements than surrounding non-urban soils, in particular if they are affected by industrial activities [2,3]. This was also observed in our study: in general, urban soils in Santiago de Compostela present trace element concentrations higher than the regional background values (Table 2) and the average levels in natural soils (Table 3 [36]), with different situations among the six elements considered. In a first group, Pb, Cu, and Zn concentrations exceed these values in 75%, 51%, and 45% of the soils analyzed, respectively, whereas Cr, Ni, and As concentrations are closer to those of natural soils, surpassing background levels in 20%, 4%, and 13% of the soils, respectively.
Comparison of total trace element concentrations in urban soils in Santiago to other studies shows that Cu, Pb, and Zn concentrations are overall lower than those found in much larger and industrialized cities like Chicago, Baltimore, or New York City [2,38,39,40]. However, average Ni or Cr concentrations are similar to these cities whereas As levels are higher in Santiago de Compostela. This can be explained by the predominance of different factors controlling the presence of each element in urban soils: Cu, Pb, and Zn would be mainly related to anthropogenic activities, so their concentrations in soil will increase in parallel to the size and level of industrialization of the city. In turn, Cr, Ni, and As concentrations in urban soils are most frequently controlled by lithological factors [2].
In this study, soil Pb, Zn, and Cu concentrations were clearly associated, as shown by their similar spatial distribution (Figure 3) and their mutual significant correlations (Table 4), so it is likely that the enrichment observed for these elements has a common anthropogenic origin. Their concentrations are higher in low valley landforms in the city center: areas that are prone to receive and concentrate pollutants by runoff from higher areas. This is particularly evident for Pb, which is marked consistently in the literature as the trace element that most typically accumulates in urban soils as a result of human activities [2,3,41,42], with traffic as the main cause of the emissions of this element, in addition to paints, glass and batteries [43]. Zinc emissions in urban areas are also associated to vehicle emissions (from example from tire abrasion), alloys, batteries, and metallic parts in buildings, such as gutters whereas the main sources of Cu in urban soils are alloys and electrical wiring [44]. Besides, in our study a non-negligible source of pollution is the common use of copper sulfate as fungicide in urban gardens, a typical agricultural practice in the area due to the climatic conditions that foster the development of fungal diseases.
In contrast to Cu, Pb, and Zn, literature shows that Cr, Ni, and As levels in urban soils are mainly controlled by lithology, although this does not mean that anthropic sources such as alloys, paints and dyes, waste incineration, coal and oil combustion do not contribute [2]. The lithological origin of these elements was very clearly manifested in our study for Cr and Ni, which are typically higher in mafic and ultramafic rocks, such as amphibolites and serpentinites [44], and high concentrations of these elements have been found in cities where these geological substrates are present, like Torino, Antalya, Gibraltar, Addis Ababa, or Baltimore [2]. In our study, both elements were highly correlated between them and not to other metals (Table 5) and presented a similar spatial distribution (Figure 3), with concentrations significantly higher in soils developed over amphibolites (Figure 2). In addition, significant correlations were found with edaphic properties typically associated with amphibolite soils, such as clay and Fe compounds, in which these soils are richer than soils developed over schists, gneiss, or granites [45,46].
In the case of As, which concentrations in the soils of Santiago de Compostela are much higher than in other cities in the world [2,3], an important lithological component exist. This is due to the geochemical enrichment in As in the region of Galicia, as shown by the high background levels (Table 2) and average concentrations in natural soils that are as high as 21 mg kg−1 (Table 3, [36]). Anthropic sources, such as fossil fuel combustion, especially coal, can also contribute to increasing As concentrations in urban soils [47]. In addition, there are two points in the city that present much higher As levels than the rest (soils 8 and 15, with respectively 138 and 205 mg As kg−1), corresponding to recently urbanized areas. Since there is no relation of these points to any known source of As emissions, the reason for such high concentrations remains uncertain.
The availability of information about the presence and concentrations of trace elements in urban soils is a valuable tool for the management of urban ecosystems and for land planning in the cities in general. Since the objective must be to reduce the potential risks for human health and the environment that these elements represent, practices must be adopted that aim at limiting the transfer of pollutants from soils to other environmental compartments. Contrarily to urban soils in many other cities, the soils in Santiago de Compostela are acid [30], which would increase the potential mobility of trace element since their solubility is higher at acid pH values [44]. Besides, erosion and transport of soil particles can be important processes of pollution of water courses and other soils, due to the high rainfall regime in the area, in combination with the topography of the city. In this sense, practices oriented at conserving and increasing soil organic matter levels can be a decisive factor to reduce these risks: on the one side, the high affinity of trace elements, in particular Pb and Cu, for organic matter in these acid soils [48,49] leads to a reduction of their mobility with increasing organic matter contents; on the other side, organic matter improves soil aggregate stability and permeability, increasing infiltration and reducing runoff losses and erosion.
Finally, land use in the city should be planned carefully and taking soil trace element concentrations into account. This is especially significant for the development of urban agriculture projects, where the risk that trace elements represent is higher due to their potential transference to the food chain through crops [42,50,51,52]. In this sense, soils should always be analyzed before developing new urban gardens so the areas with the highest levels of pollutants can be avoided. In addition, regular monitoring of trace elements in the soils of these areas is also necessary, since initial pollutant concentrations are likely to increase with time due to the use of some amendments, fertilizers, and agrochemicals [53].

5. Conclusions

The levels of trace elements found in the urban soils of Santiago de Compostela followed the sequence: Zn > Pb > Cr > Cu > As > Ni, with concentrations that are in general higher than in the non-urban soils of the region. Copper, Pb, and Zn are the elements that most frequently surpassed typical values in non-urban soils, followed by As, with Cr and Ni concentrations closer to background values for soils over similar parent materials. Overall, Cu, Pb, and Zn concentrations in the soils were mostly determined by anthropogenic pollution, with the highest concentrations in low areas of the city center. In turn, Ni and Cr concentrations were controlled by lithology, with the highest concentrations in soils developed over amphibolites. Arsenic concentrations showed a pattern of localized pollution of unknown origin in two points. According to the pollution assessment using the geoaccumulation index, most urban soils presented low to moderate levels of pollution. None of the soils analyzed would be considered legally polluted according to the Spanish Law, although in some cases they surpass the trace element levels that would require further investigation of risk assessment.

Author Contributions

Conceptualization, C.H., R.P. and M.T.B.; methodology, C.H. and R.P.; software, C.H. and R.P.; validation, C.H. and R.P.; formal analysis, C.H., R.P. and M.T.B.; investigation, C.H. and R.P.; resources, R.P. and M.T.B.; data curation, C.H. and R.P.; writing—original draft preparation, R.P.; writing—review and editing, R.P. and M.T.B.; visualization, C.H. and R.P.; supervision, R.P. and M.T.B.; project administration, R.P.; funding acquisition, R.P. All authors have read and agreed to the published version of the manuscript.

Funding

This research has been funded by the Xunta de Galicia regional government (grant number ED431F 2018/04).

Institutional Review Board Statement

Not applicable.

Informed Consent Statement

Not applicable.

Data Availability Statement

All data used for this work are included in the published tables.

Acknowledgments

The authors gratefully acknowledge the support of the City Hall of Santiago de Compostela for the sampling for this study. Paradelo thanks the Spanish Ministry of Economy and Competitiveness (MINECO) for his Ramón y Cajal fellowship (RYC-2016-19286).

Conflicts of Interest

The authors declare no conflict of interest. The funders had no role in the design of the study; in the collection, analyses, or interpretation of data; in the writing of the manuscript, or in the decision to publish the results.

References

  1. UN DESA. Revision of World Urbanization Prospects; United Nations Department of Economic and Social Affairs: New York, NY, USA, 2018. [Google Scholar]
  2. Ajmone-Marsan, F.; Biasioli, M. Trace elements in soils of urban areas. Water Air Soil Pollut. 2010, 213, 121–143. [Google Scholar] [CrossRef]
  3. Li, G.; Sun, G.-X.; Ren, Y.; Luo, X.S.; Zhu, Y.G. Urban soil and human health: A review. Eur. J. Soil Sci. 2018, 69, 196–215. [Google Scholar] [CrossRef] [Green Version]
  4. Morel, J.L.; Chenu, C.; Lorenz, K. Ecosystem services provided by soils of urban, industrial, traffic, mining, and military areas (SUITMAs). J. Soils Sediments 2015, 15, 1659–1666. [Google Scholar] [CrossRef]
  5. Tresch, S.; Moretti, M.; Le Bayon, R.C.; Mäder, P.; Zanetta, A.; Frey, D.; Fliessbach, A. A gardener’s influence on urban soil quality. Front. Environ. Sci. 2018, 6, 25. [Google Scholar] [CrossRef]
  6. Zahran, S.; Mielke, H.W.; McElmurry, S.P.; Fillipelli, G.M.; Laidlaw, M.A.S.; Taylor, M.P. Determining the relative importance of soil sample locations to predict risk of child lead exposure. Environ. Int. 2013, 60, 7–14. [Google Scholar] [CrossRef] [PubMed]
  7. Santorufo, L.; Van Gestel, C.A.; Maisto, G. Sampling season affects conclusions on soil arthropod community structure responses to metal pollution in Mediterranean urban soils. Geoderma 2014, 226, 47–53. [Google Scholar] [CrossRef]
  8. Norra, S.; Weber, A.; Kramar, U.; Stuben, D. Mapping of trace metals in urban soils. J. Soils Sediments 2001, 1, 77–97. [Google Scholar] [CrossRef]
  9. Silva, H.F.; Silva, N.F.; Oliveira, C.M.; Matos, M.J. Heavy Metals Contamination of Urban Soils—A Decade Study in the City of Lisbon, Portugal. Soil Syst. 2021, 5, 27. [Google Scholar] [CrossRef]
  10. Madrid, L.; Díaz-Barrientos, E.; Ruiz-Cortés, E.; Reinoso, R.; Biasioli, M.; Davidson, C.M.; Duarte, A.C.; Grcman, H.; Hossack, I.; Hursthouse, A.S.; et al. Variability in concentrations of potentially toxic elements in urban parks from six European cities. J. Environ. Monit. 2006, 8, 1158–1165. [Google Scholar] [CrossRef] [PubMed] [Green Version]
  11. Pfleiderer, S.; Englisch, M.; Reiter, R. Current state of heavy metal contents in Vienna soils. Environ. Geochem. Health 2012, 34, 665–675. [Google Scholar] [CrossRef]
  12. Abel, S.; Nehls, T.; Mekiffer, B.; Wessolek, G. Heavy metals and benzo[a]pyrene in soils from construction and demolition rubble. J. Soils Sediments 2015, 15, 1771–1780. [Google Scholar] [CrossRef]
  13. Foti, L.; Dubs, F.; Gignoux, J.; Lata, J.-C.; Lerch, T.Z.; Mathieu, J.; Nold, F.; Nunan, N.; Raynaud, X.; Abbadie, L.; et al. Trace element concentrations along a gradient of urban pressure in forest and lawn soils of the Paris region (France). Sci. Total Environ. 2017, 598, 938–948. [Google Scholar] [CrossRef] [PubMed]
  14. Imperato, M.; Adamo, P.; Naimo, D.; Arienzo, M.; Stanzione, D.; Violante, P. Spatial distribution of heavy metals in urban soils of naples city (Italy). Environ. Pollut. 2003, 124, 247–256. [Google Scholar] [CrossRef]
  15. Mihailovič, A.; Budinski Petkovič, L.; Popov, S.; Ninkov, J.; Vasin, J.; Ralevič, N.M.; Vučinič-Vasič, M. Spatial distribution of metals in urban soil of Novi Sad, Serbia. GIS based approach. J. Geochem. Explor. 2015, 150, 104–114. [Google Scholar] [CrossRef]
  16. Ljung, K.; Otabbong, E.; Selinus, O. Natural and anthropogenic metal inputs to soils in urban Uppsala, Sweden. Environ. Geochem. Health 2006, 28, 353–364. [Google Scholar] [CrossRef] [PubMed]
  17. Beroigui, M.; Naylo, A.; Walczak, M.; Hafidi, M.; Charzyński, P.; Świtoniak, M.; Różański, S.; Boularbah, A. Physicochemical and microbial properties of urban park soils of the cities of Marrakech, Morocco and Toruń, Poland: Human health risk assessment of fecal coliforms and trace elements. Catena 2020, 194, 104673. [Google Scholar] [CrossRef]
  18. Sánchez-Martín, M.J.; Sánchez-Camazano, M.; Lorenzo, L.F. Cadmium and lead contents in suburban and urban soils from two medium-sized cities of Spain: Influence of traffic intensity. Bull. Environ. Contam. Toxicol. 2000, 64, 250–257. [Google Scholar] [CrossRef]
  19. Morillo, E.; Romero, A.S.; Madrid, L.; Villaverde, J.; Maqueda, C. Characterization and sources of PAHs and potentially toxic metals in urban environments of Sevilla (Southern Spain). Water Air Soil Pollut. 2008, 187, 41–51. [Google Scholar] [CrossRef]
  20. Acosta, J.A.; Gabarrón, M.; Faz, A.; Martínez-Martínez, S.; Zornoza, R.; Arocena, J.M. Influence of population density on the concentration and speciation of metals in the soil and street dust from urban areas. Chemosphere 2015, 134, 328–337. [Google Scholar] [CrossRef]
  21. Ordóñez, A.; Álvarez, R.; De Miguel, E.; Charlesworth, S. Spatial and temporal variations of trace element distribution in soils and street dust of an industrial town in NW Spain: 15 years of study. Sci. Total Environ. 2015, 524–525, 93–103. [Google Scholar] [CrossRef] [PubMed] [Green Version]
  22. Peña-Fernández, A.; Lobo-Bedmar, M.C.; González-Muñoz, M.J. Annual and seasonal variability of metals and metalloids in urban and industrial soils in Alcalá de Henares (Spain). Environ. Res. 2015, 136, 40–46. [Google Scholar] [CrossRef] [PubMed]
  23. Rodríguez-Seijo, A.; Andrade, M.L.; Alonso Vega, F. Origin and spatial distribution of metals in urban soils. J. Soils Sediments 2017, 17, 1514–1526. [Google Scholar] [CrossRef]
  24. López, R.; Hallat, J.; Castro, A.; Miras, A.; Burgos, P. Heavy metal pollution in soils and urban-grown organic vegetables in the province of Sevilla, Spain. Biol. Agric. Hortic. 2019, 35, 219–237. [Google Scholar] [CrossRef] [Green Version]
  25. Kottek, M.; Grieser, J.; Beck, C.; Rudolf, B.; Rubel, F. World Map of Köppen-Geiger Climate Classification updated. Meteorol. Z. 2006, 15, 259–263. [Google Scholar] [CrossRef]
  26. Martínez Cortizas, A.M.; Pérez Alberti, A. Atlas Climático de Galicia; Xunta de Galicia: Santiago de Compostela, Spain, 1999. (In Spanish)
  27. Martínez Catalán, J.R.; Klein, E.; Pablo Maciá, J.G.; González Lodeiro, F. El complejo de Ordenes. Subdivisión, descripción y discusión sobre su origen. (In Spanish, with English abstract). Cuad. Lab. Xeol. Laxe 1984, 7, 139–210. [Google Scholar]
  28. Arenas, R.; Rubio-Pascual, F.J.; Díaz-García, F.; Martínez Catalán, J.R. High-pressure micro-inclusions and development of an inverted metamorphic gradient in the Santiago Schists (Ordenes Complex, NW Iberian Massif, Spain): Evidence of subduction and syncollisional decompression. J. Metamorph. Geol. 1995, 13, 141–164. [Google Scholar] [CrossRef]
  29. Díaz García, F. Geochemical characterization of the basic and acid rocks in the Santiago Unit (NW Spain, Ordenes Complex). Geotectonic implications. Rev. Soc. Geol. Esp. 1990, 3, 261–273, (In Spanish, with English abstract). [Google Scholar]
  30. Paradelo, R.; Herbón, C.; Barral, M.T. Composition and chemical properties of the soils of the city of Santiago de Compostela, northwestern Spain. J. Environ. Qual. 2021, 50, 7–21. [Google Scholar] [CrossRef]
  31. Cheburkin, A.K.; Shotyk, W. An Energy-dispersive Miniprobe Multielement Analyzer (EMMA) for direct analysis of Pb and other trace elements in peats. Fresenius J. Anal. Chem. 1996, 354, 688–691. [Google Scholar] [CrossRef]
  32. Xunta de Galicia. Decree 60/2009 of February 26th on soils potentially contaminated and procedure for the declaration of contaminated soils. D. Of. Galicia 2009, 57, 5920–5936. (In Spanish) [Google Scholar]
  33. Muller, G. Index of geo-accumulation in sediments of the Rhine River. Geol. J. 1969, 2, 108–118. [Google Scholar]
  34. R Core Team. R: A Language and Environment for Statistical Computing; R Foundation for Statistical Computing: Vienna, Austria, 2020; Available online: https://www.R-project.org/ (accessed on 23 March 2021).
  35. Fox, J.; Bouchet-Valat, M. Rcmdr: R Commander; R Package Version 2.6-1; 2019; Available online: http://socserv.socsci.mcmaster.ca/jfox/Misc/Rcmdr/ (accessed on 23 March 2021).
  36. Macías, F.; Calvo, R. Niveles Genéricos de Referencia de Metales Pesados y Otros Elementos Traza en Suelos de Galicia; Xunta de Galicia: Santiago de Compostela, Spain, 2009. (In Spanish)
  37. Wong, C.S.C.; Li, X.; Thornton, I. Urban environmental geochemistry of trace metals. Environ. Pollut. 2006, 142, 1–16. [Google Scholar] [CrossRef] [Green Version]
  38. Yesilonis, I.D.; James, B.R.; Pouyat, R.V.; Momen, B. Lead forms in urban turfgrass and forest soils as related to organic matter content and pH. Environ. Monit. Assess. 2008, 146, 1–17. [Google Scholar] [CrossRef] [PubMed]
  39. Cannon, W.F.; Horton, J.D. Soil geochemical signature of urbanization and industrialization–Chicago, Illinois, USA. Appl. Geochem. 2009, 24, 1590–1601. [Google Scholar] [CrossRef]
  40. Cheng, Z.Q.; Paltseva, A.; Li, I.; Morin, T.; Huot, H.; Egendorf, S.; Su, Z.; Yolanda, R.; Singh, K.; Lee, L.; et al. Trace metal contamination in New York City garden soils. Soil Sci. 2015, 180, 167–174. [Google Scholar] [CrossRef] [Green Version]
  41. Luo, X.S.; Yu, S.; Zhu, Y.G.; Li, X.D. Trace metal contamination in urban soils of China. Sci. Total Environ. 2012, 421–422, 17–30. [Google Scholar] [CrossRef]
  42. Brown, S.A.; Chaney, R.L.; Hettiarachchi, G.M. Lead in urban soils: A real or perceived concern for urban agriculture? J. Environ. Qual. 2016, 45, 26–36. [Google Scholar] [CrossRef] [Green Version]
  43. Pattee, O.H.; Pain, D.J. Lead in the environment. In Handbook of Ecotoxicology; Hoffman, D.J., Rattner, B.A., Burton, G.A., Jr., Cairns, J., Jr., Eds.; CRC Press Inc.: Boca Raton, FL, USA, 2003; pp. 373–408. [Google Scholar]
  44. Kabata-Pendias, A. Trace Elements in Soils and Plants, 4th ed.; CRC Press: Boca Raton, FL, USA, 2011. [Google Scholar]
  45. García-Rodeja, E.; Silva, B.; Macías, F. Andosols developed from non-volcanic materials in Galicia, NW Spain. J. Soil Sci. 1987, 38, 573–591. [Google Scholar] [CrossRef]
  46. Carballas, T.; Rodríguez-Rastrero, M.; Artieda, O.; Gumuzzio, J.; Díaz-Raviña, M.; Martín, A. Soils of the Temperate Humid Zone. In The Soils of Spain; Gallardo, J.F., Ed.; Springer International Publishing: Cham, Switzerland, 2016; pp. 49–144. [Google Scholar]
  47. Garelick, H.; Jones, H.; Dybowska, A.; Valsami-Jones, E. Arsenic pollution sources. In Reviews of Environmental Contamination Volume 197; Garelick, H., Jones, H., Eds.; Springer: New York, NY, USA, 2009; pp. 17–60. [Google Scholar]
  48. Paradelo, R.; Villada, A.; Barral, M.T. Reduction of the short-term availability of copper, lead and zinc in a contaminated soil amended with MSW compost. J. Hazard. Mater. 2011, 188, 96–104. [Google Scholar] [CrossRef] [PubMed]
  49. Paradelo, R.; Villada, A.; Barral, M.T. Chemical fractionation of trace elements in a metal-rich amphibolite soil amended with municipal solid waste composts. Waste Biomass Valorization 2018, 9, 1935–1943. [Google Scholar] [CrossRef]
  50. Cruz, N.; Rodrigues, S.M.; Coelho, C.; Carvalho, L.; Duarte, A.C.; Pereira, E.; Römkens, P.F.A.M. Urban agriculture in Portugal: Availability of potentially toxic elements for plant uptake. Appl. Geochem. 2014, 44, 27–37. [Google Scholar] [CrossRef]
  51. Entwistle, J.A.; Amaibi, P.M.; Dean, J.R.; Deary, M.E.; Medock, D.; Morton, J.; Bramwell, L. An apple a day? Assessing gardeners’ lead exposure in urban agriculture sites to improve the derivation of soil assessment criteria. Environ. Int. 2019, 122, 130–141. [Google Scholar] [CrossRef] [PubMed]
  52. Paradelo, R.; Villada, A.; Barral, M.T. Heavy metal uptake of lettuce and ryegrass from urban waste composts. Int. J. Environ. Res. Public Health 2020, 17, 2887. [Google Scholar] [CrossRef]
  53. Joimel, S.; Cortet, J.; Consalès, J.N.; Branchu, P.; Haudin, C.S.; Morel, J.L.; Schwartz, C. Contribution of chemical inputs on the trace elements concentrations of surface soils in urban allotment gardens. J. Soils Sediments 2021, 21, 328–337. [Google Scholar] [CrossRef]
Figure 1. Soil trace element concentrations split by land use. Different letters mean statistically significant differences between land uses in the Tukey test at p < 0.05.
Applsci 11 04211 g001
Figure 2. Soil trace element concentrations split by lithology of the parent material. Different letters mean statistically significant differences between lithologies in the Tukey test at p < 0.05.
Applsci 11 04211 g002
Figure 3. Spatial distribution of trace element concentrations.
Applsci 11 04211 g003
Figure 4. Left: IGeo summary results. Right: Comparison of concentrations in soils with the Generic Reference Levels (GRL) established in regulations [32].
Applsci 11 04211 g004
Table 1. List of sampling points.
NameLatitudeLongitudeAltitudeLand UseLithology
1Carlomagno 142°53′00″ N8°31′23″ W290Urban grasslandAmphibolite
2Carlomagno 242°52′52″ N8°31′27″ W285Urban forestAmphibolite
3Vieiro 142°52′46″ N8°31′38″ W235Urban grasslandAmphibolite
4Fontiñas 142°53′02″ N8°31′47″ W260Urban grasslandSchist
5Fontiñas 242°53′05″ N8°31′57″ W265Urban gardenSchist
6Monte dos Postes42°53′17″ N8°31′53″ W300Urban grasslandSchist
7San Caetano42°53′24″ N8°32′05″ W300Urban grasslandSchist
8Bouza Brey42°53′20″ N8°32′21″ W275Urban grasslandSchist
9Burgo Xixón42°53′18″ N8°32′34″ W250Urban grasslandSchist
10Auditorio42°53′18″ N8°32′41″ W235Urban grasslandSchist
11Vistalegre 142°53′14″ N8°32′49″ W240Urban forestSchist
12Vistalegre 242°53′08″ N8°32′46″ W230Urban grasslandSchist
13Santa Isabel42°53′13″ N8°32′59″ W225Urban gardenSchist
14Espiño42°52′59″ N8°33′06″ W245Urban forestSchist
15Galeras 142°52′56″ N8°33′00″ W225Urban grasslandSchist
16Galeras 242°53′00″ N8°32′58″ W225Urban grasslandSchist
17Campo das Hortas42°52′47″ N8°32′52″ W235Urban gardenSchist
18Fonseca42°52′45″ N8°32′45″ W245Urban grasslandSchist
19Alameda 142°52′40″ N8°32′58″ W265Urban grasslandSchist
20Alameda 242°52′42″ N8°32′57″ W255Urban forestSchist
21Alameda 342°52′39″ N8°32′47″ W250Urban grasslandSchist
22Parlamento42°52′24″ N8°32′32″ W230Urban grasslandSchist
23Granell 142°51′54″ N8°32′48″ W215Urban grasslandSchist
24Granell 242°51′51″ N8°32′41″ W225Urban forestSchist
25Granell 342°51′59″ N8°32′57″ W205Urban forestGranite/Schist
26Almaciga 342°53′11″ N8°32′11″ W325Urban grasslandSchist
27Almáciga 142°53′06″ N8°32′14″ W315Urban grasslandGneiss
28Almáciga 242°53′08″ N8°32′13″ W320Urban gardenGneiss
29Bonaval 142°52′58″ N8°32′16″ W290Urban grasslandGneiss
30Bonaval 242°53′01″ N8°32′17″ W300Urban forestGneiss
31Caramoniña42°53′03″ N8°32′21″ W285Urban gardenGneiss
32Belvís 142°52′47″ N8°32′18″ W245Urban grasslandGneiss
33Belvís 242°52′46″ N8°32′17″ W250Urban gardenGneiss
34Belvís 342°52′33″ N8°32′20″ W225Urban forestGneiss
35Belvís 442°52′48″ N8°32′20″ W245Urban gardenGneiss
36Belvís 542°52′40″ N8°32′21″ W235Urban grasslandGneiss
37Paxonal 142°52′07″ N8°32′36″ W205Urban grasslandGneiss
38Paxonal 242°52′05″ N8°32′37″ W205Urban gardenGneiss
39Campus 142°52′34″ N8°33′31″ W245Urban grasslandGranite
40Campus 242°52′36″ N8°33′15″ W240Urban grasslandGranite/Schist
41Campus 342°52′41″ N8°33′22″ W235Urban forestGranite/Schist
42Campus 442°52′26″ N8°33′32″ W215Urban forestGranite/Schist
43Campus 542°52′32″ N8°33′31″ W240Urban forestGranite
44Campus 642°52′37″ N8°33′34″ W240Urban grasslandGranite/Schist
45Campus 742°52′26″ N8°33′15″ W230Urban grasslandSchist
46Campus 842°52′23″ N8°33′45″ W200Urban forestGranite
47San Lourenzo42°52′42″ N8°33′23″ W230Urban forestGranite/Schist
48Barcelona42°52′18″ N8°33′37″ W210Urban grasslandGranite
49Santa Marta 142°52′08″ N8°33′21″ W240Urban grasslandGranite
50Santa Marta 242°51′57″ N8°33′30″ W210Urban gardenGranite
51Santa Marta 342°51′53″ N8°33′47″ W190Urban gardenGranite
52Multiusos42°52′28″ N8°31′51″ W225Peri-urban croplandAmphibolite
53Lermo42°53′33″ N8°33′00″ W230Peri-urban croplandSchist
54Brañas42°52′17″ N8°32′20″ W210Peri-urban croplandGneiss
55Botánico42°52′39″ N8°33′42″ W205Peri-urban croplandGranite
Table 2. Generic reference levels (GRL, in mg kg−1) established for trace elements contents in Galician regulations for contaminated soils [32]. Lithological exceptions for basic rocks are indicated in brackets, when they are different from the general levels.
PbCuZnNiCrAs
GRL—lithological background5545 (90)10065 (100)80 (240)45
GRL—ecosystem protection8050 (90)20075 (100)80 (240)50
GRL—other uses10050 (90)30075 (100)80 (240)50
GRL—urban use100100500100100 (240)50
GRL—industrial use500200100020030050
Table 3. Trace element concentrations in urban soils (in mg kg−1, mean ± standard deviation, n = 3).
SoilPbCuZnNiCrAs
172 ± 3188 ± 5197 ± 991 ± 20172 ± 2220 ± 6
240 ± 699 ± 4136 ± 965 ± 4175 ± 413 ± 1
345 ± 390 ± 9123 ± 470 ± 10221 ± 1032 ± 6
431 ± 156 ± 875 ± 868 ± 12163 ± 2424 ± 7
536 ± 421 ± 165 ± 616 ± 237 ± 1018 ± 1
620 ± 347 ± 376 ± 441 ± 5113 ± 717 ± 3
790 ± 541 ± 795 ± 825 ± 382 ± 1321 ± 2
853 ± 641 ± 896 ± 1128 ± 2277 ± 7138 ± 32
9103 ± 349 ± 299 ± 731 ± 575 ± 1545 ± 6
1065 ± 163 ± 3125 ± 0.336 ± 380 ± 1333 ± 1
11101 ± 652 ± 487 ± 1034 ± 583 ± 1327 ± 3
12111 ± 446 ± 3115 ± 529 ± 666 ± 1744 ± 1
13102 ± 675 ± 5197 ± 1337 ± 492 ± 758 ± 4
1468 ± 329 ± 395 ± 2737 ± 594 ± 820 ± 2
1585 ± 547 ± 693 ± 838 ± 660 ± 19205 ± 6
1656 ± 638 ± 799 ± 1429 ± 772 ± 335 ± 2
17289 ± 37151 ± 6294 ± 2330 ± 538 ± 233 ± 6
18137 ± 1581 ± 3116 ± 634 ± 3100 ± 1319 ± 2
19135 ± 584 ± 6130 ± 426 ± 341 ± 534 ± 4
20105 ± 240 ± 2104 ± 525 ± 257 ± 1229 ± 3
21286 ± 2255 ± 884 ± 611 ± 240 ± 827 ± 5
2237 ± 166 ± 1123 ± 645 ± 5124 ± 1224 ± 3
2392 ± 3729 ± 165 ± 528 ± 0.471 ± 2135 ± 3
2440 ± 634 ± 469 ± 234 ± 268 ± 1027 ± 2
2557 ± 1028 ± 659 ± 724 ± 288 ± 1035 ± 2
2683 ± 379 ± 22131 ± 818 ± 357 ± 138 ± 0.4
2732 ± 620 ± 668 ± 417 ± 522 ± 1258 ± 3
2858 ± 123 ± 283 ± 511 ± 217 ± 8760 ± 2
2978 ± 469 ± 980 ± 713 ± 123 ± 843 ± 1
3078 ± 525 ± 555 ± 713 ± 329 ± 1555 ± 1
31156 ± 38157 ± 58144 ± 1219 ± 228 ± 544 ± 8
32268 ± 28109 ± 7167 ± 423 ± 348 ± 2040 ± 8
33155 ± 864 ± 2161 ± 916 ± 440 ± 733 ± 4
3482 ± 1443 ± 393 ± 711 ± 122 ± 1135 ± 4
35293 ± 10124 ± 25248 ± 223 ± 150 ± 1146 ± 3
36155 ± 1276 ± 5151 ± 720 ± 331 ± 937 ± 3
3793 ± 165 ± 6107 ± 718 ± 549 ± 431 ± 4
3872 ± 246 ± 2123 ± 928 ± 562 ± 1840 ± 1
3935 ± 317 ± 170 ± 922 ± 543 ± 218 ± 3
4062 ± 529 ± 486 ± 919 ± 444 ± 1033 ± 2
4161 ± 330 ± 190 ± 1326 ± 563 ± 417 ± 2
4252 ± 229 ± 491 ± 320 ± 749 ± 333 ± 2
4341 ± 0.428 ± 388 ± 524 ± 547 ± 919 ± 2
4448 ± 127 ± 177 ± 425 ± 154 ± 1723 ± 1
4539 ± 426 ± 272 ± 1023 ± 351 ± 819 ± 1
4662 ± 130 ± 378 ± 1417 ± 633 ± 920 ± 2
4785 ± 148 ± 3110 ± 527 ± 161 ± 842 ± 1
4855 ± 534 ± 3105 ± 226 ± 658 ± 230 ± 3
4963 ± 529 ± 191 ± 1220 ± 341 ± 825 ± 5
5058 ± 228 ± 285 ± 618 ± 143 ± 1832 ± 3
5180 ± 1441 ± 2115 ± 624 ± 253 ± 730 ± 3
5260 ± 391 ± 10109 ± 570 ± 4274 ± 3314 ± 1
5371 ± 172 ± 9122 ± 1830 ± 371 ± 1138 ± 6
54566 ± 38126 ± 5484 ± 736 ± 565 ± 744 ± 1
5552 ± 338 ± 889 ± 424 ± 793 ± 1022 ± 3
Mean9758116297437
Median714696255833
Standard deviation913767165629
Minimum201755111713
Maximum56618848491277205
Average content in natural soils a29 ± 1521 ± 14
(50 ± 32)
60 ± 2956 ± 25
(66 ± 32)
80 ± 72
(129 ± 79)
21 ± 20
a Averaged values in non-agricultural soils in Galicia [36]. Values for soils developed over basic rocks are indicated in brackets.
Table 4. Correlations between trace element concentrations and edaphic properties. Significance of correlation is indicated as follows: * significant at a p-value of 0.05; ** significant at a p-value of 0.01; *** significant at a p-value of 0.001.
pHwpHKClClayCCECFetotalFeDCBFeoxPbCuZnNiCr
Pb0.100.110.02−0.08−0.01−0.21−0.150.151
Cu0.36 **0.36 **0.50 ***−0.080.100.400.42 ***0.410.55 ***1
Zn0.27 *0.250.30 *−0.050.110.110.130.36 **0.84 ***0.70 ***1
Ni0.050.020.75 ***0.100.130.94 ***0.90 ***0.50 ***−0.110.480.201
Cr0.010.020.51 ***0.150.110.78 ***0.76 ***0.30 *−0.180.24 **0.020.75 ***1
As−0.001−0.06−0.20−0.16−0.06−0.13−0.17−0.110.06−0.030.03−0.090.08
Table 5. Values of the geoaccumulation index (Igeo).
Igeo
SoilPbCuZnNiCrAsSoil Class
10.61.31.0−0.1−0.20.42
2−0.30.40.5−0.6−0.1−0.21
3−0.10.30.3−0.50.21.12
4−0.60.6−0.40.11.1−0.42
5−0.4−0.8−0.6−1.9−1.0−0.90
6−1.20.4−0.4−0.60.6−1.01
71.00.2−0.1−1.30.2−0.71
80.20.20.0−1.21.92.13
91.20.40.0−1.00.00.52
100.50.80.3−0.80.10.01
111.10.5−0.2−0.80.2−0.32
121.30.40.2−1.1−0.10.42
131.11.11.0−0.70.30.82
140.5−0.3−0.1−0.70.4−0.81
150.90.4−0.1−0.7−0.32.63
160.30.10.0−1.10.00.11
172.62.11.6−1.0−1.00.03
181.61.20.2−0.90.4−0.82
191.51.20.4−1.2−0.40.12
201.20.10.1−1.3−0.1−0.22
212.60.6−0.2−2.4−0.9−0.33
22−0.30.90.3−0.5−0.8−0.41
231.0−0.3−0.6−1.20.00.11
24−0.2−0.1−0.5−0.9−0.1−0.30
250.3−0.4−0.7−1.40.30.11
260.81.10.4−1.8−0.40.22
27−0.50.4−0.3−1.1−0.51.72
280.40.60.0−1.7−0.81.72
290.82.20.0−1.5−0.41.33
300.80.8−0.6−1.4−0.11.62
311.83.40.8−0.9−0.11.34
322.62.91.0−0.70.71.23
331.82.11.0−1.20.40.93
340.91.50.2−1.7−0.51.02
352.73.01.6−0.60.71.44
361.82.30.9−0.80.01.13
371.02.10.4−1.00.70.83
380.71.60.6−0.41.01.22
39−0.40.2−0.2−0.70.50.01
400.51.00.1−0.90.50.91
410.41.00.1−0.51.1−0.12
420.20.90.1−0.90.70.91
43−0.10.90.1−0.60.60.11
440.10.9−0.1−0.50.80.31
45−0.20.8−0.2−0.70.80.11
460.51.0−0.1−1.10.10.22
470.91.70.4−0.41.01.22
480.31.20.3−0.41.00.72
490.50.90.1−0.90.50.51
500.40.90.0−1.00.50.81
510.81.50.5−0.60.80.82
520.30.30.1−0.50.5−0.11
530.61.00.3−1.00.00.22
543.73.12.60.01.11.34
550.21.30.1−0.61.60.32
Publisher’s Note: MDPI stays neutral with regard to jurisdictional claims in published maps and institutional affiliations.

