Review

Advanced Development of Sensors’ Roles in Maritime-Based Industry and Research: From Field Monitoring to High-Risk Phenomenon Measurement

1
Department of Mechanical Engineering, Universitas Sebelas Maret, Surakarta 57126, Indonesia
2
Department of Naval Architecture, Institut Teknologi Sepuluh Nopember, Surabaya 60111, Indonesia
3
Department of Mechanical Engineering, Universitas Muhammadiyah Ponorogo, Ponorogo 63471, Indonesia
*
Author to whom correspondence should be addressed.
Appl. Sci. 2021, 11(9), 3954; https://doi.org/10.3390/app11093954
Submission received: 4 April 2021 / Revised: 24 April 2021 / Accepted: 25 April 2021 / Published: 27 April 2021
(This article belongs to the Special Issue Sensors and Measurement Systems for Marine Engineering Applications)

Abstract

:
The development of human civilization over the last decade has reached a landmark as Industry 4.0 has been widely introduced. Several aspects of industry and manufacturing activities are changing due to the Internet of Things (IoT), location detection technologies, and advanced human–machine interfaces. To enact industrial affairs under those specifications, a sensor is required to transform physical events into numerical information. The use of sensors in marine applications also appears in research and studies, in which the sensor is used for both monitoring the phenomena of a designated subject and data acquisition. Achievements in quantifying complex phenomena in critical maritime designs are fascinating subjects to discuss regarding their development and current states, which may be reliable references for further research on developing sensors and related measurement analysis tools in marine, shipbuilding, and shipping fields. This comprehensive review covers several discussion topics, including the origins and development of sensor technology, applied sensor engineering in logistic and shipping activities, the hydrodynamic characterization of designed hulls, the monitoring of advanced machinery performance, Arctic-based field observations, the detection of vibration-based damage to offshore structures, corrosion control and monitoring, and the measurement of explosions on critical maritime infrastructures.

1. Introduction

The Fourth Industrial Revolution (or Industry 4.0 [1,2,3,4,5,6,7,8,9]) is the ongoing automation of traditional manufacturing and industrial practices using modern smart technology. Large-scale machine-to-machine communication (M2M) [10,11,12] and the Internet of Things (IoT) [13,14,15] are being integrated for increased automation, improved communication and self-monitoring, and the production of smart machines that can analyze and diagnose issues without the need for human intervention. This phase is the latest development in a series of industrial revolutions, as summarized here and in Figure 1:
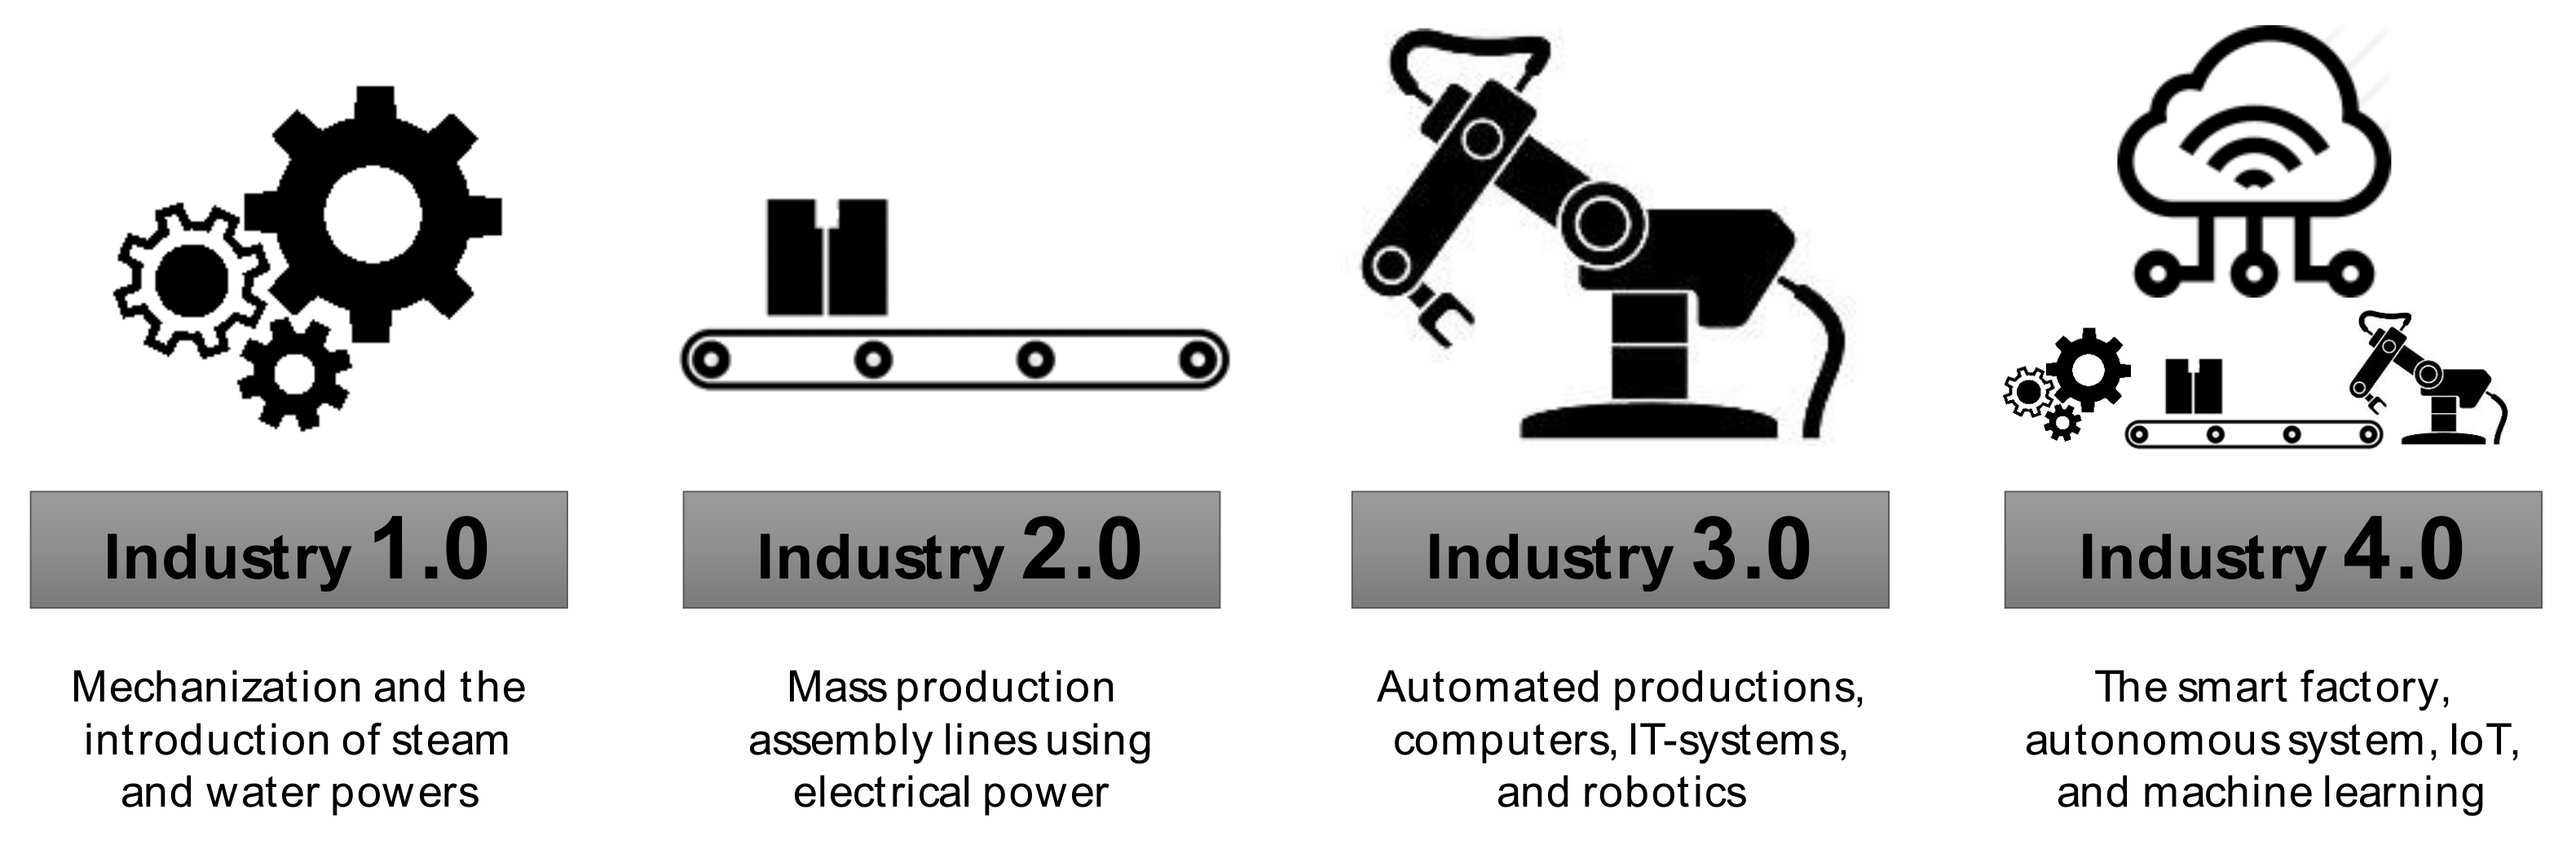
  • The First Industrial Revolution [16,17,18,19,20] began in the 18th century through steam power and production mechanization. Compared to thread production on simple spinning wheels, the mechanized version achieved eight times the volume in the same amount of time. Its use for industrial purposes was the most remarkable breakthrough for advancing humanity. Instead of weaving looms powered by muscle, steam engines could be used for power.
  • The Second Industrial Revolution [21,22,23,24,25], also known as the Technological Revolution, was between 1871 and 1914. It resulted from the installation of extensive railroads and telegraph networks, which allowed for faster transfer of people, ideas, and electricity.
  • The Third Industrial Revolution began with the first computer era [26,27,28,29,30]. These early computers were often very simple, unwieldy, and incredibly large relative to the computing power they were able to provide, but they laid the groundwork for the world today, which one is hard-pressed to imagine without computer technology. Around 1970, the Third Industrial Revolution involved electronics and IT (information technology) in furthering automation in production. In the early 2000s, computational instruments grew rapidly, which were followed by the development of numerical analysis, e.g., the finite element method (FEM) [31,32,33,34,35] and computational fluid dynamics (CFD) [36,37,38,39,40]. These have been continuously deployed and improved, especially for the calculation of complex phenomena.
Figure 1. An outline of the industrial revolutions.
Applsci 11 03954 g001
The Industrial Revolution era was expected to influence maritime-based industry and research even before it was openly discussed in the World Economic Forum in 2016. In terms of the relationship between industry and research, the maritime-based field is vast and rapidly growing due to the collaboration of these efforts. It is a complex constitution consisting of shipping and expedition, marine offshore condition monitoring, and Arctic–Antarctica exploration. Development is mandatory to maintain the sustainability of these fields as an essential contribution to the top ten global industries [41,42,43,44,45]. To increase the competitiveness of the maritime industry, the speed of digitalization and application of the latest technologies must increase rapidly, which will lead to many technological and regulatory challenges. The main aims of saving costs and efficiency will open up a wide range of opportunities for maritime-based industry and research 4.0. Combined with the other latest technologies, sensors will become one of the most powerful tools in Maritime Industry 4.0. The physical processes of sensors are seamlessly integrated with software and computational processes in cyber-physical systems. These systems typically involve intelligent sensing technologies at the data measurement and monitoring level of the system’s architecture. In order to comprehend such vital tasks, sensors are required to provide assistance to operators, technicians, and engineers [46,47,48,49,50]. The characteristics of the sensor are directed to provide real-time, meaningful information to increase productivity, efficiency, and flexibility in various sectors, including commercial and academic research.
An urgent need to apply sensors in both the maritime industry and research activities, as well as a tendency to do so, has been shown since early 2010, and it is important to quantify the frequency with which they are applied to predict the trends and developments of the new decade initiated in 2021. The current development of sensor technology will provide an excellent opportunity to improve the efficiency and safety of marine structures and environments. Real-time monitoring and analysis strategies will be vital to improving commercial automation in shipping, logistics, and marine and offshore activities in Maritime 4.0. IoT devices and machine learning algorithms will contribute a certain level of intelligence for industrial control systems and answer all problems that may arise. By collecting high-quality data with reliable sensor technology, the possibility of extending the life cycle of marine structures can be improved according to the highest standards of operation and maintenance. The current sensor technology and the development of a new generation of sensors and robust networking architectures will be on the cusp of revolutionary changes in environmental monitoring and data collection in Maritime 4.0.
This work aims to present a schematic review of sensor-based technology and its applications that is thoroughly focused on maritime industry and research. Contemporary subjects, including logistics and shipping, hull hydrodynamics, machinery performance, Arctic expedition, vibration and corrosion-based damage, and explosion analysis, are discussed and summarized to provide a charted trend of sensor application as an observational and measurement instrument. Predictions related to the technology’s applications in the new decade based on the state and development of the previous decade are presented.

2. Applied Sensor Engineering in Logistic and Shipping Activities

Technological and digital revolutions in the transport sector, including logistic and shipping activities of Maritime 4.0, have redefined the functional roles of shipping and ports. Ships have an important role in industrial activities as means of the transportation of passengers or goods. In 2018, approximately 11 billion tons of cargo were transported using ships [51]. Furthermore, several regulations were introduced in the 20th century to maintain passenger safety in maritime areas and strengthen ships. One of the regulations was the Safety of Life at Sea (SOLAS) convention established in 1914 [52]. Table 1 lists milestones along with regulations in international maritime safety. At present, several developments have been shown to increase the utility of the ship-using industry, including satellites, radars, and sensors. These developments can be used to determine the position of a ship and for maritime monitoring.
Table 1. Milestones in international maritime safety [53].
YearInitiative or Regulation
1914Safety of Life at Sea (SOLAS): Ship design and life-saving equipment
1929First international conference to consider hull subdivision regulations
1948The International Maritime (Consultative) Organization (IMO) is set up as a United Nations agency
1966Load Line Convention: Maximum loading and hull strength
Rules of the road
The International Association of Classification Societies (IACS):
Harmonization of classification rules and regulations
1969Tonnage Convention
1972International Convention on the International Regulations for Preventing Collisions at Sea (COLREG)
1974IMO resolution on probabilistic analysis of hull subdivision
1973Marine Pollution Convention (MARPOL 73)
1978International Convention on Standards for Training,
Certification and Watchkeeping for Seafarers (STCW)
1979International Convention on Maritime Search and Rescue (SAR)
1988The Global Maritime Distress and Safety System (GMDSS)
In 2007, Nezlin et al. [54] investigated satellite imagery as an alternative approach for assessing stormwater in the ocean region. The research examined the image quality of four types of satellite data: (1) Sea-viewing Wide Field-of-view Sensor (SeaWiFS) Level 2 normalized water-leaving radiation of 555 nm wavelength; (2) SeaWiFS Level 3 chlorophyll; (3) Advanced Very High-Resolution Radiometer (AVHRR) Level 3 sea surface temperature (SST); and (4) Moderate-Resolution Imaging Spectroradiometer (MODIS) Level 3 SST. One of the crucial conclusions of the research is that the MODIS sensors provided better coverage than SeaWiFS or AVHRR did due to better spectral, spatial, and particularly, temporal resolution. Song et al. [55] researched the detection of ships in an inland river using high-resolution optical satellite imagery. This research’s background shows that it is more difficult to detect ships in an inland river due to several challenges compared to ship detection in a sea and offshore area. The first challenge is that ships in an inland river are gathered together and difficult to separate. Secondly, ships lying alongside a pier are very likely to be identified as part of the pier. Usually, optical Earth observation satellites with a resolution adequate for ship detection are located in low Earth orbit [56]. Figure 2 shows a typical example of an optical satellite image of a coast. Satellite imagery is an important tool that can be used for monitoring marine vessels.
The examination of illegal fishing regions, maritime traffic management, oil spill detection, and national defense with ship detection all require maritime management technology [56,57,58]. De Maio et al. [57] investigated multi-polarization synthetic aperture radar (SAR) images for detecting oil spills. Synthetic aperture radar (SAR) is an active microwave imaging sensor that can provide high-resolution images under all weather and all light conditions [59,60]. Consequently, it plays a crucial role in marine monitoring and maritime traffic supervision [61].
Research on generating multiscale high-resolution synthetic aperture radar (SAR) images for ship detection was carried out by Zou et al. [61]. In the study, a high-resolution synthetic aperture radar (SAR) ship detection method was combined with an improved sample generation network, a multiscale Wasserstein auxiliary classifier generative adversarial network (MW-ACGAN), and the Yolo v3 network, to meet the application requirements of high-resolution small ship detection. The result shows that the Multiscale Wasserstein Auxiliary Classifier Generative Adversarial Network (MW-ACGAN) can effectively generate realistic multiclass ship images. The process of developing high-resolution synthetic aperture radar (SAR) ship slices is presented in Figure 3. The amount of ship traffic activity on the Northern Sea Route (NSR) of Russia’s northern coast from 2016 to 2019 is illustrated in Figure 4. As can be seen, the total number of ship voyages increased from 2016 to 2019 [62].
Synthetic aperture radar (SAR) images still possess several challenges—for example, most existing methods only detect ships with horizontal bounding boxes. Furthermore, ships are frequently arbitrary-oriented and densely arranged in complicated backgrounds. These deficiencies have received attention from researchers such as Pan et al. [63]. A multi-stage rotational region-based network (MSR2N) was proposed by Pan et al. [63] to solve the above problems. Additionally, the MSR2N can reduce background noise and prevent missing detection. The result is shown in Figure 5. As can be seen, as the interval of rotation angles decreases, the detection performance improves. Dai et al. [64] proposed a new detector based on convolution neural networks for multiscale synthetic aperture radar (SAR) ship detection in complex backgrounds. The model was applied to the Gaofen-3 dataset, a high-resolution civil SAR satellite in China, in order to test it. Comparisons of the performance with the SAR ship detection dataset (SSDD) and the proposed method are presented in Figure 6. The results show that the new method has a better performance than that of the SAR ship detection dataset (SSDD). The landmark research on sensor engineering applications in logistic and shipping activities is summarized in Table 2.
Figure 3. The method of creating high-resolution synthetic aperture radar (SAR) ship slices [61].
Applsci 11 03954 g003
Figure 4. Ship traffic statistics on the Northern Sea Route (NSR) in 2016–2019: (a) the total number of voyages and (b) the total number of sailing permits for Russia’s Northern Sea Route Administration (NSRA) (redrawn based on data in Gunnarsson [62]).
Applsci 11 03954 g004
Figure 5. The experimental results of the multi-stage rotational region-based network (MSR2N): (a) results of different methods on the SAR ship detection dataset (SSDD); (b) results of rotation angles (MSR2N) (redrawn based on data in Pan et al. [63]).
Applsci 11 03954 g005
Figure 6. Comparison of the evaluated detection performance among (a) CFAR, F-RCNN, and Coupled-CNN E A; (b) SSD, MFLHD, and the method proposed by Dai et al. (redrawn based on data in Dai et al. [64] and Gui et al. [65]).
Applsci 11 03954 g006
Recently, research on performance evaluations in marine navigation systems was intensely reviewed by Fukuda et al. [67]. The global navigation satellite system (GNSS) has been widely used for ship navigation, and spoofing poses an important threat to maritime logistics. Fukuda et al. [67] conducted research on the global navigation satellite system (GNSS) by combining it with an inertial measurement unit (IMU) and a Doppler velocity log (DVL). An inertial measurement unit (IMU) can identify three-axis acceleration and three-axis angular velocity. On the other hand, a Doppler velocity log (DVL) can measure the speed of a ship. Based on this research, the method can achieve less than 1 km horizontal error in an hour. A critical research issue for ship traffic safety in narrow waters is the ship speed limit, which is one of the most common causes of maritime accidents. Wang et al. [68] presented a new methodology to quantify the shipping traffic volume in the Yangtze River under current speed limits by using the automatic identification system (AIS) big data. The steps of the proposed method are as follows: (1) cleaning the raw AIS data to filter out unavoidable errors to improve the quality of the data, (2) geocoding the AIS data, (3) calculating the ship traffic aspect, and (4) estimating the shipping speed and traffic volume to analyze the speed limit. This work provides valuable insights to maritime safety authorities regarding adjustment of ship speeds to avoid heavy traffic congestion in narrow waterways and minimize the associated maritime risks. Feng et al. [69] also applied AIS data to propose a time efficiency assessment that evaluates the amount of time each ship spends in the different areas within a port (i.e., berth, anchorage, and fairway) based on the space–time trajectories of ship movements in Shanghai Yangshan Port and Xiamen Port in China. In this study, the space–time path concept from time geography is used to generate space–time trajectories from collected AIS data for vessel traffic services (VTS). The basic idea in this proposed work assumes that a ship is considered a moving object whose location changes over time in a port. The AIS is integrated with a GPS receiver and gyrocompass, and reports specific information, including Maritime Mobile Service Identity, navigation status, turn rate, speed over ground, position coordinate, etc. The AIS trajectory-based time efficiency assessment framework is divided into five different steps: trajectory construction, geographic zone identification, status classification, time efficiency statistics, and time efficiency assessment, as illustrated in Figure 7. This study provides useful information to shipping lines and port authorities for efficient scheduling and logistic support during operation. The challenge for future research is the integration of AIS data with other relevant ship information (e.g., cargo volume and cargo type) and port operation data (e.g., operation schedule and loading/unloading capacity) that can further enhance the proposed framework to conduct more comprehensive efficiency assessments.

3. Hydrodynamic Characterization of Designed Hulls

Hydrodynamic characterization is one of the most critical topics in marine structures for understanding the performance of a designed model. Hydrodynamic performance can be divided into resistance and propulsion, seakeeping and ship vibrations, and maneuvering. The measurement of hydrodynamic performance can be classified into three approaches: an empirical/statistical approach, a numerical approach (CFD based), and an experimental approach (scaled model test and full-scale trial). In this section, landmark research on sensor applications for characterizing the hydrodynamic performances of marine structures is comprehensively reviewed. Tzabiras and Kontogiannis [70] conducted lab-based resistance measurement of passenger ship models using different bows to verify the capability of the computational result. Three bulb-shape models were tested in the towing tank, where five resistance-type wave probes were mounted on the beam at five locations. The resistance was measured together with the dynamic sinkage and trim of the free-towed model. In 2011, the effect of heave and pitch motions on resistance and the ice-breaking pattern was investigated by Polach and Ehlers [71]. The towing mode test in an ice-going tanker ice basin was idealized as a spring–mass system, with a load cell as the spring element and a ship model and its mass as the mass element. Several sensors were used to measure the response. A pointer in the carriage was used to measure the broken channel, and a dynamic motion unit (DMU) at the bow measured the heave and pitch accelerations. Moreover, two cameras using the coordinate system were used to measure the cusp width.
In the following year, Lee et al. [72] conducted research on the hydrodynamic design and performance of an underwater hull-cleaning robot. Several sensors and instruments were mounted on the HCR’s body to measure the hydrodynamic performance on the towing tank. A resistance dynamometer with a capacity of 3000 N was mounted to measure the drag force. The HCR’s horizontal speed was measured using an electromagnetic flowmeter, and a commercial weighing scale was used to measure vertical thrust. The following year, in a collaboration project between IIHR and CNR-INSEAN, Bouscasse et al. [73] proposed a comprehensive experiment to investigate the seakeeping behavior of Delft 372 fast catamaran advancing in head waves. The catamaran model was towed through a kinematic system at the CNR-INSEAN water tank. Each demi-hull of the catamaran was connected by a transversal aluminum beam to ensure free pitch motion and restrain surge, sway, and roll movements. The position and motion of the model were identified using a Krypton optical system with three infrared LEDs. Two transducers (a Kenek probe and a Keyence ultrasound wave probe) fixed to the carriage measured the incident wave system. For wave elevation measurement, a second wave system (set of two probes) was mounted aside the hull at the LCG position. Two HYDRONICS load cells mounted between the gimbal and the model were used to measure the total resistance directly in waves. A data acquisition system with a sample rate of 300 Hz was used to record all of the physical quantities. Jang et al. [74] performed an experimental investigation in a water tunnel to measure frictional resistance reduction. Skin friction reduction using air lubrication techniques generated on the hull’s lower surface at various flow rates was observed. In this work, different flow rates were controlled by a flow meter. Images captured the air layer types, and two floating-plate-type friction sensors were used to measure local friction changes.
Fossati et al. [75], under the Lecco Innovation Hub project, reported a full-scale measurement using the 10-m Sailing Yacht Lab obtained during the first sea trials carried out in offshore Colico Marina. A description of the scientific framework, measurement capabilities, and data acquisition procedure is provided. In the data collection system architecture, six load cells located near the possibly highest loads were used to estimate the overall forces and moments transmitted by the sails and rig to the hull. The proposed GPS-aided inertial navigation test system computes the yacht attitude and boat dynamic. To acquire the angular rate, acceleration, and local magnetic field, gyroscopes, accelerometers, and magnetometers were arranged on the three primary axes, respectively. A GEMAC 23554 analog inclination sensor installed beside the inertial navigation system was used to calculate the heel and trim angle. Furthermore, NMEA-GPS provided navigation data (wind speed and direction, boat speed, and depth). An ultrasonic 3D anemometer set on the yacht bow was used for the addition of wind measurement. Additionally, time of flight (TOF) technology was used to measure the 3D geometry of the sail flying shape, and MEMS sensors and pressure pads were used to estimate the sail pressure. All the obtained signals were collected and synchronized using data recording equipment.
The majority of hydrodynamic tests are conducted in a towing tank environment, where the wave conditions are different from actual sea waves. In 2016, Rajendran et al. [76] measured wave-induced motion and bending moment tested at a basin with realistic extreme seas on a cruise ship. In the experimental program, resistive wave sensors measured the wave-induced motion, and strain gauges calculated the vertical bending moment of the model. Jiao et al. [77] comprehensively proposed a comparative analysis between a small-scale laboratory seakeeping test and a large-scale seakeeping measurement test with realistic sea waves of a 72,000-ton class ship. In this research project, advanced onboard remote control and an experimental telemetry system were developed to realize seakeeping measurement at sea near the shore of the bay of Huludao, China. The project focused on measurement of wave data, navigational information, global motions and loads, accelerations, impact pressures, and visual recording (green water on deck, wave run-up, and slamming). The sensors used in the small-scale laboratory tests included wave probes, strain gauges, pressure sensors, accelerometers, rotary potentiometers, and data collectors. For the large-scale measurement systems, an anemometer, wave buoy, and tachometer measured the ocean environment. A fiber optic sensor was needed for the real-time hull stress monitoring and evaluation system. Then, sailing trace, position, speeds, and motions were calculated by a GPS/INS system. The radio control and telemetry system were developed to allow the conduction of large-scale model trials in sea conditions. As seen from the result, the proposed large-scale experimental test has tremendous significance for the future development of a large-scale seakeeping measurement technique.
In 2019, Carchen et al. [78] proposed full-scale measurement onboard The Princess Royal research vessel to estimate the effect of biofouling growth on hydrodynamic performance. An automated sensor system was placed onboard the research vessel to acquire high-quality and quantitative hydrodynamic performance data. The results prove the effectiveness of the proposed method. In 2020, onboard measurement using several sensors installed on a bulk carrier ship was also investigated in depth by Kim et al. [79]. This study proposed a data-driven approach to predict added resistance and shaft horsepower using big data from onboard sensor measurement and the NOAA database. For input features, various sensing methods and protocols were used to collect the input data. A GPS sensor was used to measure ship velocity, and a draft sensor was used to calculate the draft of the vessel. An RPM indicator and echo sounder were then used to determine the RPM and sea depth, respectively. To measure the tide, wave height, and wind vector, a Doppler sensor, accelerometer, and anemometer were installed onboard, respectively. Moreover, a shaft torque sensor using a strain gauge that converts torque to resistance/MODBUS was applied to calculate output propulsion power. The collected raw data were then processed by the data acquisition unit of a VDR system. The landmark studies on the application of sensors for hydrodynamic characterization in marine structures from the early 2010s until 2020 are summarized in Table 3.
Several researchers recently proposed a new direction for full-scale measurement using onboard sensors of ship performance on actual seas. Full-scale measurements are conducted to obtain a better understanding of ship hydrodynamics. The method can achieve a similar sailing performance to that in the real sea environment, and the response characteristics are more realistic than those in a towing tank. One comprehensive measurement system included resistance and self-propulsion tests of a 25-m-long ore carrier “CSB FORTUNE,” which were conducted by Lin et al. [80] in the sea near Qingdao, China. Figure 8 illustrates the ship layout, which includes propulsion systems, sensor arrangements, and autopilot systems. A block diagram of two test systems for the actual ocean environment is shown in Figure 9. For the resistance testing procedure, the sea condition during the experiments was measured and recorded to meet the required level. Then, the model was hauled by two winches at a constant speed in the harbor, and a force balance was used to obtain data for 40 s of resistance measurement. For the self-propulsion testing procedure, the test was conducted at sea 5 km from the shore of Qingdao. The first test was performed with zero ship speed to check the propeller torque and measure the wind speed and direction. Then, the model sailed in a fixed direction at a different speed, and the thrust and torque data of the propeller were measured. It was found that the proposed procedure can be used for various applications, including as a guide for other large-scale ship performance tests. In other work using the same large-scale model, Guo et al. [81] studied the self-propulsion test for propulsion performance and the effects of complex wake field environments on propulsion performance. The GPS/INS integrated navigation system consisted of GPS antennas and an INS core, and a GNSS receiver obtained real-time motion data, including speed, track, heading, roll, pitch, and yaw rate. In the data measurement and acquisition system, the model used non-remote sensing control, which consisted of acceleration sensors, a self-developed instrument, a data collector, and a computer. Furthermore, with the measurement data of the same model as previous studies, Su et al. [82] investigated the effect of energy-saving devices’ (ESDs) application on ship propulsion performance. The interaction mechanism between the hull and the ESDs, including the pre-swirl stator and rudder bulb, was studied in a large-scale ship model. Future studies should focus on the interaction between the pre-swirl stator and rudder bulb system with different types of hulls.
Ship maneuvering in waves is a hot topic for researchers. In one recent study, a novel full-scale maneuvering sea trial correction method was developed by Mei et al. [83]. A trial test of the full-scale motor vessel Yukun with a constant engine setting was conducted in the northwest of the Yellow Sea to measure the effects of wind, waves, and currents on the maneuvering motions, including surge, sway, and turning data. The measuring instruments installed onboard of Yukun are illustrated in Figure 10. A differential global positioning system (DGPS), wind measuring system, speed log, and fiber optic gyro were installed on the bridge, mast, ship bow, and gyro deck. In this work, the full-scale Yukun model’s maneuvering was established, whereby zig-zag test training data were used to predict the turning circle test. The result revealed that Yukun meets the IMO standard for ship maneuverability, with the accuracy of the advance and tactical diameter reaching 93% and 95%, respectively.
In 2021, Ha et al. [84] investigated the characteristics of slamming loads on the bow of an FPSO in the ocean wave basin of the Korea Research Institute of Ships and Ocean Engineering (KRISO). In this experiment, a slamming impact load was generated with three heading angles (180°, 165°, and 150°) and measured using 15 force sensors attached to the bow. The 15 sensors were KISTLER 4576 force sensors with a sampling rate of 20 kHz. Moreover, the 6-DOF motions of the model were measured by a non-contact optical measurement system with a sampling rate of 200 Hz. At the time of the impact event, a high-speed camera captured the incoming waves at a frame rate of 5000 frames/s. The comprehensive configuration of the sensing technology used in this work is demonstrated in Figure 11. The results showed that the slamming impact loads can be classified as loads with one peak or two peaks, where the second peak is smaller due to the damping occurrence of the first slamming event. It was revealed that the 150° heading angle produced the most significant slamming impact loads in this work.

4. Advanced Machinery Performance Monitoring

In recent years, thousands of commercial ships have come to sail across the oceans every day. These commercial ships are operated by companies incorporated in different jurisdictions. Furthermore, these ships are built by hundreds of shipbuilding facilities and have to comply with several international, regional, and national regulations in order to fulfill the safety requirements across a worldwide network of commercial ports. One of the purposes of sailing ships is to carry passengers and goods across oceans. Moreover, the commercial shipping industry and its regulations make international trade possible, safe, and efficient.
Recently, there has been increasing interest in developing and implementing ship hull structure monitoring systems. However, ship losses are still high. The total ship loss between 2016 and 2019 is presented in Figure 12. During this period, cargo ships faced the highest loss at a total of 120 ships [85]. Furthermore, ships are extremely complex systems. Several essential components on a ship, such as the navigation system, power system, i.e., main engine, and the cargo, make this ship reliable. However, all of the very complex systems of a ship need supervision by monitoring and control systems. As can be seen in Figure 12, a total of 21 ships were lost due to machinery failure between 2016 and 2019. In this section, a review of advanced machinery performance monitoring on ships is presented. Furthermore, these technologies are expected to facilitate the maintenance, safety, and effectiveness of ship operation.
Several ship management technologies directed at enhancing the effectiveness and safety of ships have been developed and proposed by many researchers, e.g., Paik et al. [86,87], who performed research based on the employment of wireless sensor networks for full-scale in-ship application [86]. Their research examined a wireless sensor network (WSN) used to communicate in the ship environment. Two ZPAs (Zigbee Protocol Analyzers) were used as data transmission tests. The results of the wireless communication network are presented in Figure 13. As can be seen, the average delivery ratio was nearly 100% at all proposed distances. Based on the work, the wireless communication network can be used for the abnormal operation of equipment and fire prevention in dangerous regions. Paik et al. [87] also conducted follow-up research in 2009 on the characteristics of wireless sensor networks for full-scale ship application. The ship Hannara, a 3000-ton class training ship, was chosen for this study. The result showed that the characteristics of the wireless sensor network on a test bed ashore also have a successful connection.
To this day, as the number of passengers onboard commercial vessels has grown, the concern for ship safety has risen. The safety of passengers on a large ship is the priority. As such, ships have been extensively fitted with several safety systems, i.e., for fire, evacuation, stability, and flooding control. This flooding control, specifically by breach detection, has attracted researchers such as Penttilä and Ruponen [88], who presented in the 5th International Conference on Collision and Grounding of Ships (ICCGS) in Espoo, Finland. This conference is very well known in the field of impact phenomena, i.e., in ship collision and grounding. This study is expected to provide milestone processes to improve the safety of ships. In the work, various combinations of sensor density, noise, and filter length combined with an inverse method were introduced for detecting a breach. It was also noted that flood water can penetrate through non-watertight structures. They investigated a total of 2392 cases, and the results strongly indicate that the inverse method is applicable in determining a breach if the sensor arrangement is dense enough. The method could determine the floodwater origin accurately in 71.1% of the cases. The success rate of calculating the correct breach is presented in Figure 14. As seen, the average success rate of finding the primarily flooded room was 98.6%.
Other research has focused on advanced ship systems and ship sensors’ data collection for condition monitoring. Such research was conducted by Lazakis et al. [89] and Raptodimos et al. [90]. Lazakis et al. [89] investigated the Inspection Capabilities for Enhanced Ship Safety (INCASS) framework to bring an innovative solution for inspection and maintenance of ship structures and machinery. The INCASS framework consists of advanced structural risk assessment (SRA) and machinery risk assessment (MRA) tools. The results show that the INCASS framework has a reliable performance according to ship owners and operators. Furthermore, a follow-up study was presented by Raptodimos et al. [90] in the same year of 2016, where they reported that monitoring additional systems under actual operational situations would ensure safer operation and increased operational efficiency, including improved fuel efficiency and reduced emitions. Based on the implementation, sensors installed on a specific system allow for improving measurements and data collection and can be used further in analysis and assessment to enhance ship safety, maintenance, and performance and efficiency. Furthermore, research on robotic cleaning has also been increasingly discussed in maritime industries. Noordstrand [91] introduced the Fleet Cleaner robot, developed and deployed in the Netherlands. This remotely controlled robot is used for cleaning in ships, especially hull cleaning. The landmark research on the monitoring of advanced machinery performance is summarized in Table 4.
In recent years, research focused on sensors for monitoring advanced machinery performance has been conducted by Drewing et al. [92] and Kozak et al. [93]. Drewing et al. [92] investigated the diagnosis of the coking of a marine diesel engine injector nozzle by performing a spectral analysis of the crankshaft’s torsional vibrations. Laser heads clocked at 16 MHz were used for the measurements. The result showed that the data recorded from the 16-megahertz laser heads were satisfactory to determine the diesel–electric unit’s shaft vibrations. It was also noted that it is possible to diagnose coking of a ship’s diesel engine injection nozzle using spectral analysis of the shaft’s torsional vibrations, as measured by optical sensors. The location of the ETNP-10 laser heads on both ends of the shaft can be seen in Figure 15. Recent ships are regularly provided with converters that utilize semiconductor power electronics devices such as thyristors or power transistors. Semiconductor power electronics attracted research such as that of Kozak et al. [93], which aimed to detect early-stage damage. These semiconductor power electronics devices are mainly used in auxiliary podded drives and thrusters. Kozak et al. proposed a method for detecting early-stage damage of a gate turn-off thyristor using an acoustic emission sensor. The acoustic emission sensor and the thyristor packages are presented in Figure 16. The study showed that the acoustic emission sensor can detect waves from inside the semiconductor structure. Furthermore, changes in volume caused by abnormal conditions such as overheating, internal dislocations, or a decrease in wafer plate pressure can be observed. Polymer composites are sometimes implemented as hull materials in boats [94]. Due to their unique properties, a method was proposed for determining the mechanical properties of composite materials using acoustic emission and Kolmogorov–Sinai (K–S) metric entropy. It was noted that since the composite materials do not have a yield point, the proposed method shows that acoustic emission and Kolmogorov–Sinai (K–S) metric entropy can determine the transition of a material from elastic to plastic phase. In fact, knowing the mechanical properties of the material is extremely important when designing a structure.

5. Arctic-Based Field Observations

The Arctic is a polar region located at the northernmost part of Earth. The Arctic region is a unique area among Earth’s ecosystems. The cultures in the region and the Arctic indigenous peoples have adapted to its cold and extreme conditions. This region is also notably susceptible to climate change phenomena, which directly affect components of the environmental ecosystem. The impacts of climate change are seriously observed in the Arctic, and with more immediate and severe consequences than in most parts of the world. Field observations indicate that the Arctic is warming at almost twice the rate of the global average. Furthermore, reductions in sea ice and changes in weather are continuously visible. In the past decade, various measurements have been conducted—i.e., observation of carbon cycle and methane production, mapping of sea surface temperature, and measurement of ice extent.
In 2010, Hill and Zimmerman [95] performed a series of estimations of biomass and primary production (PP), which was measured by H14 C O 3 uptake during in situ incubation. Active remote sensing was deployed in the research by using spaceborne LIDAR to provide information on the distribution of particles in the water column. In 2012, Høyer et al. [96] deployed research to validate the performance of the Arctic satellite, which observes sea surface temperature. Several sensors are considered in this work, which concluded that the AVHRR (NAVO-GAC) and the AATSR produce satisfactory results with very small bias. Additionally, it was noted that the amount of synchronized data validation of the AMSR-E is very high. A follow-up observation of the high-Arctic wet tundra area was extended by Tagesson et al. [97]. In this research, methane (CH4) fluxes were observed using the in situ measurement method. A laser off-axis integrated cavity output spectroscopy analyzer was deployed to measure chamber concentration. The issue of global warming in the Arctic region was intensely studied by Lund et al. [98] as the summer-time energy exchange characteristics were spotted and found to cause high sensible heat flux (H)/net radiation (Rn) and β and low latent heat flux (LE)/net radiation (Rn). In later years, dedicated research to observe the annual balance of CO2 and CH4 fluxes in the Arctic environment was performed by Goodrich et al. [99]. Sensor performance was addressed by assessing sensor combinations on fluxes with different instrumentation at the same sites. Besides atmospheric conditions, concern regarding the Arctic sea ice extent has been addressed, as a reduction in volume is expected with increasing environmental temperature. Connolly et al. [100] re-calibrated the ice dataset using satellite sensing, as before the satellite era, geopolitical considerations were also a problem for the compilers of datasets. According to this research, the sea ice trend since the 1970s has been similar to the trend of ice growth after the mid-1940s. Other research addressed aerosol process and emission modeling, in which measurement of aerosol optical depth (AOD) is the critical process. Such research was conducted by Hesaraki et al. [101] using sun photometry and sky radiometry instrumentation. The data modeling was based on the input retrieval from the three AEROCAN sites (AEROCAN is the Canadian federated sub-network of AERONET). Later, an observation on ice melting was re-conducted, but in a more specific area. Howell et al. [102] considered the Arctic region near Canada and Greenland for their work. Sentinel and synthetic aperture radar (SAR) were deployed for melt onset detection as two collaborating instruments in the observation. One of the notable remarks of the observation was that localized sea ice dynamics will need to be considered for future melt onset algorithm development from multi-sensor γC° SAR products. The ability of the multi-sensor products to identify the ice melting phenomenon shows that these products could be utilized for lead detection studies.
At the end of the 2010s, research addressed the development and validation of low-cost sensors for Arctic-based research. Carotenuto et al. [103] provided a study to ensure the operational performance of a low-cost tool for atmospheric and meteorological observations. For verification of the proposed tool, Vaisala HMP45AC and Campbell-Scientific EC150 were taken as reference sensors. On the other hand, Pomerleau et al. [104] constructed an instrument to enhance progressive research on measuring snowpack and ice thickness. The tool adopts the concept of the frequency-modulated continuous-wave (FMCW) radar. Even though this instrument can be attached to an autonomous vehicle, an unfavorable environment outside the radar’s limits may hinder the measurement process and lead to unrealistic results, e.g., during ice and wet snow situations. Landmarks studies of sensor application in Arctic research from the early 2010s until 2020 are summarized in Table 5.
Based on the review, it can be concluded that atmospheric and hydrological systems are the primary research subjects using sensor tools/instruments in the Arctic region. At the end of the decade, a sensor was used collaboratively with an autonomous vessel. As promising results were obtained, research may be continued to provide observational and measurement sensors on vessels in the current decade. This prediction is quite realistic, as Løken et al. [105] addressed their concern regarding wave measurement of the Arctic marginal ice zone (MIZ) by using a mounted sensor on ship waves. An ultrasonic gauge (UG) was taken as the setup instrument to measure ocean surface elevation. Inertial motion units (IMUs) were deployed to measure data reliability and changes in dynamic sea motion. Notable results were processed with wave spectral models, i.e., wave attenuation measurement (WAM) and ERA5 (see Figure 17). A comparative study was also conducted to analyze wave measurement from several instruments, namely, WAM and wave-in-ice instruments (WIIs), as presented in Figure 18. The results indicate that the greatest disparity (represented by the mean percentage error) in the wave height and zero-up crossing period from the WAM and WII was below 9.7%, observed at stop 1.3 with a difference of 87.8%.
In other recent work, a mega project of data collection on the Arctic Ocean was initiated by researchers and consultants from Russia and United States. Nikishin et al. [106] addressed their focus to several subjects, e.g., seismic data, sub-bottom profiler data, geological sampling, borehole drilling, gravity, magnetic anomalies, and offshore geodetic data. Various equipment setups were prepared in terms of the seismic data, such as bolt APG air guns, control, and the ORCA or QINSy monitor navigation system; the DigiSHOT digital air gun controller; the ION DigiSTREAMER solid-filled seismic streamer; and the ION DigiSTREAMER integrated offshore seismic data acquisition system. Furthermore, preparation for a sub-bottom profiler survey was conducted, including the acquisition of additional data by multi-beam and single-beam echo sounders. In an effort to obtain a rock sample, the Arktika-2012 expedition was initiated, for which several sequence steps were taken, i.e., detecting the location of bedrock exposure, determining site parameters, and conducting video-photometric and sonar detection (see the summarized illustration in Figure 19). Acquisition of gravity and magnetic data was conducted later using two gravimeters, Chekan-AM and Shelf-E (manufactured by Elektobribor), which were mounted on two involved research vessels in the Arktika-2014 expedition. Additionally, the SeaPath 330 satellite integrated navigation system was used for offshore geodetic data collection. As backup secondary systems, С-Nav-2050R and С-Nav-3050 were also set to confirm the designated location reading.
Similarly to the discussed work, researchers from Japan and Australia performed co-research, but on a quite different subject. As presented by Kodaira et al. [107], the consortium conducted a field survey during the R/V Mirai Arctic expedition in 2019 to observe on-ice wind waves. The specific location was also designated, i.e., the western part of the Arctic Ocean. In the expedition, near-surface atmospheric and oceanographic variables were measured using the Shipboard Oceanographic and Atmospheric Radiation (SOAR) measurement system. Specifically, the air temperature and wind characteristics were recorded using an anemometer (Model 05106). To provide atmospheric data, including land and oceanic climate per hour, ERA5 (atmospheric reanalysis introduced by European Centre for Medium-Range Weather Forecasts—ECMWF) was deployed. Several buoys, namely, spotter buoys (low-cost, compact, and solar-powered buoy developed by Sofar Technologies, Inc. (San Francisco, CA, USA), were deployed in a designated location (see Figure 20) to measure the spectral distinction between the wave characteristics in the non-ice ocean and those in the sea ice-covered area. Satellite instrumentation was also considered in this work. Synthetic aperture radar (SAR) was used to provide different images of the sea ice-covered ocean, such as drifting of sea ice, and ice classification. Finally, passive microwave measurement from the satellite was performed to obtain information regarding the sea ice concentration (SIC) in the marginal ice zone (MIZ). The images from the SAR data acquisition were compared to the retrieved SIC data to quantify wave prediction uncertainties. In this step, the SIC dataset was created by JAXA using the Advanced Microwave Scanning Radiometer 2 (AMSR2).

6. Vibration-Based Damage Detection on Offshore Structures

Offshore platforms are enormous, complex structures that cover a large span of the ocean for various functions and are repeatedly endangered by harsh environmental loads. Fixed offshore platforms including jacket platforms, wind turbines (WTs), marine current turbines (CTs), etc., are the most common types, which suffer severe unforeseen damage during their service life. Therefore, permanent, continuous, and automatic monitoring of the platforms’ dynamic behavior needs to be developed to evaluate their safety and durability for a long-term operation.
Most recently developed offshore platforms are designed to be self-operating and self-producing (unmanned conditions). They have been synchronously equipped with structural health monitoring (SHM) systems to investigate their structural status and assess their functional fitness and performance levels. SHM techniques consist of either global or local damage detection. Local damage techniques, as the most used measuring techniques today, involve non-destructive testing (NDT) methods. The most frequently used NDT tests are visual, magnetic field, acoustic, eddy current, strain measurement, etc. However, detecting damage using local damage inspection is not possible when the structure is enormous and partially submerged in the water. SHM using vibration-based damage detection techniques can identify damage that affects the overall structure and examine changes in global structural vibration characteristics. Damage identification in vibration-based damage techniques is classified into four levels: (i) Level 1, determination of damage occurrence; (ii) Level 2, detection of damage location; (iii) Level 3, measurement of damage severity; and (iv) Level 4, prediction of the remaining service life of the structure.
In recent work, considerable new developments in vibration-based damage detection have emerged, particularly the application of advanced sensing technology, signal processing techniques, machine learning (ML), and artificial intelligence (AI). This chapter will review the development of vibration-based damage detection techniques in offshore platforms between 2010 and 2021, classified by various application areas, types of damage, damage tools and instruments, and damage detection strategies. The recent developments and challenges are also summarized to help researchers and practitioners to develop more reliable, practical methods for developing offshore structures in the future.
In 2010, Elshafey et al. [108] performed an in-air laboratory experimental test to detect damage occurrence and location in a four-legged scaled jacket platform using two different random loadings. Accelerometers and strain gauges were used to measure the responses. The combination of the random decrement technique and a neural network can be applied to detect damage magnitude and location. However, it is not recommended that the methodology replaces the traditional inspection method. Damage detection in another offshore structure was performed by Razi and Taheri [109] in 2014. The propagating notch of the offshore submerged pipe’s girth weld was detected using numerical simulation and experiment-based tests. An experiment using a piezoelectric sensor was conducted using impact and chirp excitations to verify the correctness of the finite element model. The approach selected empirical mode decomposition (EMD) to create energy-based damage indices (EMD_EDIs). The results confirmed that the proposed method can identify the existence and progression of the propagating notch.
In the same year, Liu et al. [110] introduced a new modal strain energy change ratio (MSEC) damage indicator for reducing the effects of damage accumulated before the first measurement in an offshore scaled structure. The method is essential because such platforms have seldom been tested for damage detection during their previous lifetime. An experiment-based dynamic test in a water tank using triaxial capacitive accelerometers was conducted to evaluate the proposed method’s efficiency. It was found that the method can accurately localize the damage between two adjacent measurements, even with spatially incomplete data. Research on damage detection based on laboratory tests considering semi-real conditions with different boundary conditions is scarce. Asgarian et al. [111] proposed an experimental test of a scaled six-legged jacket-type offshore platform in hinge-based conditions and pile-supported conditions, performed using a small and limited number of sensors to detect the damage location. The rate of signal energy (RSE) using wavelet packet transform to detect the damage location was introduced. In this work, the dynamic responses of the real offshore platform from forced vibration tests could be used as inputs. Furthermore, at present, two crucial challenges in damage detection for situ platforms are spatial incompleteness of data and noisy data measurement.
In 2016, Hosseinlou and Mojtahedi [112] developed experimental and numerical-based damage detection in a fixed offshore platform using a combination of the Cross Model Cross Mode (CMCM) method and the Pseudo Simplified (PS) model. The major problems in detecting damage in an offshore platform, such as the process being time-consuming and expensive and involving a high computational burden, are solved using this methodology. Furthermore, ocean wind turbines have attracted increasing interest due to their potential energy resources. However, several technological issues, such as damage detection, still require further development for their successful application. Opoka et al. [113] addressed crack detection and localization based on strain measurements in an offshore tripod-supported ocean wind turbine structure using experimental and numerical tests. An FBG sensor was used in the experimental test to obtain strain measurement data. The proposed approach can be applied in frames and truss structures. Such research was also performed by Mieloszyk and Ostachowicz [114]. In this work, an experimental laboratory investigation in a water basin using FBG sensors installed on the underwater level was conducted to monitor crack occurrence and location in an offshore wind turbine support structure. The structure was excited by both artificial irregular waves and wind conditions. The result verified the convenience of FBG strain sensors permanently placed on the underwater element of a wind turbine tripod.
To establish an automated methodology for crack propagation detection in operational conditions of a wind turbine in the Polish Baltic sea, Luczak et al. [115] compared the result of acceleration-based damage detection between experimental modal analysis (EMA) in dry conditions and operational modal analysis (OMA) in a towing tank with different real operational conditions. Piezoelectric tri-axial accelerometers were deployed to measure the acceleration signal. The developed method revealed consistent results with either the EMA or OMA method, and its applicability in different operational conditions. In real applications, when monitoring a jacket platform, it is necessary to consider unstable wave excitations that influence the structural response. To eliminate the influence of environmental effects, Li et al. [116] proposed combining the cross-correlation function and principal component analysis (PCA) method using both experimental and numerical tests. The result showed that the proposed method has good accuracy in different damage locations and severities under random wave excitations. However, complicated noises and operational effects still existed in the practical test. Fathi et al. [117] proposed a Bayesian approach for damage severity assessment for the first time in offshore structures. A 2D fixed offshore platform with three damage scenarios was developed, and an experimental test using uni-axial accelerometers was carried out to validate the method. The proposed method was more efficient under high-level noisy and incomplete data and more accurate than previous methods for damage detection in offshore platforms. A review of the research on vibration-based damage detection methods on offshore structures from the early 2010s until 2020 is outlined in Table 6.
The past work mainly presented lab-based vibration measurements of structures with known structural and external load parameters. However, for a long-served offshore platform, the structural stiffness degrades, and the mass and load parameters change from the original values; therefore, it will be difficult to measure the structure’s comprehensive modal parameters. Therefore, a more suitable model updating method needs to be developed to solve offshore platforms’ unknown parameters. Liu et al. [118] conducted comprehensive measurement of vibration induced by working equipment on a long-served eight-legged offshore platform (W12-1) to analyze the vibration characteristics and simulate the offshore responses. In situ measurement was carried out on the decks and columns of the platform using several cases, with 51 measured points. The layout and the in situ measurement points are shown in Figure 21. In terms of vibration signal acquisition, the data acquisition device SDY2400A was used for real-time acquisition of signals. CA-YD-108 acceleration sensors were placed at all measurement points to collect acceleration data in the site test. The 3D vibration signals from sensors were collected on the compressor and column, and only the vertical vibration signals of the points on the deck were collected. In this work, a new updating method for the finite element (FE) model was developed to determine the unknown structural parameters of offshore platforms. A comparison of the vibration displacement amplitude at the main frequency of 16.5 Hz obtained from the FEM simulation and the site measurement is shown in Figure 22. As shown, each case’s simulated values are in good agreement with the measured values, thereby indicating that the modified model is reliable and the updating method for determining unknown parameters in a complex offshore structure is reliable.
In a recent development, machine learning (ML) application for vibration-based damage detection in a wind turbine has been highlighted. Vidal et al. [119] introduced a structural damage methodology in a jacket-type offshore wind turbine using a vibration response-only case. This methodology stems from the fact that in the offshore structure, excitation cannot be imposed and is often not measurable. In this work, two different machine learning algorithms, namely, k nearest neighbor (k-NN) and quadratic kernel support vector machine (SVM), are investigated. The proposed damage detection and localization method at four different crack locations was conducted in a small-scale laboratory structure excited by a steady-state wind load. A general overview of the experimental test is illustrated in Figure 23. Firstly, Gaussian white noise was applied to simulate the wind load, given by a functional generator (GW INSTEKAF-2005 model). The signal was amplified and passed to the inertial shaker (model GW-IV47). The response was monitored by triaxial accelerometers (model 356A17, PCB Piezotronics), which were linked to a data acquisition system (cDAQ-9188 chassis and six NI-9234 modules from National Instruments). Furthermore, the raw data were pre-processed using group reshape and column scaling, and principal component analysis (PCA) was applied as a feature selection technique. After that, the two different machine learning algorithms were compared. As seen from Table 7 and Table 8, the damage detection and localization method using the quadratic SVM classifier obtained a better result than that from the k-NN algorithm, achieving a higher result with high prediction speed and a short training time. In future work, the proposed method should be explored in a more realistic environment.
Similar work to that of Vidal et al. [119] was performed by Puruncajas et al. [120], who investigated vibration response-only damage detection in a similar structure using different machine learning applications. A vibration response-only methodology using an accelerometer and a convolutional neural network (CNN) was proposed and tested on an experimental laboratory setup. A laboratory experiment test was conducted on a steel jacket-type offshore wind turbine under different damage scenarios to obtain accelerometer data; see Figure 24a. Several SHM tools and instruments were used in the experimental test. A white noise signal was generated by employing a function generator (GWINSTEK AF-2005 model), and the signal was amplified to a modal shaker (GW-IV47) that induces vibration. Eight triaxial accelerometers (PCB R Piezotronics, model 356A17), as illustrated in Figure 24b, were set and connected to six National InstrumentsTM cartridges (NI 9234 model) to gather raw data. After raw time series data were obtained, the data were pre-processed (signal-to-image conversion) with sensors to obtain a dataset of 24-channel gray-scale images. A 24-channel-input CNN was designed and trained for classification of the different structural states. The proposed SHM strategy using a deep CNN with data augmentation demonstrated outstanding performance with all considered metrics, with an overall accuracy of 99.90% (see Table 9). In future research, the proposed SHM strategy of experimental laboratory testing in a water tank needs to be validated using a more realistic environment.
Furthermore, one of the difficulties in long-term continuous monitoring of offshore platforms is the data acquisition requiring a high sampling rate and lots of computational and spatial resources. To solve this problem, the effect of sampling rate on structural damage identification in offshore structures, an FPSO soft yoke single-point mooring structure was investigated by Tang et al. [121]. This study compared the acceleration and posture sensors commonly used in offshore monitoring. In this work, random decrements and their spectrum characteristics were extracted from acceleration and displacement data under different sampling rates. The results revealed that data collected at a low sampling rate can also identify the parameter changes from structural damage.

7. Corrosion Control and Monitoring

Corrosion, one type of age-related damage experienced by most marine structures, is caused by long-term chemical and electrochemical reactions due to the harsh marine environment. Marine structures with a long-term operating life, such as a ship, offshore facility, submarine pipeline, wind turbine, etc., are vulnerable to this common type of damage. It may lead to failures of mechanical systems and thereby reduce their safety level and structural integrity. Therefore, continuous corrosion control and monitoring of marine structures are essential for ensuring their safe operation. A corrosion control and protection system can delay and mitigate corrosion initiation in marine structures and allow them to reach the expected service life. The most common corrosion control technologies used in marine structures are coating (PA), corrosion allowance (CA), and galvanic anode cathodic protection (GACP). Corrosion monitoring techniques can be divided into two major categories: offline monitoring and online monitoring. Offline monitoring measures the corrosion status within a specific time interval, while online measurement involves continuous real-time monitoring of the corrosion status of marine structures. Offline monitoring methods, including magnetic leakage and ultrasonic methods, are usually used. In contrast, electrochemical measurement, resistance probes, underwater robot probes, and imaging technology are being used in recent developments.
This section presents a comprehensive review of the development of corrosion monitoring in the marine environment over the past decade. The monitoring scopes, measurement methods and principles, and related advanced sensing technology and instruments will be highlighted. In 2010, Chen et al. [122] conducted a laboratory test to evaluate corrosion on a submerged plate using the Lamb wave-based technique and probability-based diagnostic imaging using time-of-flight (ToF). A pair of transducers were compiled at the fluid–solid interface, acting as the wave transmitter and receiver to generate Lamb wave signals. The signals were then processed with a signal digitizer (Agilent® E1438A). It was found that corrosion can be identified precisely with the support of a probability-based diagnostic imaging approach. In 2013, two sensors (Anode-Ladder-System and Corrowatch System) were developed to monitor the corrosion state in the steel rebar of coastal concrete by Xu et al. [123]. The sensor design was based on a three-electrode electrochemical test architecture, where the sensors’ performance was evaluated using a dry–wet cycle test on the upper reinforcement of the concrete block. In this work, Q235 steel bars were used as working electrodes, titanium bars were used as reference electrodes, and stainless steel bars were used as counter electrodes. The investigation revealed that corrosion sensors can efficiently monitor chloride penetration into concrete.
In the same year, Mu et al. [124] conducted laboratory-based corrosion behavior monitoring of steel structures in a marine tidal zone using electrochemical impedance spectroscopy (EIS). Comb-shaped electrodes were used for the electrochemical monitor, and a ZKW881 rapid corrosion tester was used to monitor frequency impedance. In this work, four different tidal positions representing the high tidal zone, the middle tidal zone, the central zone between the middle tidal zone and low tidal zone, and the low tidal zone were assumed. The results show that the corrosion behavior of steel in immersion and wet stages is different. The work showed that the fastest corrosion rate is attributed to the longest wet time in a tidal cycle. In 2015, lab-based experimental corrosion rate monitoring of two steel rebars in wet conditions using a TFBG corrosion sensor was performed by Islam et al. [125]. During the test, two steel rebars were immersed in a container filled with water containing NaCl. A TFBG sensor was attached to the rebar that was electrically connected to an anode DC power supply. The measurement was performed by comparing the spectral response of cladding resonances and the SRI change during the corrosion process. Corrosion monitoring in different material types using other methods was presented by Nie et al. [126]. The crevice corrosion monitoring relevance of a copper alloy marine structure based on electrochemical sensing using a boron-doped diamond electrode (BDD) was investigated. The electrochemical behavior on the BDD electrode was investigated in NaCl solution (equal to average seawater salinity). The proposed method is promising for monitoring the corrosion of copper alloys in marine environments. Ships are periodically situated in a dockyard and inspected by well-trained surveyors and class societies to assess their physical and structural performance. The expenses required for onboard inspection can be significant, so introducing new technological tools is a must.
Ortiz et al. [127], under the EU-FP7 project MINOAS in 2016, developed a micro-aerial vehicle (MAC) with different locomotion capabilities to collect images focusing on a remote area that the surveyor has difficulty accessing. A novel method for detecting coating breakdown/corrosion (CBC) on a complete ship hull was performed by classifying image pixels (color and texture information) using a three-layer feed-forward artificial neural network. The MAC comprises a flight management unit (FMU) for platform stabilization, an inertial measuring unit (IMU) as a height and distance sensor, embedded PC and control software, and a camera set. The detection method using this novel technology was reported to successfully classify images between coating breakdown and corrosion. In the following year, sensing technology using an electrochemical probe was used to monitor atmospheric corrosion by Dahai et al. [128]. Monitoring of the 60-day corrosion form in the extreme atmospheric conditions in the Zhoushan offshore environment was conducted by comparing the electrochemical noise (EN) data of two different steel plates. The EN data were analyzed by wavelet transform to identify corrosion and transform it into an energy distribution plot (EDP). It was discovered that noise resistance is well correlated with weight loss data. Furthermore, the concentration of salt as a critical indicator for diagnosing the corrosion occurrence of an offshore concrete structure was investigated by Luo et al. [129]. In this work, a 48-h experimental test for salinity detection was performed using a low-cost salinity sensor with four sensor probes multiplexed into one system. The experimental findings indicate that the proposed sensor has higher sensitivity with a lower cost compared to previous work.
Two years later, the application of artificial intelligence (AI) technology for corrosion monitoring in naval architecture and ocean engineering was investigated in depth by Yao et al. [130]. Applying deep learning to ship corrosion monitoring reduces workforce and financial resources. The corrosion of a ship hull plate was detected and monitored using a convolutional neural network (CNN) model. A total of 30,000 corrosion image datasets were trained using AlexNet as the HCDR network, and a classifier model to recognize the position and location of the corrosion was developed with an overlap-scanning sliding window algorithm. The proposed CNN model could detect various types of superficial structural damage, such as delamination, voids, and spalling and corrosion damage. In 2020, a comparison of the monitoring of long-term corrosion of carbon and stainless steel reinforcements exposed to the actual marine environment was intensely studied by Gartner et al. [131]. In the monitoring strategy, electrical resistance (ER) probes and coupled multi-electrodes (CMEs) were placed at five different exposure zones of these concrete columns for 52 months. The ER probes and CMEs were virtually connected through zero resistance ammeters (ZRAs). The ZRAs were then connected to a 16-bit analog-to-digital (A/D) converter. The observations showed that ER probes are able to detect corrosion initiation and propagation and detect localized corrosion. At the same time, CMEs can measure the spatio-temporal evolution of the corrosion process (microcell corrosion). The landmark research on sensor technology application for monitoring corrosion in the marine environment over the last decade is summarized in Table 10.
Recently, Ahuir-Torres et al. [132] conducted a benchmark autonomous detection and monitoring study of offshore wind turbines using real-time remote sensing technology. Under a project funded by Innovate UK, they invented smart wireless miniaturized sensors utilizing the Internet of Things (IoT) and integrated with satellite and terrestrial communication networks, named the iWindCr project. The arrangement plans of the iWindCr WSN system and the user interface prototype of iWindCr software are comprehensively illustrated in Figure 25 and Figure 26, respectively. To detect and monitor the progress of corrosion, two passive electrochemical sensors (open circuit potential (OCP) and zero resistance ammeter (ZRA)) are merged into the sensor interface of the iWindCr system to monitor physical and electrochemical changes remotely and quantify the electrode potential and current. In this work, the corrosion parameter output and threshold value data of the foundation, tower, and gearbox of an offshore wind turbine were collected. The database can be used as a benchmark and guideline by end-users to implement corrosion monitoring in other complex structures. The proposed benchmark study points out that the technology should be applicable in different industrial sectors, such as marine, oil and gas, automobiles, etc.
In another recent study, Ha et al. [133] investigated the monitoring of corrosion in structural members of a steel bridge truss in a real marine environment representing a severe corrosion environment due to high levels of airborne chlorides and humidity. In this case, steel plates and atmospheric corrosion monitoring (ACM) sensors were installed in different locations to measure the corrosion depth and galvanic corrosion current. The plates and sensors were installed in several places, including on the diagonal, horizontal, vertical, and portal members. In the experimental setup, the monitoring plates were placed on horizontal or diagonal truss members. The ACM sensors were placed on members with a lead-acid battery and a data logger to record the measured corrosion current data. Furthermore, a thermo-hygrometer was also used to recognize atmospheric corrosion environments during monitoring. The corrosion monitoring data were measured after 6 and 12 months of exposure to evaluate the corrosion damage and the corrosion grade. Based on the results, it seems possible to estimate corrosion using monitoring steel plates and ACM sensors. The horizontal members experienced a more extensive corrosion depth and the highest galvanic corrosion current compared to diagonal, vertical, and portal bracing members after the 12-month exposure period. These results, especially the most critical result considering the extreme corrosion rate in the horizontal members, show that maintenance is necessary to monitor the local corrosion condition of the structures.
In Maritime 4.0, onboard inspection can be extensively assisted by a robotic platform. Traditional onboard inspection using human surveyors was confirmed to be relatively expensive, time consuming, and high risk. Considering these problems, Poggi et al. [134] launched the adoption of robotics and autonomous systems (RAS)-aided inspections under the ROBINS project, funded by the Horizon 2020 EU Research and Innovation program. The aim was to fill the gap between traditional onboard assessments and the potential application of robotic technology. In general, an overview of RAS-aided inspection platforms with different capabilities involved in the ROBINS project is highlighted to assist the whole range of inspection needs (see Figure 27).
Two different aerial drones (UIB drone and FLY drone) are dedicated to flying in wide, open spaces and cluttered spaces for autonomous information obtention (image and video streaming). Different sensing devices, including 2D and 3D laser scanners, vision-based navigation, depth, and RGB-D cameras, are reported to offer an overview of RAS technologies. Moreover, the most common solution for close-up surveys is represented by the GEIR crawler, shown in Figure 27c. The crawler can run on the magnetic wheel directly with the structure to carry out thickness gauging and non-destructive testing. The main issue is the limited obstacle handling ability when inspecting some parts of a ship.
Another RAS platform developed by the ROBINS project to perform autonomous direct inspection using direct contact with the structure is the zoomorphic robot (Figure 27d). This portable and user-friendly platform is controlled by actuator–sensor interface technology, and each unit is equipped with a video camera and an ultrasonic thickness measurement tool. For measuring the RAS inspection abilities, a testing facility module for general purpose inspections onboard a bulk carrier has been developed (see Figure 28). The possibility of changing the environment characteristics (lightening, humidity, dirt, etc.) to simulate different conditions was also considered. The assessment is carried out by comparing the capabilities of general RAS–human inspection in orienteering, localization, and identification of actual defects found in coating conditions, such as pitting corrosion, corrosion, cracks, distortions, mechanical damage, etc. It was noted in the trials that RAS-aided inspection acquires more extensive quantitative data while minimizing intrinsic uncertainties of the collected data. However, the use of RAS-aided inspection results is considered as an assisting tool of the attending surveyor. It means that the final decision about the applicability of remote techniques is determined by surveyor experience.
In the same year, Abdulkader et al. [135], under the National Robotics Program funding, developed a novel autonomous metal thickness inspection robot for ship hull inspection during the dry-docking condition. The proposed climbing robot, named Sparrow, is capable of conducting multiple inspection tasks on a ship hull and navigating autonomously on the vertical metal surface. According to its description, the robot platform consists of the Sparrow bot with a thickness gauge, an app with control and a video feed, storage, and the communication unit. The HMI App screen layout is split into the upper part showing the video feed from the camera and the lower part for the locomotion control buttons and autonomous buttons. An overview of the Sparrow robotic system is illustrated in Figure 29. The hardware architecture of the Sparrow robot (see Figure 30) comprises six functional units, including a Jetson Nano kit as the central computing unit; a sensor unit comprising a VectorNav IMU, a wireless 1080 p camera, and Marvelmind beacons; a thickness measuring unit; a locomotive Unit (Arduino Mega 2560 and motors); and a communication unit comprising a Bluetooth adapter. For thickness measurement, a 38DL PLUS Ultrasonic Thickness Gauge from Olympus is attached to the center part of the robot. The gauge is controlled using a linear solenoid, which makes the gauge touch the ground and obtain the thickness measurement. A series of experimental tests, including a slippage test and a thickness measurement test under various scenarios, were conducted to validate and verify the robot’s parameters. It can be concluded from the test results that the proposed robot could successfully measure the metal plate’s thickness in all considered scenarios. Future developments should aim at improving navigation on the curved structure and applying machine learning to classify the metal surface corrosion level.

8. Impact and Shock Measurements on Critical Structures

Structures in the marine environment are subject to various loadings during their building and manufacture processes due to the harsh environment, which contributes to a number of loading forms, such as nonlinear wave patterns and crack-induced corrosion. Besides these, impact phenomena also threaten the structures. The events can be triggered in almost unlimited scenarios, i.e., dust and methane explosions in a mining site, underwater explosion, and shock due to a torpedo attack in warfare state, until collision and grounding hull interaction with obstructions. Such conditions will cause severe damage to the structures and lead to immense casualties. Considering the critical influences delivered by explosions, shocks, and collision and grounding, a series of research studies have been dedicated to quantifying structural responses and loading behavior in the form of experimental tests and trials. In these, sensors are deployed to sense and record the occurred response and behavior from both the target structure and the induced impact phenomenon.
In 2010, Liu et al. [136] conducted an experiment in coal dust using a large-scale tube as the medium for explosion set-up. The values measured by 16 pressure sensors, which were mounted on the wall of the tube (along the axial direction) in the experiment, were later recorded by a data acquisition (DAQ) system with a sampling frequency of 1 MHz. Primarily, pressure sensors were used to measure the pressure histories at different points along the tube during the explosion experiment. According to the recorded measurements, propagation of the pressure wave occurs in the range of 370–420 m/s, with the maximum overpressure of the explosion being between 50 and 72 kPa. A year later, similar work was performed, but with a different explosion medium. Methane–air mixtures (with methane purity of 99.995%) were considered another possible ignition cause in a coal mine [137]. In realizing the explosion, an explosion vessel was deployed that was mounted to a pressure sensor to record the pressure variation that occurred when the ignition grew. A camera was installed on the experiment site to observe the flame structure and fireball growth. Based on the experimental observation, it was concluded that the explosion of the mixture was divided into two stages, namely, the pressure rise stage (in this state, the released energy level from the combustion reaction is higher than the heat loss to the environment) and the pressure decline stage (the reaction energy is less than the energy loss to the environment). Besides mining sites, impact and shock phenomena in sub-zero regions, i.e., the Arctic, have also received attention. The opening of the Northern Sea Route (NSR) has led to ships from Asia passing through this region to reach the European and American continents since the mid-2000s. The motive behind this was found to be the reduced sailing time, lower fuel consumption, and lower risk of pirating activities compared to the Southern Sea Route (SSR) through the Gibraltar strait. Scholars from Finland tried to quantify ice-crushing pressure on a ship hull during interaction with ice [138]. Instead of a piezoelectric pressure sensor, the experimental research used I-Scan 210 tactile sensors, in which sensing elements were installed in 44 by 44 grids with a sample rate of 50 Hz along the ship hull (in bow shoulder, midship, aft shoulder, and aft locations for the general cargo ship; and bow, bow shoulder, midship, and aft shoulder for the ice-breaker ship). Evaluation of the test results indicated that the number of contact elements is set as the number of adjacent elements with a pressure higher than the threshold (in this case, 20 kPa). This threshold was used because at a pressure level lower than this, the obtained measurement signals would be mixed with large scattering due to the various noise sources in the experimental environment.
Related to explosion loading, structural development is also accounted for in terms of sensors and measurement. Naval vessels, which are subject to explosion risk during the war state, demand more structural safety. One study improved the naval hull with a multi-layer projective structure to withstand blast and fragment/debris loadings [139]. To measure its crashworthiness, dynamic strain gauges were placed on the outer and inner plates of the liquid cabin, while accelerometers were set on the longitudinal defensive bulkhead to record impulse acceleration during the blast ignition. The experiment results concluded that the perforations due to the fragments from the ends were mainly concentrated on a square plate (side length l = 600 mm), although the travel distance of these fragments in the air reached almost 2.5 m. Additionally, the function of the liquid cabin was noted, which was installed in the second layer of the multi-layer projective structure. This part was designed to halt high-speed fragments from causing critical damage to the inner structure. Impact loadings that possibly occur are not always in the form of high-speed contact. In the case of ship collision and hard grounding, the contact is mostly classified as low-velocity impact. A series of structural trials were conducted by Pierre et al. [140] by considering the development of ship structure by arranging sandwich beams. Two cores were deployed, namely, a corrugated type and a y-frame type, as specimens that are subjects of projectile impact in the forms of quasi-static and drop-weight loading as representatives of collision and grounding. The measurements displayed different tendencies in terms of the high initial load, which was not shown by the quasi-static test. To investigate this phenomenon, an additional test was conducted, in which the initial hypothesis stating that the measured initial peak loads during the drop-weight test are highly affected by the mass of the roller and load cell was confirmed, which is the loading applied to the target beam.
The development of the structural type subjected to low-velocity impact continued in 2016 with a study in which, instead of modifying the beam geometry, a steel–concrete–polymer (SCP) composite was used to arrange a barrier to defend the internal tank construction [141]. Considering that anisotropic material was used, material characterization was performed, including the corrosion resistance sensitivity, as the application was aimed at maritime-based vessel operation. In this stage, the test was conducted according to ASTME2661/E2661M-10, which was followed by an idealized collision resistance test using a sphere with a diameter of Ø 300 mm as the indenter. In this experiment, the deformation of the construction was recorded by displacement gauges installed at the representative location points. In 2017, Moon et al. [142] re-performed the explosion test presented by the previous scholars but in a new way, i.e., underwater conditions, which was later known as an underwater explosion (UNDEX) experiment. In this work, three underwater pressure sensors (at radius r 2 m, 4 m, and 6 m from the explosive source (TNT)) and three data acquisition (DAQ) systems were deployed to measure the generated reflected wave pressure from the wall of the water tank and pressure from bubbles. In this case, an underwater shock wave was superimposed on the hydrostatic pressure. Based on the assessment of the recorded pressure history, the shock wave at a fixed location begins with an instantaneous pressure level (it reaches the peak point), which is followed by a decline. Generally, simplified estimation is represented by an exponential function. Similar to the explosion concept, shock is considered necessary in the structural performance of ship construction. The quantification of vibration, therefore, is required to be discussed in the assessment report. The research developed in [143] is a follow-up of the pioneering works in the U.S. Navy ship DDG-53, which is deployed in ship shock trials; in this work, measured data were later processed to find other vital coefficients, i.e., total damped ship vibration. The logarithmic decay rate was used to find the coefficient by fitting the peak strain values. After that, empirical mode decomposition (EMD) was used to decompose the measured data X(t) as a function of time t into intrinsic mode functions (IMFs). In this solution, the high frequency of the IMFs represents noise modes that are to be eliminated to acquire data y ˜ (t) without noise modes. Finally, the least-squares complex exponential (LSCE) method was employed to extract modal parameters effectively.
Towards the end of the 2010s, intense underwater explosion was taken as an experimental reference. In [144], explosion was combined with the concept of material structure improvement to enhance structural performance against torpedos and mines. A polyurea coating was applied on ship hull steel to improve its underwater shock resistance, and the specimens were installed in an experimental rig. A Photron-Fastcam-SA1 high-speed camera was placed to measure the speed of the flyer plate before hitting the piston. In terms of pressure measurement, a piezoelectric pressure sensor produced by PCB Company was applied in the test rig. Later, the measured signal was acquired by a high-speed data acquisition (DAQ) instrument built by the German HBS. In the final stage, the digital imaging correlation (DIC) method was used to record the real-time displacement strain during the high-speed dynamic deformation and present the deformation process and strain field. This work offers a more complete experimental rig and setting (using piezoelectric pressure sensors), including sensors and measurement instruments, compared to the previously reviewed work in earlier years. In 2020, trials of underwater shock loading on cylindrical shells were conducted by [145]. The experimental subject in this work was very specific and quite different to that in other work, which mostly uses general plate geometry to represent thin-walled structures (except work that considers structural development). The test specimen in this work was set as a representative of the submarine pressure hull, submarine cable, torpedo, and tower structures for wind power generation. Furthermore, a different sensor type, namely, a fiber Bragg grating (FBG) sensor calibrated by a four-point bending test, was employed in this work to observe the strain of underwater structures. Other vital findings of the respective reviewed research studies are summarized in Table 11.
In 2021, research on impacts and sensors was marked by an experimental study on aluminum plates [146]. The novelty of this work is in the specimen used, which underwent pre-cracked treatment. The primary purpose of this crack was to quantify slight defects in the dynamic response and damage degree. The launchings system embedded the experimental installation to accelerate the steel flyer plate to achieve a high speed before it flew out from the launching tube and impacted a steel piston in the starting side of the underwater shock tube. In this work, the velocity of the flyer plate was measured by a laser velocity measurement instrument, the pressure of the underwater shock was recorded by a high-range dynamic pressure sensor, and deformation of the target plate was assessed by two high-speed cameras. In terms of the deflection growth due to the crack extension of the target plate, as set according to Table 12, the final bulge height and crack length of the target plate with a small initial crack size were smaller than in the plate with the larger one under the same loading. All the measurement data related to bulge height and crack length are presented in comparative bar charts in Figure 31 and Figure 32. Another result measured is dynamic velocity, and acceleration reflects the characteristic of bending stiffness of the target plates. In the same loading condition, specimen plates with a smaller crack size had a lower velocity and acceleration during the deformation process.
Another work in measurement was conducted by Mieloszyk et al. [147], who considers relatively new specimens, i.e., fiber-reinforced polymer (FRP), instead of metallic-based materials. Fiber Bragg grating (FBG) sensors (with a gauge length equal to 10 mm and without coating) were used for performing structural health monitoring (SHM), including spectra analysis and strain measurement. In order to calculate the quality of the sensors, spectra (in stages before and after embedding and loading are conducted) were determined using the Pearson correlation coefficient, as presented in Table 13. The notation set in the table is defined as follows: F—free sensor; E𝑆, E𝐹—start and final states of the embedding process on the boat, respectively; R—the finished hull of the boat; B10, B80—boat 10 h and 80 h after the sea trials, respectively. In the next experiment, strain changes (see Figure 33) were summarized based on four FBG sensors installed in the boat hull structures, which was divided into two research group stages:
  • The first group (E𝑆 and E𝐹) was defined as the state related to the construction process while the hull was still in form with a boat shape, and the part with embedded FBG sensors was manufactured.
  • The second group (R, B10ℎ, and B80ℎ) was arranged to represent a finished boat mounted in a boat trailer.
Besides measuring structural performance, recent work on ship collision was dedicated to improving a genetic algorithm (GA) to execute collision avoidance [148]. The algorithm core was designed according to international regulations for preventing collisions at sea (COLREGs)—i.e., Rule 13—Overtaking (The overtaking vessel should keep out of the way of the vessel being overtaken); Rule 14—Head-on situation (When two power-driven vessels are meeting on reciprocal or nearly reciprocal courses so as to involve risk of collision each shall alter her course to starboard so that each shall pass on the port side of the other); Rule 15—When two power-driven vessels are crossing so as to involve risk of collision, the vessel which has the other on her own starboard side shall keep out of the way and shall, if the circumstances of the case admit, avoid crossing ahead of the other vessel); Rule 16—Action by give-way vessel (Every vessel which is directed to keep out of the way of another vessel shall, so far as possible, take early and substantial action to keep well clear); and Rule 17—Action by stand-on vessel (Where one of two vessels is to keep out of the way the other shall keep her course and speed). The concept was then implemented in a multiple unmanned surface vehicles (USVs) system and sensor. In its operation, the sensor calculated the motion parameters and collision risk based on the defined variables in the system, such as USV velocity [Vm(Vmx, Vmy)], target velocity [Vn(Vnx, Vny)], relative velocity [Vr(Vrx, Vry)], target coordinate [N(xn, yn)], USV heading [βm], target heading [βn], relative heading [βr], the relative distance between the USV and target [Rm], relative orientation [γm], and the relative direction of between the USV and target [αm]. The characteristics of the improved GA compared to the conventional one are presented in Table 14, which confirm the superiority of the improved version in terms of the processing time and results in reliability. Considering the variety of vessel speeds encountered when operating the sensor, a more specific comparative study (see Figure 34, Figure 35 and Figure 36) was conducted, whose results indicated that the slower the vessel is, the longer the avoidance duration is (discrepancy of 4–8 s between the conventional and the improved versions) and the higher the survivability rate is (the improved version is upgraded by 6–15% compared to the conventional version).

9. Concluding Remarks

Reviews on several aspects of sensor-based instruments and apparatus were performed in this work, including offshore engineering, ocean state, marine structures, and polar territory. According to the comprehensive review of the mentioned areas, sensors serve as a vital tool for measuring physical phenomena and observing environmental conditions. Several essential remarks are summarized as follows:
  • In terms of logistic and shipping activities, sensors are heavily involved to ensure that the pathway and sailing route of a ship/vessel are correct and clear to avoid collision or other accidents. The frequently used tools include high-resolution satellite imagery, enhanced spatio-spectral techniques, multi-polarization synthetic aperture radar (SAR), multilayer fusion light-head detectors (MFLHDs), and multiscale Wasserstein auxiliary classifier and generative adversarial networks (MW-ACGANs). These were then varied into global navigation satellite systems (GNSSs), inertial measurement units (IMU)s, Doppler velocity log (DVL), spectral entropy (SE), and C0 complexity in early 2021.
  • The hydrodynamic characteristics of marine design and structure are critical aspects that need to be accurately estimated. A sensor-based instrument is recorded for six degrees of freedom, resistance/drag, and propulsion performance. As concluded from the review, the subject of investigation is not only conventional ships, but also vessels with special purposes, i.e., cruise ship, sailing yacht, and underwater cleaning robot. It was also noted in certain works that sensors are deployed for measuring noise in the underwater territory. This contributes to an effort to quantify the effect of noise radiation on mammals’ communication waves.
  • Regarding ship/vessel design, energy-saving characteristics have been assessed on machinery monitoring systems. Methodologies for designing sensors and measuring this phenomenon include first-principle safety analysis, hazard and operability studies (HAZOP), fault tree analysis (FTA), wireless sensor network (WSN), structural risk assessment (SRA), machinery risk assessment (MRA) tools, acoustic emission sensors, and laser heads clocked at 16 MHz. The evaluation of vibration interference in recorded motion data in the ice field territory is the interdisciplinary research of this field (hydrodynamic) and the polar science field.
  • Besides hull performance, machinery safety must also be evaluated from a sustainability point of view to either avoid loss in fuel consumption or environmental pollution. The summarized research indicates that machinery safety does not solely concern machine performance, but also concerns refraining the subject from undergoing physical damage (e.g., collision damage, hull joint failure, and unpredicted behavior of anisotropic material). Therefore, the collision avoidance concept has been necessarily developed based on the beam search algorithm (BSA), followed by the deployment of laser vibrometry and a displacement laser sensor to quantify defects on the hull joint. In the case of anisotropic materials, a study was performed on polymer composites using acoustic emission Kolmogorov–Sinai (K–S) metric entropy.
  • Exploring the Arctic territory is the most addressed concern in terms of polar science and arctic engineering using sensor-based apparatus. For the past decade, works in this field have been dominated by the dedication to observing environmental conditions (of the ocean, atmospheric, and tundra areas), primarily when climate change arises due to an excessive amount of fossil fuel consumption. In recent years, the study has extended to evaluate problems such as the ice melting phenomenon. This work has been carried out especially near Canada and Greenland. Furthermore, autonomous frequency-modulated continuous-wave (FMCW) radar has been used to measure states of snowpack and ice levels.
  • Concern regarding offshore structure risk was summarized by assessing sensors’ roles in damage detection, especially against vibration loadings. A fundamental conclusion regarding damage detection is that the sensor-based apparatus set consisting of four wired accelerometers and eight strain gauges, a hydraulic actuator, a computer (DAQ system and Labview), and a 407-controller is more reliable in estimating the damage of diagonal members based on an experiment on a scaled jacket platform. In 2021, a study of damage detection using CA-YD-108 acceleration sensors found good results from the scaled-based model and the in situ measurement.
  • Besides vibration, corroded steel and other marine structure parts are considered the origin of further catastrophic damage and loss. The demand to estimate this phenomenon has been fulfilled by a series of studies using various sensor instruments. On offshore platforms, optical fiber-based salinity sensors based on multimode plastic optical fiber (POF) have been used. In additional to commercial sensors (including image data harvesting using a camera for observation), developed ones, such as the tilted fiber Bragg grating (TFBG) concept, are being adopted to design customized sensors.
  • Impact and shock are addressed as important design parameters in any marine structure in which numerous scenarios may occur and inflict direct damage to the structure. In the studies, force pressure sensors, displacement gauges, high-speed cameras (e.g., Photron-Fastcam-SA1 series), accelerometers, and DAQ systems are the principal sensor-based tools used to measure design performance against impact and shock (widely known as crashworthy design). It is noted that the current technology is good enough to obtain reliable measurement of data of these phenomena. Nevertheless, an argument is raised regarding an area for improvement: measurement sensors are susceptible to impact and shock, which means that the accuracy of measurements can sometimes be questionable. Besides impact and shock, structure debris may also disturb the data recording. Thus, there is a challenge to design a buffer sensor that is strong enough to withstand such loadings.

Author Contributions

Conceptualization, A.R.P.; methodology, A.R.P.; software, A.R.P., T.T., and R.R.; validation, A.R.P., T.T., and R.R.; formal analysis, A.R.P., T.T., and R.R.; investigation, A.R.P., T.T., and R.R.; resources, A.R.P.; data curation, A.R.P., T.T., and R.R.; writing—original draft preparation, A.R.P., T.T., and R.R.; writing—review and editing, A.R.P., T.T., and R.R.; visualization, A.R.P., T.T., and R.R.; supervision, A.R.P.; project administration, A.R.P.; funding acquisition, A.R.P. All authors have read and agreed to the published version of the manuscript.

Funding

This work was supported by the RKAT PTNBH Universitas Sebelas Maret, Surakarta, under the scheme “Penelitian Kolaborasi Internasional UNS” (KI-UNS) 2021, with grant/contract number 260/UN27.22/HK.07.00/2021. The support is gratefully acknowledged by the authors.

Institutional Review Board Statement

Not applicable.

Informed Consent Statement

Not applicable.

Data Availability Statement

Not applicable.

Conflicts of Interest

The authors declare no conflict of interest.

References

  1. Li, X.; Nosheen, S.; Haq, N.U.; Gao, X. Value creation during fourth industrial revolution: Use of intellectual capital by most innovative companies of the world. Technol. Forecast. Soc. Chang. 2021, 163, 120479. [Google Scholar] [CrossRef]
  2. Neto, R.D.C.S.; Maia, J.S.; Neiva, S.D.S.; Scalia, M.D.; Guerra, J.B.S.O.D.A. The fourth industrial revolution and the coronavirus: A new era catalyzed by a virus. Res. Glob. 2020, 2, 100024. [Google Scholar]
  3. Cowie, P.; Townsend, L.; Salemink, K. Smart rural futures: Will rural areas be left behind in the 4th industrial revolution? J. Rural Stud. 2020, 79, 169–176. [Google Scholar] [CrossRef]
  4. Ćwiklicki, M.; Klich, J.; Chen, J. The adaptiveness of the healthcare system to the fourth industrial revolution: A preliminary analysis. Futures 2020, 122, 102602. [Google Scholar] [CrossRef]
  5. Krafft, M.; Sajtos, L.; Haenlein, M. Challenges and Opportunities for Marketing Scholars in Times of the Fourth Industrial Revolution. J. Interact. Mark. 2020, 51, 1–8. [Google Scholar] [CrossRef]
  6. Ebekozien, A.; Aigbavboa, C. COVID-19 recovery for the Nigerian construction sites: The role of the fourth industrial revolution technologies. Sustain. Cities Soc. 2021, 69, 102803. [Google Scholar] [CrossRef]
  7. Dogaru, L. The Main Goals of the Fourth Industrial Revolution. Renewable Energy Perspectives. Proc. Manuf. 2020, 46, 397–401. [Google Scholar] [CrossRef]
  8. Min, J.; Kim, Y.; Lee, S.; Jang, T.W.; Kim, I.; Song, J. The Fourth Industrial Revolution and Its Impact on Occupational Health and Safety, Worker’s Compensation and Labor Conditions. Saf. Health Work 2019, 10, 400–408. [Google Scholar] [CrossRef]
  9. Zunino, C.; Valenzano, A.; Obermaisser, R.; Petersen, S. Factory Communications at the Dawn of the Fourth Industrial Revolution. Comput. Stand. Interface 2020, 71, 103433. [Google Scholar] [CrossRef]
  10. Fitzgerald, E.; Piór, M.; Tomaszewski, A. Network lifetime maximization in wireless mesh networks for machine-to-machine communication. Ad Hoc Netw. 2019, 95, 101987. [Google Scholar] [CrossRef] [Green Version]
  11. Montori, F.; Bedogni, L.; Di Felice, M.; Bononi, L. Machine-to-machine wireless communication technologies for the Internet of Things: Taxonomy, comparison and open issues. Pervasive Mob. Comput. 2018, 50, 56–81. [Google Scholar] [CrossRef]
  12. Bruns, R.; Dunkel, J.; Masbruch, H.; Stipkovic, S. Intelligent M2M: Complex event processing for machine-to-machine communication. Expert Syst. Appl. 2015, 42, 1235–1246. [Google Scholar] [CrossRef]
  13. Xu, B.; Li, C. Influencing factors of college students’ entrepreneurial ecosystem based on the internet of things and embedded systems. Microprocess. Microsyst. 2021, 81, 103694. [Google Scholar] [CrossRef]
  14. Li, X.; Lu, Y.; Fu, X.; Qi, Y. Building the Internet of Things platform for smart maternal healthcare services with wearable devices and cloud computing. Future Gener. Comput. Syst. 2021, 118, 282–296. [Google Scholar] [CrossRef]
  15. Malik, P.K.; Sharma, R.; Singh, R.; Gehlot, A.; Satapathy, S.C.; Alnumay, W.S.; Pelusi, D.; Ghosh, U.; Nayak, J. Industrial Internet of Things and its Applications in Industry 4.0: State of The Art. Comput. Commun. 2021, 166, 125–139. [Google Scholar] [CrossRef]
  16. Trew, A. Spatial takeoff in the first industrial revolution. Rev. Econ. Dyn. 2014, 17, 707–725. [Google Scholar] [CrossRef] [Green Version]
  17. Bruland, K.; Smith, K. Assessing the role of steam power in the first industrial revolution: The early work of Nick von Tunzelmann. Res. Policy 2013, 42, 1716–1723. [Google Scholar] [CrossRef]
  18. Bottomley, S. In Patenting in England, Scotland and Ireland during the Industrial Revolution, 1700–1852. Explor. Econ. Hist. 2014, 54, 48–63. [Google Scholar] [CrossRef] [Green Version]
  19. Jones, E. Space, sound and sedition on the Royal Naval ship, 1756–1815. J. Hist. Geogr. 2020, 70, 65–73. [Google Scholar] [CrossRef]
  20. Hirschman, C.; Mogford, E. Immigration and the American industrial revolution from 1880 to 1920. Soc. Sci. Res. 2009, 38, 897–920. [Google Scholar] [CrossRef] [Green Version]
  21. Iyer, A. Moving from Industry 2.0 to Industry 4.0: A case study from India on leapfrogging in smart manufacturing. Proc. Manuf. 2018, 21, 663–670. [Google Scholar] [CrossRef]
  22. Kennedy, C. The energy embodied in the first and second industrial revolution. J. Ind. Ecol. 2020, 24, 887–898. [Google Scholar] [CrossRef]
  23. Dillistone, F.W. Britain and the Second Industrial Revolution. Theol. Today 1956, 13, 11–17. [Google Scholar] [CrossRef]
  24. Tweedale, G. Marketing in the Second Industrial Revolution: A Case Study of the Ferranti Computer Group, 1949–1963. Bus. Hist. 1992, 34, 96–127. [Google Scholar] [CrossRef]
  25. Florida, R. The new industrial revolution. Futures 1991, 23, 559–576. [Google Scholar] [CrossRef]
  26. Guerado, E. Scientific societies and the third industrial revolution—The future role of the OTC. Injury 2017, 48, S1–S4. [Google Scholar] [CrossRef]
  27. Fitzsimmons, J. Information technology and the third industrial revolution. Electron. Libr. 1994, 12, 295–297. [Google Scholar] [CrossRef]
  28. Glasnovic, Z.; Margeta, K.; Premec, K. Could Key Engine, as a new open-source for RES technology development, start the third industrial revolution? Renew. Sustain. Energy Rev. 2016, 57, 1194–1209. [Google Scholar] [CrossRef]
  29. Finkelstein, J.; Newman, D. The Third industrial revolution: A special challenge to managers. Organ. Dyn. 1984, 23, 53–65. [Google Scholar] [CrossRef]
  30. Rifkin, J. How the Third Industrial Revolution Will Create a Green Economy. New Perspect. Quat. 2016, 33, 6–10. [Google Scholar] [CrossRef]
  31. Huda, N.; Prabowo, A.R. Investigation of Optimum Ply Angle using Finite Element (FE) Approach: References for Technical Application on the Composite Navigational Buoys. Proc. Struct. Integr. 2020, 27, 140–146. [Google Scholar] [CrossRef]
  32. Ridwan, R.; Prabowo, A.R.; Muhayat, N.; Putranto, T.; Sohn, J.M. Tensile analysis and assessment of carbon and alloy steels using FE approach as an idealization of material fractures under collision and grounding. Curved Layer. Struct. 2020, 7, 188–198. [Google Scholar] [CrossRef]
  33. Prabowo, A.R.; Cao, B.; Sohn, J.M.; Bae, D.M. Crashworthiness assessment of thin-walled double bottom tanker: Influences of seabed to structural damage and damage-energy formulae for grounding damage calculations. J. Ocean Eng. Sci. 2020, 5, 387–400. [Google Scholar] [CrossRef]
  34. Ikhsan, I.; Triyono, J.; Prabowo, A.R.; Sohn, J.M. Investigation of Meshing Strategy on Mechanical Behaviour of Hip Stem Implant Design Using FEA. Open Eng. 2020, 10, 769–775. [Google Scholar] [CrossRef]
  35. Prabowo, A.R.; Bae, D.M.; Sohn, J.M.; Zakki, A.F.; Cao, B. Effects of the rebounding of a striking ship on structural crashworthiness during ship-ship collision. Thin Walled Struct. 2017, 115, 225–239. [Google Scholar] [CrossRef]
  36. Yusvika, M.; Prabowo, A.R.; Tjahjana, D.D.D.P.; Sohn, J.M. Cavitation Prediction of Ship Propeller Based on Temperature and Fluid Properties of Water. J. Mar. Sci. Eng. 2020, 8, 465. [Google Scholar] [CrossRef]
  37. Bahatmaka, A.; Kim, D.J.; Prabowo, A.R.; Zaw, M.T. Investigation on the performance of the traditional Indonesian fishing vessel. MATEC Web. Conf. 2018, 159, 02056. [Google Scholar] [CrossRef]
  38. Nubli, H.; Prabowo, A.R.; Sohn, J.M. Fire Phenomenon of Natural Gas Leak Accidents on the LNG-Fueled Ship Using Computational Fluid Dynamic. In Proceedings of the 39th International Conference on Offshore Mechanics and Arctic Engineering, Online, 3–7 August 2020; American Society of Mechanical Engineers: New York, NY, USA, 2020; Volume 84324, p. V02AT02A066. [Google Scholar]
  39. Prabowoputra, D.M.; Prabowo, A.R.; Hadi, S.; Sohn, J.M. Assessment of turbine stages and blade numbers on modified 3D Savonius hydrokinetic turbine performance using CFD analysis. Multidiscip. Model. Mater. Struct. 2021, 17, 253–272. [Google Scholar] [CrossRef]
  40. Bahatmaka, A.; Kim, D.J.; Prabowo, A.R. Numerical Investigation against Laboratory Experiment: An Overview of Damage and Wind Loads on Structural Design. Proc. Struct. Integr. 2020, 27, 6–13. [Google Scholar] [CrossRef]
  41. Schwab, K. The Fourth Industrial Revolution: What It Means, How to Respond. Available online: https://www.weforum.org/agenda/2016/01/the-fourth-industrial-revolution-what-it-means-and-how-to-respond/ (accessed on 3 March 2021).
  42. Fotaine, E.; Orsero, P.; Ledoux, A.; Nerzic, R.; Prevosto, M.; Quiniou, V. Reliability analysis and Response Based Design of a moored FPSO in West Africa. Struct. Saf. 2013, 41, 82–96. [Google Scholar] [CrossRef]
  43. Alexandridis, G.; Kavussanos, M.G.; Kim, C.Y.; Tsouknidis, D.A.; Visvikis, I.D. A survey of shipping finance research: Setting the future research agenda. Transp. Rep. 2018, 115, 164–212. [Google Scholar] [CrossRef]
  44. Nwafor, N.A.; Walker, T.R. Rethinking marine insurance and plastic pollution: Food for thought. Resour. Conserv. Recycl. 2020, 161, 104950. [Google Scholar] [CrossRef]
  45. Prabowo, A.R.; Laksono, F.B.; Sohn, J.M. Investigation of structural performance subjected to impact loading using finite element approach: Case of ship-container collision. Curved Layer Struct. 2020, 7, 17–28. [Google Scholar] [CrossRef]
  46. Finetti, E.S.; Bonet, C.A.; Lapeñ, O.L.; Areny, R.P. Cost-effective autonomous sensor for the long-term monitoring of water electrical conductivity of crop fields. Comput. Electron. Agric. 2019, 165, 104940. [Google Scholar]
  47. Apicella, V.; Caponero, M.A.; Davino, D.; Visone, C. A magnetostrictive biased magnetic field sensor with geometrically controlled full-scale range. Sens. Actuators A: Phys. 2018, 280, 475–483. [Google Scholar] [CrossRef]
  48. Kim, S.H.; Umar, A.; Hwang, S.W. Rose-like CuO nanostructures for highly sensitive glucose chemical sensor application. Ceram. Int. 2015, 41, 9468–9475. [Google Scholar] [CrossRef]
  49. Luyckx, G.; Voet, E.; Lammens, N.; Degrieck, J. Strain Measurements of Composite Laminates with Embedded Fibre Bragg Gratings: Criticism and Opportunities for Research. Sensors 2011, 11, 384–408. [Google Scholar] [CrossRef] [Green Version]
  50. Pandey, S.K.; Kim, K.H.; Lee, S.H. Use of a Dynamic Enclosure Approach to Test the Accuracy of the NDIR Sensor: Evaluation Based on the CO2 Equilibration Pattern. Sensors 2007, 7, 3459–3471. [Google Scholar] [CrossRef]
  51. UNCTAD. Review of Maritime Transport 2017; United Nations Publication: Geneva, Switzerland, 2017. [Google Scholar]
  52. IMO. International Convention for the Safety of Life at Sea (SOLAS); IMO Publications: London, UK, 2010. [Google Scholar]
  53. Vassalos, D. Shaping Ship Safety: The Face of the Future. Mar. Technol. 1999, 36, 61–76. [Google Scholar]
  54. Nezlin, N.P.; Weisberg, S.B.; Diehl, D.W. Relative availability of satellite imagery and ship-based sampling for assessment of stormwater runoff plumes in coastal southern California. Estuar. Coast. Shelf Sci. 2007, 71, 250–258. [Google Scholar] [CrossRef]
  55. Song, P.; Qi, L.; Qian, X.; Lu, X. Detection of ships in inland river using high-resolution optical satellite imagery based on mixture of deformable part models. J. Parallel Distrib. Comput. 2019, 132, 1–7. [Google Scholar] [CrossRef]
  56. Kanjir, U.; Greidanus, H.; Oštir, K. Vessel detection and classification from spaceborne optical images: A literature survey. Remote Sens. Environ. 2018, 207, 1–26. [Google Scholar] [CrossRef] [PubMed]
  57. De Maio, A.; Orlando, D.; Pallotta, L.; Clemente, C. A Multifamily GLRT for Oil Spill Detection. IEEE. Geosci. Remote Sens. Lett. 2017, 55, 63–79. [Google Scholar] [CrossRef]
  58. Zhang, Y.; Li, Q.Z.; Zang, F.N. Ship detection for visual maritime surveillance from non-stationary platforms. Ocean Eng. 2017, 141, 53–63. [Google Scholar] [CrossRef]
  59. Liao, M.S.; Tang, J.; Wang, T.; Balz, T.; Zhang, L. Landslide monitoring with high-resolution SAR data in the Three Gorges region. Sci. China Earth Sci. 2012, 55, 590–601. [Google Scholar] [CrossRef]
  60. Liu, L.; Gao, Y.; Wang, F.; Liu, X. Real-Time Optronic Beamformer on Receive in Phased Array Radar. IEEE. Geosci. Remote Sens. Lett. 2018, 16, 387–391. [Google Scholar] [CrossRef]
  61. Zou, L.; Zhang, H.; Wang, C.; Wu, F.; Gu, F. Mw-acgan: Generating multiscale high-resolution SAR images for ship detection. Sensors 2020, 20, 6673. [Google Scholar] [CrossRef]
  62. Gunnarsson, B. Recent ship traffic and developing shipping trends on the Northern Sea Route—Policy implications for future arctic shipping. Mar. Policy 2021, 124, 104369. [Google Scholar] [CrossRef]
  63. Pan, Z.; Yang, R.; Zhang, Z. Msr2n: Multi-stage rotational region based network for arbitrary-oriented ship detection in sar images. Sensors 2020, 20, 2340. [Google Scholar] [CrossRef] [PubMed] [Green Version]
  64. Dai, W.; Mao, Y.; Yuan, R.; Liu, Y.; Pu, X.; Li, C. A novel detector based on convolution neural networks for multiscale sar ship detection in complex background. Sensors 2020, 20, 2547. [Google Scholar] [CrossRef] [PubMed]
  65. Gui, Y.; Li, X.; Xue, L. A multilayer fusion light-head detector for SAR ship detection. Sensors 2019, 19, 1124. [Google Scholar] [CrossRef] [PubMed] [Green Version]
  66. Xie, T.; Zhang, W.; Yang, L.; Wang, Q.; Huang, J.; Yuan, N. Inshore ship detection based on level set method and visual saliency for SAR images. Sensors 2018, 18, 3877. [Google Scholar] [CrossRef] [Green Version]
  67. Fukuda, G.; Hatta, D.; Guo, X.; Kubo, N. Performance evaluation of IMU and DVL integration in marine navigation. Sensors 2021, 21, 1056. [Google Scholar] [CrossRef] [PubMed]
  68. Wang, L.; Li, Y.; Wan, Z.; Yang, Z.; Wang, T.; Guan, K.; Fu, L. Use of AIS data for performance evaluation of ship traffic with speed control. Ocean Eng. 2020, 204, 107259. [Google Scholar] [CrossRef]
  69. Feng, M.; Shaw, S.-L.; Peng, G.; Fang, Z. Time efficiency assessment of ship movements in maritime ports: A case study of two ports based on AIS data. J. Transp. Geogr. 2020, 86, 102741. [Google Scholar] [CrossRef]
  70. Tzabiras, G.; Kontogiannis, K. An Integrated Method for Predicting the Hydrodynamic Resistance of Low-CB Ships. CAD Comput. Aided Des. 2010, 42, 985–1000. [Google Scholar] [CrossRef]
  71. Von Bock und Polach, R.; Ehlers, S. Heave and Pitch Motions of a Ship in Model Ice: An Experimental Study on Ship Resistance and Ice Breaking Pattern. Cold Reg. Sci. Technol. 2011, 68, 49–59. [Google Scholar] [CrossRef]
  72. Lee, M.H.; Park, Y.D.; Park, H.G.; Park, W.C.; Hong, S.; Lee, K.S.; Chun, H.H. Hydrodynamic Design of an Underwater Hull Cleaning Robot and Its Evaluation. Int. J. Nav. Archit. Ocean Eng. 2012, 4, 335–352. [Google Scholar] [CrossRef] [Green Version]
  73. Bouscasse, B.; Broglia, R.; Stern, F. Experimental Investigation of a Fast Catamaran in Head Waves. Ocean Eng. 2013, 72, 318–330. [Google Scholar] [CrossRef]
  74. Jang, J.; Choi, S.H.; Ahn, S.M.; Kim, B.; Seo, J.S. Experimental Investigation of Frictional Resistance Reduction with Air Layer on the Hull Bottom of a Ship. Int. J. Nav. Archit. Ocean Eng. 2014, 6, 363–379. [Google Scholar] [CrossRef] [Green Version]
  75. Fossati, F.; Bayati, I.; Orlandini, F.; Muggiasca, S.; Vandone, A.; Mainetti, G.; Sala, R.; Bertorello, C.; Begovic, E. A Novel Full Scale Laboratory for Yacht Engineering Research. Ocean Eng. 2015, 104, 219–237. [Google Scholar] [CrossRef] [Green Version]
  76. Rajendran, S.; Fonseca, N.; Soares, C.G. Prediction of Extreme Motions and Vertical Bending Moments on a Cruise Ship and Comparison with Experimental Data. Ocean Eng. 2016, 127, 368–386. [Google Scholar] [CrossRef]
  77. Jiao, J.; Ren, H.; Adenya, C.A.; Chen, C. Development of a Shipboard Remote Control and Telemetry Experimental System for Large-Scale Model’s Motions and Loads Measurement in Realistic Sea Waves. Sensors 2017, 17, 2485. [Google Scholar] [CrossRef] [PubMed] [Green Version]
  78. Carchen, A.; Atlar, M.; Turkmen, S.; Pazouki, K.; Murphy, A.J. Ship Performance Monitoring Dedicated to Biofouling Analysis: Development on a Small Size Research Catamaran. Appl. Ocean Res. 2019, 89, 224–236. [Google Scholar] [CrossRef]
  79. Kim, D.; Lee, S.; Lee, J. Data-Driven Prediction of Vessel Propulsion Power Using Support Vector Regression with Onboard Measurement and Ocean Data. Sensors 2020, 20, 1588. [Google Scholar] [CrossRef] [Green Version]
  80. Lin, J.F.; Zhao, D.G.; Guo, C.Y.; Su, Y.M.; Zhong, X.H. Comprehensive Test System for Ship-Model Resistance and Propulsion Performance in Actual Seas. Ocean Eng. 2020, 197, 106915. [Google Scholar] [CrossRef]
  81. Guo, C.Y.; Zhong, X.H.; Zhao, D.G.; Wang, C.; Lin, J.F.; Song, K.W. Propulsion performance of large-scale ship model in real sea environment. Ocean Eng. 2020, 210, 107440. [Google Scholar] [CrossRef]
  82. Su, Y.M.; Lin, J.F.; Zhao, D.G.; Guo, C.Y.; Guo, H. Influence of a pre-swirl stator and rudder bulb system on the propulsion performance of a large-scale ship model. Ocean Eng. 2020, 218, 108189. [Google Scholar] [CrossRef]
  83. Mei, B.; Sun, L.; Shi, G. Full-Scale Maneuvering Trials Correction and Motion Modelling Based on Actual Sea and Weather Conditions. Sensors 2020, 20, 3963. [Google Scholar] [CrossRef] [PubMed]
  84. Ha, Y.J.; Kim, K.H.; Nam, B.W.; Hong, S.Y.; Kim, H. Experimental Study for Characteristics of Slamming Loads on Bow of a Ship-Type FPSO under Breaking and Irregular Wave Conditions. Ocean Eng. 2021, 224, 108738. [Google Scholar] [CrossRef]
  85. Allianz. Safety and Shipping Review 2020; Allianz Global Corporate & Specialty: Munich, Germany, 2020. [Google Scholar]
  86. Paik, B.G.; Cho, S.R.; Park, B.J.; Lee, D.; Yun, J.H.; Bae, B.D. Employment of Wireless Sensor Networks for Full-Scale Ship Application. IFIP Int. Fed. Inf. Process. 2007, 4808, 113–122. [Google Scholar]
  87. Paik, B.G.; Cho, S.R.; Park, B.J.; Lee, D.; Bae, B.D.; Yun, J.H. Characteristics of wireless sensor network for full-scale ship application. J. Mar. Sci. Technol. 2009, 14, 115–126. [Google Scholar] [CrossRef]
  88. Penttilä, P.; Ruponen, P. Use of Level Sensors in Breach Estimation for a Damaged Ship. In Proceedings of the 5th International Conference on Collision and Grounding of Ships, Espoo, Finland, 14–16 June 2010; pp. 80–87. [Google Scholar]
  89. Lazakis, I.; Dikis, K.; Michala, A.L.; Theotokatos, G. Advanced Ship Systems Condition Monitoring for Enhanced Inspection, Maintenance and Decision Making in Ship Operations. Transp. Res. Procedia 2016, 14, 1679–1688. [Google Scholar] [CrossRef] [Green Version]
  90. Raptodimos, Y.; Lazakis, I.; Theotokatos, G.; Varelas, T.; Drikos, L. Ship sensors data collection and analysis for condition monitoring of ship structures and machinery systems. In Proceedings of the Smart Ship Technology, London, UK, 26–27 January 2016. [Google Scholar]
  91. Noordstrand, A. Experience with Robotic Underwater Hull Cleaning in Dutch Ports. In Proceedings of the 3rd Hull Performance & Insight Conference, Redworth, UK, 12–14 March 2018; pp. 4–9. [Google Scholar]
  92. Drewing, S.; Witkowski, K. Spectral Analysis of Torsional Vibrations Measured by Optical Sensors, as a Method for Diagnosing Injector Nozzle Coking in Marine Diesel Engines. Sensors 2021, 21, 775. [Google Scholar] [CrossRef] [PubMed]
  93. Kozak, M.; Bejger, A.; Tomczak, A. Identification of Gate Turn-Off Thyristor Switching Patterns Using Acoustic Emission Sensors. Sensors 2021, 21, 70. [Google Scholar] [CrossRef] [PubMed]
  94. Kyzioł, L.; Panasiuk, K.; Hajdukiewicz, G.; Dudzik, K. Acoustic emission and k-s metric entropy as methods for determining mechanical properties of composite materials. Sensors 2021, 21, 145. [Google Scholar] [CrossRef] [PubMed]
  95. Hill, V.J.; Zimmerman, R.C. Estimates of primary production by remote sensing in the Arctic Ocean: Assessment of accuracy with passive and active sensors. Deep Sea Res. I 2010, 157, 1243–1254. [Google Scholar] [CrossRef]
  96. Høyer, J.L.; Karagali, I.; Dybkjær, G.; Tonboe, R. Multi sensor validation and error characteristics of Arctic satellite sea surface temperature observations. Remote Sens. Environ. 2012, 121, 335–346. [Google Scholar] [CrossRef]
  97. Tagesson, T.; Mastepanov, M.; Mölder, M.; Tamstorf, M.P.; Eklundh, L.; Smith, B.; Sigsgaard, C.; Lund, M.; Ekberg, A.; Falik, J.M.; et al. Modelling of growing season methane fluxes in a high-Arctic wet tundra ecosystem 1997–2010 using in situ and high-resolution satellite data. Tellus B Chem. Phys. Meteorol. 2013, 65, 19722. [Google Scholar] [CrossRef] [Green Version]
  98. Lund, M.; Hansen, B.U.; Pedersen, S.H.; Stiegler, C.; Tamstorf, M.P. Characteristics of summer-time energy exchange in a high Arctic tundra heath 2000–2010. Tellus B Chem. Phys. Meteorol. 2014, 66, 21631. [Google Scholar] [CrossRef] [Green Version]
  99. Goodrich, J.P.; Oechel, W.C.; Gioli, B.; Moreaux, V.; Murphy, P.C.; Burba, G.; Zona, D. Impact of different eddy covariance sensors, site set-up, and maintenance on the annual balance of CO2 and CH4 in the harsh Arctic environment. Agric. For. Meteorol. 2016, 228–229, 239–251. [Google Scholar] [CrossRef] [Green Version]
  100. Connolly, R.; Connolly, M.; Soon, W. Re-calibration of Arctic sea ice extent datasets using Arctic surface air temperature records. Hydrol. Sci. J. 2017, 62, 1317–1340. [Google Scholar] [CrossRef]
  101. Hesaraki, S.; O’Neil, N.T.; Lesins, G.; Saha, A.; Martin, R.V.; Fioletov, V.E.; Baibakov, K.; Abboud, I. Comparisons of a Chemical Transport Model with a Four-Year (April to September) Analysis of Fine and Coarse-Mode Aerosol Optical Depth Retrievals Over the Canadian Arctic. Atmos. Ocean 2017, 55, 213–229. [Google Scholar] [CrossRef]
  102. Howell, S.E.I.; Small, D.; Rohner, C.; Mahmud, M.S.; Yackel, J.J.; Brady, M. Estimating melt onset over Arctic sea ice from time series multi-sensor Sentinel-1 and RADARSAT-2 backscatter. Remote Sens. Environ. 2019, 229, 48–59. [Google Scholar] [CrossRef]
  103. Carotenuto, F.; Brilli, L.; Gioli, B.; Gualtieri, G.; Vagnoli, C.; Mazzola, M.; Viola, A.P.; Vitale, V.; Severi, M.; Traversi, R.; et al. Long-Term Performance Assessment of Low-Cost Atmospheric Sensors in the Arctic Environment. Sensors 2020, 20, 1919. [Google Scholar] [CrossRef] [Green Version]
  104. Pomerleau, P.; Royer, A.; Langlois, A.; Cliché, P.; Courtemanche, B.; Madore, J.B.; Picard, G.; Lefebvre, É. Low Cost and Compact FMCW 24 GHz Radar Applications for Snowpack and Ice Thickness Measurements. Sensors 2020, 20, 3909. [Google Scholar] [CrossRef]
  105. Løken, T.K.; Rabault, J.; Jensen, A.; Sutherland, G.; Christensen, K.H.; Müller, M. Wave measurements from ship mounted sensors in the Arctic marginal ice zone. Cold Reg. Sci. Technol. 2021, 182, 103207. [Google Scholar] [CrossRef]
  106. Nikishin, A.M.; Petrov, E.I.; Cloetingh, S.; Korniychuk, A.V.; Morozov, A.F.; Petrov, O.V.; Poselov, V.A.; Beziazykov, A.V.; Skolotnev, S.G.; Malyshev, N.A.; et al. Arctic Ocean Mega Project: Paper 1—Data collection. Earth Sci. Rev. 2021, in press. [Google Scholar]
  107. Kodaira, T.; Waseda, T.; Nose, T.; Sato, K.; Inoue, J.; Voermans, J.; Babanin, A. Observation of on-ice wind waves under grease ice in the western Arctic Ocean. Polar Sci. 2021, in press. [Google Scholar] [CrossRef]
  108. Elshafey, A.A.; Haddara, M.R.; Marzouk, H. Damage detection in offshore structures using neural networks. Mar. Struct. 2010, 23, 131–145. [Google Scholar] [CrossRef]
  109. Razi, P.; Taheri, F. A Vibration-Based Strategy for Health Monitoring of Offshore Pipelines’ Girth-Welds. Sensors 2014, 14, 17174–17191. [Google Scholar] [CrossRef] [PubMed] [Green Version]
  110. Liu, F.; Lu, H.; Wang, W.; Yang, D. Periodic Damage Evaluation of Aging Offshore Jackets Based on Continuous Dynamic Test. J. Mar. Sci. Technol. 2014, 22, 732–738. [Google Scholar]
  111. Asgarian, B.; Aghaeidoost, V.; Shokrgozar, H.R. Damage detection of jacket type offshore platforms using rate of signal energy using wavelet packet transform. Mar. Struct. 2016, 45, 1–21. [Google Scholar] [CrossRef]
  112. Hosseinlou, F.; Mojtahedi, A. Developing a robust simplified method for structural integrity monitoring of offshore jacket-type platform using recorded dynamic responses. Appl. Ocean Res. 2016, 56, 107–118. [Google Scholar] [CrossRef]
  113. Opoka, S.; Soman, R.; Mieloszyk, M.; Ostachowicz, W. Damage detection and localization method based on a frequency spectrum change in a scaled tripod model with strain rosettes. Mar. Struct. 2016, 49, 163–179. [Google Scholar] [CrossRef]
  114. Mieloszyk, M.; Ostachowicz, W. An application of Structural Health Monitoring system based on FBG sensors to offshore wind turbine support structure model. Mar. Struct. 2017, 51, 65–86. [Google Scholar] [CrossRef]
  115. Luczak, M.M.; Telega, J.; Zagato, N.; Mucchi, E. On the damage detection of a laboratory scale model of a tripod supporting structure by vibration-based methods. Mar. Struct. 2019, 64, 146–160. [Google Scholar] [CrossRef]
  116. Li, W.; Huang, Y. A Method for Damage Detection of a Jacket Platform under Random Wave Excitations Using Cross Correlation Analysis and PCA-Based Method. Ocean Eng. 2020, 214, 107734. [Google Scholar] [CrossRef]
  117. Fathi, A.; Esfandiari, A.; Fadavie, M.; Mojtahedi, A. Damage detection in an offshore platform using incomplete noisy FRF data by a novel Bayesian model updating method. Ocean Eng. 2020, 217, 108023. [Google Scholar] [CrossRef]
  118. Liu, Y.; Lu, Z.; Yan, X.; Liu, Z.; Tang, L. Measurement and modelling of the vibration induced by working equipment on an offshore platform. Ocean Eng. 2021, 219, 108354. [Google Scholar] [CrossRef]
  119. Vidal, Y.; Aquino, G.; Pozo, F.; Gutiérrez-Arias, J.E.M. Structural Health Monitoring for Jacket-Type Offshore Wind Turbines; Experimental Proof of Concept. Sensors 2020, 20, 1835. [Google Scholar] [CrossRef] [Green Version]
  120. Puruncajas, B.; Vidal, Y.; Tutivén, C. Vibration-Response-Only Structural Health Monitoring for Offshore Wind Turbine Jacket Foundations via Convolutional Neural Networks. Sensors 2020, 20, 3429. [Google Scholar] [CrossRef]
  121. Tang, D.; Chen, J.; Wu, W.; Jin, L.; Yue, Q.; Xie, B.; Wang, S.; Feng, J. Research on sampling rate selection of sensors in offshore platform shm based on vibration. Appl. Ocean Res. 2020, 101, 102192. [Google Scholar] [CrossRef]
  122. Chen, J.; Su, Z.; Cheng, L. Identification of corrosion damage in submerged structures using fundamental anti-symmetric Lamb waves. Smart Mater. Struct. 2010, 19, 1–12. [Google Scholar] [CrossRef] [Green Version]
  123. Xu, C.; Li, Z.; Jin, W. A New Corrosion Sensor to Determine the Start and Development of Embedded Rebar Corrosion Process at Coastal Concrete. Sensors 2013, 13, 13258–13275. [Google Scholar] [CrossRef] [PubMed] [Green Version]
  124. Mu, X.; Wei, J.; Dong, J.; Ke, W. In Situ Corrosion Monitoring of Mild Steel in a Simulated Tidal Zone without Marine Fouling Attachment by Electrochemical Impedance Spectroscopy. J. Mater. Sci. Technol. 2014, 30, 1043–1050. [Google Scholar] [CrossRef]
  125. Islam, M.R.; Bagherifaez, M.; Ali, M.M.; Chai, H.K.; Lim, K.; Ahmad, H. Tilted Fiber Bragg Grating Sensors for Reinforcement Corrosion Measurement in Marine Concrete Structure. IEEE Trans. Instrum. Meas. 2015, 64, 3510–3516. [Google Scholar] [CrossRef]
  126. Nie, M.; Neodo, S.; Wharton, J.A.; Cranny, A.; Harris, N.R.; Wood, R.J.K.; Stokes, K.R. Electrochemical detection of cupric ions with boron-doped diamond electrode for marine corrosion monitoring. Electrochim. Acta 2016, 202, 345–356. [Google Scholar] [CrossRef] [Green Version]
  127. Ortiz, A.; Bonnin-Pascual, F.; Garcia-Fidalgo, E.; Company-Corcoles, J.P. Vision-Based Corrosion Detection Assisted by a Micro-Aerial Vehicle in a Vessel Inspection Application. Sensors 2016, 16, 2118. [Google Scholar] [CrossRef]
  128. Dahai, X.; Shizhe, S.; Weixian, J.; Jian, L.; Zhiming, G.; Jihui, W.; Wenbin, H. Atmospheric Corrosion Monitoring of Field-exposed Q235B and T91 Steels in Zhoushan Offshore Environment Using Electrochemical Probes. J. Wuhan Univ. Technol. Mater. Sci. Ed. 2017, 32, 1433–1440. [Google Scholar]
  129. Luo, D.; Li, P.; Yue, Y.; Ma, J.; Yang, H. In-Fiber Optic Salinity Sensing: A Potential Application for Offshore Concrete Structure Protection. Sensors 2017, 17, 962. [Google Scholar] [CrossRef] [Green Version]
  130. Yao, Y.; Yang, Y.; Wang, Y.; Zhao, X. Artificial intelligence-based hull structural plate corrosion damage detection and recognition using convolutional neural network. Appl. Ocean Res. 2019, 90, 101823. [Google Scholar] [CrossRef]
  131. Gartner, N.; Kosec, T.; Legat, A. Monitoring the Corrosion of Steel in Concrete Exposed to a Marine Environment. Materials 2020, 13, 407. [Google Scholar] [CrossRef] [Green Version]
  132. Ahuir-Torres, J.I.; Bausch, N.; Farrar, A.; Webb, S.; Simandjuntak, S.; Nash, A.; Thomas, B.; Muna, J.; Jonsson, C.; Mathew, D. Benchmarking parameters for remote electrochemical corrosion detection and monitoring of offshore wind turbine structures. Wind Energy 2019, 22, 857–876. [Google Scholar] [CrossRef] [Green Version]
  133. Ha, M.-G.; Jeon, S.H.; Jeong, Y.-S.; Mha, H.-S.; Ahn, J.-H. Corrosion Environment Monitoring of Local Structural Members of a Steel Truss Bridge under a Marine Environment. Int. J. Steel Struct. 2021, 21, 167–177. [Google Scholar] [CrossRef]
  134. Poggi, L.; Gaggero, T.; Gaiotti, M.; Ravina, E.; Rizzo, C.M. Recent Developments in Remote Inspections of Ship Structures. Int. J. Nav. Archit. Ocean Eng. 2020, 12, 881–891. [Google Scholar] [CrossRef]
  135. Abdulkader, R.E.; Veerajagadheswar, P.; Lin, N.H.; Kumaran, S.; Vishaal, S.R.; Mohan, R.E. Sparrow: A Magnetic Climbing Robot for Autonomous Thickness Measurement in Ship Hull Maintenance. J. Mar. Sci. Eng. 2020, 8, 469. [Google Scholar] [CrossRef]
  136. Liu, Q.; Bai, C.; Li, X.; Jiang, L.; Dai, W. Coal dust/air explosions in a large-scale tube. Fuel 2010, 89, 329–335. [Google Scholar] [CrossRef]
  137. Bai, C.; Gong, G.; Liu, Q.; Chen, Y.; Niu, G. The explosion overpressure field and flame propagation of methane/air and methane/coal dust/air mixtures. Saf. Sci. 2011, 49, 1349–1354. [Google Scholar] [CrossRef]
  138. Kujala, P.; Arughadhoss, S. Statistical analysis of ice crushing pressures on a ship’s hull during hull–ice interaction. Cold Reg. Sci. Technol. 2012, 70, 1–11. [Google Scholar] [CrossRef]
  139. Kong, X.S.; Wu, W.G.; Li, J.; Chen, P.; Liu, F. Experimental and numerical investigation on a multi-layer protective structure under the synergistic effect of blast and fragment loadings. Int. J. Impact Eng. 2014, 65, 146–162. [Google Scholar] [CrossRef]
  140. Pierre, L.S.; Deshpande, V.S.; Fleck, N.A. The low velocity impact response of sandwich beams with a corrugated core or a Y-frame core. Int. J. Mech. Sci. 2015, 91, 71–80. [Google Scholar] [CrossRef]
  141. Niklas, K.; Kozak, J. Experimental investigation of Steel–Concrete–Polymer composite barrier for the ship internal tank construction. Ocean Eng. 2016, 111, 449–460. [Google Scholar] [CrossRef]
  142. Moon, S.J.; Kwon, J.I.; Park, J.W.; Chung, J.H. Assessment on shock pressure acquisition from underwater explosion using uncertainty of measurement. Int. J. Nav. Archit. Ocean Eng. 2017, 9, 589–597. [Google Scholar] [CrossRef]
  143. Jun, G.; Shichun, H.; Taranukha, N.; Mingqi, L. Vibration damping of naval ships based on ship shock trials. Appl. Acoust. 2018, 133, 52–57. [Google Scholar]
  144. Li, Y.; Chen, Z.; Zhao, T.; Cao, X.; Jiang, Y.; Xiao, D.; Fang, D. An experimental study on dynamic response of polyurea coated metal plates under intense underwater impulsive loading. Int. J. Impact Eng. 2019, 133, 103361. [Google Scholar] [CrossRef]
  145. Hsu, C.Y.; Chiang, C.C.; Hsieh, T.S.; Chen, T.H.; Chen, Y.H. A study of strain measurement in cylindrical shells subjected to underwater shock loading using FBG sensors. Optik 2020, 217, 164701. [Google Scholar] [CrossRef]
  146. Jiang, X.; Zhang, W.; Li, D.; Chen, T.; Tang, Y.; Guo, Z. Experimental analysis on dynamic response of pre-cracked aluminum plate subjected to underwater explosion shock loadings. Thin Walled Struct. 2021, 159, 107256. [Google Scholar] [CrossRef]
  147. Mieloszyk, M.; Majewska, K.; Ostachowics, W. Application of embedded fibre Bragg grating sensors for structural health monitoring of complex composite structures for marine applications. Mar. Struct. 2021, 76, 102903. [Google Scholar] [CrossRef]
  148. Wang, H.; Fu, Z.; Zhou, J.; Fu, M.; Ruan, L. Cooperative collision avoidance for unmanned surface vehicles based on improved genetic algorithm. Ocean Eng. 2021, 222, 108612. [Google Scholar] [CrossRef]
Figure 2. A GeoEye-1 optical image of Cascais in Portugal [56].
Applsci 11 03954 g002
Figure 7. AIS-based time efficiency assessment framework [69].
Applsci 11 03954 g007
Figure 8. Ship layout with sensor arrangements [80].
Applsci 11 03954 g008
Figure 9. Block diagram of two test systems in actual seas [80].
Applsci 11 03954 g009
Figure 10. The measuring instruments installed onboard of Yukun [83].
Applsci 11 03954 g010
Figure 11. TENG tilt sensor experimental apparatus [84].
Applsci 11 03954 g011
Figure 12. Total ship loss in 2016–2019. (a) Total loss by type of vessel and (b) all causes of loss (redrawn based on data in Allianz [85]).
Applsci 11 03954 g012
Figure 13. Result of the wireless communication tests for the long corridor in the shelter deck. (a) Average delivery ratio and (b) average radio frequency strength (redrawn based on data in Paik et al. [86]).
Applsci 11 03954 g013
Figure 14. The success rate of calculating the correct breach. (a) All doors closed and (b) fireproof doors open (redrawn based on data in Penttilä and Ruponen [88]).
Applsci 11 03954 g014
Figure 15. ETNP-10 laser heads installed on both ends of the shaft: (a) view from the engine side; (b) view from the generator side [92].
Applsci 11 03954 g015
Figure 16. (a) The acoustic emission sensor and (b) the model of the thyristors in plastic (left), stud-mount (middle), and press-pack packaging (right) [93].
Applsci 11 03954 g016
Figure 17. Comparison of the measurement data from WAM-4 (a,b) and ERA5 (c,d): the wave height (HS) and periods (Tm-01 and Tm-02) (based on data in [105]).
Applsci 11 03954 g017
Figure 18. Measurements of the bow and WII: (a) wave height and (b) crossing period (based on data in [105]).
Applsci 11 03954 g018
Figure 19. The technical process of rock sampling in Arctic expeditions [106].
Applsci 11 03954 g019
Figure 20. Positions of the deployed “spotter” buoys to measure wave characteristics [107].
Applsci 11 03954 g020
Figure 25. Arrangement plan of the iWindCr WSN system [132].
Applsci 11 03954 g025
Figure 26. The user interface of iWindCr software [132].
Applsci 11 03954 g026
Figure 27. RAS platforms: (a) UIB drone, (b) FLY drone, (c) GEIR crawler, and (d) zoomorphic robot [134].
Applsci 11 03954 g027
Figure 28. The construction module of a testing facility [134].
Applsci 11 03954 g028
Figure 29. An overview of Sparrow, a robotic system [135].
Applsci 11 03954 g029
Figure 30. The hardware architecture of Sparrow, an autonomous robot [135].
Applsci 11 03954 g030
Figure 31. Measurement results of a specimen after an explosion: final crack length [146].
Applsci 11 03954 g031
Figure 32. Recorded results of an explosion test: peak pressure value (left side) and final bulge height (right side) [146].
Applsci 11 03954 g032
Figure 33. Measured strain changes by FBG sensors according to the defined research stages [147].
Applsci 11 03954 g033
Figure 34. Comparison of the avoidance durations between two GA types [148].
Applsci 11 03954 g034
Figure 35. Recorded minimum distance from the USV to the obstacles based on GA type [148].
Applsci 11 03954 g035
Figure 36. Influences of the deployed GA types on the success rate [148].
Applsci 11 03954 g036
Figure 21. The layout and the in situ measurement points: (a) case 1; (b) cases 2–4; (c) cases 5 and 6; (d) case 7 [118].
Applsci 11 03954 g021
Figure 22. A comparison of the vibration displacement amplitude at the main frequency of 16.5 Hz [118].
Applsci 11 03954 g022
Figure 23. Overview of the experimental vibration response-only test [119].
Applsci 11 03954 g023
Figure 24. (a) An experimental setup with the damage location shown (red circle). (b) Locations of accelerometers [120].
Applsci 11 03954 g024
Table 2. Landmark research on sensor engineering applied in logistic and shipping activities.
MilestoneAuthor(s)Observational
Subject
Tools/InstrumentImportant Remarks
2007Nezlin et al. [54]Ship-based sampling for evaluation of stormwater in the ocean regionHigh-resolution satellite imageryThe study shows that Moderate-Resolution Imaging Spectroradiometer (MODIS) sensors provided better coverage than Sea-viewing Wide Field-of-view Sensor (SeaWiFS) or Advanced Very High-Resolution Radiometer (AVHRR) due to greater spectral, spatial, and particularly, temporal resolution (twice a day), thereby significantly improving information about plume dynamics.
2017De Maio et al. [57]Oil spill detection in the sea territoryMulti-polarization synthetic aperture radar (SAR) imagesThe presence of both simulated and real data in the one-sided generalized likelihood ratio test (GLRT) confirms the practical effectiveness for oil detection.
2018Kanjir et al. [56]Vessel detection in the sea territoryOptical satellite imageryThe result shows that vessel monitoring from spaceborne optical images is a thriving research topic and will have excellent operational potential in the future due to a massive number of satellite data, much of it being free and open.
2018Xie et al. [66]Inshore ship detectionSynthetic aperture radar (SAR)The result shows that inshore ships can be detected using SAR images with reasonable accuracy and integrity.
2019Gui et al. [65]Ship detection on the surface of the seaMultilayer fusion light-head detector (MFLHD)
Synthetic aperture radar (SAR)
The extensive experiments on the multilayer fusion light-head detector (MFLHD) achieved superior performance in SAR ship detection, in terms of both accuracy and speed.
2019Song et al. [55]Ship detection in the inland riverHigh-resolution optical satellite imageryThe result shows that using a mixture of multi-scale Deformable Part Models (DPMs) and a Histogram of Oriented Gradient (HOG) is effective in ship detection and performs properly in separating ships clustered together and those alongside the pier.
2020Zou et al. [61]Ship detection on the surface of the seaMultiscale Wasserstein auxiliary classifier generative adversarial network (MW-ACGAN) and the Yolo v3 network
Synthetic aperture radar (SAR)
The Multiscale Wasserstein Auxiliary Classifier Generative Adversarial Network (MW-ACGAN) can effectively generate realistic multiclass ship images.
2020Dai et al. [64]Ship detection on the surface of the seaSynthetic aperture radar (SAR)The novel detector based on convolution neural networks for multiscale SAR ship detection showed better performance compared to the method from the SAR ship detection dataset (SSDD).
Table 3. Landmark research on the sensing technology for hydrodynamic characterization in marine structures.
YearAuthorsObservational Subject and PurposeSensing Technology and InstrumentImportant Remarks
2010Tzabiras and Kontogiannis [70]Hydrodynamic resistance of three twin-screw and low-cB passenger ship models with different bulbous bowsFive resistance-type wave probesWave probe is sensitive to environmental changes, so repeated calibration is needed in each test.
2011Polach and Ehlers [71]Heave and pitch motions on the resistance in ice going tanker “Uikku”Dynamic motion unit (DMU), load cell, cameras (video recording), pointerThe oscillations and vibrations possibly interfere with resistance signal and motion measurements.
2012Lee et al. [72]Hydrodynamic design and performance of an underwater hull cleaning robot (HCR)Resistance dynamometer, electromagnetic flow meter, camera, weighing scaleThe actual drag force is larger than that obtained by CFD. This discrepancy is assumed by a different setup between CFD and the actual test.
2013Bouscasse et al. [73]Seakeeping behavior of Delft 372 fast catamaranKrypton optical system (Infrared LEDs), a finger probe and Keyence ultrasound wave probe, second wave system, HYDRONICS load cells, acquisition systemThe Kenek probe is applicable for low Fr test and wave steepness, and the ultrasound probe is more accurate for higher Fr and larger wave steepness.
2014Jang et al. [74]Frictional resistance reduction of hull bottom of 66K DWT Supramax bulk carrierFloating-plate-type friction sensors, camera, flow meterThe air layer is not fully developed on the floating plate. The air layer is split into left and right in front of the aft local friction sensor.
2015Fossati et al. [75]A full-scale test of 10-m Sailing Yacht LabStrain gauges based mono-axial HBM S9M load cells, a 3DM-GX3-35 GPS (AHRS and GPS receiver), GEMAC 23554
analog inclination sensor, gyroscope, accelerometer, magnetometer, ultrasonic 3D anemometer, TOF flying shape detection system, MEMS sensor, and pressure pads
A graphical user interface (GUI) is used to synchronize different types of signals and sampled signals.
2016Rajendran et al. [76]Vertical motions and bending moments on a cruise shipResistive wave sensors, strain gaugeStrain gauges are placed at the same height as tVCG to calculate the vertical bending moment.
2017Jiao et al. [77]A large-scale seakeeping test at realistic sea conditions of 72,000-ton class shipThe sensors of small-scale laboratory test: wave probes, strain gauges, pressure sensors, accelerometers, rotary potentiometers, and data collectors
The sensors for large-scale measurement: Ocean environment monitoring sensors, fiber optic sensor, GPS/INS system, radio control and telemetry system (self-propulsion system, autopilot system, radio communication system, telemetry system)
The proposed remote control and experimental telemetry system for large-scale measurement in actual sea waves were successfully developed.
2019Carchen et al. [78]Ship performance monitoring system on The Princess Royal vesselDGPS and gyrocompass, Doppler speed log, electro-magnetic speed log, instrumented shafts, rudder potentiometer, wave radar, wave buoy, weather station (ultrasonic anemometer), thermosalinographThe sampling frequency selection is crucial for acquiring the resolution of the phenomena.
2020Kim et al. [79]Propulsion power measurement of a 200,000-ton bulk cargo shipGPS sensor/NMEA0183, Draft sensor (Hydrostatic level pressure transmitters), RPM indicator, Echo sounder, Doppler log, anemometer, accelerometer, shaft torque sensor (strain gauge), VDRThe shaft power measurement and recorded raw information are transformed through the data acquisition unit of a voyage data recorder (VDR).
Table 4. Research landmark of the advanced machinery performance monitoring.
MilestoneAuthor(s)Observational SubjectTools/InstrumentImportant Remarks
2007Paik et al. [86]Communication based in the ship environmentWireless sensor network (WSN)
ZPAs (Zigbee Protocol Analyzers)
The wireless sensor network (WSN) can be used in the ship environment (in this case, Hannara ship), with an average delivery ratio of nearly 100% in all proposed distances in this case.
2009Paik et al. [87]Communication based in the ship environmentWireless sensor network (WSN)
ZPAs (Zigbee Protocol Analyzers)
Wireless communication that can be used regularly is desirable within a ship environment, such as for fire prevention in dangerous regions.
2010Penttilä and Ruponen [88]Breach and floodwater detection in the shipSensor density, noise, and filter length combined with an inverse methodThe result shows that the method is able to determine the floodwater origin accurately with an average success rate of 98.6% in finding the primarily flooded room.
2016Lazakis et al. [89]Ship inspection and maintenance for ship structures and machineryInspection Capabilities for Enhanced Ship Safety (INCASS)
Structural risk assessment (SRA) and machinery risk assessment tools (MRA)
It is noted that the development and implementation of the INCASS framework has a reliable performance according to ship owners and operators.
2016Raptodimos et al. [90]Ship inspection and maintenance for ship structures and machineryInspection Capabilities for Enhanced Ship Safety (INCASS)
Structural risk assessment (SRA) and machinery risk assessment tools (MRA)
Sensors installed on a specific system allow for improving measurements and data collection and can be used further in analysis and assessment to enhance ship safety, maintenance, and performance and efficiency.
2018Noordstrand [91]Remotely controlled robot for ship hull cleaningFleet Cleaner robotThe Fleet Cleaner robot is very reliable for cleaning a ship’s hull because it can be used underwater and above water at a high curvature.
2021Drewing et al. [92]Coking in marine diesel engine injector nozzleLaser heads clocked at 16 MHzCoking in a marine diesel engine injector nozzle can be diagnosed by spectral analysis of the shaft’s torsional vibrations as measured by optical sensors.
2021Kozak et al. [93]Semiconductor power electronics devices, including thyristorsAcoustic emission sensorThe method proposed for detecting early-stage damage of the gate turn-off thyristor using an acoustic emission sensor is viable and valuable to observe changes in volume caused by abnormal conditions, such as overheating, internal dislocations, or a decrease in wafer plate pressure.
2021Kyzioł et al. [94]Material properties of polymer composites in hull boatsAcoustic emission
Kolmogorov–Sinai (K–S) metric entropy
The results show that the proposed method using acoustic emission and Kolmogorov–Sinai (K–S) metric entropy can determine the mechanical properties of the transition material from the elastic to the plastic phase of polymer composites.
Table 5. Landmark research on the roles of sensors in Arctic studies and observations.
MilestoneAuthor(s)Observational SubjectTools/InstrumentImportant Remarks
2010Hill and Zimmerman [95]Annual production of global carbon cycle/primary production in the Arctic OceanActive sensors: utilizing light detection and ranging (LIDAR)Vertical data based on LIDAR needed to be merged with the horizontal surface gradients observed using ocean color sensors to extrapolate the narrow LIDAR beam across the study area.
2012Høyer et al. [96]Sea surface temperature in the Arctic OceanAdvanced Along-Tracking Scanning Radiometer (AATSR)
Advanced Very High Resolution Radiometer (AVHRR)
Advanced Microwave Scanning Radiometer-EOS (AMSR-E)
The most accurate satellite observations on the subject were obtained from IR observations using either the AVHRR (NAVO-GAC) or the AATSR. The results indicate low standard deviations.
2013Tagesson et al. [97]Methane fluxes in the high-Arctic wet tundra areaLGR,
DLT200 Fast Methane Analyzer
Moderate-resolution imaging spectroradiometer (MODIS)
Studied models performed well, but the observed models involving satellite-based normalized difference water index (NDWI) reproduced the CH4 flux variability better than the models not including NDWI.
2014Lund et al. [98]Surface energy balance of Arctic ecosystemsInfrared gas analyzer LI-6262 and 7000
3D sonic anemometer Gill
R2 and R3
Results indicated that H/Rn and LE/Rn increased, and b and G/Rn were decreased when subjected to the increasing active layer depth in the 2000–2010 period.
2016Goodrich et al. [99]CO2 and CH4 fluxes in the Arctic regionMetek uSonic-3 Class A (non-orthogonal ultrasonic-anemometer)
CSAT3 anemometer
Application of the different eddy covariance sensor combinations indicated that seasonal and annual CO2 and CH4 fluxes from the different gas analyzers and anemometers were within uncertainties.
2017Connolly et al. [100]Ice extent on the Arctic seaSatellite sensing
(Nimbus-7, DMSP-F8, DMSP-F11, DMSP-F13, and DMSP-F17)
The recent period of Arctic sea ice retreat since the 1970s followed a period of sea ice growth after the mid-1940s. After the 1910s, data reconstructions agree with previous studies that pointed to a decreasing tendency in Arctic sea ice extent.
2017Hesaraki et al. [101]Aerosol optical depth (AOD)Aerosol Robotic Network (AERONET)
GEOS-Chem (GC)
The histograms of both the AERONET retrievals and the GC estimates were better represented by a lognormal distribution. AERONET and GC simulations displayed seasonal variations, reaching peaks in April/May and August/September.
2019Howell et al. [102]Melt onset over sea ice on the Canadian Arctic and GreenlandSentinel-1
RADARSAT-2
Passive microwave (PMW) algorithm provides the best measurement of melt onset. However, SAR imagery can provide more robustness in estimating the subject, especially with the spatiotemporal constraints of C-band SAR satellites.
2020Carotenuto et al. [103]Atmospheric (temperature, humidity) sensor performance in the ArcticAIRQinoAIRQino is proven to be more economical in terms of power consumption, and it can produce reliable data compared to other high-cost reference sensors.
2020Pomerleau et al. [104]Snowpack and ice thicknessAutonomous frequency-modulated continuous-wave (FMCW) radarIce thickness measurements provide a 2-cm accuracy above a 4-cm resolution limit.
The radar can be put onboard a light remotely piloted aircraft to enable surveys on unsafe thin ice and long river transects.
Table 6. Landmark research on the roles of sensors in vibration-based damage detection on offshore structures.
AuthorsApplication and Damage ScenarioSHM Tools/InstrumentsDamage Detection
Strategy
Important Remarks
Elshafey et al. (2010)
[108]
A four-legged scaled jacket platform with four braced floors and one non-braced floor
Damage is assumed by cutting one section of the member with four damaged locations
4 wired accelerometers and eight strain gages, hydraulic actuator, computer (DAQ system and Labview), and 407-controllerIn-air damage detection (Level 2) experiment using random excitation (white noise and Pierson–Moskowitz spectra) was conducted. Sensors were used to measure free decay responses and extract them using random decrement. The free decay and its time derivative were used as inputs for a neural network for damage detection (Level 2).The success level of the method depended on the damage location. It is more sensitive to predicting damage in diagonal members than in horizontal members.
Raji and Taheri (2014)
[109]
Offshore submerged pipeline
Damage in the pipe’s girth weld against a propagating notch from 1 mm in depth to a depth of 4 mm
8 flexible piezoelectric actuator/sensors (pa16n), pneumatic hammer, piezoelectric transducers, signal generator (33210A), power amplifier (790 series)Damage detection (Level 2) of numerical simulations using ABAQUS and experimental test in the laboratory tank was compared using two excitations (impact and chirp excitation). The experimental test verified the integrity of the numerical model.The chirp excitation method was more effective than the impact excitation for damage detection in the submerged pipes.
SHM of the submerged pipe’s girth weld could be efficiently accomplished with a minimum of two transducers—one acting as a sensor and the other as an actuator—bonded on each side of the girth weld.
Liu et al. (2014)
[110]
A four-legged offshore structure with steel tubular members
Damage modeled by removing the bolt of the flanges in two locations
12 triaxial capacitive accelerometers (4803A-0002), PL64-DCB8, integrated measurement and control cooperation, data acquisition system (NI-9215)New proposed method of damage localization (Level 2) was developed to identify the damage between two adjacent measurements using modal strain energy change ratio (MSEC).
The first scenario assumes that damage is modeled, and the first measurement is conducted. Then, the damage is modeled in the two other locations, and the second lot of measurement data are collected.
The new proposed method can be used to accurately localize damage that occurs in the time interval of two adjacent measurements, even in spatially incomplete situations.
Asgarian et al. (2015)
[111]
A scaled six-legged jacket-type offshore platform in the Persian Gulf
11 damage scenarios in hinge-based condition and 7 damage scenarios in pile-supported condition
8 accelerometers (2 three-dimensional, 2 two-dimensional, and 4 one-dimensional accelerometers), eccentric mass shaker, actuator system, 4-channel TMR data loggerExperimental dynamic test was analyzed using the rate of signal energy (RSE) using wavelet packet transform to detect damage location (Level 2).
Two sets of signals from the intact and damaged conditions are required to detect damage. RSE is calculated for each node where sensors exist, and high RSE represents damage location.
Only sensors on damaged members have desirable RSE, and the other sensors have lower values of RSE. RSE has desirable values for sensors near damage location and non-significant values for other sensors.
Hosseinlou and Mojtahedi (2016)
[112]
1:100 scaled fixed jacket offshore platform (SPD9 in the Persian Gulf) with four legs constructed by ABS tubes
Damage severity (3 damage scenarios) defined as the percentage of stiffness loss of the FE model
2 light uni-axial accelerometers (4508 BandK), load cell, power amplifier (model 2706), electrodynamic exciter (type 4809) with a force sensor (AC20, APTech), PULSE software processing packageAn experimental test is performed to provide validation of the FE result. Then, the FE-based updating method is developed, and sensitivity analysis is used as the basis to validate of Pseudo Simplified (PS) model.
The cross model cross mode (CMCM) method and Pseudo Simplified (PS) model technique are proposed to detect damage severity (Level 3) in using spatially incomplete and with noise in modal data.
The proposed method can be applied for an offshore platform in service to save both time and cost.
The result indicates that the improved CMCM method with the PS model technique is capable of damage diagnosis with limited, spatially incomplete modal data.
Opoka et al. (2016)
[113]
Scaled offshore wind turbine with tripod support structure
Crack is assumed by dismantled flange located in one of the upper braces of the tripod model
8 optical three-element delta rosettes with fiber Bragg grating (FBG) sensors, impact hammer SmartScan, interrogator smart fibers for data acquisitionBoth experimental and numerical vibration tests are conducted to detect and localize damage (Level 2) using the root mean square deviation (RMSD) estimator as a damage indicator.The FBG sensors can measure strains along the grating length, and at least two sensors directed along directions are needed to increase confidence result in the specified location.
The effectiveness of localization depends on the chosen new frequency peak used in the analysis.
Mieloszyk and Ostachowicz (2017)
[114]
Offshore wind turbine with tripod support structure made of aluminum alloy (EN AW6060T66) Pipes
Crack in the circumferential direction of the brace
15 fiber Bragg grating (FBG) single-axis sensors (Micron Optic, os3120), 1 temperature compensation sensor (Micron Optics, os4100), interrogator (Micron Optic si425-500), water basin, wave generator, rotorThe damage detection (Level 2) is analyzed by an experimental laboratory test in a water basin that excites both artificial irregular waves and wind using FBG strain sensors.
Strain measurement from FGB sensor is used for the frequency domain decomposition (FDD) method to detect and localize damage using different damage indexes.
The damage is most visible on sensors from the S1 set than on the others.
Comparing strain values for every sensor to detect damage is possible for the same conditions only.
The damage index can develop an automatic calculation process and apply it for unmanned SHM.
Luczak et al. (2019)
[115]
Scaled model of a tripod-type supporting structure of an offshore wind turbine in the Polish Baltic sea made of cylindrical aluminum tubes
Five circumferential crack scenarios in the upper central joint of the tripod support structure
5 piezoelectric tri-axial accelerometers, transducer, electrodynamic shaker, hammer, Ship Design and Research left Towing Tank in Gdansk (Poland)Vibration-based damage detection (Level 1) of the tripod model is analyzed by comparing acceleration signal between experimental modal analysis (EMA) in air using a shaker as input and operational modal analysis (OMA) in a towing tank with different operational conditions simulating real-life operation.The low-frequency excitation cannot provide a suitable energy level at higher frequencies, with consequent difficulty in the post-processing of the acquired data.
The sensor should be installed below the sea surface at a considerable distance from the acquisition equipment placed on the upper part of the turbine with consequent signal amplification.
Li et al. (2020)
[116]
NB35-2 WHPB jacket oil platform
Member loss, stiffness reduction, and supporting capacity reduction in the piled foundation in various locations
Servo electric cylinder, force sensor, 18 three-directional AKE398B-08 accelerometers (capacity ±8 g), data acquisition system 500 HzDamage location and severity (Level 3) measurement using a combination of the cross-correlation function and PCA-based outlier algorithm.The accelerometers in the experimental test were installed on the deck, with the positions being consistent with the measuring points set in the numerical simulations.
Fathi et al. (2020)
[117]
A scaled 2D fixed offshore platform in Bohai sea
Damage scenarios modeled by removing the branches
15 uni-axial accelerometers, electrodynamic exciter (type 4809), force sensor (AC20, APTech), power amplifier (model 2706)Damage detection (Level 3) using a new Bayesian model updating framework is proposed with incomplete frequency response function (FRF) data.The proposed damage detection method is efficient under noisy high-level data; the accuracy decreases as the number of measured DOFs is reduced.
Table 7. A confusion matrix for the k-NN algorithm [119].
01234
0>99% <1%
1<1%98%2%
27% 93% <1%
3 75%25%
41% <1% 99%
Table 8. A confusion matrix for the SVM model [119].
01234
0>99%<1%<1%
1<1%99%<1%
2 <1%99%
3 >99%<1%
4 100%
Table 9. Comparison of accuracy, validation error, training error, and training time when using data augmentation or when using the original dataset [120].
Accuracy (%)Validation ErrorTraining ErrorTraining Time# of Images
Without data augmentation93.810.16920.116711 min6400
With data augmentation99.900.00440.00261196 min1,612,800
Table 10. Landmark research on the sensor technology applications for monitoring corrosion in various marine structures.
AuthorsObservational PlatformsTools/InstrumentsImportant Remark
Chen et al. (2010)
[122]
Quasi-circular zone chemical corrosion on the submerged aluminum plateLamb-wave-based identification (pulse-echo measurement scheme) with the assistance of probability-based diagnostic imaging techniqueRectification and compensation are required for medium coupling when applying Lamb wave-based corrosion monitoring with coupled media.
Xu et al. (2013)
[123]
Steel rebar of coastal concreteAnode–ladder system and Corrowatch SystemMonitoring test corrosion state is developed based on electrochemical polarization dynamics. The ohm-drop effect can be ignored to obtain a more accurate result.
Mu et al. (2014)
[124]
Steel structures (Q235B) in the marine tidal zoneElectrochemical
impedance spectroscopy (EIS)
Simulating the marine tidal corrosion under laboratory test is feasible, and the comb-shaped double electrode probe is suitable for in situ EIS monitoring.
Islam et al. (2015)
[125]
Steel reinforcing bar of the marine concrete structureTilted fiber Bragg grating (TFBG) sensorsHigher-order cladding resonances exhibit relatively higher sensitivity to corrosion times than the lower-order cladding resonance existing near the Bragg wavelength.
Nie et al. (2016)
[126]
Copper alloy marine structuresOxygen-terminated Boron-doped diamond (BDD) disk by Diamond Detectors Ltd.The monitoring by quantification of copper ions using the DPV technique results in an excellent linear relationship between peak current density and copper ion concentration.
Ortiz et al. (2016)
[127]
Coating breakdown/corrosion (CBC) in vessel structure (bulk carrier)Semi-autonomous micro-aerial vehicles (MACs)—INCASS aerial platform
Features:
Laser scanner Hokuyo UST-20LX, downward-looking LIDAR-Lite laser range finder, cameras and video footage, LED, Intel NUC D54250WYB embedded PC
Future enhancement steps should comprise the fusion of the laser scanner with optical flow sensors to enlarge the inspection area.
Dahai et al. (2017)
[128]
Atmospheric corrosion of T91 steel and Q235B exposed to Zhoushan offshore environmentElectrochemical noise (EN) is composed of a compact (cRIO) module, two zero resistance ammeter (ZRA) modules, a lithium-ion battery, DC power supply, and two atmospheric-corrosion-monitoring probesThe application of atmospheric probes in the offshore environment for a long time may not be suitable due to the formed rust layer.
Luo et al. (2017)
[129]
Offshore concrete structureOptical fiber-based salinity sensor based on multimode plastic optical fiber (POF) as a sensor probeMore improvements are needed to reach the industrial expectation, including replacing the multi-axis stage to realize automatic survey, making the sensor probe and light source movable, and re-designing the sensor probe to attain simultaneous calculation.
Yao et al. (2019)
[130]
Ship hull structural plateConvolutional neural network (CNN) model using image data (camera)The CNN model training requires massive image data with different categories and conditions.
Gartner et al. (2020)
[131]
Concrete columns with carbon and stainless steel reinforcements exposed to the north Adriatic coast environmentElectrical resistance (ER) probes and coupled multi-electrodes (CMEs)The infrequent sampling rate of measurement by ER and CMEs is more problematic due to the severe changing exposure conditions. Continuous monitoring with wireless data acquisition can be implemented.
Table 11. Summarized findings of the sensor-based research on measuring impact and shock.
MilestoneAuthor(s)Observational SubjectTools/InstrumentImportant Remarks
2010Liu et al. [136]Coal dust explosion in mine sitesKistler piezoelectric pressure sensor
Experimental tube
Combustion and explosion of fine particle coal dust with Ø 45–70 μm was observed faster than that of coarse particle with Ø 70–105 μm.
2011Bai et al. [137]The explosion of methane–air mixturesPressure sensor
High-speed camera
Explosion vessel
Methane/air mixture could be ignited in the vessel by 40-J electric spark when the methane concentration was approximately 5–13%.
2012Kujala and Arughadhoss [138]Steel hull–ice collisionI-Scan 210 tactile sensorsPressure measurements conducted by the tactile sensor in the deployed model scale provide realistic distributions for the ice-induced loads. The condition is concluded from a level ice environment.
2014Kong et al. [139]Naval vessel’s multi-layer protective structure under blast and fragment loadingsSensors:
Strain gauge
Accelerometer
Stiffened plates were found to be easily penetrated by fragments. It is different compared to the thick structure, to which the fragments only caused localized damage.
2015Pierre et al. [140]Sandwich beams under low-velocity impact (representation of ship collision and grounding)Phantom V12 camera
Force sensors
Post-peak responses for the drop-weight and quasi-static measurements were very similar, which indicates that the beam response is not sensitive to the material strain rate or inertial effects for impact velocity of approx. 5 m/s.
2016Niklas and Kozak [141]Steel–concrete–polymer (SCP) composite
barrier under corrosion and impact
AMSYS system
VS30-V VS75-V sensors
Displacement gauges
SCP structures were still in a tight condition until undergoing 5 times deeper penetration compared to the initial state.
2017Moon et al. [142]Ship structure subjected to the underwater explosion (UNDEX)Underwater pressure sensor W138A10
Data acquisition (DAQ) systems:
NI 9234
NI-PXIe-4497
NI PXIe-5160
Analog–digital converter (ADC) resolution may be low in the condition where the sampling rate is very high. On the other hand, even though the sampling rate is low, the effect on the measurement result will be small, with ADC resolution in a high state.
2018Jun et al. [143]Naval structure subjected to shock trialShock sensor
Least-squares complex exponential (LSCE) method
The values of α presented in the research are less than the proposed value for DDG-53, while the values of β in this work are greater than the reference. α and β are the Rayleigh coefficients.
2019Li et al. [144]Polyurea-coated metal plate subjected to underwater shock wavePiezoelectric pressure sensor
Photron-Fastcam-SA1 high-speed camera
Genesis data acquisition (DAQ) systems
Polyuria coating had a significant effect on the plastic deformation of the coated plate subjected to the applied loading in the trials. The recorded critical peak was approx. 87 MPa.
2020Hsu et al. [145]Cylindrical shell subjected to underwater shock loading (representative of marine structures)Fiber Bragg grating (FBG) sensor
Data acquisition (DAQ) systems
FBG is concluded to have excellent repeatability and linearity characteristics in recording the strain loading cycles.
To avoid sensor deformation due to spontaneous loading, the sensor design may be developed with a buffer mechanism to reduce the shock effect in measurement.
Table 12. Summarized findings of the sensor-based research on measuring impact and shock [146].
NotationPlate Thickness (mm)Loading Diameter (mm)Crack TypeCrack Length (mm)
T-60.566Single slim crack (‘−’)6
T-90.566Single slim crack (‘−’)9
T+60.566Double cross crack (‘+’)6
T+90.566Double cross crack (‘+’)9
Table 13. Calculated Pearson’s correlation coefficients [147].
StageSensors
S1S2S3S4
Auto-correlation
F0.99630.99830.99970.9787
Cross-correlation
E𝑆0.99490.99430.99040.9700
E𝐹0.95590.98540.95750.9528
R0.62190.87830.55200.2515
B10ℎ0.69500.88720.56170.2310
B80ℎ0.83410.86120.52900.2604
Table 14. Comparison of the observed parameters based on the GA types [148].
ParametersConventional GAImproved GAGap Value (%)
Numbers of iteration (-)25010060 (reduced)
Standard deviation (-)1.8760.26685.82 (reduced)
Computation time (ms)1609043.75 (reduced)
Success rate (%)809515.79 (enlarged)
Publisher’s Note: MDPI stays neutral with regard to jurisdictional claims in published maps and institutional affiliations.

