Article

Thermodynamic Performance and Creep Life Assessment Comparing Hydrogen- and Jet-Fueled Turbofan Aero Engine

1
Power Propulsion Center, School of Aerospace, Transport and Manufacturing, Cranfield University, Bedford MK43 0AL, UK
2
Research and Development, EGB Engineering, Nottingham NG25 0BB, UK
*
Author to whom correspondence should be addressed.
Appl. Sci. 2021, 11(9), 3873; https://doi.org/10.3390/app11093873
Submission received: 14 March 2021 / Revised: 12 April 2021 / Accepted: 22 April 2021 / Published: 25 April 2021
(This article belongs to the Special Issue Environmentally Friendly Gas Turbines)

Abstract

:

Featured Application

The performance, exergy and creep life assessment of hydrogen-fueled gas is applied to a turbofan aero engine.

Abstract

There is renewed interest in hydrogen as an alternative fuel for aero engines, due to their perceived environmental and performance benefits compared to jet fuel. This paper presents a cycle, thermal performance, energy and creep life assessment of hydrogen compared with jet fuel, using a turbofan aero engine. The turbofan cycle performance was simulated using a code developed by the authors that allows hydrogen and jet fuel to be selected as fuel input. The exergy assessment uses both conservations of energy and mass and the second law of thermodynamics to understand the impact of the fuels on the exergy destruction, exergy efficiency, waste factor ratio, environmental effect factor and sustainability index for a turbofan aero engine. Finally, the study looks at a top-level creep life assessment on the high-pressure turbine hot section influenced by the fuel heating values. This study shows performance (64% reduced fuel flow rate, better SFC) and more extended blade life (15% increase) benefits using liquefied hydrogen fuel, which corresponds with other literary work on the benefits of LH2 over jet fuel. This paper also highlights some drawbacks of hydrogen fuel based on previous research work, and gives recommendations for future work, aimed at maturing the hydrogen fuel concept in aviation.

1. Introduction

In recent years, liquefied hydrogen (LH2) as a fuel for gas turbines has received fresh traction both in aero and industrial applications, due to its potential benefit of allowing very clean combustion and zero-carbon emission [1]. With the growing demand for stringent environmental regulations on fossil fuel, it is predicted that hydrogen could be a viable alternative for jet fuel [2,3]. It has an extensive stability limit, global availability, reduced noise, and low maintenance cost. Hydrogen is also projected to be safer than jet fuel, since hydrogen is a lighter gas and can escape into the atmosphere without much hazardous effect [4,5]. Another justification for hydrogen is its high specific energy, which is almost 2.8 times higher than jet fuel. The high energy per unit mass reduces the total fuel weight, thereby enabling more payload or flight range than jet fuel. However, the benefit of high energy per unit mass is countered by the low density of hydrogen, requiring high storage volume, which could erode aircraft performance relative to jet fuel [6,7,8].
Despite these advantages, hydrogen still has its technical and economic demerits that must be contained, and go through various certification requirements before its full-scale application could become feasible [9]. Some of the problems with LH2 include embrittlement in metals, its high volatility due to its low boiling point (−252.87 °C), which means it can boil off in storage, and water vapor formation, or OH radicals which form a greenhouse gas. However, unlike with jet fuel, the contrail effect depends on the altitude, and the residence time of water vapor is relatively short [10,11]. LH2 also has a greater propensity to generate high NOx than jet fuel, due to its higher flame temperature at a given equivalence ratio [7,11]. Another important limitation of LH2 is cost, which includes production, transporting and storage costs [12,13]. The cost factor could be overcome with technology advancement in the use of cheaper methods and foreseeable large-scale production and supplier competition [12,14,15]. When we consider other production options for LH2, like electrolysis, which has less impact on the environment, the need to account for high energy losses from building new infrastructure and the liquefication process must be justified to make economic sense, compared with jet fuel.
Although the subject of LH2 dates as far back as 1937 [10,15], when the first aero-derivative gas turbine fueled by hydrogen was successfully run, the uptake of LH2 as a fuel has been slow for aviation and is still in its infancy, due to the many limitations mentioned in the previous paragraph. It is, therefore, vital to develop both analytical and experimental tools to assess further mitigations and designs that would enable the LH2 technology to mature for its use in aero engines.
Interestingly, there are ongoing research discussions and publications around mitigating some of the drawbacks of LH2, especially on combustor design, NOx mitigation or management, and the issue of high storage volume. Cranfield University has been at the forefront of combustor design and redesign studies for LH2 aero-engine applications within the European Union (EU) CRYOPLANE and ENABLEH2 project [4,11,15,16,17]. One of the problems with facilitating lean combustion to reduce flame temperature, thereby reducing NOx emission, is the stability limit. Since LH2 has a much greater stability limit, the primary combustion zone could be designed to realize lean combustion at all load conditions without approaching flameout. However, an imperfection in the fuel to air ratio (FAR) can create a localized fuel-rich and high-temperature flame pocket [6]. Hence, micromix combustors have been proposed to offer benefits that extend beyond NOx reduction. It has been demonstrated through a proof of concept study that micro-mixing with a cross-flow fuel injection system provides miniaturized diffusive combustion that could solve auto-ignition or flashback problems [18]. Lei and Khandelwal proposed ways in their studies to reduce the combustion temperature in the chamber to reduce NOx emission. Six cases of injection method and injector position effect were simulated to understand the combustion performance. Their result showed that the angled air inlet increased the airflow rotation, which improved the mixing intensity of hydrogen and air and reduced the chamber’s peak temperature [19]. Robinson et al. [20] performed a detailed study on the design and testing of a micromix combustor with recuperative wall cooling. The investigation uses a set of mass and equivalence ratio variations at different temperatures and pressures to carry out exhaust gas analysis on combustion efficiency and stability. Other works on combustion design and mitigation for LH2 are documented in the references [4,7,11,21,22]. Figure 1 provides the temperature characteristics of LH2 and kerosene as a function of the equivalence ratio.
The high storage volume issue is a key hurdle to overcome if LH2 will be successfully used for aero engines, as it has four times the volume compared to jet fuel. Several works reported different configurations and integration of the LH2 fuel tank in both conventional and unconventional airframes. The critical driver of fuel storage positioning is the airframe and propulsion system configuration. Mital et al. [23] and Khandelwal et al. [10] provide a detailed description of addressing storage configuration for the airframe. Figure 2 shows different LH2 aircraft with varying designs of storage.
In general, the use of liquefied hydrogen as one of the promising fuel options for aero engines is promising and feasible. The foremost consideration in the successful development and deployment of this technology is performance simulation and assessment [24]. Performance assessment is necessary to minimize the risks and costs associated with the test to analyze and evaluate the feasibility of LH2 at the various technology readiness levels (TRL). It is also important to assess LH2 compared to jet fuel and other potential fuels to see the performance benefit or advantage that LH2 provides for aero-engine applications. It appears that there are many literary publications in the public domain around LH2 combustor design and redesign. The few publications on performance comparison focus on the gas path and cycle performance using conventional or unconventional aero engines. For example, Haglind and Singh [8] conducted a study on the performance and emissions effect of changing from kerosene to hydrogen fuel on a V2500 aero engine. The study revealed the feasibility of switching from kerosene to LH2 but that it would require either redesigning the combustion chamber or using an external heat exchanger and a control system redesign. The study also showed a small performance improvement for a conventional aero engine; however, this is dependent on the fuel temperature and cycle configuration. The study also showed reduced emissions and an increase in NOx, in line with the works of Lee et al. [25], Svensson et al. [26], and Yildiz et al [27]. Exergy is another way to understand and compare the performance of LH2 [28,29,30]. Gunasekar and Manigandan [31] utilized an exergy approach to assessing LH2 and jet fuel performance, with their result showing that the introduction of LH2 reduced exergy efficiency, due to the high specific exergy of hydrogen fuel compared to jet fuel.
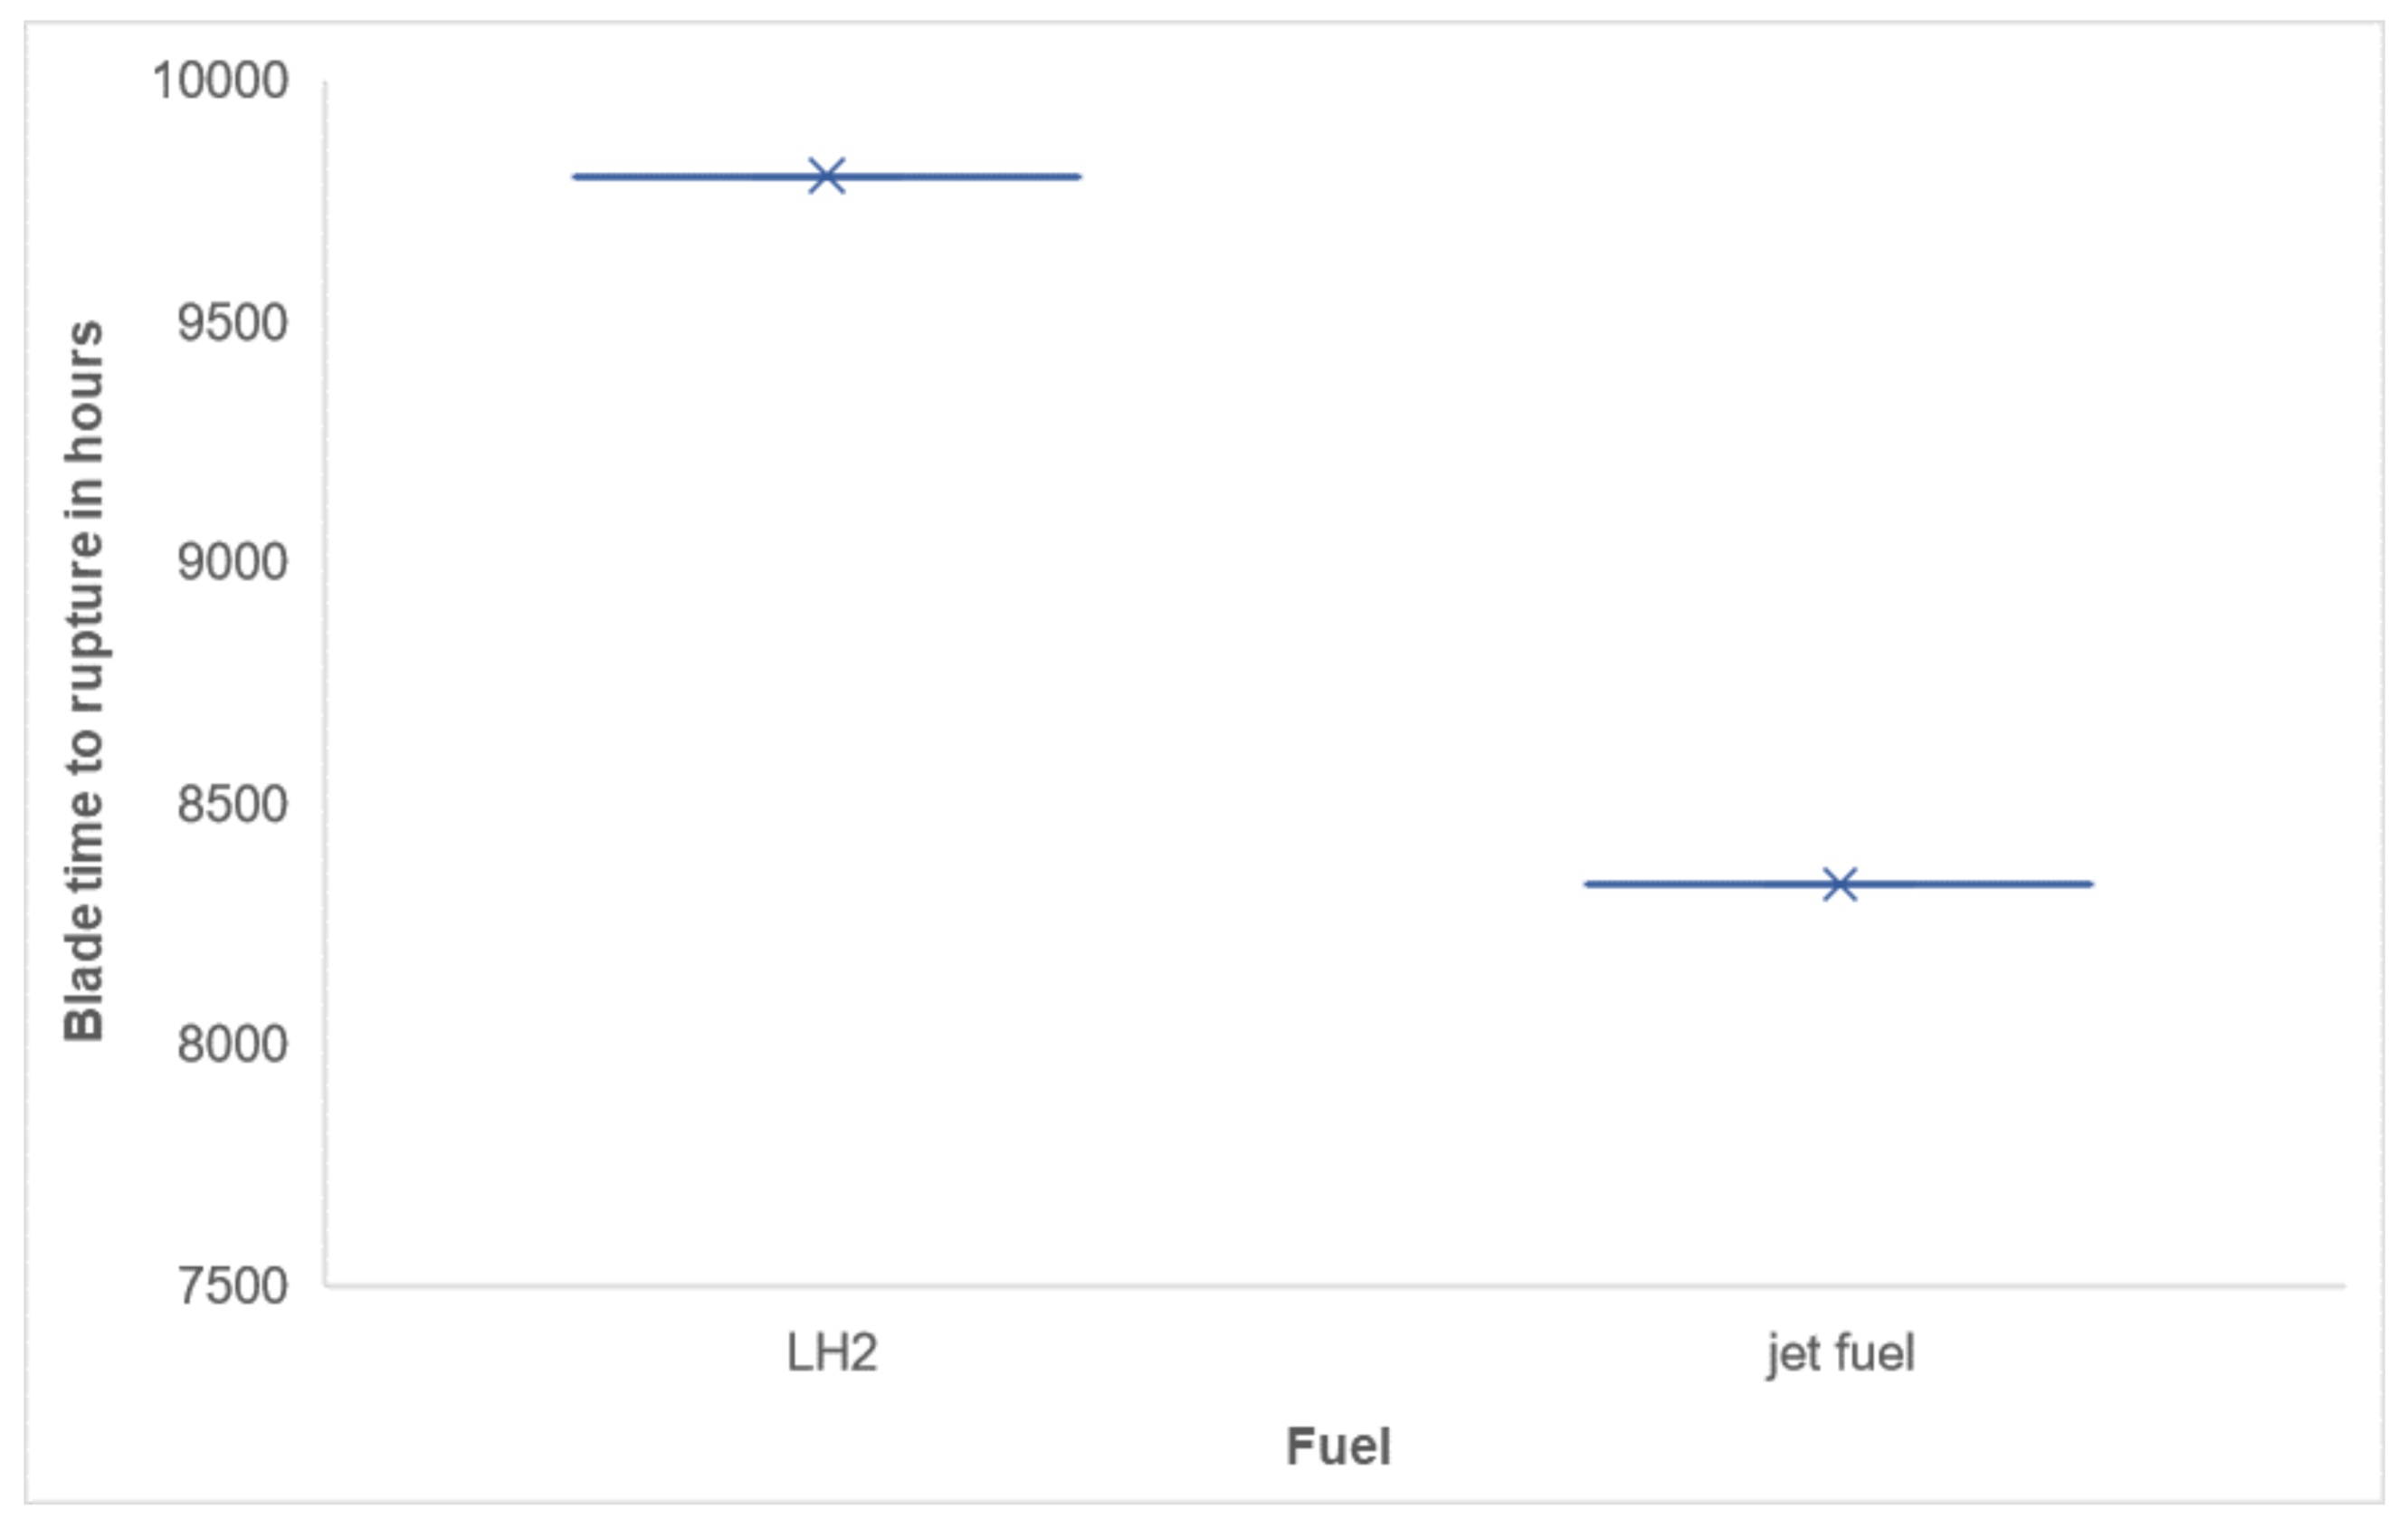
Another assessment that has not been visible is understanding the impact of LH2 utilization on aero-engine hot section blade life compared with jet fuel. Creep is one of the most common failure mechanisms that reduce component life [32,33,34]. Agbadede et al. [35] provided a comparison for hydrogen and natural gas using an industrial gas turbine. The study shows a longer life to rupture for hydrogen against natural gas, which is in accordance with the expectation documented in references [10,14,36,37,38]. However, this has not been demonstrated for an aero engine, comparing LH2 and kerosene impact on creep life assessment, which this paper aims to discuss.
To this end, this paper provides performance and creep life assessment when comparing LH2 with jet fuel in a turbofan aero engine. The benefit of this assessment is to justify the use of LH2 from both the performance and hot section component life points of view. As mentioned in the previous paragraph, there are no publications to the authors’ knowledge that compare LH2 and kerosene for turbofan aero engines that look at cycle performance, exergy, and creep life assessment, as well as highlighting the merits and drawbacks of LH2. The cycle’s performance analysis was simulated with an in-house performance modeling technique developed by the authors [39], while the exergy assessment used a thermodynamic relationship for each component. This paper provides a comprehensive evaluation of LH2 compared with jet fuel from performance, exergy, and creep life viewpoints, which has not been covered in previous work. Knowing the HPT blade failure mode resulting from the fuel usage will minimize the level of uncertainty in fuel choice for aero engines, and the average time (hours) between overhaul or refurbishment of the HPT blade can be estimated in hindsight.
This paper has hance been divided into three focal points of discussion. The overarching results align with the advantages that LH2 offers over jet fuel as discussed in other research works. This advantage is mainly associated with the high specific fuel heating value of liquid hydrogen over kerosene. Aside from performance and life assessment, other factors will drive the feasibility and technology maturity for LH2, especially with other biofuels competing favorably. The drawbacks to LH2 becoming mainstream aviation fuel have been discussed extensively in this paper. The paper also recommends future work that can be done for comprehensive exergy and creep life assessment. One of the limitations of this work is that the authors did not look at combustor performance computation analysis, which would be addressed in future work. This combustor performance assessment will give depth of insight into the operational characteristics of LH2, as this would have an impact on the chosen control and fuel metering strategy of the turbofan engine. This paper did not address emission as there has been much ongoing discussion on combustor design and emission control, which is outside the scope of this study.

2. Materials and Methods

2.1. System Description

This study uses a turbofan aero engine for the performance and creep life assessment, comparing the impacts of LH2 and jet fuel. The turbofan engine is a three-shaft configuration variant of a typical Rolls-Royce engine in terms of shaft configuration [40] but not a representation of any performance parameter. Table 1 provides a baseline description of the engine at take-off and cruise conditions. Studies have shown that keeping the same hardware for the turbo set will require modifying the combustor design to switch to hydrogen fuel for a conventional aero engine [8,38]. With this in mind, this study assumes that minimal modification on the combustor and control system has been made to demonstrate the assessment comparison effectively.
The three-shaft turbofan engine is suitable for medium and long-range aircraft, and uses an unmixed by-pass and core jet flow. The amount of thrust is determined by the amount of air and its velocity. Reasonable component efficiencies and pressure losses were implemented in the systems modeling, as shown in Table 1. Overbleed and power extractions were not considered in the assessment, to simplify the model computation at this stage of this study. However, in future work, this will be accounted for, and we will consider incorporating overbleed and power extraction in the model assessment. These assumptions were made in line with current computation and technology, as used to minimize the component losses of the aero engines.

2.2. Cycle Performance Assessment

The cycle performance predictions were carried out by a gas turbine computer code developed by the authors. The code allows users to run design and off-design conditions for both closed and open gas turbine cycles and different fuels (hydrogen, natural gas, and kerosene). A detailed description of the first version of the code has been documented by Osigwe et al. [39]. The performance calculation process utilizes component design choices to meet performance requirements, while considering systems limitations and flight conditions [41]. The total system of thermodynamics and component energy and flow equations for the turbofan aero engine are summarized in Equations (1)–(12) [41].

2.2.1. Intake

The intake diffuser increases the static pressure of the free stream fluid. Changes in the mass flow condition are primarily caused by the slowing of the air across the length of the inlet. The ambient pressure and temperature are brought to stagnation conditions by the effect of ram compression, which can be expressed as:
T o T a = [ 1 + ( γ 1 2 ) M 2 ]
P o P a = ( T o T a ) γ γ 1

2.2.2. Fan and Low-Pressure Spool

Air passes through the fan, and a substantial portion of the air, specified by the bypass ratio, is ducted to provide a significant proportion of the total thrust. The fan raises the pressure and temperature of the incoming air by the designed pressure ratio before it is ducted through a cold bypass stream. The low-pressure spool connects the fan and the turbine to achieve the required energy balance. The power consumed by the fan is given as:
FW = m C p ( T ) ˙
where:
T = T 1 ( F P R ) γ 1 γ η f
The low-pressure turbine (LPT) essentially drives the fan, absorbing the work required by the fan. Thus, the LPT work is given as:
LPTW = FW

2.2.3. Intermediate and High-Pressure Spool

Both the intermediate-pressure (IP) and high-pressure (HP) spools are a compressor and turbine connected in series by a shaft. Like the LP spool, the turbines drive the compressor in both cases; hence, the same thermodynamic relationship holds when calculating the compressor work and the turbine work described in Equations (3)–(5).
Due to the variation in volume flow rate caused by the different fuel, LH2 would affect the original matching between the compressor and turbine expander in a gas turbine originally designed to run on jet fuel. Another running point will be set where the mass flow rate and pressure ratio will restore the dynamic fluid equilibrium [36].

2.2.4. Combustor

The fuel injection and combustion take place in the combustor. The variation in the fuel caloric values affects the flow rate to the turbine section, and the energy of the fuel is simulated with a low heating value (LHV), specified as 120 MJ for hydrogen and 41.3 MJ for jet fuel. A pressure loss of 5% is assumed. Hence, the fuel–air ratio (FAR) for a specified turbine entry temperature (TET) is calculated as:
FAR = H L H V η c

2.2.5. Nozzle

The nozzles translate the air velocity in the cold stream and excess pressure in the hot stream into thrust using a convergent or divergent duct. The cold stream refers to the by-pass duct nozzle, while the hot stream nozzle is the core nozzle. The critical pressures at both streams are calculated first, before calculating the static pressure at the nozzles. If the nozzle’s pressure is less than the static air pressure, then the nozzle will expand the flow to static air pressure, and if this is greater than the static pressure, then the exit flow is choked and will be the static exit pressure. The critical pressure is given as:
P c P L P T = [ 1 ( γ 1 γ + 1 ) ] γ γ 1
For a choked and unchoked nozzle, the static temperature is given as:
T s T L P T = ( 2 γ + 1 ) c h o k e d ,   T s T L P T = ( P a P L P T ) u n c h o k e d γ 1 γ
The exit velocity for choked and unchoked conditions are given as:
V = ( γ R T ) c h o k e d ,   V = ( 2 C p ( T ) ) u n c h o k e d

2.2.6. Cycle Performance Calculations

The thrust F is given as:
F = m ( V V 0 ) + A ( P s P a ) ˙
The thrust calculation is implemented separately for the cold stream and hot stream, such that net thrust is given as:
F N = F b + F c
The specific fuel consumption (SFC) is represented as:
SFC = m ˙ f F N
The off-design cycle performance is computed with the non-dimensional representation of the component maps, which is discussed in detail by Osigwe et al. [24,39]. Table 2 and Table 3 provide the turbofan engine performance at the component/station level as used for the exergy assessment.

2.3. Exergy Assessment

Exergy is a valuable tool for understanding the energy conversion quality in an engine, and improving the efficiency of a process or system and its environmental and economic performance [42,43]. The methodology relies on the conservation of energy and a measure of irreversibility, which is proportional to the entropy increase. The turbofan engine is an internal combustion engine that uses a mixture of air and fuel to convert chemical energy to mechanical energy. Exergy assessment on the turbofan engine has been performed, based on thermodynamic parameters at each component’s inlet and exit. The laws of thermodynamics are applied to draw the fundamental equations for mass-energy conservation. The steady-state system and flow process use the mass, energy and exergy balance equations to find the heat, work and enthalpy interactions. The exergy is calculated as exergy destruction within the component, exergy efficiency, rate of exergy decrease, and irreversibility. The exergy assessment compares the impact of LH2 and jet fuel on the turbofan engine. Figure 3 shows the schematic of the turbofan engine.
The exergy assessment considered the following assumptions:
  • Engine operations under steady-state and ideal gas mixture combustion.
  • The combustion reaction is assumed to be completed.
  • The LHV of hydrogen and jet fuel were taken as 120 MJ/kg and 43.1 MJ/kg, respectively, based on the estimated chemical property and reactants of the fuels [44]
  • Component systems assumed an adiabatic process.
  • Kinetic energy and exergy changes are neglected as this is assumed to be negligible since the velocity of the air mass flow at the inlet is at a static condition with reference to the environment.
  • The ambient pressure and temperature for the exergy calculation assume a sea-level static condition of 15 °C and 101.352 kPa.
The mass, energy and exergy balance of the engine with reference to the environmental condition is shown in Figure 4. In the system shown in Figure 4, the exergy entering the system is equal to the sum of exergy leaving, exergy destroyed and exergy losses. The exergy values in this paper were obtained using Equations (13)–(18) [31,42,43,45,46]. The total specific exergy ( ε ˙ T ) of the system is the sum of the physical, chemical, kinetic and potential exergies:
ε ˙ T = m ˙ ( ε ˙ k + ε ˙ p + ε ˙ p h + ε ˙ c )
where ε ˙ k ,   ε ˙ p ,   ε ˙ p h ,   ε ˙ c represents kinetic, potential, physical and chemical exergy, respectively. The assessment assumes the potential exergy component is neglected because, as the evaluation was done under sea-level static (SLS) conditions, there is no elevation variation between the inlet and outlet engine conditions to account for potential exergy. The specific physical exergy is given as [43,46]:
ε ˙ p h = m ˙ C p [ ( T T 0 ) T 0 ln ( T T 0 ) ] + R T 0 ln ( P P 0 )
The kinetic and chemical exergy is given as [43,46]:
ε ˙ k = m   ˙ V 2 2
ε ˙ c = m   ˙ L H V ξ
where ξ is the liquid fuel-grade function given as [3,46]:
ξ = 1.0422 + 0.011925 b a 0.042 a
The system fuel flow exergy ( ε ˙ f ) is given as:
ε ˙ f = ε ˙ c + ε ˙ p h
The system exergy efficiency at sea-level conditions is given as the ratio of total exergy output to the exergy input:
η e x = ε ˙ ˙ o u t ε ˙ ˙ i n
The exergy destruction rate for the steady-state process is the difference between the total exergy output ( ε ˙ ˙ o u t ) and input ( ε ˙ ˙ i n ). Calculating the exergy at component levels have been fully described by Balli et al. [3,46] and Aydin et al. [43]. The total exergy of the turbofan is given as:
ε ˙ t = ε ˙ t h + ε ˙ d + ε ˙ l
where ε ˙ t h is the thrust exergy, ε ˙ d is the total destructive exergy, and ε ˙ l , is the total loss in exergy. The results of the exergy assessment are presented in the result and discussion section.

2.4. Creep Life Assessment

Creep is a continuous deformation of a material under constant mechanical and thermal load at elevated temperatures [32,34,47]. The top-level assessment aims to understand the impact of LH2 compared to jet fuel on the rate of creep damage to the blade. The HPT blade and nozzle guide vane (NGV) are usually exposed to very high temperatures from the combustion section. The mechanical and thermal stresses on the HPT can be estimated using the turbofan thermodynamic performance and a physics-based model. The thermal and stress calculations are then used as input for the lifting model. The value of TET for the different fuels simulated at constant thrust will have a varying impact on the turbine blade.
The HPT performance characteristics are used to estimate the sizing and blade geometry in order to obtain the thermal and stress load. Table 4 summarizes the HPT configuration and blade geometry. The assessment assumes the same HPT materials for both fuels. The thermal model estimates the blade metal temperature ( T m ), given as:
T m = T g ε ( T g T c )
where T g is the mean gas temperature, T c is the coolant inlet temperature and ε is the overall cooling effectiveness, which is assumed to be constant across the blade height [47,48]. Taking the radial temperature distribution approach, since the blade will experience temperature variation in the radial plane, gives a more realistic assessment of the thermal load specified by Ghafir et al. [48], and by Walsh and Fletcher [41]. Hence, the maximum and minimum mean gas temperature for a given radial temperature distribution factor (RTDF) is given as [35,48].
T m a x = T i n + ( T c o m b u s t o r × R T D F )
T m i n = ( 5 T i n 2 T m a x ) 3
Equation (20) assumes that the maximum gas temperature will occur around 75% of the blade distance from the root, since the blade rotation shifts the gas peak temperature from the mid-span toward the blade tip.
The stress model calculates the total stress acting on the blade due to the centrifugal load caused by engine rotation and stress, due to gas bending momentum [41]. The stress model assumes a constant axial velocity along the blade’s span, with the centrifugal load acting at the blade center of gravity. As the stress prediction varies along the blade span and chord, the blade is divided into sections, with the centrifugal force (CF) and stress value ( σ ) at each section given as [33]:
CF = ρ A a v h ω 2 d
σ = C F A
The bending moment stress due to static pressure differential force on the blade is given as:
σ B M = PF × d
where PF is given as:
P F = A a v P a v N b
The Larson Miller Parameter (LMP) is used to evaluate the creep life. The blade creep life varied at each blade section, due to changes in blade temperature and stresses across the blade span. The blade life is the lowest creep life of any individual blade section considered. The LMP equation is given as:
LMP = T 1000 ( log t f + C )
where T is the temperature of the material in Kelvin, t f is the time to creep failure in hours, and C is the material constant. Creep life will vary at the different blade sections, because stress varies at the different points along the blade span. The blade’s remaining life will be the calculated minimum creep life. Table 4 shows the HPT geometry used for the creep assessment.

3. Results and Discussions

This section provides a description and discussion of the turbofan engine’s assessment results with liquid hydrogen and jet fuel. During this assessment, the net thrust is retained to have a baseline comparison. The evaluation also assumes that minor changes are made in the control and combustor design, to allow for LH2 while maintaining other turbofan engine hardware components. Maintaining the hardware means that the component efficiencies are assumed to be the same throughout the assessment.

3.1. Engine Performance Estimation

In predicting the turbofan engine’s performance running on liquid hydrogen as against kerosene, key indicators such as specific fuel consumption, turbine entry temperature and fuel flow rate are used in the results. Table 2 and Table 3 show the engine’s gas path characteristics for jet fuel and LH2, respectively. Table 5 is a performance comparison of both fuels at take-off and cruise conditions, with net thrust retained.
Compared to jet fuel, LH2 combustion has a lower mass flow rate, due to the higher LHV of the fuel, to achieve the same net thrust. This also reflects an increase in the enthalpy drop and changes in the gas composition through the turbine. The LHV influences the gas speed in the expander, hence, the impact on the compressor’s pressure ratio. The result shows a 64% decrease in the flow rate, which could also affect the thrust due to reduced exhaust mass flow rate, as described by Haglind and Singh [8]. However, the reduction in thrust is partly offset by changes in the specific heat constant Cp, which shows a slight increase due to the combustion product of LH2. The slight decrease in TET would imply favorable cooling options for the turbine hot section, and reduces NOx formation [5,25]. The result also shows a decrease in the specific fuel consumption, due to a decrease in the fuel flow rate of LH2. The resulting discussion comparing hydrogen with jet fuel is consistent with a similar assessment done for the EU CRYOPLANE project, in collaboration with Cranfield University and Universidad Politecnica, Madrid [15], although their work also considered the effect of the fuel temperature of the cycle performance, which shows that fuel temperature above the liquefaction temperature will raise the TET by 2 °C to 3 °C to achieve the same thrust, hence it is important to vaporize the hydrogen fuel efficiently.
The most important change contributing to the variation of performance for LH2 compared to jet fuel is the specific heat capacity. Despite LH2 having a low fuel rate, its low density could still pose a potential drag that reduces flight efficiency. The CRYOPLANE study results suggest that fuel tank drag could lead to between 9% to 14% more energy for the LH2 subsonic application than jet fuel [15,38]. Although this is not discussed extensively in this study, one area of consideration if the turbo component of an existing conventional aero engine is used for this assessment will be the matching of the turbo set and the combustor and control system modification to accommodate fuel changes. Lower NOx can be achieved with a micromix LH2 combustor, compared to using a conventional combustor.

3.2. Exergy Estimation

The exergy estimation was done for a performance parameter at altitude 0 m, as shown in Table 2 and Table 3. The total inlet exergy of the turbofan engine is calculated from the summation of the fuel’s chemical exergy and the air entering the engine, as shown in Figure 4. From the assessment, the exergy of LH2 is obtained as 134.595 MJ/kg, aligned with the work of Wu et al. [49], and the exergy rate at 1.61 kg/s fuel flow rate, fuel temperature of 25 °C and pressure 101.325 kPa, is obtained. The ambient conditions T0 and P0 are given as 15 °C and 101.325 kPa, respectively. Hence, the LH2 fuel exergy rate was calculated as 78,058 kW, and the jet fuel exergy rate is 73,877 kW. The inlet air exergy based on the inlet conditions and mass flow rate is calculated as 623 kW. Therefore, the turbofan engine’s total inlet exergy is obtained as 78,681 kW and 74,500 kW for LH2 and kerosene, respectively.
Where the specific heat value (Cp) for LH2 and jet fuel were obtained using Equations (29) and (30) [3]:
C p L H 2 = 1.06029 + ( 1.177 × 10 5 T ) + ( 2.51 × 10 7 ) T 2 ( 9.308 × 10 11 ) T 3
C p j e t = 0.98847 + ( 1.163 × 10 4 T ) + ( 1.529 × 10 7 ) T 2 ( 6.675 × 10 11 ) T 3
Since the assessment was at 0 m altitude, the system thrust for both cases is 123 kW, and the fan inlet mass velocity is calculated using the flow equation m ˙ = ρ A V as 154 m/s. The total thrust exergy (useful exergy) is obtained as 18,942 kW. The total exergy waste for LH2 and jet fuel becomes 59,739 kW and 55,558 kW, respectively. The total exergy waste is calculated by subtracting the total thrust exergy from the exergy input. The waste exergy ratio is calculated as the total waste exergy ratio to the total exergy input.
Table 6 summarizes the exergy assessment, showing exergy efficiency of 24.1% and 25.4%, respectively. The turbofan engine’s exergy efficiency is calculated from the ratio of the thrust exergy to the total exergy input, represented by Equation (19).
Table 7 shows the exergy destruction factor, environmental effect factor and sustainability index. The exergy destruction factor is the ratio of the exergy destruction to the total exergy input, which indicates the decrease of a positive effect of the system on exergy sustainability. The destruction factor will be proportional to the waste ratio if exergy losses are neglected. The environmental effect factor (EFF) is also a measure of sustainability, to measure the engine’s potential adverse effect on its surroundings due to its total waste exergy. The EFF is calculated as the ratio of the waste exergy ratio to the exergy efficiency, and the exergy sustainability index is the ratio of 1 to the environmental effect factor. These parameters measure the level of environmental impact and sustainability [50]. The relationship of these parameters has been highlighted in other research works [29,30,50,51].
The exergy assessment goal is to compare each fuel’s impact on the overall engine system; hence, there is no need to report the exergy at the component level since the compressor’s variation does not differ greatly. The whole system exergy is dependent on the combustion zone where the highest destruction rate and least efficiency is obtained. In similar work by Gunasekar et al. [31] using a turbojet, the exergy destruction at the component level, aside from the combustion, did not vary much between LH2 and kerosene, hence the rationale to focus on the whole engine comparison influenced by the exergy of the combustion process. The exergy losses were neglected, based on adiabatic condition assumptions; hence, the exergy consumption rate is equal to the exergy destruction rate.

3.3. Creep Life Estimation

The HPT geometry used for the creep life estimation is described in Table 4. The material constant C described in Equation (28) is taken as 20 and an HPT rotational speed of 15,000 rpm. The stress values and thermal load were used to obtain the LMP from the master curve of the blade material. The nickel alloy material Inconel 625 was assumed, with a density of 8250 kg/m3. The Inconel 625 has a melting temperature of 1350 °C and a specific heat capacity of 800 J/kg °C [52]. Figure 5 shows that the rupture time to creep failure for the LH2 seems longer than the jet fuel, due to the fuel heating value on the expander after the combustion process is completed. There was a slight decrease in the turbine entry temperature, which would have also contributed to a longer life on the turbine blade, as the stress and thermal load values are lower than when the jet fuel was utilized in the turbofan engine as described by Eshati et al. [33]. The assessment shows a 15% improvement in extended blade life, compared with jet fuel. The effect of TET on creep life for the HPT blade is aligned with the work of Eshati et al. [53] for a given radial temperature distribution factor, which showed a 70% reduction in creep life for a 3% increase in TET. The TET variation between LH2 and kerosene showed a 0.53% reduction in LH2 TET than kerosene for a given thrust. This assessment did not account for coating, which can improve the life of the blade. Coating provides thermal insulation to the turbine blade. The coating thickness gives a linear temperature variation, as described in Reyhani et al. [54] and Igbong et al. [55].
It is expected for a new engine program that the engine’s first overhaul is after approximately 10,000 h [56]. However, this value also depends on whether the engine does a long- or short-haul flight. The value obtained for jet fuel in this assessment is closely aligned with the results of Zaretsky et al. [56]. Aside from the LH2 and jet fuel comparison on creep life, Agbadede et al. [35] compared the hydrogen fuel and natural gas effect on the HPT blade’s creep life for an industrial gas turbine. The result also shows an improved creep life when hydrogen fuel was used rather than natural gas, which aligns with other literature reviews [2] on the longer engine life and lower maintenance cost for LH2.

4. Conclusions

In this study, the performance benefit of LH2 compared with jet fuel (kerosene) has been discussed. The performance results show a 64% decrease in the fuel of LH2 compared to jet fuel, due to the high LHV of LH2. This also allows the turbofan engine to run on lower TET, thereby extending the engine life by 15%. The study also discussed the exergy analysis, with LH2 showing better exergy than jet fuel. Although there are several drawbacks to LH2 owing to its technology being still at a TRL less than 7, this study did not identify any insurmountable difficulties in the potential certification of a hydrogen-fueled engine in the future. Potential issues that need to be overcome include the fuel system, tank configuration and control system design. NOx and water vapor emission must be eliminated or optimized in the combustor design for reduced and acceptable emission; however, at lower than 10,000 m altitude, research has shown that water vapor does not have an adverse impact.
Another external concern mentioned in this paper is the cost of LH2 production, which is currently less competitive than kerosene. LH2 requires a large amount of energy, and most of the energy source for production comes from fossil fuel, which also adds to total environmental emission. To resolve the emission issue, hydrogen must be produced from water using a renewable or nuclear energy source. Whether we consider other production options for LH2, like electrolysis, which has less impact on the environment, the need to account for high energy losses from new infrastructure builds and the liquefication process needs justifying to make economic sense.
Some of this study’s limitations include the assumptions made on turbofan engine hardware and operating conditions used during the assessment. A detailed combustor performance assessment using an advanced computational fluid tool is also proposed in future work. Other future work includes component exergy and creep life assessment on turbine NGV and downstream components.

Author Contributions

Conceptualization, E.O.O. and A.G.-B.; methodology, E.O.O.; software, E.O.O.; validation, A.G.-B. and E.O.O.; formal analysis, E.O.O.; investigation, E.O.O.; resources, T.N., B.S., S.J. and P.P.; data curation, E.O.O.; writing—original draft preparation, E.O.O.; writing—review and editing, A.G.-B.; visualization, E.O.O.; supervision, T.N.; project administration, A.G.-B.; funding acquisition, A.G.-B. All authors have read and agreed to the published version of the manuscript.

Funding

This research received no external funding.

Institutional Review Board Statement

Not applicable.

Informed Consent Statement

Not applicable.

Data Availability Statement

Data is contained within the article. Any data not presented are available on request from the corresponding author.

Acknowledgments

The authors wish to acknowledge EGB Engineering and Cranfield University for technical and moral support during this study.

Conflicts of Interest

The authors declare no conflict of interest.

Nomenclature

Notation
Aflow annulus area m2
AavAverage area m2
Cpspecific heat capacity, J/kgK
CWCompressor work, W
ddiameter, m
ε ˙ T Total exergy, kW
FARFuel–air ratio
FThrust, N
FNNet thrust, N
FbCold thrust, N
FcCore thrust, N
FWFan work, kW
hEnthalpy, kJ/kg
LH2Liquefied hydrogen
LHVLow heating value J/kg
LPTWLow-pressure turbine work, kW
PPressure, Pa
P r Power required, kW
SFCSpecific fuel consumption
t f Rupture time to creep failure, s
TTemperature, °C
TETTurbine entry temperature, °C
TmBlade metal temperature, °C
TWTurbine work, W
UmMean speed m/s
V 0 Free stream velocity, m/s
m ˙ Mass flow kg/s
m f Fuel flow, kg/s
ρ Density, k g / m 3
η e x Exergy efficiency
h Enthalpy change
P Pressure change
T Temperature change
ω Angular speed, m/s
Abbreviations
CCompressor
CFDComputational fluid dynamics
DPdesign point
HPCHigh-pressure compressor
HPTHigh-pressure turbine
IPCIntermediate-pressure compressor
IPTIntermediate-pressure turbine
LPTLow-pressure turbine
ORCOrganic Rankine cycle
PFPressure force
PRPressure ratio
Tturbine
TRLTechnology readiness level
SLSSea level static
Subscript
ccompressor
tturbine
aambient
0-8station number

References

  1. Hosseini, S.E.; Butler, B. An overview of development and challenges in hydrogen powered vehicles. Int. J. Green Energy 2019, 17, 13–37. [Google Scholar] [CrossRef] [Green Version]
  2. Najjar, Y.S.; Zahed, A.; Bashir, M.; Alp, T. Feasibility of Hydrogen Utilization in Gas Turbine Engines. Energy Environ. 1990, 1, 240–251. [Google Scholar] [CrossRef]
  3. Balli, O.; Sohret, Y.; Karakoc, H.T. The effects of hydrogen fuel usage on the exergetic performance of a turbojet engine. Int. J. Hydrog. Energy 2018, 43, 10848–10858. [Google Scholar] [CrossRef]
  4. Murthy, P.; Khandelwal, B.; Sethi, V.; Singh, R. Hydrogen as a Fuel for Gas Turbine Engines with Novel Micromix Type Combustors. In Proceedings of the 47th AIAA/ASME/SAE/ASEE Joint Propulsion Conference & Exhibit, San Diego, CA, USA, 31 July–3 August 2011; pp. 1–7. [Google Scholar]
  5. Moliere, M.; Hugonnet, N.; Energy, G.E. Hydrogen-fuelled gas turbines: Experience and Prospects. In Proceedings of the Power-Gen Asia Conference, Bangkok, Thailand, 5–7 October 2004. GEA33861. [Google Scholar]
  6. Brand, J.; Sampath, S.; Shum, F.; Bayt, R.; Cohen, J. Potential Use of Hydrogen in Air Propulsion. In Proceedings of the AIAA International Air and Space Symposium and Exposition: The Next 100 Years, Dayton, OH, USA, 14–17 July 2003. [Google Scholar]
  7. Funke, H.-W.; Beckmann, N.; Abanteriba, S. An overview on dry low NOx micromix combustor development for hydrogen-rich gas turbine applications. Int. J. Hydrog. Energy 2019, 44, 6978–6990. [Google Scholar] [CrossRef]
  8. Haglind, F.; Singh, R. Design of Aero Gas Turbines Using Hydrogen. J. Eng. Gas Turbines Power 2004, 128, 754–764. [Google Scholar] [CrossRef]
  9. Kumar, P.; Britter, R.; Gupta, N. Hydrogen Fuel: Opportunities and Barriers. J. Fuel Cell Sci. Technol. 2009, 6, 021009. [Google Scholar] [CrossRef]
  10. Khandelwal, B.; Karakurt, A.; Sekaran, P.R.; Sethi, V.; Singh, R. Hydrogen powered aircraft: The future of air transport. Prog. Aerosp. Sci. 2013, 60, 45–59. [Google Scholar] [CrossRef]
  11. Agarwal, P.; Sun, X.; Gauthier, P.Q.; Sethi, V. Injector Design Space Exploration for an Ultra-Low NOx Hydrogen Micromix Combustion System. In Proceedings of the Turbo Expo: Power for Land, Sea and Air, Phoenix, AZ, USA, 17–21 June 2019. [Google Scholar]
  12. IEA. The Future of Hydrogen, Paris. 2019. Available online: https://www.iea.org/reports/the-future-of-hydrogen (accessed on 10 February 2021).
  13. Aasadnia, M.; Mehrpooya, M. Large-scale liquid hydrogen production methods and approaches: A review. Appl. Energy 2018, 212, 57–83. [Google Scholar] [CrossRef]
  14. Koroneos, C.; Dompros, A.; Roumbas, G.; Moussiopoulos, N. Life Cycle Assessment of Kerosene Used in Aviation (8 pp). Int. J. Life Cycle Assess. 2004, 10, 417–424. [Google Scholar] [CrossRef]
  15. Jackson, A.J. Optimisation of Aero and Industrial Gas Turbine Design for the Environment. Ph.D. Thesis, Cranfield University, Cranfield, UK, 2009. [Google Scholar]
  16. CORDIS, ENABLing cryogEnic Hydrogen Based CO2 Free Air Transport (ENABLEH2), European Union. 2021. Available online: https://cordis.europa.eu/project/id/769241 (accessed on 1 March 2021).
  17. Asanitthong, S. Outlet Temperature Distribution Control and Heat Transfer Calculation for a Hydrogen Micromix Combustor. MSc. Thesis, Cranfield University, Cranfield, UK, 2014. [Google Scholar]
  18. Abdallah, R.B.; Sethi, V.; Gauthier, P.Q.; Rolt, A.M.; Abbott, D. A Detailed Analytical Study of Hydrogen Reaction in a Novel Micromix Combustion System. In Proceedings of the ASME Turbo Expo 2018, Turbomachinery Technical Conference and Exposition, Oslo, Norway, 11–15 June 2018; ASME International: New York, NY, USA, 2018; p. 11. [Google Scholar]
  19. Lei, H.; Khandelwal, B. Investigation of Novel Configuration of Hydrogen Micromix Combustor for Low NOx Emission. In Proceedings of the AIAA Scitech 2020 Forum, Orlando, FL, USA, 6–10 January 2020; American Institute of Aeronautics and Astronautics: Reston, VA, USA, 2020; p. 11. [Google Scholar]
  20. Robinson, A.E.; Funke, H.H.-W.; Hendrick, P.; Wagemakers, R. Design and Testing of a Micromix Combustor with Recuperative Wall Cooling for a Hydrogen Fueled μ-Scale Gas Turbine. J. Eng. Gas Turbines Power 2011, 133, 082301. [Google Scholar] [CrossRef]
  21. Karakurt, A.; Khandelwal, B.; Sethi, V.; Singh, R. Study of Novel Micromix Combustors to be used in Gas Turbines; using Hydrogen, Hydrogen-Methane, Methane and Kerosene as a fuel. In Proceedings of the 48th AIAA/ASME/SAE/ASEE Joint Propulsion Conference & Exhibit, Atlanta, GA, USA, 30 July–1 August 2012. [Google Scholar]
  22. Cerutti, M.; Cocchi, S.; Modi, R.; Sigali, S.; Bruti, G. Hydrogen Fueled Dry Low NOx Gas Turbine Combustor Conceptual Design. In Proceedings of the ASME Turbo Expo 2014: Turbine Technical Conference and Exposition, Düsseldorf, Germany, 16–20 June 2014. [Google Scholar]
  23. Mital, S.K.; Gyekenyesi, J.Z.; Arnold, S.M.; Sullivan, R.M.; Manderscheid, J.M.; Murthy, P.L. Aerospace Engineering Papers. In Review of Current State of the Art and Key Design Issues with Potential Solutions for Liquid Hydrogen Cryogenic Storage Tank Structures for Aircraft Applications; NASA: Washington, DC, USA, 2006. [Google Scholar]
  24. Osigwe, E.O.; Gad-Briggs, A.; Nikolaidis, T.; Pilidis, P.; Sampath, S. Performance Simulation to Understand the Effects of Multi-Fluid Scaling of Gas Turbine Components for Generation Iv Nuclear Power Plants. ASME J. Nucl. Eng. Radiat. Sci. 2019, 6. [Google Scholar] [CrossRef]
  25. Lee, M.C.; Bin Seo, S.; Chung, J.H.; Kim, S.M.; Joo, Y.J.; Ahn, D.H. Gas turbine combustion performance test of hydrogen and carbon monoxide synthetic gas. Fuel 2010, 89, 1485–1491. [Google Scholar] [CrossRef]
  26. Svensson, F.; Hasselrot, A.; Moldanova, J. Reduced environmental impact by lowered cruise altitude for liquid hydrogen-fuelled aircraft. Aerosp. Sci. Technol. 2004, 8, 307–320. [Google Scholar] [CrossRef]
  27. Koç, Y.; Yağlı, H.; Görgülü, A.; Koç, A. Analysing the performance, fuel cost and emission parameters of the 50 MW simple and recuperative gas turbine cycles using natural gas and hydrogen as fuel. Int. J. Hydrog. Energy 2020, 45, 22138–22147. [Google Scholar] [CrossRef]
  28. Kaya, N.; Turan, Ö.; Karakoç, T.H.; Midilli, A. Parametric study of exergetic sustainability performances of a high altitude long endurance unmanned air vehicle using hydrogen fuel. Int. J. Hydrog. Energy 2016, 41, 8323–8336. [Google Scholar] [CrossRef]
  29. Dong, Z.; Li, D.; Wang, Z.; Sun, M. A review on exergy analysis of aerospace power systems. Acta Astronaut. 2018, 152, 486–495. [Google Scholar] [CrossRef]
  30. Şöhret, Y.; Ekici, S.; Altuntaş, Ö.; Hepbasli, A.; Karakoç, T.H. Exergy as a useful tool for the performance assessment of aircraft gas turbine engines: A key review. Prog. Aerosp. Sci. 2016, 83, 57–69. [Google Scholar] [CrossRef]
  31. Gunasekar, P.; Manigandan, S.; Venkatesh, S.; Gokulnath, R.; Vimal, R.; Boomadevi, P. Effect of hydrogen addition on exergetic performance of gas turbine engine. Aircr. Eng. Aerosp. Technol. 2019, 92, 180–185. [Google Scholar] [CrossRef]
  32. Saturday, E.G.; Isaiah, T.-G. Effects of Compressor Fouling and Compressor Turbine Degradation on Engine Creep Life Consumption. J. Eng. Gas Turbines Power 2018, 140, 102601. [Google Scholar] [CrossRef]
  33. Eshati, S.; Ghafir, M.F.A.; Laskaridis, P.; Li, Y.G. Impact of operating conditions and design parameters on gas turbine hot section creep life. In Proceedings of the Turbo Expo: Power for Land, Sea and Air, Glasgow, UK, 14–18 June 2010. [Google Scholar]
  34. Seerangan, M.; Walunj, J.; Kumar, S.K. Review of the State of Art in the Life Evaluation Technologies of Gas Turbine Parts. In Proceedings of the ASME 2012 Gas Turbine India Conference, Mumbai, India, 1 December 2012; pp. 649–656. [Google Scholar] [CrossRef]
  35. Agbadede, R.; Nkoi, B.; Kainga, B. Performance Analysis of Industrial Gas Turbines Fueled with Hydrogen. Niger. Res. J. Eng. Environ. Sci. 2020, 5, 178–189. [Google Scholar]
  36. Chiesa, P.; Lozza, G.; Mazzocchi, L. Using Hydrogen as Gas Turbine Fuel. J. Eng. Gas Turbines Power 2005, 127, 73–80. [Google Scholar] [CrossRef] [Green Version]
  37. Koroneos, C.; Dompros, A.; Roumbas, G.; Moussiopoulos, N. Advantages of the use of hydrogen fuel as compared to kerosene. Resour. Conserv. Recycl. 2005, 44, 99–113. [Google Scholar] [CrossRef]
  38. Corchero, G.; Montañés, J.L. An approach to the use of hydrogen for commercial aircraft engines. Proc. Inst. Mech. Eng. Part G J. Aerosp. Eng. 2005, 219, 35–44. [Google Scholar] [CrossRef] [Green Version]
  39. Osigwe, E.O.; Pilidis, P.; Nikolaidis, T.; Sampath, S. Gas Turbine Arekret-Cycle Simulation Modeling for Training and Educational Purposes. J. Nucl. Eng. Radiat. Sci. 2019, 5, 041207. [Google Scholar] [CrossRef]
  40. Gunston, B. Jane’s Aero-Engines; Jane’s Information Group: London, UK, 2021. [Google Scholar]
  41. Walsh, P.P.; Fletcher, P. Gas Turbine Performance, 2nd ed.; Blackwell Science: Oxford, UK, 1998. [Google Scholar]
  42. Şöhret, Y.; Açıkkalp, E.; Hepbasli, A.; Karakoc, T.H. Advanced exergy analysis of an aircraft gas turbine engine: Splitting exergy destructions into parts. Energy 2015, 90, 1219–1228. [Google Scholar] [CrossRef]
  43. Aydin, H.; Turan, O.; Karakoc, T.H.; Midilli, A. Exergetic Sustainability Indicators as a Tool in Commercial Aircraft: A Case Study for a Turbofan Engine. Int. J. Green Energy 2015, 12, 28–40. [Google Scholar] [CrossRef]
  44. Goodger, E.M.; Ogaji, S.O.T. Fuels and Combustion in Heat Engines; Cranfield University Press: Bedford, UK, 2011. [Google Scholar]
  45. Turgut, E.T.; Karakoc, T.H.; Hepbasli, A.; Rosen, M.A. Exergy analysis of a turbofan aircraft engine. Int. J. Exergy 2009, 6, 181. [Google Scholar] [CrossRef]
  46. Balli, O. Exergy modeling for evaluating sustainability level of a high bypass turbofan engine used on commercial aircrafts. Appl. Therm. Eng. 2017, 123, 138–155. [Google Scholar] [CrossRef]
  47. Mohammad Lou, B.S.; Pourgol-Mohammad, M.; Yazdani, M. Life assessment of gas turbine blades under creep failure mechanism considering humidity. ASME Int. Mech. Eng. Congr. Expo. Proc. 2018, 13, 1–7. [Google Scholar] [CrossRef]
  48. Abdul Ghafir, M.F.; Li, Y.G.; Singh, R.; Huang, K.; Feng, X. Impact of operating and health conditions on aero gas turbine: Hot section creep life using a creep factor approach. In Proceedings of the Turbo Expo: Power for Land, Sea and Air, Glasgow, UK, 14–18 June 2010. [Google Scholar]
  49. Wu, Z.; Zhou, S.; An, L. The Second Law (Exergy) Analysis of Hydrogen. J. Sustain. Dev. 2011, 4, 260–263. [Google Scholar] [CrossRef] [Green Version]
  50. Inac, S.; Unverdi, S.O.; Midilli, A. Global warming, environmental and sustainability aspects of a geothermal energy based biodigester integrated SOFC system. Int. J. Hydrog. Energy 2020, 45, 35039–35052. [Google Scholar] [CrossRef]
  51. Turan, O. An exergy way to quantify sustainability metrics for a high bypass turbofan engine. Energy 2015, 86, 722–736. [Google Scholar] [CrossRef]
  52. High Temp Metals. Inconel 625 Technical Data. 2015. Available online: https://www.hightempmetals.com/techdata/hitempInconel625data.php (accessed on 23 February 2021).
  53. Eshati, S.; Abu, A.; Laskaridis, P.; Haslam, A. Investigation into the Effects of Operating Conditions and Design Parameters on the Creep Life of High Pressure Turbine Blades in a Stationary Gas Turbine Engine. Mech. Mech. Eng. 2011, 15, 237–247. [Google Scholar]
  54. Reyhani, M.R.; Alizadeh, M.; Fathi, A.; Khaledi, H. Turbine blade temperature calculation and life estimation—A sensitivity analysis. Propuls. Power Res. 2013, 2, 148–161. [Google Scholar] [CrossRef] [Green Version]
  55. Igbong, D.; Osigwe, E.O.; Gray, I.; Pilidis, P. Technoeconomic Evaluation of An Aircraft Engine Upgrade: Part 1—Aircraft Performance Outcomes. In Proceedings of the 23rd ISABE Conference, Manchester, UK, 3–8 September 2017; pp. 1–12. [Google Scholar]
  56. Zaretsky, E.V.; Litt, J.S.; Hendricks, R.C.; Soditus, S.M. Determination of Turbine Blade Life from Engine Field Data. J. Propuls. Power 2012, 28, 1156–1167. [Google Scholar] [CrossRef]
Figure 1. Temperature characteristics of LH2 and kerosene as a function of the equivalence ratio [6].
Applsci 11 03873 g001
Figure 2. Liquefied hydrogen aircraft with different tank configurations [10].
Applsci 11 03873 g002
Figure 3. Schematic of the turbofan engine.
Applsci 11 03873 g003
Figure 4. Exergy boundary condition.
Applsci 11 03873 g004
Figure 5. Creep life estimation.
Applsci 11 03873 g005
Table 1. Baseline take-off and cruise conditions.
DescriptionValues
Cruise Altitude (m)10,000
Cruise Mach no0.7
Mass flow (kg/s) 385
Overall pressure ratio (1.5*3.8*5)28.5
By-pass ratio4.8
Net thrust (kN)123
Combustor pressure loss (%)5
Compressor efficiency (%)90
Turbine efficiency (%)92
Table 2. Performance characteristics at each station for jet fuel (kerosene) at altitude = 0 m.
Station No.CP/CVMass Flow (kg/s)Pressure (kPa)Temperature (°C)Enthalpy (kJ/kg)CP (kJ/kgK)
01.399385101.32515414.3751.006
11.399385101.32515414.3751.006
21.398385151.98854.267453.8111.008
31.38666.379577.553222.457624.6201.031
41.35166.3792887.762533.614956.8171.105
51.31467.9842743.3741124.851641.5691.201
61.32767.9841023.250854.8121320.6161.164
71.33767.984560.145711.5381155.3241.139
81.35567.984212.782515.379935.8531.096
Table 3. Performance characteristics at each station for LH2 at altitude = 0 m.
Station No.CP/CVMass Flow (kg/s)Pressure (kPa)Temperature (°C)Enthalpy (kJ/kg)CP (kJ/kgK)
01.399385101.32515414.3751.006
11.399385101.32515414.3751.006
21.398385151.98854.267453.8111.008
31.38666.379577.553222.457624.6201.031
41.35166.3792887.762533.614956.8171.105
51.31466.9552743.3741119.891645.3621.221
61.32766.9551010.867850.6621322.7031.171
71.33766.955543.805705.0991156.9871.141
81.35566.955201.594507.379939.2551.100
Table 4. HPT geometry and configuration.
DescriptionValue
LH2Jet Fuel
TET (°C)11191125
Number of stages11
Blade height (m)0.0940.094
Hub to tip ratio (m)0.750.75
Hub diameter (m)0.630.63
Tip diameter (m)0.7590.759
Axial velocity120120
Inlet Axial Mach no0.180.18
Table 5. Turbofan performance comparison of LH2 and jet fuel.
DescriptionHydrogen (LH2)Jet-A (Kerosene)
Take-OffCruiseTake-OffCruise
Net thrust (kN)12389.5412389.54
Mass flow (kg/s)385269385269
Altitude (m)010,000010,000
Fuel flow rate (kg/s)0.580.451.611.27
Specific fuel consumption (kg/kNs)17.119.2346.9651.1
Turbine entry temperature (°C)11198911125900
Table 6. Exergy assessment and comparison for LH2 and jet fuel.
ComponentExergy Efficiency (%)Exergy Input (kW)Waste Exergy (kW)Waste Exergy Ratio
LH2Jet FuelLH2Jet FuelLH2Jet FuelLH2Jet Fuel
Whole Engine24.125.478,68174,50059,73955,5580.760.75
Table 7. Environmental effect factor and sustainability index.
ComponentEnvironmental Effect FactorExergy Sustainability Index
LH2Jet FuelLH2Jet Fuel
Whole engine2.902.950.3450.339
Publisher’s Note: MDPI stays neutral with regard to jurisdictional claims in published maps and institutional affiliations.

