Article

Evaluation of the Radiological and Chemical Risk for Public Health from Flour Sample Investigation

1
Dipartimento di Scienze Matematiche e Informatiche, Scienze Fisiche e Scienze Della Terra, Università degli Studi di Messina, V.le F. Stagno D’Alcontres, 31-98166 Messina, Italy
2
Dipartimento di Scienze Biomediche, Odontoiatriche, e Delle Immagini Morfologiche e Funzionali, Università degli Studi di Messina, c/o A.O.U. Policlinico “G. Martino” Via Consolare Valeria, 1-98125 Messina, Italy
3
Agenzia Regionale Protezione Ambientale Calabria (ARPACal), Dipartimento di Reggio Calabria, via Troncovito SNC, 89135 Reggio Calabria, Italy
4
Dipartimento di Scienze Chimiche, Biologiche, Farmaceutiche e Ambientali, Università degli Studi di Messina, V.le F. Stagno D’Alcontres, 31-98166 Messina, Italy
*
Authors to whom correspondence should be addressed.
Appl. Sci. 2021, 11(8), 3646; https://doi.org/10.3390/app11083646
Submission received: 22 March 2021 / Revised: 16 April 2021 / Accepted: 16 April 2021 / Published: 18 April 2021
(This article belongs to the Special Issue Advances in Environmental Applied Physics)

Abstract

:
Flour investigation, in terms of physical and chemical pollutants and mineral content, is of great interest, in view of its high consumption for nutritional purposes. In this study, eleven types of flour (five samples for each one), coming from large retailers and employed by people for different cooking food purposes, were investigated through high-purity germanium (HPGe) gamma spectrometry, in order to estimate natural (40K) and anthropogenic (137Cs) radioisotope specific activity and thus, to assess the radiological risk due to the flour ingestion. Inductively-coupled plasma mass spectrometry (ICP-MS) and inductively-coupled plasma emission spectroscopy (ICP-OES) were also employed to evaluate any possible heavy metal contamination and the mineral composition, and to perform multivariate statistical analysis to deduce the flour authenticity. The evaluation of dose levels due to flour ingestion was performed, for the age category higher than 17 years, taking into account the average yearly consumption in Italy and assuming this need to be satisfied from a single type of flour as a precaution. All obtained results are under the allowable level set by Italian legislation (1 mSv y−1), thus excluding the risk of ionizing radiation effects on humans. As far as heavy metal contamination is concerned, Cd and Pb concentrations turned out to be lower than the threshold values, thus excluding their presence as pollutants. Finally, the multivariate statistical analysis allowed to unambiguously correlate flour samples to their botanical origin, according to their elemental concentrations.

1. Introduction

Natural radioactivity occurs in the environment due to the presence of cosmogenic and primordial radionuclides in the Earth’s crust [1]. The first radionuclides were produced by cosmic-rays’ interaction with atomic nuclei in the atmosphere, while primordial radioisotopes were generated by the nucleo-synthesis process during the Earth’s formation [2]. Anthropogenic radioactivity is due to radionuclides, such as 137Cs, mainly derived from nuclear accidents and global nuclear tests conducted between the mid-1940s and the 1980s [3].
Human beings can be exposed to ionizing radiations through external gamma rays, the inhalation of radon and other radioactive nuclides, and ingestion of radioisotopes through food and water [4]. In particular, for the latter, the natural radioactivity in food comes mainly from 40K; uranium and thorium daughter products are usually present in traces [4,5,6,7,8].
The presence in food of anthropogenic radionuclides, as well as of heavy metals, is a significant issue, involving contamination of the food chain and harm to public health [9]. The danger associated to heavy metals is especially severe, because they are not chemically or biologically degradable [7]. Once released into the environment, mainly due to industrial or mining activities, they can remain for hundreds of years, polluting the soil and accumulating in plants and organic tissues. Moreover, their concentration in living beings increases as they move up the food chain [10].
Among all sources of the food chain contamination, pollution of the soil (from which foods are produced) due to the radioactive fall-out, residual muds, chemical fertilizers, and pesticides used in agriculture appear to be the most significant [11]. Having this contamination in so many different sources, there is a wide range of foods potentially contaminated by anthropic radionuclides and heavy metals, including products of plant origin, such as cereals, rice, wheat, edible roots, mushrooms, etc., as well as animal origin foods, such as fish, crustaceans, mollusks, etc. [6].
Flour is a plant origin foodstuff consumed daily by inhabitants of Italy [12]. The average annual consumption of flour is of about 85 kg per person, taking into consideration its use to produce bread, pizza, and baked goods, so the analysis of flour in terms of chemical and radioactive contamination is extremely important to safeguard human health [13]. The consumption of contaminated food increases the amount of radioactivity and chemical contamination inside an individual, and therefore increases the health risks associated with radiation exposure and heavy metal pollution. The exact health effects depend on the type and quantity of ingested radionuclides and metals [14].
Consumers have an increasing interest towards safe foodstuffs and protection [15,16]. For this reason, studies focused on food authenticity and traceability are in constant increase to preserve costumers against fraud and commercial disputes [17]. In particular, botanical and geographical origins of various foodstuffs have been verified by developing quali-/quantitative methods with subsequent multivariate analysis [18,19].
In this article, eleven different types of flour (five samples for each one), i.e., wholemeal, semolina, rice, coconut, almond, chestnut, Mallorcan wheat, oat, corn, rye, and pistachio, coming from large retailers and employed by people for different alimentary purposes, were analyzed. The analysis was to identify and quantify, on the one hand, natural (40K) and artificial (137Cs) gamma-emitting radionuclides with HPGe gamma spectrometry, in order to evaluate any possible radioactive contamination and estimate the effective dose due to the flour ingestion. On the other hand, heavy metals and minerals were estimated by ICP-MS and ICP-OES, in order to assess any possible chemical pollution, through a comparison between experimental concentrations and threshold limits set by Italian legislation [20], and to deduce the flour authenticity, correlating botanical origin, with chemical composition.
The schematic block diagram of Figure 1 summarizes what was performed in the present study.

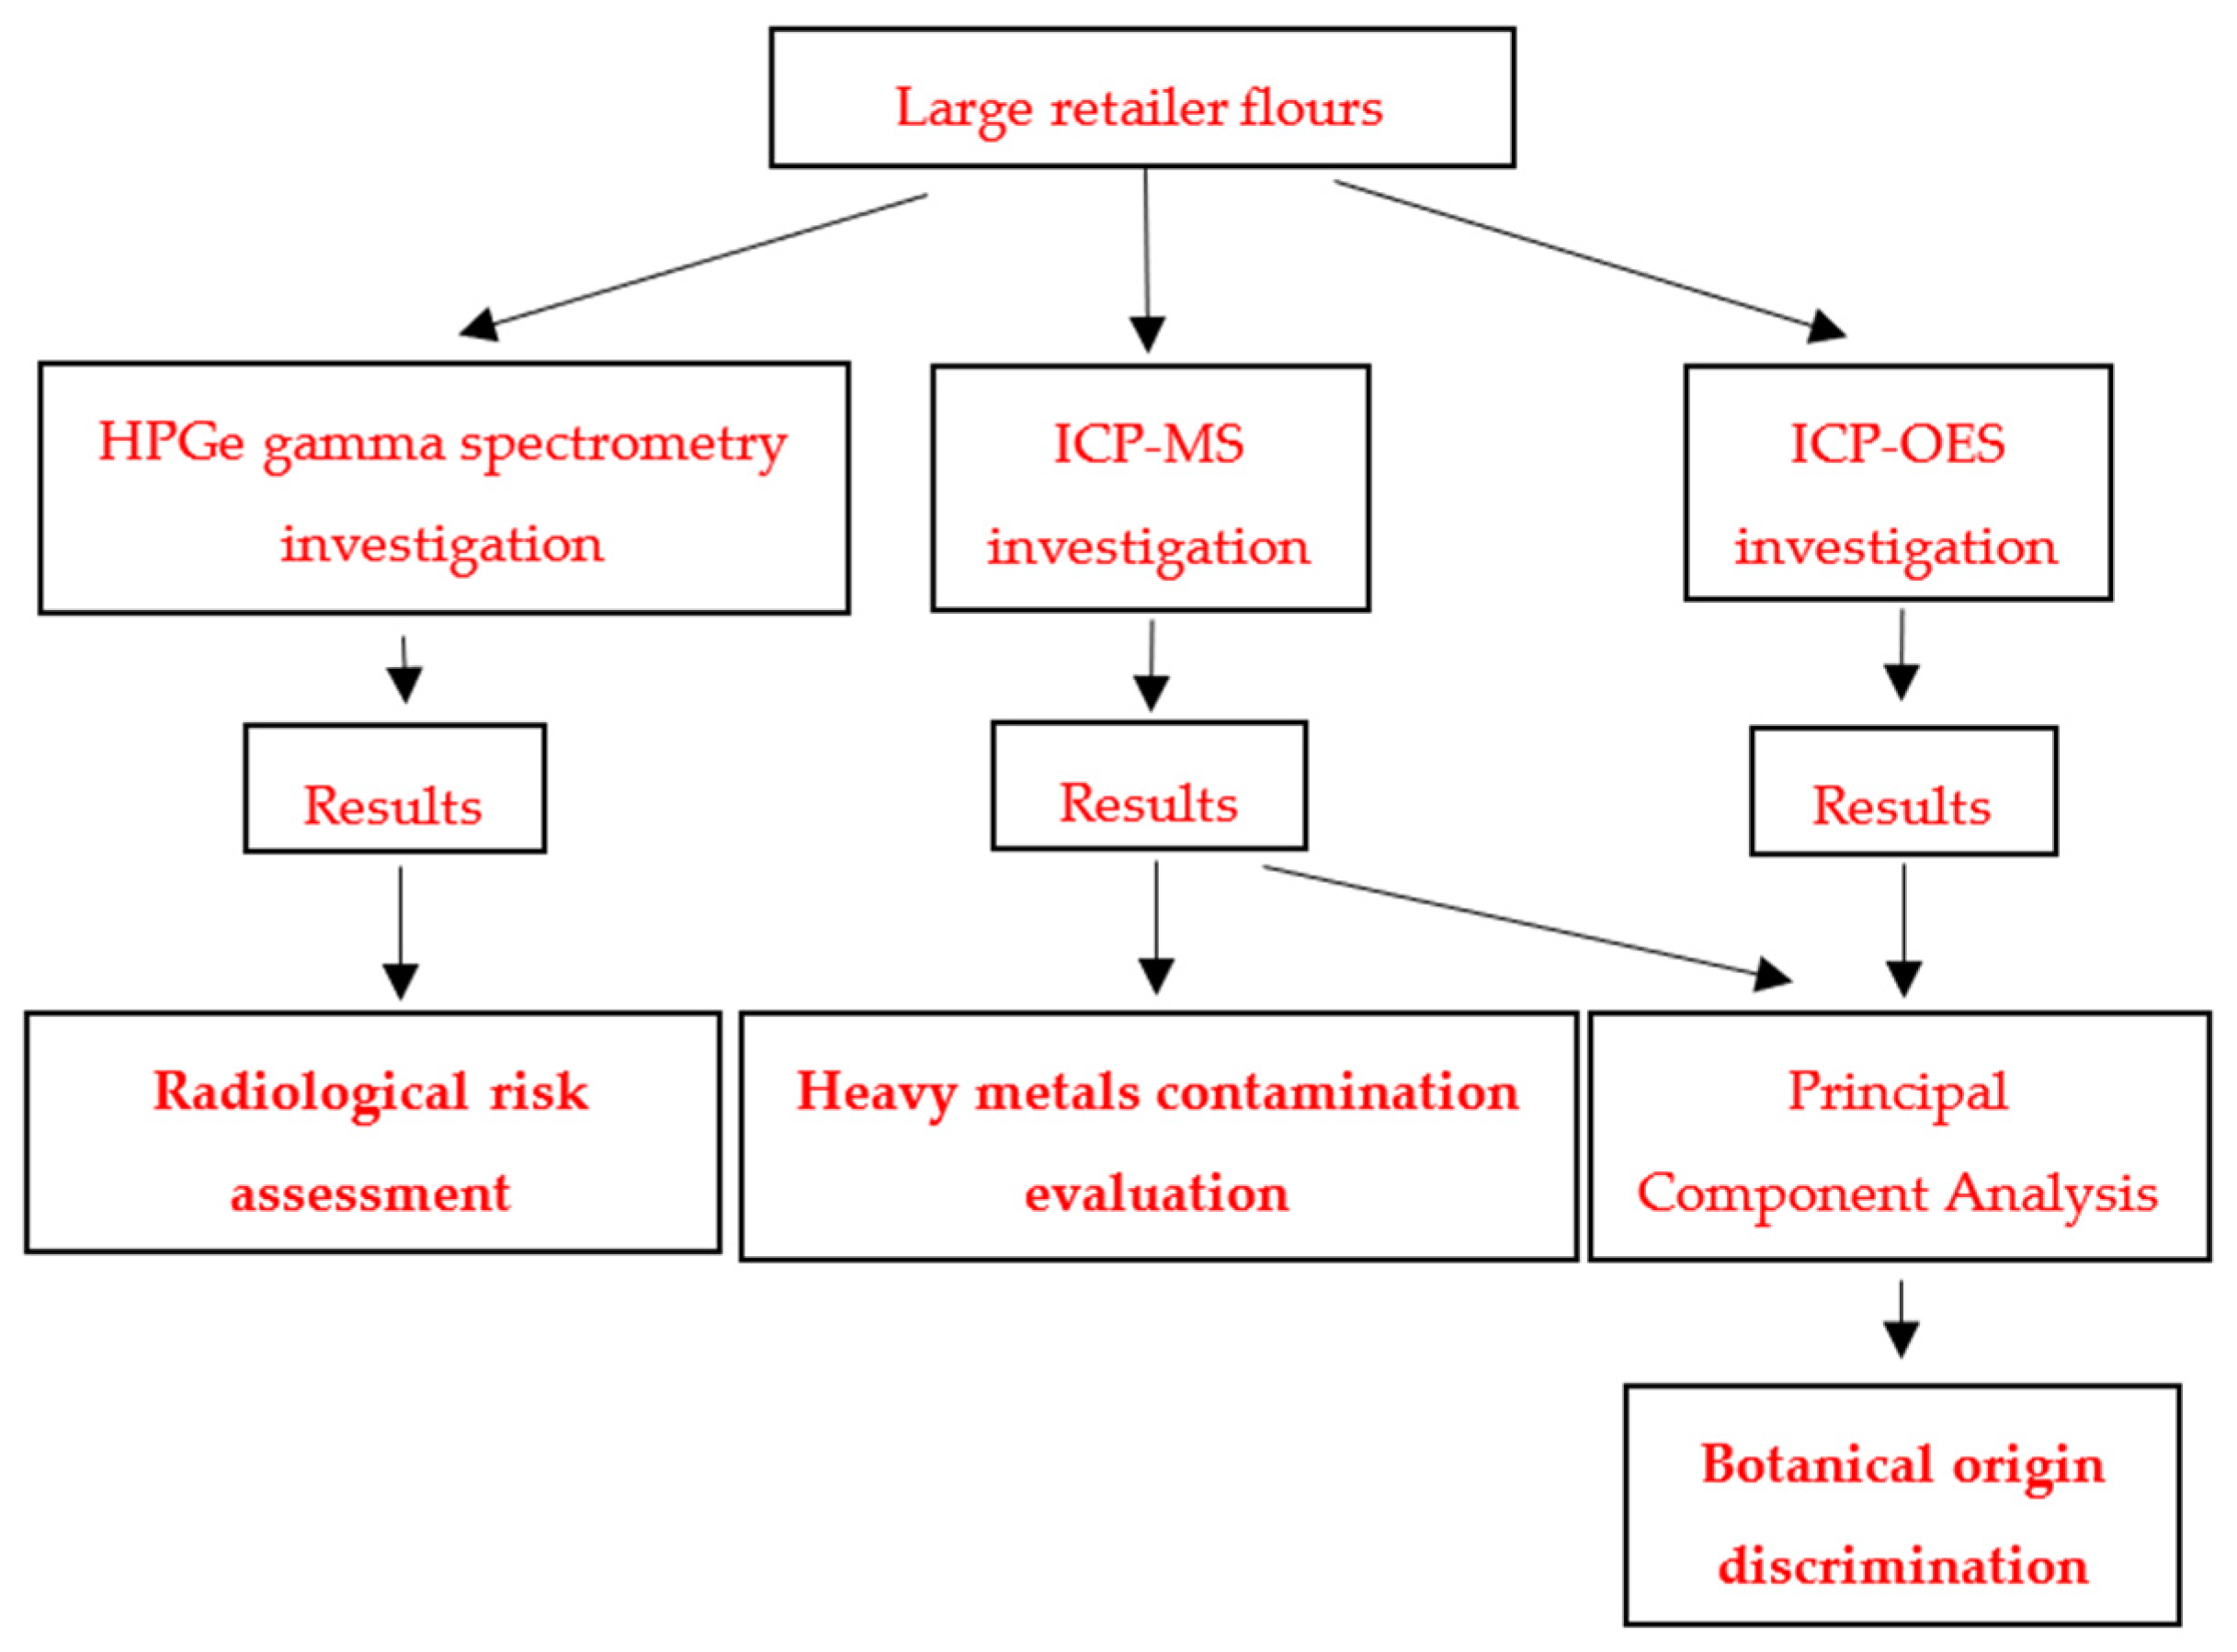
2. Materials and Methods

2.1. Sample Description

Five samples for each type of flour (wholemeal, semolina, rice, coconut, almond, chestnut, Mallorcan wheat, oat, corn, rye, and pistachio) were analyzed in this study.
Wholemeal flour is a powdered substance, a basic food ingredient derived from the stone grinding of the whole wheat grain. It has a dusty consistency and is aimed toward mixing with liquid and/or fatty ingredients (water, oil or eggs) to give rise to many doughs of typically Mediterranean origin, such as bread and pasta. The benefits for human health deriving from the use of this flour mainly consist of the reduction of cardiovascular risk and arteriosclerosis, overweightness and obesity, and diabetes risk, as well as anti-inflammatory action [21].
Semolina flour is produced by grinding durum wheat. It is typical of the southern regions of Italy, such as Puglia and Sicily, and other areas of the southern and eastern Mediterranean. Semolina flour is mainly used for the production of bread and pasta, but also for typical sweets. It can be used for biscuits and cakes, as well as pizzas and focaccias. It is rich in fibers, vitamins, and minerals, and has a relatively low glycemic index, thanks to the presence of complex carbohydrates. It also contains antioxidants, particularly beneficial in counteracting cellular aging. It is gluten-rich, though, and therefore not suitable for the diet of people with celiac disease [22,23].
Rice flour is obtained from the ground seeds of the Oryza sativa plant, i.e., rice. It is one of the most-used alternative flours in gluten-free cuisine, being suitable for the preparation of many recipes. As an example, it is excellent in the dough of biscuits, cakes, pies, pizzas, bread, and home-made pasta, because despite having a poor aptitude for leavening, it gives a pleasant crispness. This flour is recommended for cardiovascular health, due to its very low fat and cholesterol content, and low sodium content as well. It can be part of the diet of hypertensive patients. Rice flour also provides a high content of minerals, such as calcium and iron compounds, and vitamins [24].
Coconut flour is the powder obtained by grinding dried coconut pulp. It is a fairly versatile ingredient, so it can be used for different preparations, taking into account its tendency to absorb a lot of liquids. This means that the dishes containing it are and remain more humid than those made with other flours. For this reason, coconut flour is highly appreciated, especially in gluten-free cuisine, where the products tend to dry out very quickly. This kind of flour has several health benefits, since it is a rich source of fiber and protein, does not contain gluten, and has a low glycemic index [25].
Almond flour is a product easily obtained by grinding shelled and peeled almonds. It is used, as is, for the preparation of baked goods, especially sweets, or in combination with sugar for the preparation of the well-known almond and marzipan paste, rich ingredients of granita or artisanal ice cream, as well as malleable pastes for the decoration of cakes or biscuits. It is gluten-free, a source of vegetable protein, and contains magnesium and iron. It is also source of good fats, helps to reduce cholesterol, is a source of energy for the body, and has restorative properties [26].
Chestnut flour is the product of the drying and subsequent grinding of chestnuts. It is a very versatile ingredient, which can be useful for the preparation of both sweet and savory recipes. Beyond some traditional recipes, this flour is nowadays used quite rarely in the kitchen, while in the past it represented a staple food, replacing the fine wheat flour in poor cuisine. This flour is rich in proteins, fiber, and vitamins, and is useful for the intestinal bacterial flora and against cholesterol [27].
Mallorcan flour is obtained by the stone-grinding of Mallorca wheat, a variety of ancient Sicilian wheat produced from organic farming, and characterized by a low gluten index and by being a source of fiber. The stone grinding is followed by a sieving, which gives it its typical characteristics. This flour is used in the recipes of typical Sicilian sweets, wafers, white breads, and breadsticks. It has a lot of protein, mineral salts, and vitamins content, and excellent bread-making qualities. It is also an easily digestible food, with a low gluten content [28].
Oat flour is a product obtained by grinding the seeds of oats, preceded by the separation of the bran, which is rich in cellulose indigestible for the human body. With this flour, it is possible to prepare various types of food products, from appetizers to desserts, including bread, pizza, porridge, pasta, quiche, sweet cakes, and savory desserts. It is an excellent source of carbohydrates, fiber, protein, and fats, and is also rich in micronutrients, such as vitamins, minerals, and lecithin [29].
Corn flour is a dried cornmeal. It is a common staple food and is ground to coarse, medium, and fine consistency. This flour, obtained by grinding the seeds of Zea mais, is suitable for celiacs and used for the preparation of polenta and as a thickener. rich in carotenoids and has an antioxidant action. It is suitable for celiacs and is used for the preparation of polenta, and as a thickener. It is also used for the preparation of flans, Mexican tortillas, crèpes, pasta, and desserts [30].
Rye flour is produced by grinding the seeds of Secale cereale. It is rich in soluble fibers, but it tends to absorb large quantities of water, thus hindering baking. Rye-based dough is not very elastic and almost devoid of resistance, because it contains little gluten. The bread made from it is very dark, with a characteristic flavor. Rye flour can also be used for the preparation of sweets, biscuits or cakes, pasta, buns, and fried foods. From a nutritional point of view, it provides a high amount of energy [31].
Pistachio flour is obtained by chopping shelled pistachios until a not-too-fine grain is obtained, with an irregular shape and intense color. It is deal as a base for the preparation of cakes and desserts in general, sauces for pasta, and main courses of meat and fish. This flour is rich in mineral salts, is a source of vegetable proteins, contains B vitamins and carotenoids, is rich in antioxidants, protects eyesight, and prevents aging [32].
All the investigated types of flour are reported in Table 1, together with their identification code (ID) and typology.

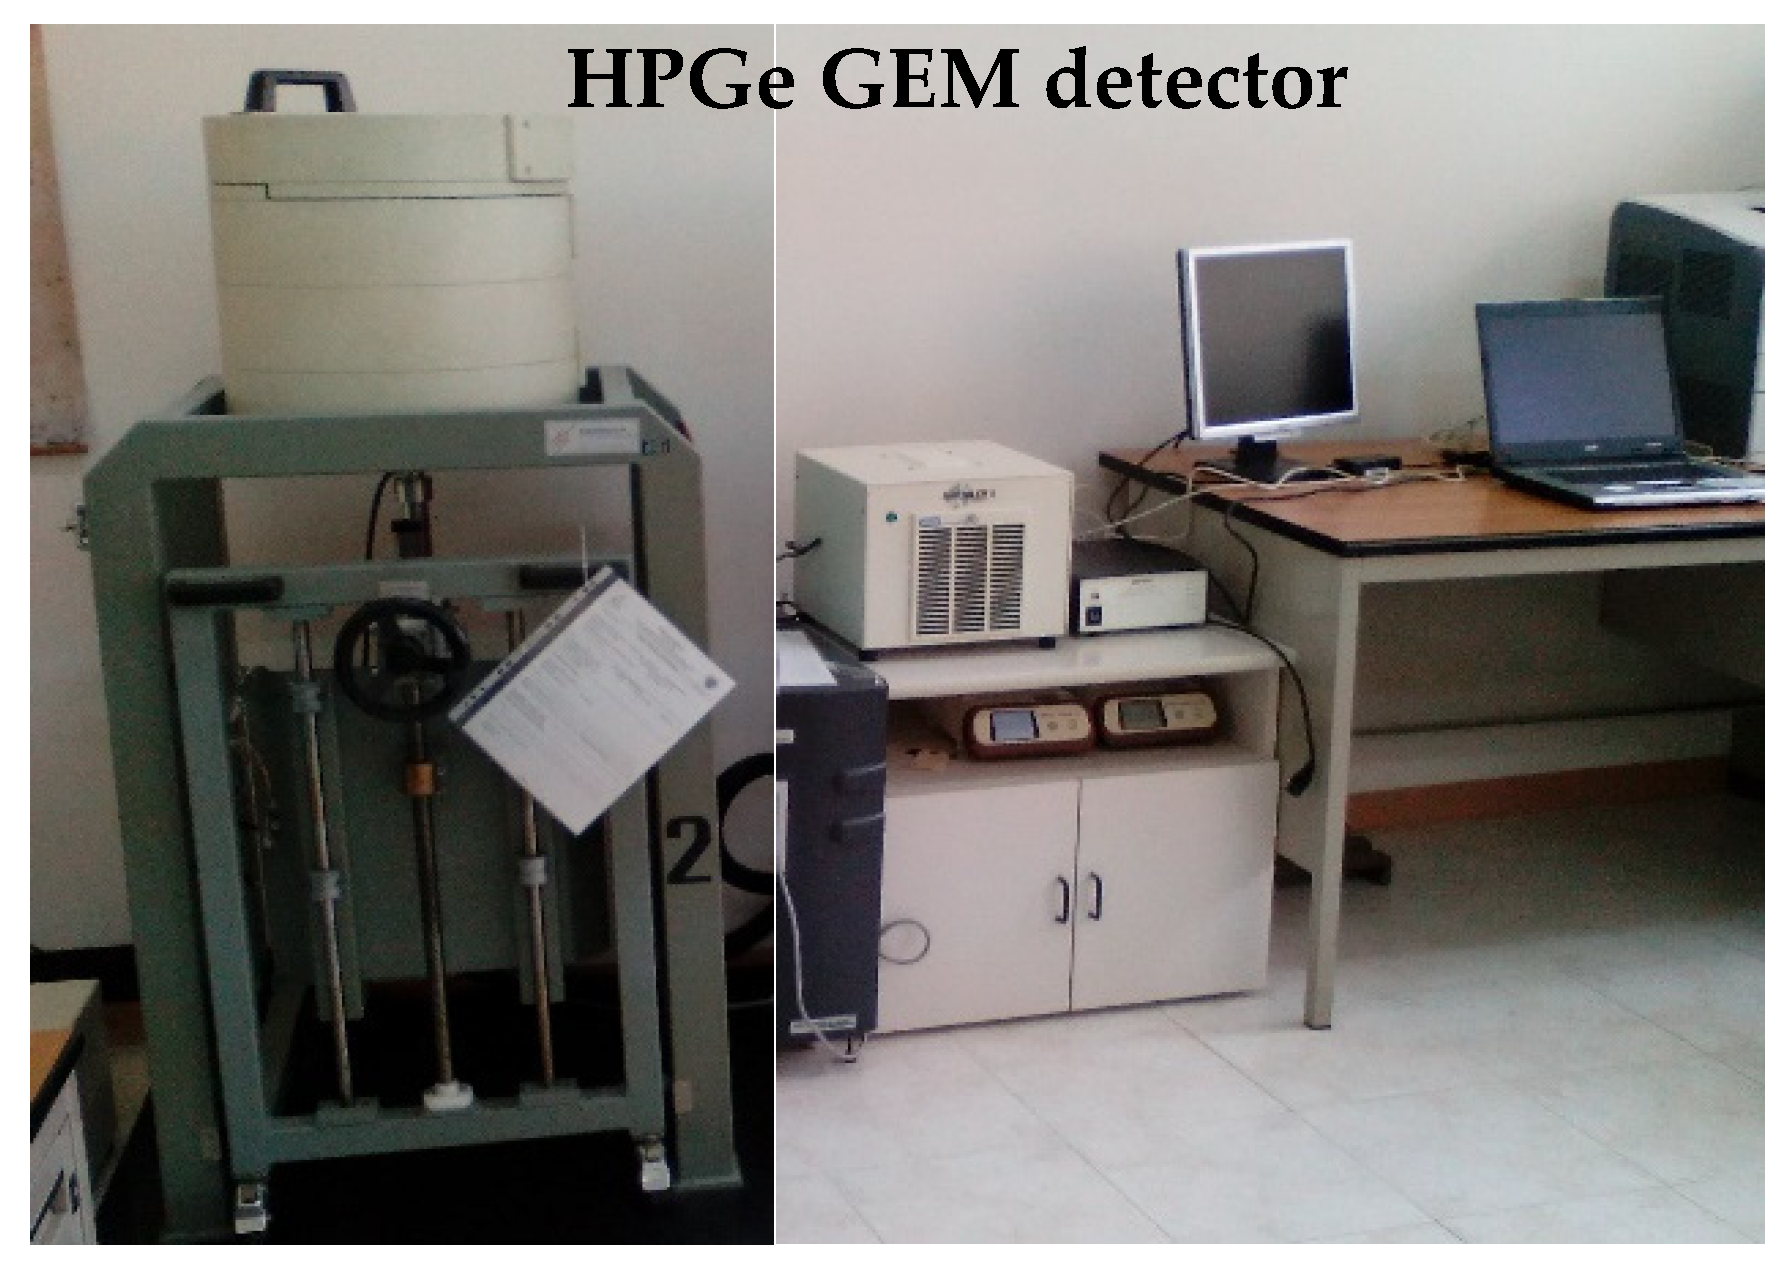
2.2. Gamma Spectrometry Analysis and Radiological Hazard Effects Assessment

For the gamma spectrometry investigations, samples were packed in a 20 mL polyethylene plastic vial to reach a geometry homogeneity around the detector; then, the respective net weights were measured and recorded. After this preparation step, they were counted for 70,000 s, and spectra were analyzed in order to obtain the activity concentration of 137Cs and 40K, through the evaluation of their γ-lines at 661.66 keV and 1460.81 keV, respectively. A positively-biased Ortec HPGe detector (GEM) (FWHM of 1.85 keV; peak-to-Compton ratio of 64:1; relative efficiency of 40% at the 1.33 MeV 60Co γ-line), placed inside lead wells to shield the background radiation environment, was employed for the analysis. A photo of the experimental setup is reported in Figure 2.
A multipeak Marinelli geometry gamma source (AK-5901) of 1 L capacity, covering the energy range 59.54–1836 keV, customized to reproduce the exact geometries of samples in a water-equivalent epoxy resin matrix, was employed for efficiency and energy calibrations. The ANGLE 4 code was employed for the efficiency transfer factor calculations to the 20 mL vial sample holder geometry [33]. For data acquisition and analysis, Gamma Vision (Ortec) software was used [34].
The activity concentration (C) of each detected radionuclide was calculated according to the following [35,36]:
C = N E ε E t γ d M  
where N E indicates the net area of the radioisotope photopeak; ε E and γ d are the efficiency and yield of the photopeak, respectively; M is the mass sample (g); and t is the lifetime (s).
The resulting uncertainty of each measurement, with coverage factor k = 2, was calculated, taking into account the uncertainty of the counting estimation, of the calibration source, of the efficiency calibration, of the background subtraction, and of the γ-branching ratio [37].
The quality of the gamma spectrometry experimental results was certified by the Italian Accreditation Body (ACCREDIA) [38].
This implies the continued verification (with annual periodicity) of the maintenance of the gamma spectrometry method performance characteristics.
The repeatability of the results, in particular, is verified over time with the double test method. A certified reference material (also containing the radionuclides 40K and 137Cs) is analyzed twice, with the active concentration of the radionuclide of interest defined as x1 (first measurement) and x2 (second measurement). The probability level p = 0.95 is considered. The following formula is applied:
| x 1 x 2 | 2 · s r · t
where t is the Student variable, and sr is the standard deviation of repeatability obtained in the validation phase.
To evaluate radiological hazard effects, the effective dose for flour ingestion was calculated [39]:
D i n g ( Sv y ) = h i n g , K 40 × J i n g , K 40  
where hing,K-40 is the coefficient of the effective dose for the insertion unit for ingestion of 40K (Sv Bq−1), and Jing,K-40 is the intake of 40K (Bq year−1) [40]. The latter value is obtained by multiplying the yearly flour consumption for the mean activity concentration of the investigated radionuclide experimentally measured.

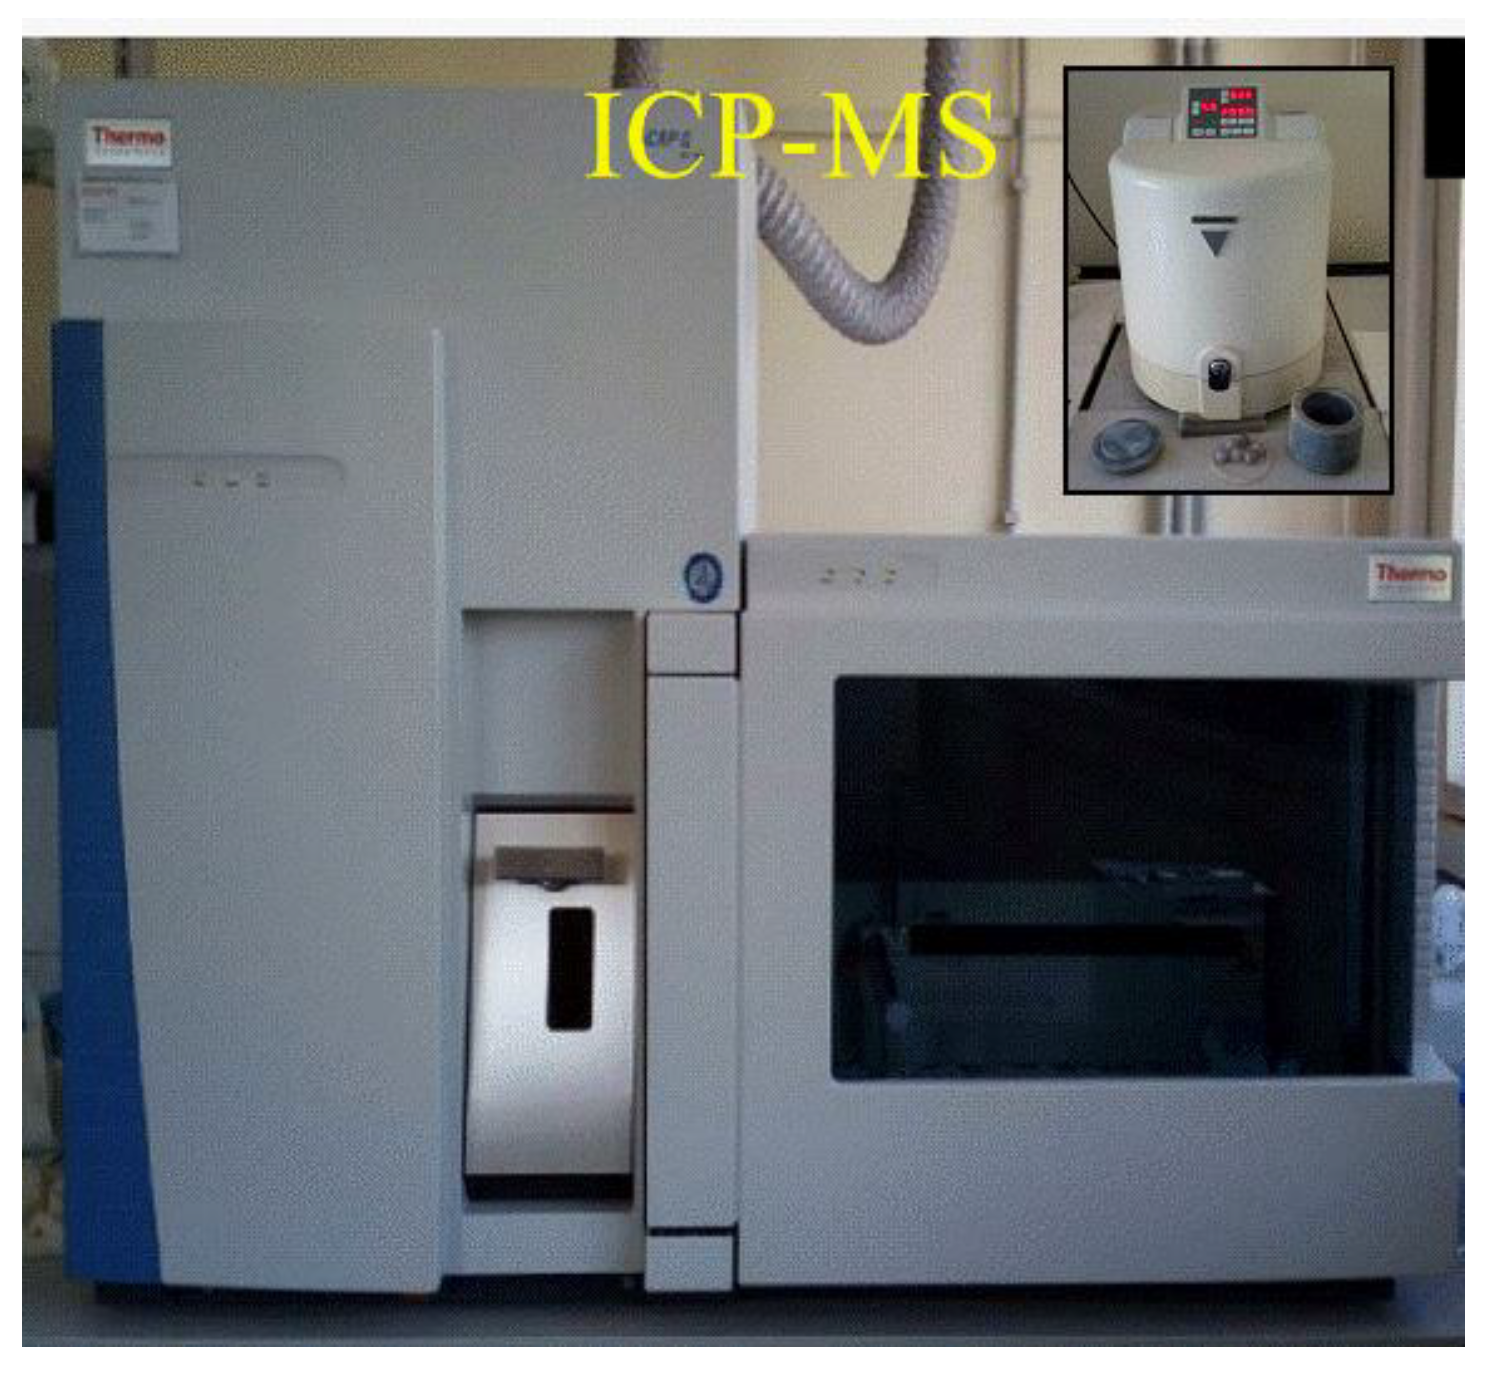
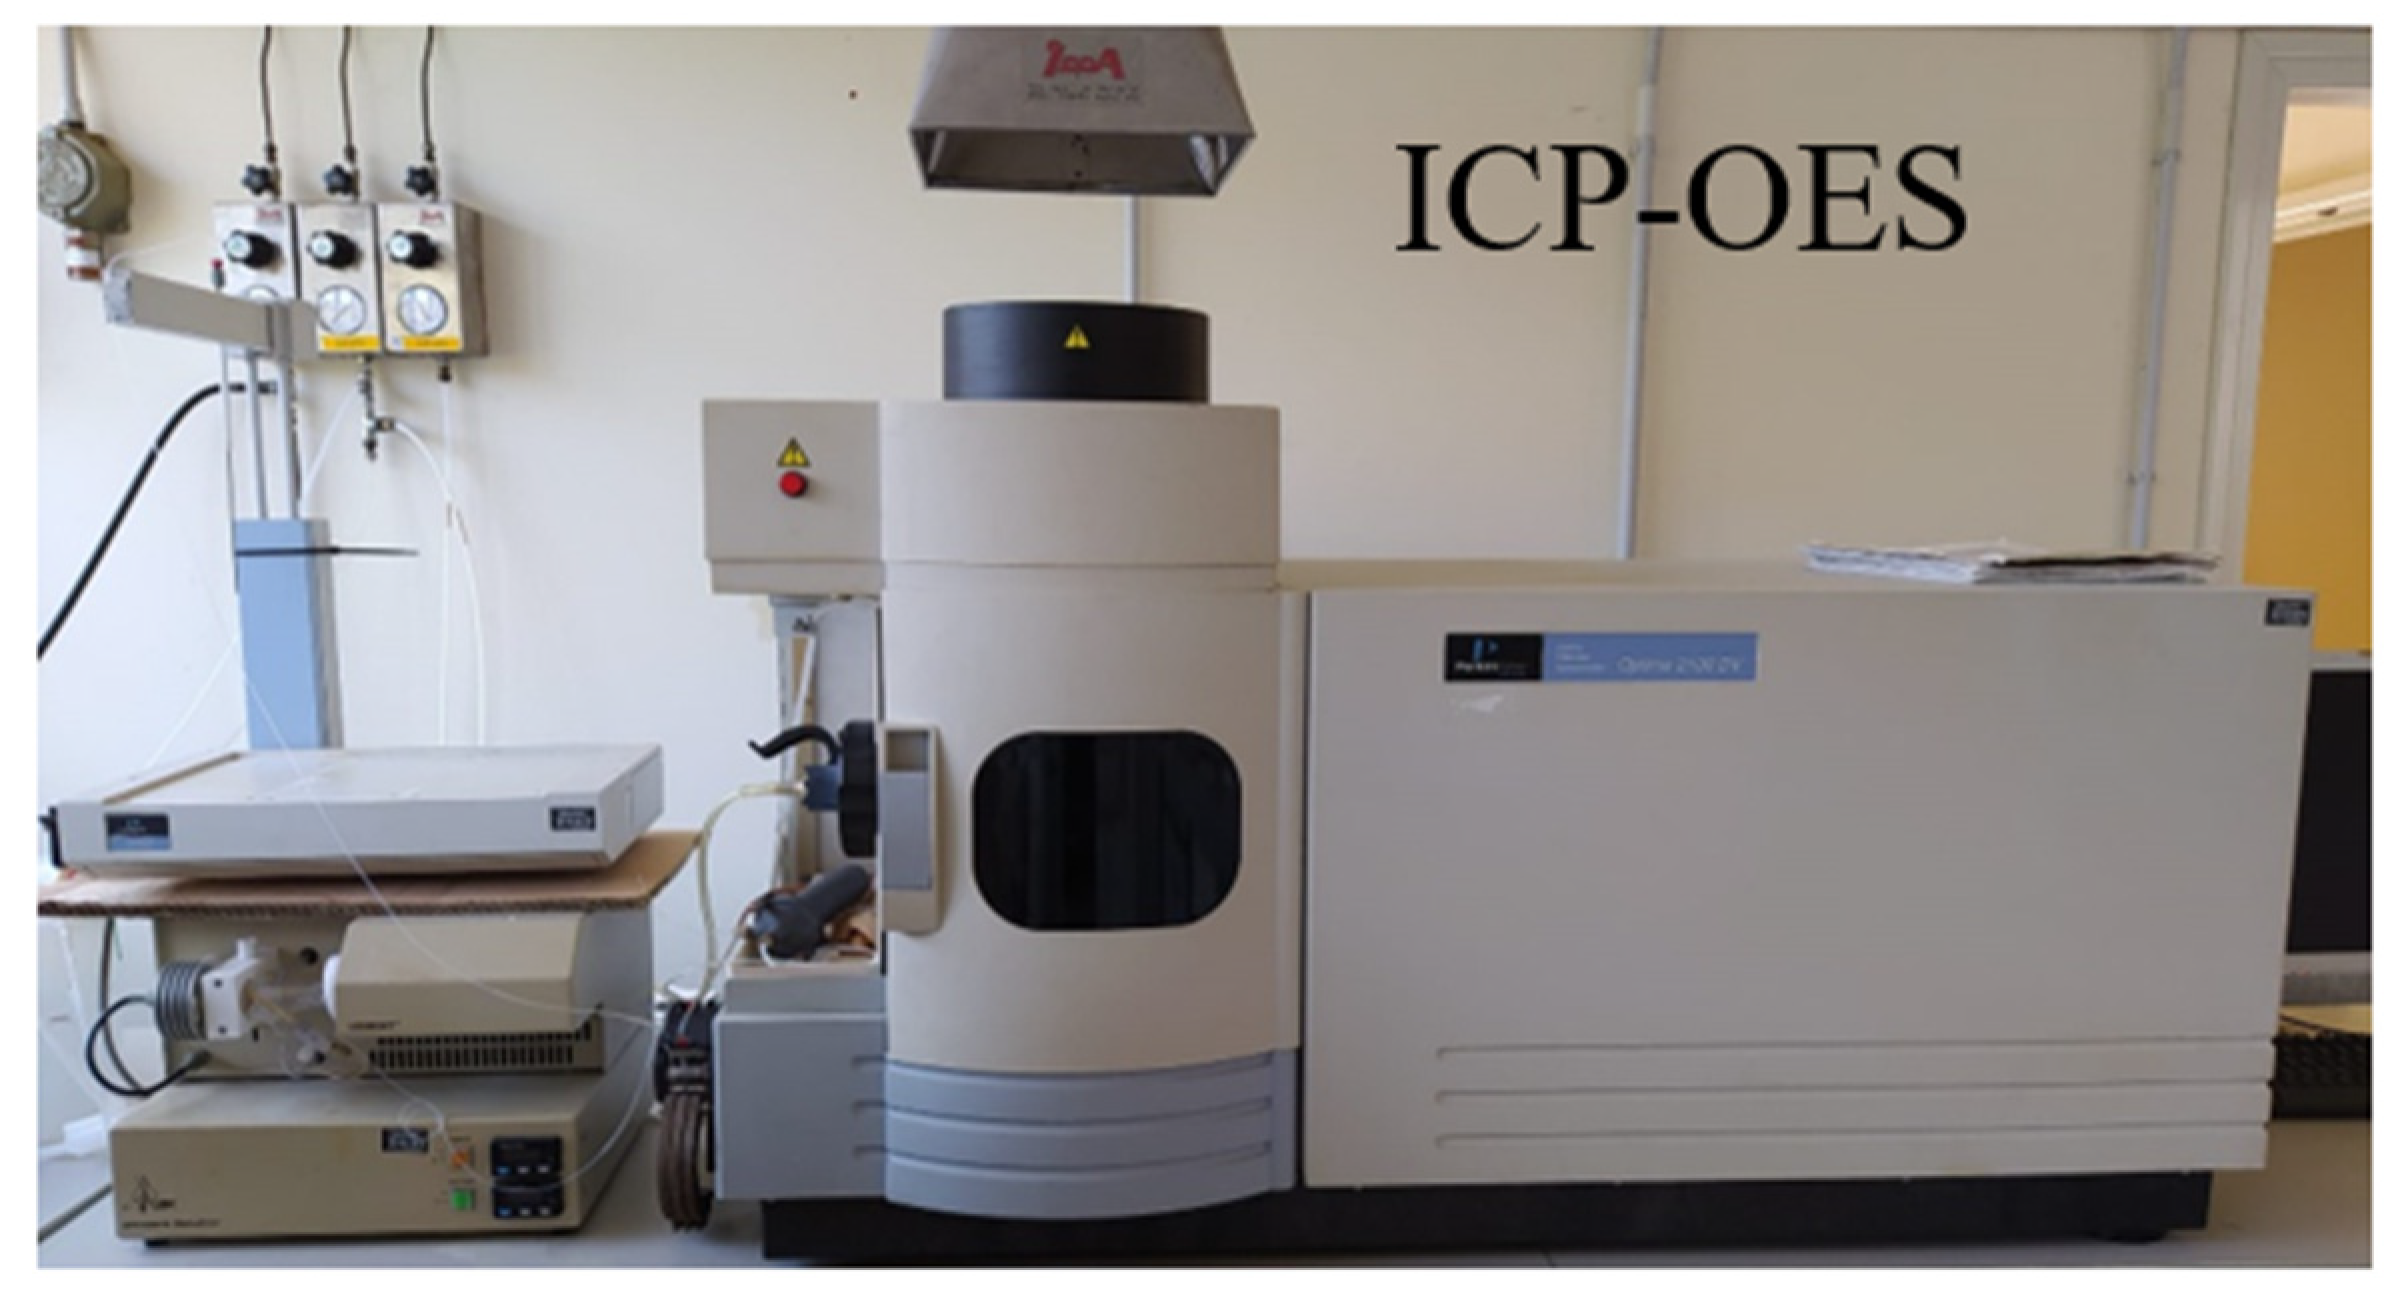
2.3. ICP-MS and ICP-OES Analysis

For the analysis, approximately 0.5–1.0 g of sample, together with 5 mL of ultrapure (for trace analysis) HNO3 (67–69%) and 1 mL of hydrogen peroxide (H2O2), as well as 5 mL of ultrapure water, were directly introduced into a 100 mL TFM vessel. Acid digestion was performed using a Milestone microwave system, Ethos 1, in four steps: 5 min at 1000 W and 85 °C, 10 min at 1000 W and 145 °C, 4 min at 1000 W and 180 °C, 15 min at 1000 W, and cooling [41]. The mixture was filtered and filled up to 100 mL with distilled H2O.
ICP-MS calibration solutions for the analytes measured at 1, 5, 10, 100, and 200 ppb for As, Be, Cd, Cu, Pb, and Zn, as well as at 0.2, 0.5, 1.0, 2.0, and 3.0 ppb for Hg, were prepared by opportune dilutions of two different reference materials (o2si Multi-element aqueous RM 100 mL 20 µg mL−1, and o2si Single-element Mercury Hg aqueous RM 100 mL 1007 µg mL−1) in 0.5 % (v/v) HNO3 and 0.5% (v/v) HCl [42]. Internal standardization was applied, with an internal standard at 20 ppb, added on-line via a T-piece before the nebulizer. For the ICP-MS measurements a Thermo Scientific iCAP Qc ICP-MS was used [43] (see Figure 3).
The sample introduction system consisted of a cooled (3 °C) Peltier, a baffled cyclonic spray chamber, a PFA nebulizer, and a quartz torch with a 2.5 mm i.d. removable quartz injector. The instrument operated in a single collision cell mode, with kinetic energy discrimination (KED), using pure He as collision gas. All samples were presented for analysis using a Cetac ASX-520. The iCAP Qc ICP-MS operated in a single KED mode using 1550 W forward power, 0.98 L min−1 nebulizer gas, 0.8 L min−1 auxiliary gas, 14.0 L min−1 cool gas flow, 4.5 mL min−1 He collision cell gas, 45 s each for sample uptake/wash time, optimized dwell times per analyte (0.1 s, except 0.5 s for As), one point per peak, and three repeats per sample.
For the ICP-OES measurements, a Perkin Elmer Optima 2100 DV was employed [44] (see Figure 4).
The operating conditions were 1450 W RF power, 15 L min−1 plasma gas flow rate, 0.2 L min−1 auxiliary gas flow rate, 0.8 L min−1 nebulizer gas flow rate, 1.5 L min−1 sample flow rate, 50 s read delay, CCD detector, and nitrogen purge gas, with 589.592 nm (Na), 285.213 nm (Mg), 317.933 nm (Ca) wavelengths.

2.4. Multivariate Statistical Analysis

The Microcal Origin software for Windows (Northampton, MA, United States, ver. 2018) was used for all statistical calculations [45]. A statistical analysis was conducted, starting on a multivariate matrix, where variables were the average concentrations of detected elements (P, Mg, Ca, Na, Fe, Zn, Mn, Cu, Ni), and the cases were the eleven analyzed flour samples.
With the aim of unambiguously correlating flour samples to their botanical origin, according to their elemental concentrations, an exploratory method (principal components analysis, PCA) was performed. It ensures the reduction of the data dimensionality, whereas the combinations of variables identified by the PCs provide the greatest contribution to sample variability. Before the elaboration, the appropriateness of the data set was preliminarily checked by the Bartlett test (sphericity test), as already reported in a previous work [46].

3. Results and Discussion

3.1. Radioactivity Analysis

The activity concentration of 40K in the investigated flour samples, as calculated by Equation (1), is reported in Table 2 as mean value ± standard deviation for each type of flour.
The highest value refers to chestnut flour. This may reasonably reflect the different composition of the two investigated flours, reported to have 847 mg and 171 mg of potassium per 100 g of sample [47,48], respectively.
Regarding 137Cs, its activity concentration in all analyzed samples, reported in Table 2, turned out to be lower than the minimum detectable activity value, thus excluding an anthropogenic radioactive contamination of the investigated samples.

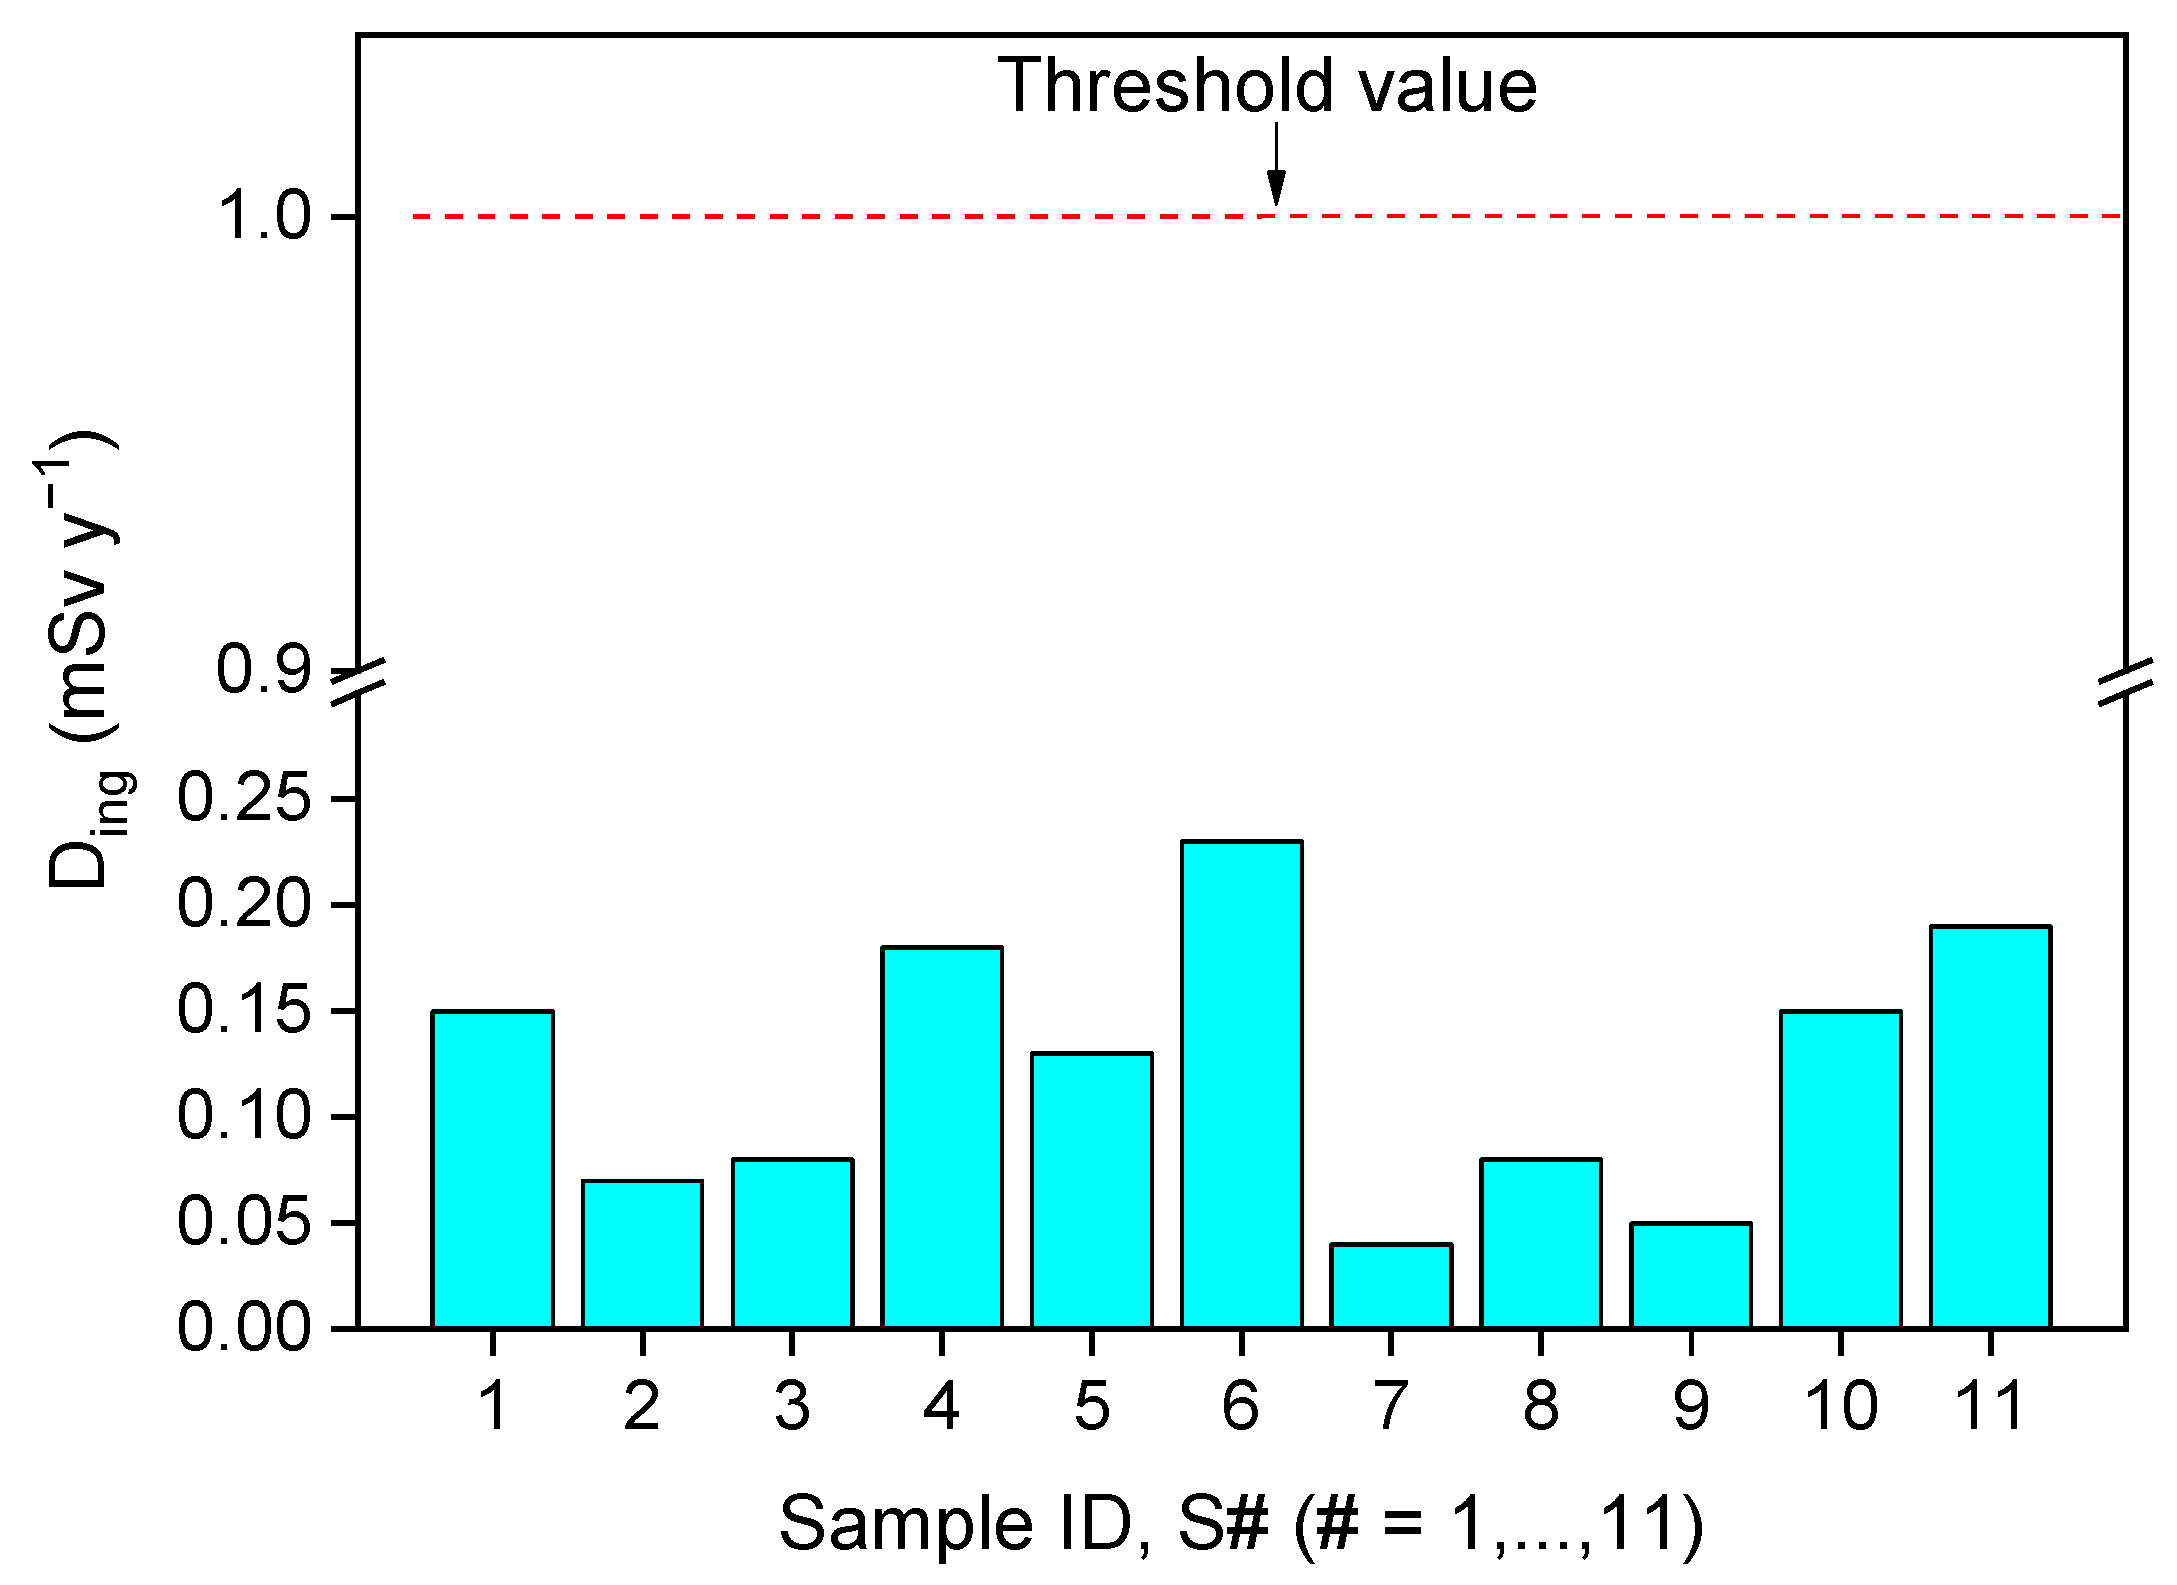
3.2. The Annual Effective Dose for Food Ingestion

Table 3 reports the estimation of the annual effective dose due to the ingestion of investigated samples, Ding, as calculated by Equation (2), for the age category higher than 17 years.
Reported values take into account the average yearly consumption of flour in Italy, assumed to be of about 85 kg, taking into consideration its use to produce bread, pizza, and baked goods [49,50], making the hypothesis that this need was satisfied from a single type of flour. For each type of investigated flour, Table 3 also shows the percentage values of the aforementioned doses with respect to the total (external + internal) natural radioactivity value for humans, expressed in terms of effective dose, equal to 2.4 mSv y−1 [51]. Noteworthily, the calculated annual effective doses for all investigated flour types were under the threshold level of 1 mSv y−1 imposed by the legislation [51] (see Figure 5).
Therefore, no risk to humans due to ionizing radiations can be associated with the flour ingestion.

3.3. Heavy Metal Analysis

Table 4 reports Cd and Pb mean concentrations (mg kg−1) for each type of investigated flour, as obtained through ICP-MS analysis.
As can be seen from the table, the experimental values are lower than the contamination thresholds established by the commission regulations [52]. Therefore, Cd and Pb cannot be considered as pollutants, and are generally expected not to cause severe effects on human health.

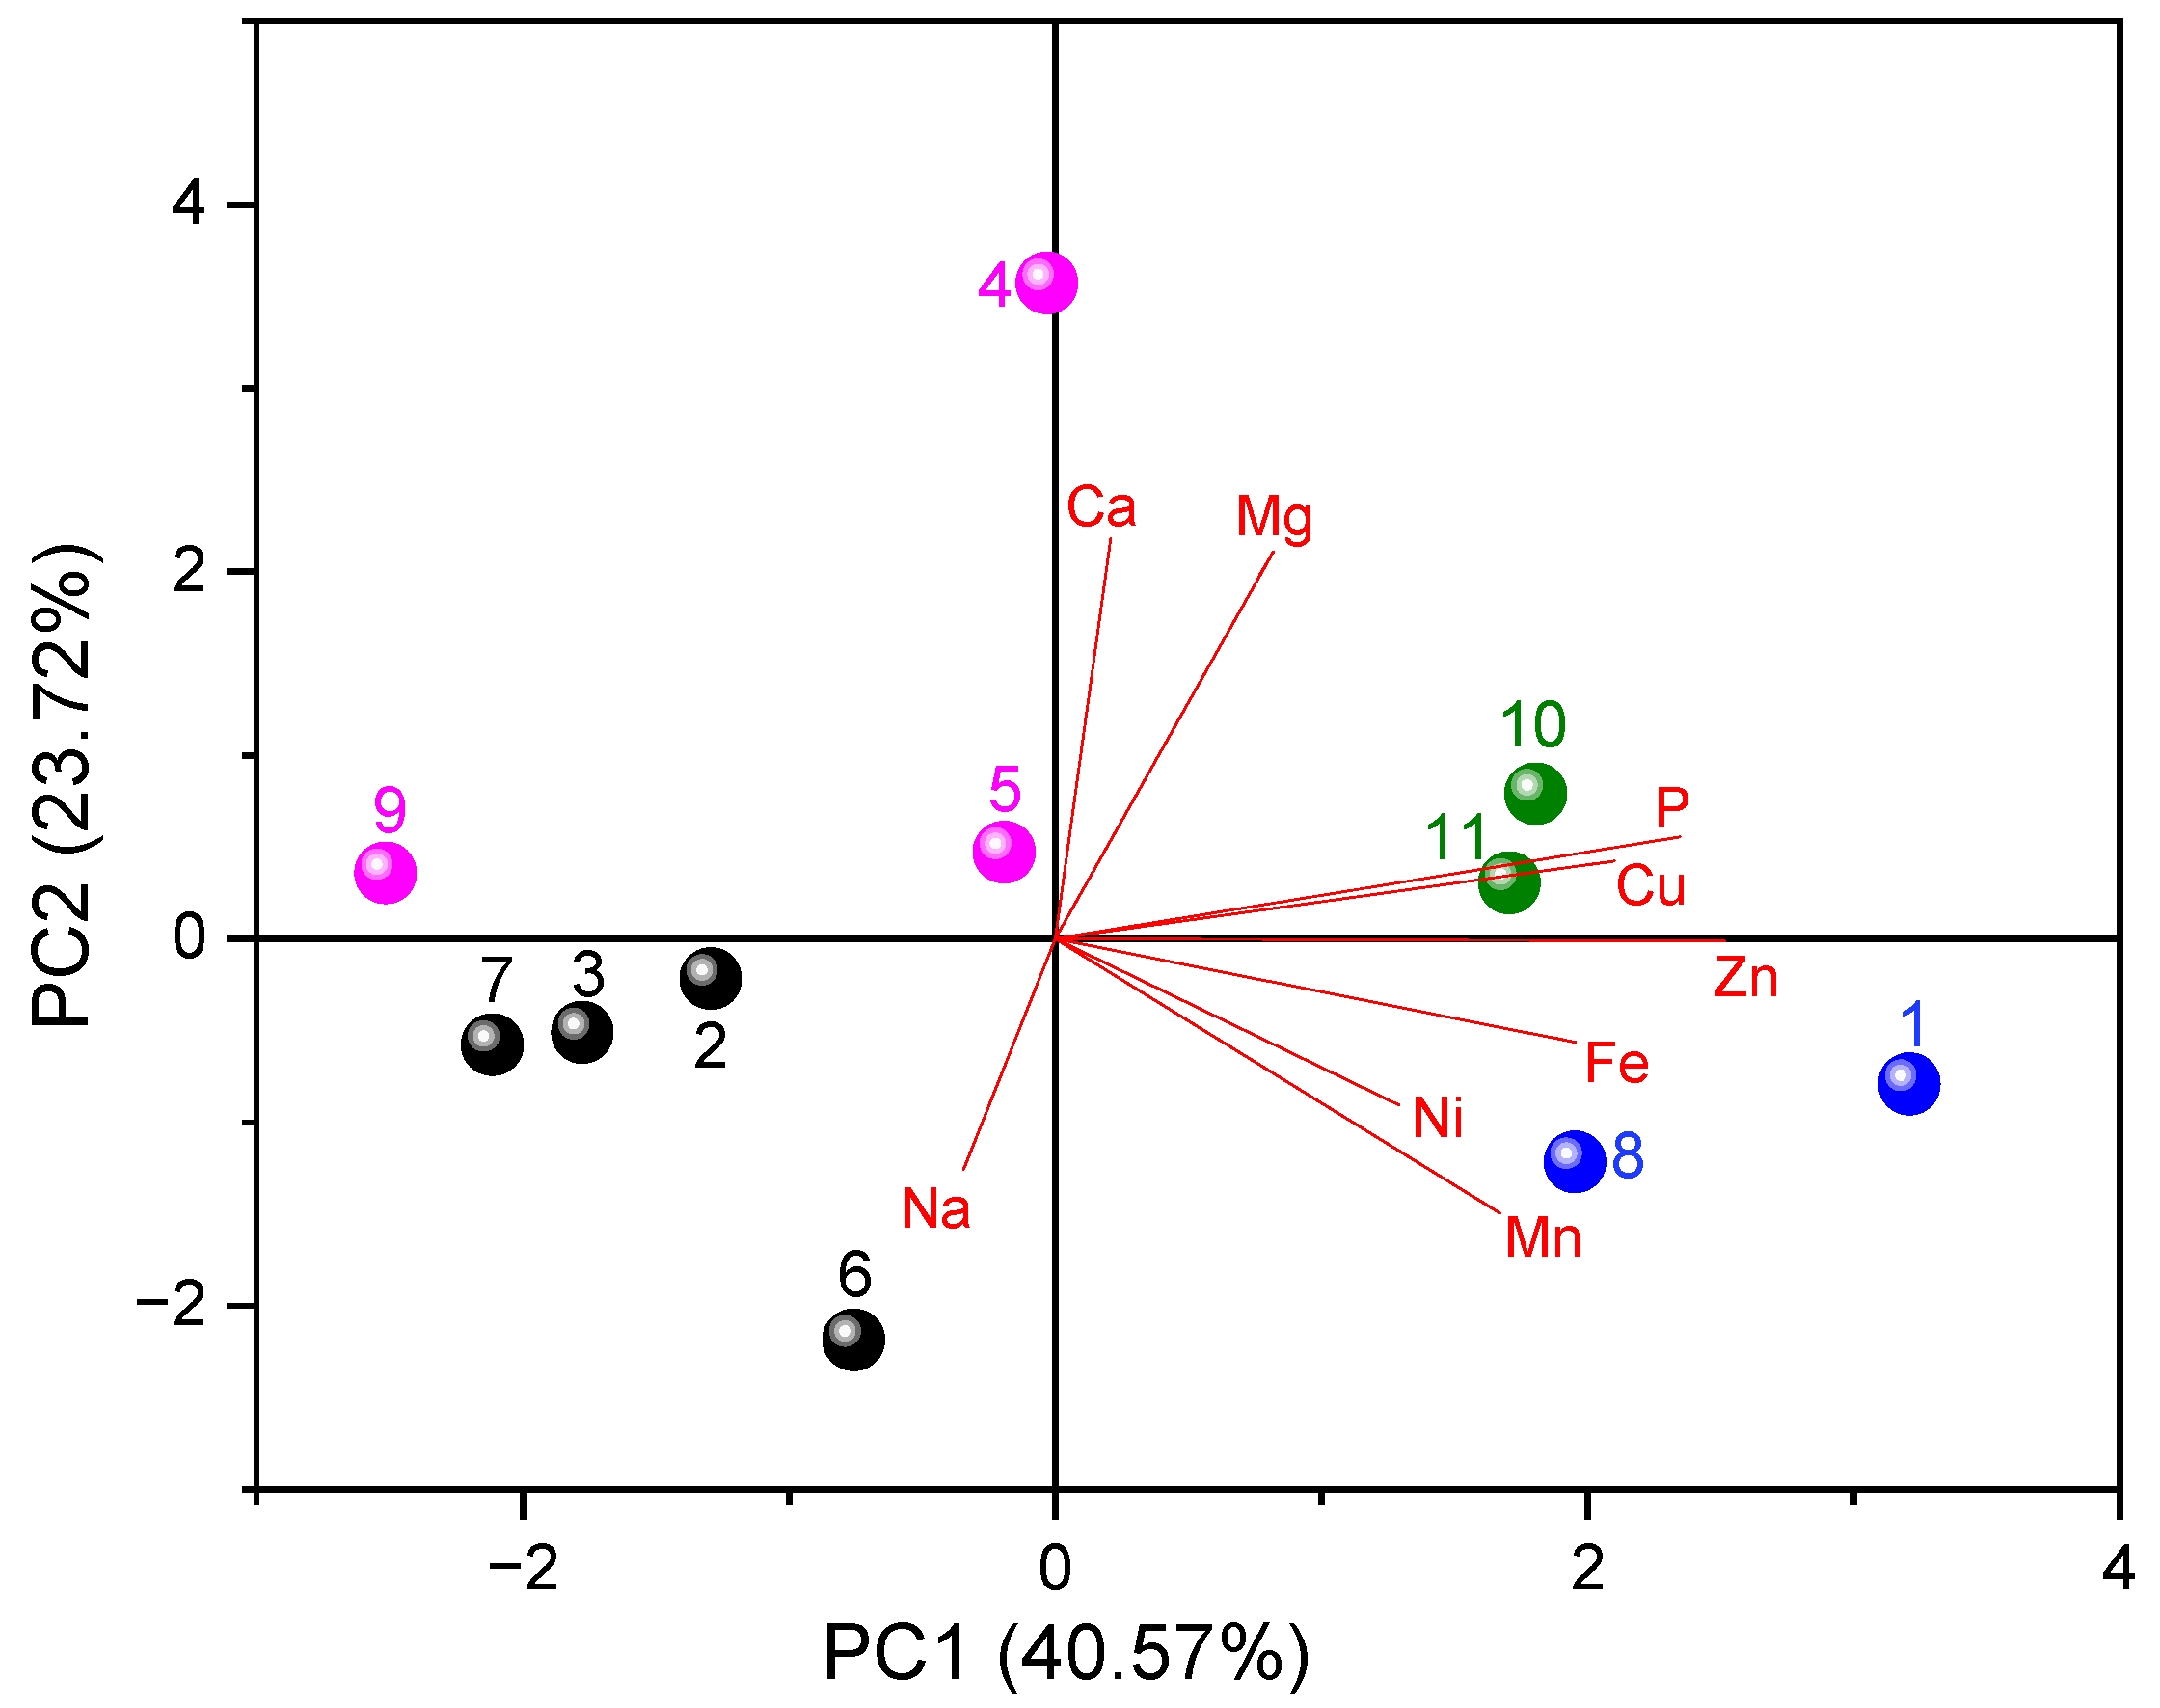
3.4. Elemental and Chemometric Analysis

Table 5 reports the elemental composition of the analyzed flour samples.
In particular, macro- (P, Mg, Ca) and micro-inorganic minerals (Na, Fe, Zn, Mn, Cu, Ni) determined by ICP-OES and ICP-MS were tabulated; their average concentrations were in good agreement with values reported in literature [53].
As reported [48], the presence of inorganic minerals in flour samples is strictly correlated with the plant or fruit of origin. In order to unambiguously establish this correlation, PCA was conducted, considering nine variables and eleven cases. Preliminarily, the measure of sampling adequacy and Bartlett’s test of sphericity were carried out to verify the suitability of the data for factor analysis. Test results suggest that the correlation matrix was factored and appropriate for PCA. By using the Kaiser criterion, two principal components (PC1 and PC2) with eigenvalues exceeding one were extracted, representing the 40.57% and 23.72% of total variance, respectively.
PCA results reveal the presence of four different groups, reported in the bi-plot of Figure 6.
The groups appear to be comparable to each other in terms of macro- and micro- element concentration. Specifically, four groups were recognized: group I (containing samples S10 and S11, green points) and IV (containing samples S1 and S8, blue points) refer to flours that turned out to be positively correlated, as far as PC1 is concerned, with Ca, Mg, P, Cu, Zn, Fe, Ni, and Mn, and negatively correlated with Na. Regarding PC2, flours in group I exhibited a positive correlation with values of Cu, P, Mg, and Ca contents, and a negative correlation with other variables. The opposite occurred for flours in group IV. Continuing on, group II (containing samples S4, S5, and S9, purple points) and III (containing samples S2, S3, S6, and S7, black points) refers to flours that turned out to be negatively correlated, as far as PC1 is concerned, with Ca, Mg, P, Cu, Zn, Fe, Ni, and Mn, and positively correlated with Na. Regarding PC2, flours in group II exhibited a positive correlation with the values of the Cu, P, Mg, and Ca contents, and a negative correlation with other variables. The opposite occurs for flours in group III.
The differences in the average concentrations of P, Mg, Ca, Na, Fe, Zn, Mn, Cu, and Ni revealed among the identified groups strictly depend on the compositional features of the plant or fruit from which the analyzed flours derive. In the light of this, the obtained results could potentially be helpful to the producers to warn against food fraud, ensure flour quality, and inform the customers about sensitive parameters to be used potentially in the traceability process, in order to build up several fingerprints able to ensure the healthy effects of these products.

4. Conclusions

In this article, radiation levels, metals contamination, and inorganic mineral content in flours were measured; this is extremely important, due to their high consumption by the population for nutritional use.
The specific activity of the main natural radionuclide present in flour, 40K, was measured using HpGe gamma spectrometry, with the aim of estimating the health risk for the age category higher than 17 years by the assessment of the effective dose due to flour ingestion. The coefficient of the effective dose for ingestion reported by Italian Legislative Decree 101/20 was employed. The estimation of the annual effective dose was found to be in the range 0.04–0.23 mSv y−1, about 1.6–9.6% of the total natural radioactivity value for humans (2.4 mSv y−1) and under the threshold level (1 mSv y−1), thus excluding the risk of ionizing radiation effects on humans. The 137Cs activity concentration was lower than the minimum detectable activity value for all analyzed samples, thus excluding its presence as pollutant.
As far as the heavy metal (Cd and Pb) concentration is concerned, it was lower than the contamination threshold value, thus excluding their presence as contaminants.
The PCA multivariate statistical analysis, performed starting from the inorganic minerals content in the investigated samples, showed how it is possible to discriminate among them, with a strict dependance on the compositional features of the plant or fruit from which the analyzed flours derive, thus representing a powerful tool to guarantee the product authenticity to the consumers.

Author Contributions

Conceptualization, F.C. and V.V.; methodology, F.C. and V.C.; validation, D.M.; formal analysis, G.A., M.D., A.B., S.M. and M.M.; investigation, F.C., G.A., G.P. and V.V.; resources, F.C., V.C. and D.M.; data curation, F.C.; writing—original draft preparation, F.C.; supervision, D.M., V.C. and V.V. All authors have read and agreed to the published version of the manuscript.

Funding

This research received no external funding.

Institutional Review Board Statement

Not applicable.

Informed Consent Statement

Not applicable.

Data Availability Statement

Not applicable.

Conflicts of Interest

The authors declare no conflict of interest.

References

  1. Caridi, F.; Marguccio, S.; D’Agostino, M.; Belvedere, A.; Belmusto, G. Natural radioactivity and metal contamination of river sediments in the Calabria region, south of Italy. Eur. Phys. J. Plus 2016, 131, 1–10. [Google Scholar] [CrossRef]
  2. Caridi, F.; D’Agostino, M.; Marguccio, S.; Belvedere, A.; Belmusto, G.; Marcianò, G.; Sabatino, G.; Mottese, A. Radioactivity, granulometric and elemental analysis of river sediments samples from the coast of Calabria, south of Italy. Eur. Phys. J. Plus 2016, 131, 1–8. [Google Scholar] [CrossRef]
  3. Ravisankar, R.; Chandrasekaran, A.; Vijayagopal, P.; Venkatraman, B.; Senthilkumar, G.; Eswaran, P.; Rajalakshmi, A. Natural radioactivity in soil samples of Yelagiri Hills, Tamil Nadu, India and the associated radiation hazards. Radiat. Phys. Chem. 2012, 81, 1789–1795. [Google Scholar] [CrossRef]
  4. Fadlalla, H.E. Radioactivity Levels of Basic Foodstuffs Anddose Estimates in Sudan. Master’s Thesis, University of Khartoum, Khartoum, Sudan, 2005; p. 60. [Google Scholar]
  5. Mlwilo, N.A.; Mohammed, N.K.; Spyrou, N.M. Radioactivity levels of staple foodstuffs and dose estimates for most of the Tanzanian population. J. Radiol. Prot. 2007, 27, 471–480. [Google Scholar] [CrossRef]
  6. Caridi, F.; Messina, M.; Belvedere, A.; D’Agostino, M.; Marguccio, S.; Settineri, L.; Belmusto, G. Food Salt Characterization in Terms of Radioactivity and Metals Contamination. Appl. Sci. 2019, 9, 2882. [Google Scholar] [CrossRef] [Green Version]
  7. Ramachandran, T.; Mishra, U. Measurement of natural radioactivity levels in Indian foodstuffs by gamma spectrometry. Int. J. Radiat. Appl. Instrum. 1989, 40, 723–726. [Google Scholar] [CrossRef]
  8. Júnior, J.A.S.; Cardoso, J.J.R.F.; Silva, C.M. Radioactivity levels of basic foodstuffs and dose estimates in Sudan. J. Radioanal. Nucl. Chem. 2006, 269, 451–455. [Google Scholar] [CrossRef]
  9. Caridi, F.; Pappaterra, D.; Belmusto, G.; Messina, M.; Belvedere, A.; D’Agostino, M.; Settineri, L.; Agostino, D. Radioactivity and Heavy Metals Concentration in Italian (Calabrian) DOC Wines. Appl. Sci. 2019, 9, 4584. [Google Scholar] [CrossRef] [Green Version]
  10. Albergamo, A.; Bua, G.D.; Rotondo, A.; Bartolomeo, G.; Annuario, G.; Costa, R.; Dugo, G. Transfer of major and trace elements along the “farm-to-fork” chain of different whole grain products. J. Food Compos. Anal. 2018, 66, 212–220. [Google Scholar] [CrossRef]
  11. Di Bella, G.; Naccari, C.; Bua, G.D.; Rastrelli, L.; Lo Turco, V.; Potortì, A.G.; Dugo, G. Mineral composition of some varieties of beans from Mediterranean and Tropical areas. Int. J. Food Sci. Nutr. 2016, 67, 239–248. [Google Scholar] [CrossRef]
  12. Sette, S.; D’Addezio, L.; Piccinelli, R.; Hopkins, S.; Le Donne, C.; Ferrari, M.; Mistura, L.; Turrini, A. Intakes of whole grain in an Italian sample of children, adolescents and adults. Eur. J. Nutr. 2015, 56, 521–533. [Google Scholar] [CrossRef] [Green Version]
  13. Dona, A.; Dourakis, S.; Papadimitropoulos, B.; Maravelias, C.; Koutselinis, A. Flour Contamination as a Source of Lead Intoxication. J. Toxicol. Clin. Toxicol. 1999, 37, 109–112. [Google Scholar] [CrossRef]
  14. Caridi, F.; Marguccio, S.; Belvedere, A.; D’Agostino, M.; Belmusto, G. The Natural Radioactivity in Food: A Comparison Between Different Feeding Regimes. Curr. Nutr. Food Sci. 2019, 15, 493–499. [Google Scholar] [CrossRef]
  15. Mottese, A.F.; Fede, M.R.; Caridi, F.; Sabatino, G.; Marcianò, G.; Ravenda, P.; Gaetano, A.D.; Dugo, G. Fingerprint of PGI Mantova Cucumis melo by ICP-MS and Chemometric Analysis. Curr. Nutr. Food Sci. 2020, 17, 94–104. [Google Scholar] [CrossRef]
  16. Acri, G.; Sansotta, C.; Ruello, E.V.; Denaro, L.; Salmeri, F.M.; Testagrossa, B. The Use of Time Domain NMR in Food Analysis: A Review. Curr. Nutr. Food Sci. 2020, 16, 1–9. [Google Scholar] [CrossRef]
  17. Mottese, A.F.; Fede, M.R.; Caridi, F.; Sabatino, G.; Marcianò, G.; Calabrese, G.; Albergamo, A.; Dugo, G. Chemometrics and innovative multidimensional data analysis (MDA) based on multi-element screening to protect the Italian porcino (Boletus sect. Boletus) from fraud. Food Control. 2020, 110, 107004. [Google Scholar] [CrossRef]
  18. Caridi, F.; D’Agostino, M.; Belvedere, A.; Mottese, A.F. Multi-element Analysis and Geographical Origin Classification of Italian (Calabrian) Wines. Curr. Nutr. Food Sci. 2020, 16, 1259–1264. [Google Scholar] [CrossRef]
  19. Acri, G.; Testagrossa, B.; Vermiglio, G. FT-NIR analysis of different garlic cultivars. J. Food Meas. Charact. 2015, 10, 127–136. [Google Scholar] [CrossRef]
  20. Italian Legislation D.Lgs. 101/20. Available online: http://www.gminternational.net/en/legislative-decree-101-of-31-07-20-transposes-in-italy-the-directive-2013-597-euratom-on-the-controls-on-ionizing-radiation-which-is-the-impact/ (accessed on 18 April 2021).
  21. Gómez, M.; Gutkoski, L.C.; Bravo‐Núñez, Á. Understanding whole-wheat flour and its effect in breads: A review. Compr. Rev. Food Sci. Food Saf. 2020, 19, 3241–3265. [Google Scholar] [CrossRef]
  22. Jafarzadeh, S.; Alias, A.K.; Ariffin, F.; Mahmud, S. Physico-mechanical and microstructural properties of semolina flour films as influenced by different sorbitol/glycerol concentrations. Int. J. Food Prop. 2018, 21, 983–995. [Google Scholar] [CrossRef]
  23. Panasiti, I.; Costa, S.; Caminiti, L.; Crisafulli, G.; Pajno, G.B.; Pellegrino, S.; Testagrossa, B.; Acri, G. Association of wheat Allergy and Coeliac Disease Through Pediatric and Adult Age: A Review of Literature. Curr. Nutr. Food Sci. 2020, 16, 1–6. [Google Scholar] [CrossRef]
  24. Wu, T.; Wang, L.; Li, Y.; Qian, H.; Liu, L.; Tong, L.; Zhou, X.; Wang, L.; Zhou, S. Effect of milling methods on the properties of rice flour and gluten-free rice bread. LWT 2019, 108, 137–144. [Google Scholar] [CrossRef]
  25. Prasanna Priyantha Gunathilake, K.D.; Yalegama, C.; Kumara, A.A.N. Use of coconut flour as a source of protein and dietary fiber in wheat bread. Asian J. Food Agro-Ind. 2009, 2, 382–391. [Google Scholar]
  26. Martínez, M.L.; Marín, M.A.; Gili, R.D.; Penci, M.C.; Ribotta, P.D. Effect of defatted almond flour on cooking, chemical and sensorial properties of gluten-free fresh pasta. Int. J. Food Sci. Technol. 2017, 52, 2148–2155. [Google Scholar] [CrossRef]
  27. Littardi, P.; Paciulli, M.; Carini, E.; Rinaldi, M.; Rodolfi, M.; Chiavaro, E. Quality evaluation of chestnut flour addition on fresh pasta. LWT 2020, 126, 109303. [Google Scholar] [CrossRef]
  28. Ciudad-Mulero, M.; Barros, L.; Fernandes, A.; Ferreira, I.C.F.R.; Callejo, M.; Matallana-González, M.; Fernández-Ruiz, V.; Morales, P.; Carrillo, J.M. Potential Health Claims of Durum and Bread Wheat Flours as Functional Ingredients. Nutrients 2020, 12, 504. [Google Scholar] [CrossRef] [Green Version]
  29. Rasane, P.; Jha, A.; Sabikhi, L.; Kumar, A.; Unnikrishnan, V.S. Nutritional advantages of oats and opportunities for its processing as value added foods—A review. J. Food Sci. Technol. 2013, 52, 662–675. [Google Scholar] [CrossRef] [PubMed] [Green Version]
  30. Gwirtz, J.A.; Garcia-Casal, M.N. Processing maize flour and corn meal food products. Ann. N. Y. Acad. Sci. USA 2013, 1312, 66–75. [Google Scholar] [CrossRef] [Green Version]
  31. Stępniewska, S.; Słowik, E.; Cacak-Pietrzak, G.; Romankiewicz, D.; Szafrańska, A.; Dziki, D. Prediction of rye flour baking quality based on parameters of swelling curve. Eur. Food Res. Technol. 2017, 244, 989–997. [Google Scholar] [CrossRef] [Green Version]
  32. Martínez, M.L.; Fabani, M.P.; Baroni, M.V.; Huaman, R.N.M.; Ighani, M.; Maestri, D.M.; Wunderlin, D.; Tapia, A.; Feresin, G.E. Argentinian pistachio oil and flour: A potential novel approach of pistachio nut utilization. J. Food Sci. Technol. 2016, 53, 2260–2269. [Google Scholar] [CrossRef] [Green Version]
  33. Caridi, F.; D’Agostino, M.; Belvedere, A.; Marguccio, S.; Belmusto, G. Radon radioactivity in groundwater from the Calabria region, south of Italy. J. Instrum. 2016, 11, P05012. [Google Scholar] [CrossRef]
  34. Caridi, F.; Marguccio, S.; Durante, G.; Trozzo, R.; Fullone, F.; Belvedere, A.; D’Agostino, M.; Belmusto, G. Natural radioactivity measurements and dosimetric evaluations in soil samples with a high content of NORM. Eur. Phys. J. Plus 2017, 132, 56. [Google Scholar] [CrossRef]
  35. Caridi, F.; Santangelo, S.; Faggio, G.; Gnisci, A.; Messina, G.; Belmusto, G. Compositional and Mineralogical Analysis of Marine Sediments from Calabrian Selected Areas, Southern Italy. Int. J. Environ. Res. 2019, 13, 571–580. [Google Scholar] [CrossRef]
  36. Caridi, F.; Testagrossa, B.; Acri, G. Elemental composition and natural radioactivity of refractory materials. Environ. Earth Sci. 2021, 80, 1–6. [Google Scholar] [CrossRef]
  37. Caridi, F.; Messina, M.; D’Agostino, M. An investigation about natural radioactivity, hydrochemistry, and metal pollution in groundwater from Calabrian selected areas, southern Italy. Environ. Earth Sci. 2017, 76, 668. [Google Scholar] [CrossRef]
  38. Caridi, F.; D’Agostino, M.; Belvedere, A. Radioactivity in Calabrian (Southern Italy) Wild Boar Meat. Appl. Sci. 2020, 10, 3580. [Google Scholar] [CrossRef]
  39. Caridi, F.; Belvedere, A.; Agostino, M.D.; Marguccio, S.; Marino, G.; Messina, M.; Belmusto, G. An investigation on airborne particulate radioactivity, heavy metals and polycyclic aromatic hydrocarbons composition in Calabrian selected sites, Southern Italy. Indian J. Environ. Prot. 2019, 39, 321–326. [Google Scholar]
  40. Caridi, F.; D’Agostino, M. Evaluation of drinking water radioactivity content and radiological risk assessment: A new methodological approach. J. Instrum. 2020, 15, P10016. [Google Scholar] [CrossRef]
  41. Hassan, N.M.; Rasmussen, P.E.; Dabek-Zlotorzynska, E.; Celo, V.; Chen, H. Analysis of Environmental Samples Using Microwave-Assisted Acid Digestion and Inductively Coupled Plasma Mass Spectrometry: Maximizing Total Element Recoveries. Water Air Soil Pollut. 2007, 178, 323–334. [Google Scholar] [CrossRef]
  42. Bednar, A.; Kirgan, R.; Jones, W. Comparison of standard and reaction cell inductively coupled plasma mass spectrometry in the determination of chromium and selenium species by HPLC–ICP–MS. Anal. Chim. Acta 2009, 632, 27–34. [Google Scholar] [CrossRef]
  43. Thermo Fisher iCAP Q Operating Manual. Available online: https://vdocuments.mx/icap-q-operating-manual-thermo-fisher-scientific-us-assistance-thermo-fisher-scientific.html (accessed on 18 April 2021).
  44. Perkin Elmer Optima 2100 DV ICP-OES Spectrometer User Manual; Perkin Elmer: Waltham, MA, USA, 2012.
  45. Seifert, E. OriginPro 9.1: Scientific Data Analysis and Graphing Software—Software Review. J. Chem. Inf. Model. 2014, 54, 1552. [Google Scholar] [CrossRef] [PubMed]
  46. Caridi, F.; Di Bella, M.; Sabatino, G.; Belmusto, G.; Fede, M.R.; Romano, D.; Italiano, F.; Mottese, A.F. Assessment of Natural Radioactivity and Radiological Risks in River Sediments from Calabria (Southern Italy). Appl. Sci. 2021, 11, 1729. [Google Scholar] [CrossRef]
  47. Dulger, D.; Mete, M. Chestnut flour and applications of utilization. Int. J. Food Eng. Res. 2017, 3, 9–16. [Google Scholar]
  48. Araujo, R.G.O.; Macedo, S.M.; Korn, M.D.G.A.; Pimentel, M.F.; Bruns, R.E.; Ferreira, S.L.C. Mineral composition of wheat flour consumed in Brazilian cities. J. Braz. Chem. Soc. 2008, 19, 935–942. [Google Scholar] [CrossRef] [Green Version]
  49. Italmopa I Nuovi Trend del Consumo di Pane in Italia; Fiera Internazionale Sigep & AB-Tech: Rimini, Italy, 2020.
  50. Frazzoli, R. I consumi alimentari extradomestici. Ind. Aliment. 2007, 46, 481–482. [Google Scholar]
  51. United Nations Scientific Committee on the Effects of Atomic Radiation. Sources and Effects of Ionizing Radiation: Report to the General Assembly, with Scientific Annexes; UNSCEAR: Vienna, Austria, 2000; Volume I, ISBN 92-1-142238-8. [Google Scholar]
  52. Commission Regulation (EC) N. 1881/06. 2006. Available online: http://extwprlegs1.fao.org/docs/pdf/eur68134.pdf (accessed on 18 April 2021).
  53. Morris, E.D. Mineral Elements in Wheat, Flour, and Bread. Nutr. Rev. 2009, 22, 223. [Google Scholar] [CrossRef]
Figure 1. Schematic block diagram.
Applsci 11 03646 g001
Figure 2. HPGe gamma spectrometry setup.
Applsci 11 03646 g002
Figure 3. ICP-MS experimental setup.
Applsci 11 03646 g003
Figure 4. ICP-OES experimental setup.
Applsci 11 03646 g004
Figure 5. Ding for all investigated samples, compared to the threshold level imposed by legislation.
Applsci 11 03646 g005
Figure 6. Results of the PCA (bi-plot) for all analyzed samples.
Applsci 11 03646 g006
Table 1. List of investigated types of flour, together with their identification code (ID) and typology.
Sample IDSample Typology
S1Wholemeal flour
S2Semolina flour
S3Rice flour
S4Coconut flour
S5Almond flour
S6Chestnut flour
S7Mallorcan wheat flour
S8Oat flour
S9Corn flour
S10Rye flour
S11Pistachio flour
Table 2. The activity concentration (mean value ± standard deviation) of 40K and 137Cs in the analyzed flour samples.
Activity Concentration (Bq kg−1)
Sample ID40K137Cs
S1285 ± 46<4.1
S2144 ± 26<3.9
S3155 ± 30<5.1
S4345 ± 51<9.8
S5248 ± 40<2.9
S6443 ± 68<2.6
S770 ± 15<2.2
S8152 ± 29<6.7
S999 ± 19<5.1
S10300 ± 41<6.4
S11370 ± 56<7.2
Table 3. Annual effective dose due to the ingestion of investigated samples, Ding, for the age category higher than 17 years, together with its percentage with respect to worldwide average natural dose to humans (2.4 mSv y−1).
Sample IDDing (mSv y−1)Percentage (%) with Respect to Worldwide Average Natural dose to Humans (2.4 mSv y−1)
S10.156.2
S20.072.9
S30.083.3
S40.187.5
S50.135.4
S60.239.6
S70.041.6
S80.083.3
S90.052.1
S100.156.2
S110.197.9
Table 4. Cd and Pb mean concentrations in investigated flour samples.
Heavy Metal Concentration (mg kg−1)
Sample IDCdPb
S10.0100.17
S20.0100.08
S30.0200.08
S40.0200.11
S50.0030.08
S60.0700.10
S70.0100.15
S80.0300.17
S90.0040.18
S100.0100.07
S110.0100.08
Contamination threshold
EU Reg. 1881/06
0.100–0.2000.20
Table 5. Average mineral content, determined by ICP-OES and ICP-MS, for each investigated flour type.
Mineral Concentration
(mg kg−1)
Sample IDPMgCaNaFeZnMnCuNi
S13652115935741133363670.6
S21439478227421714740.4
S31045240541512830.5
S42173297683181181714660.7
S5220411051204642016670.9
S6101550557346071982861.4
S780817227278188620.5
S8261011408644044243862.5
S9717110635397106110.2
S1044971247116113229269110.9
S1144137228275129269111.0
Publisher’s Note: MDPI stays neutral with regard to jurisdictional claims in published maps and institutional affiliations.

