1. Introduction
Since Vidal proposed the concept of reinforced soil, various types of reinforced soil retaining walls have been developed [
1]. Initially, long reinforcements with lengths 0.8–1.2 times the height of the wall were primarily used. Therefore, the behavior of the reinforced soil retaining wall was mainly studied with respect to the load acting on the reinforced area. Ho and Rowe observed that the stiffness, vertical spacing, and length of the reinforcements are important parameters that influence wall displacement [
2]. Bathurst et al. collected useful data for numerical analysis models using a full-scale test [
3]. Shin et al. studied the bearing capacity of a strip foundation on geogrid-reinforced sand using laboratory model tests [
4]. Until recently, studies on reinforced soil retaining walls using long reinforcements have been conducted in various fields, such as backfill materials [
5,
6,
7] and analysis methods [
8,
9,
10].
However, as the application of reinforced soil retaining walls increased, interest in the use of short reinforcements also increased. Tatsuoka et al. presented studies on the applicability of short reinforcements with a length of 35% of the height of the wall (0.35 H) integrated with a rigid wall [
11,
12,
13,
14]. In South Korea, a reinforced subgrade for railways (RSR) was developed, and related studies have been conducted [
15,
16]. It was recently applied to real scenarios, and its long-term application has been verified [
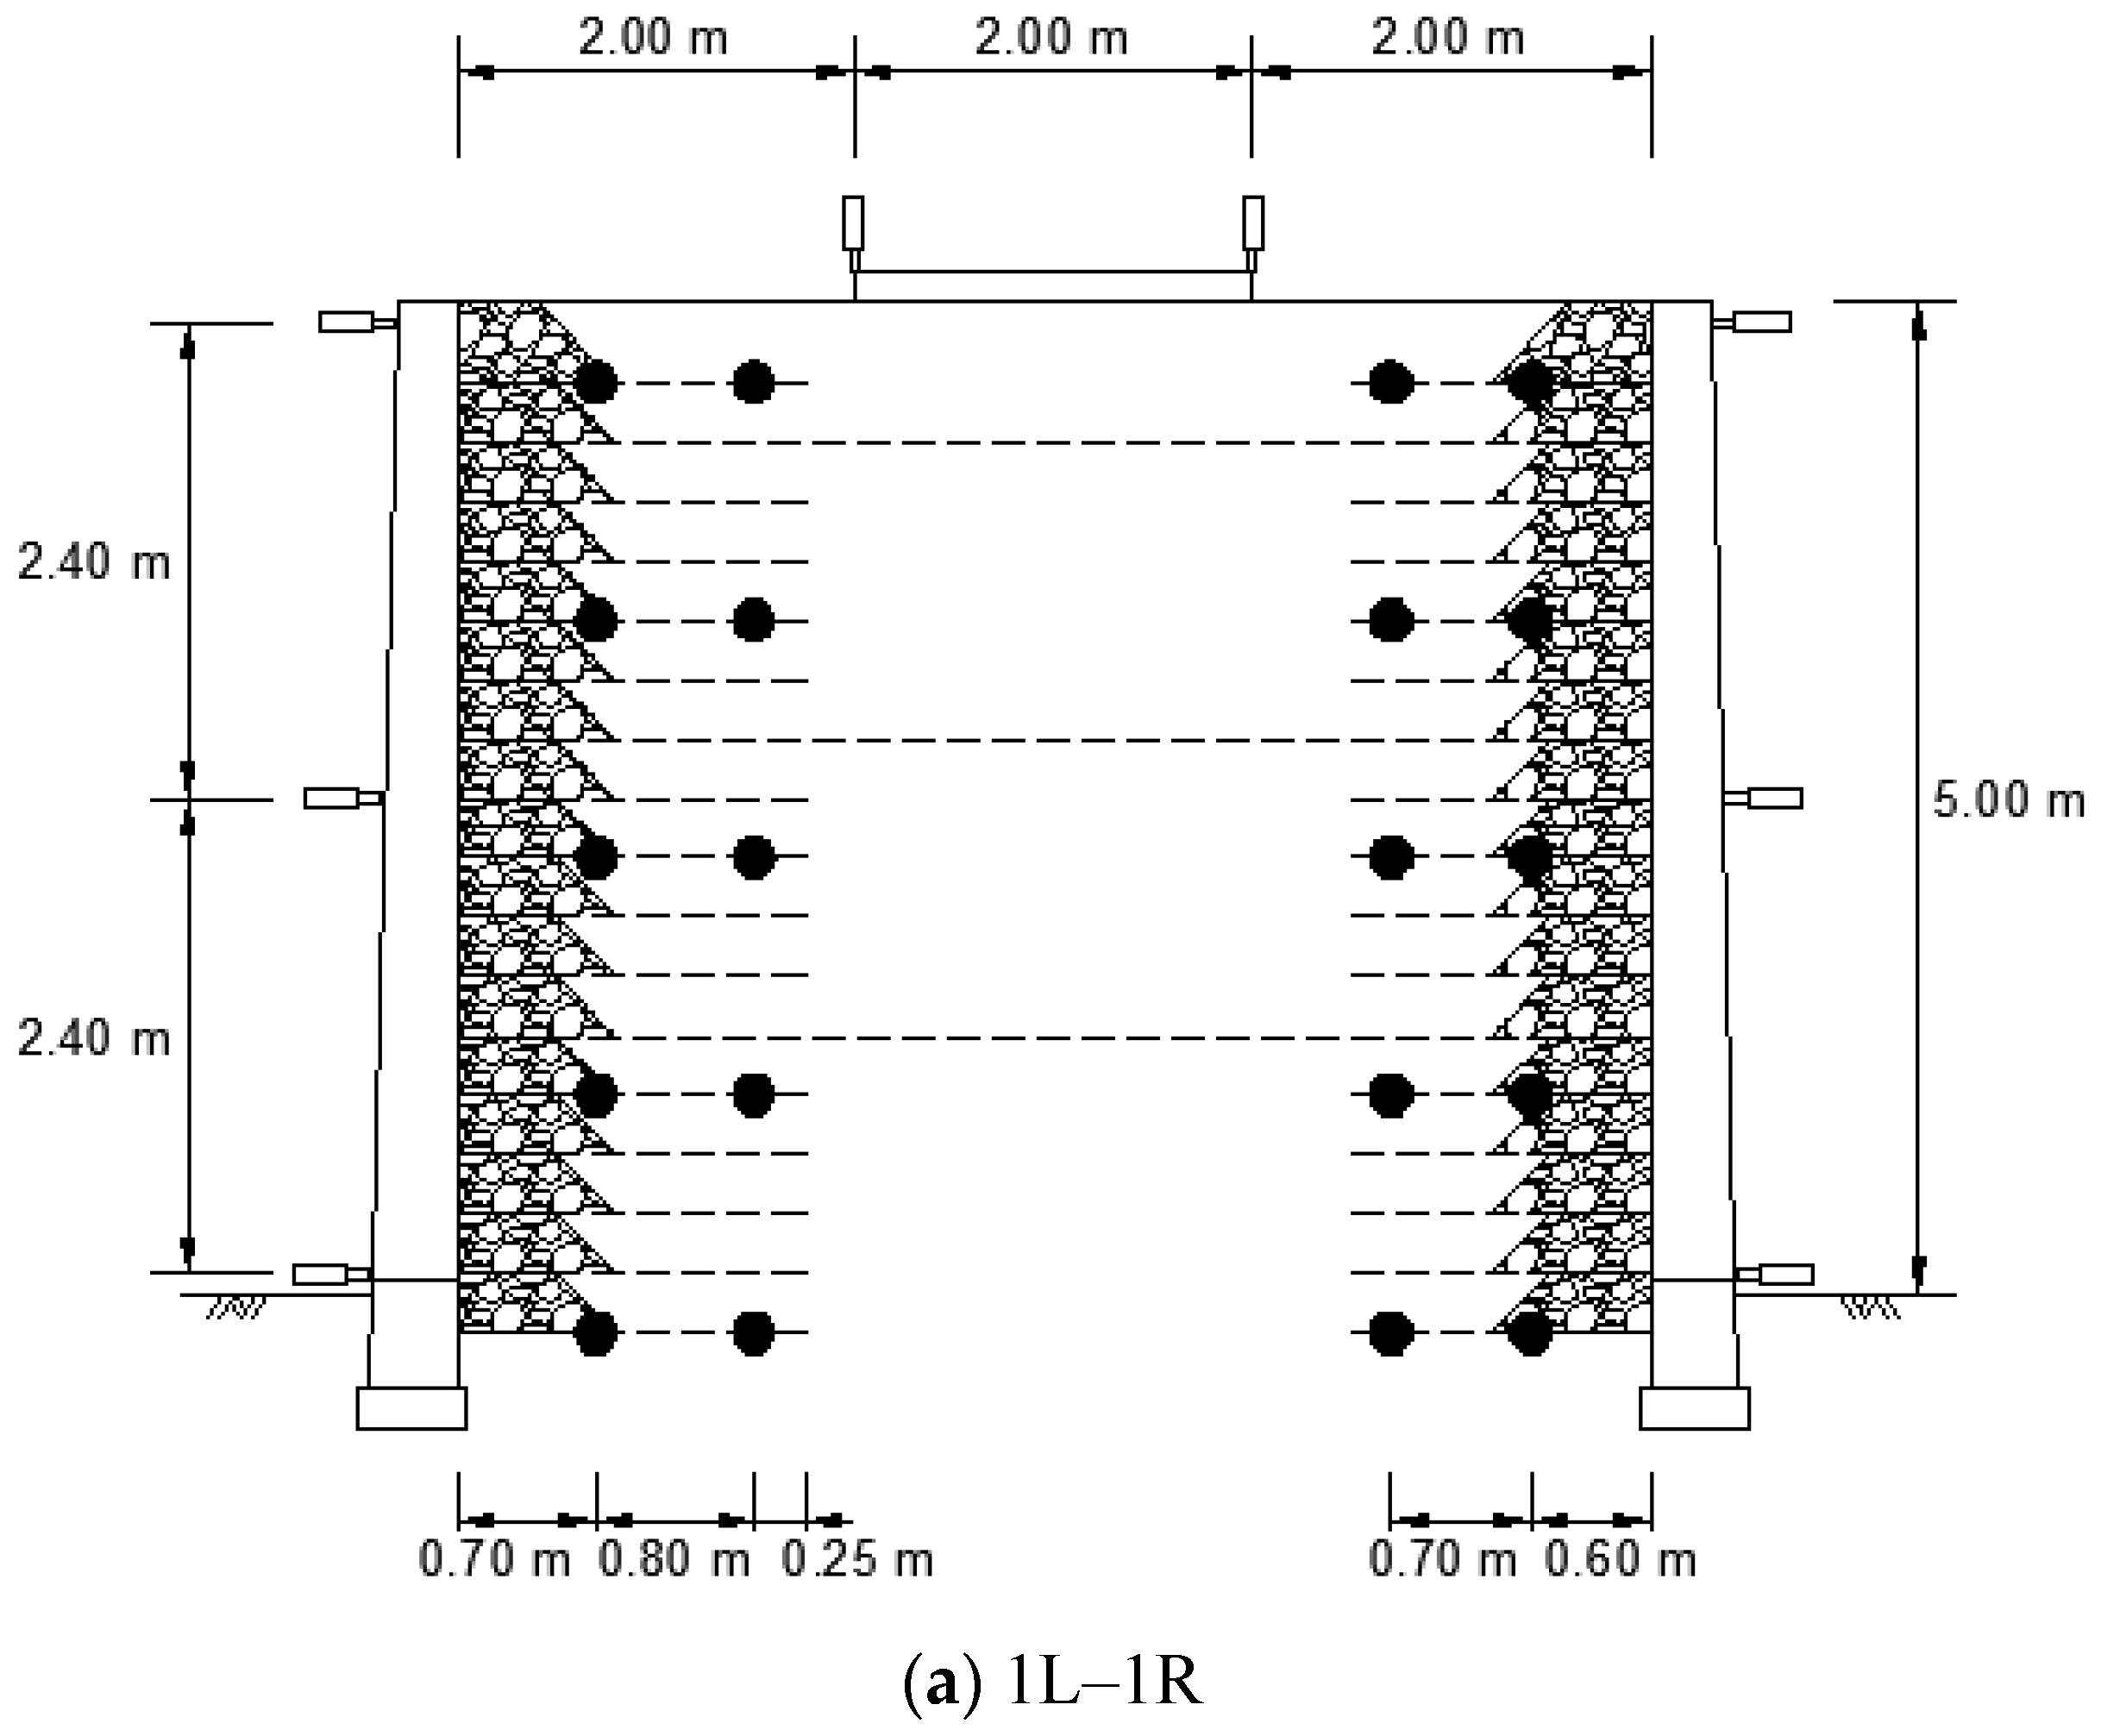
17]. RSR is a reinforced rigid wall construction method, in which the backfill is pre-constructed using nets of welded rebars and short geogrids of length 0.35 H. The wall is then integrated with the geogrid using connectors. RSR using short geogrids has a relatively narrow reinforced area compared with that using long reinforcements, as shown in
Figure 1, and the overburden load is frequently worked outside the reinforced area. In this case, the behavior of the RSR is expected to be different in terms of the settlement and horizontal displacement of the wall because there is a difference in the tensile force of the geogrids inside the reinforced soil, which is caused by the overburden load. Kim et al. investigated the behavior of a reinforced rigid wall for a vertical load applied outside the reinforced area using model tests [
18]; however, related studies are scarce.
In this study, the behavior of a reinforced rigid wall with short reinforcement was investigated with respect to the load acting outside the reinforcement area by constructing a full-scale RSR and applying repetitive and static loads. Four different sections were constructed with different vertical spacings and lengths of reinforcement. Each section had three different types of wall-reinforcement connections. Using the load-displacement relationship, the effect of each parameter was evaluated when a vertical load was applied outside the reinforcement area of the RSR.
2. Design and Construction of the Full Scale RSR
A full-scale RSR was designed and constructed for loading tests toward a single railroad subgrade; the height, width, and length were 5, 6, and 20 m, respectively, as shown in
Figure 2. It was composed of four sections with different vertical spacings, geogrids lengths, and wall-reinforcement connection methods to analyze the behavior of each section using two loading tests, as shown in
Figure 3. The specifications of each section are presented in
Table 1. The length of the reinforcements was determined to be 0.3–0.4 H, which is the range that can ensure stability during construction [
15].
2.1. Design of RSR
The ground conditions of the RSR construction site are shown in
Figure 4. The ground consisted of 0.5 m thick fill, 0.5 m silty clay, 1.2 m silty sand, and 4.7 m weathered soil. To ensure the stability of circular failure, the fill layer was replaced with gravel up to a depth of 1.5 m. The backfill was constructed by dividing it into upper and lower subgrades of 3 m and 2 m, respectively, and materials that meet the Korean Railroad Design Standard were used. The soils used for the backfill were subjected to water content ratio, specific gravity, particle size distribution, shear, and compaction tests. The test results are presented in
Table 2. Evaluation by the unified classification method, confirms that the backfill material used for the upper subgrade was gravelly soil (GP-GM), and for the lower subgrade, sandy soil (SP-SM). The material properties used for the stability analyses considering the results of the ground investigation and material tests are shown in
Table 3.
Each section was designed using the two-wedge method, which calculates the earth pressure acting on the wall and the minimum factor of safety from the equilibrium of the force [
19]. The force acting on the two soil wedges is calculated while varying the angle of the two lines that form the failure surface in the backfill, as shown in
Figure 5.
Table 4 shows the safety factors of the circular failure, overturning, and sliding of each section. In all cases, it was confirmed that the safety factors satisfied the specifications of the Korean Railroad Network Authority [
20]. The resisting moment is calculated by the multiplication of resistance and moment arm, so the narrower vertical spacing of the reinforcement increases the safety factors of overturning. In the cases of the reinforcement has short length (1R section) or wide vertical spacing (2L, 2R section), the safety factor of overturning tends to be smaller than sliding. However, in the 1L section where the reinforcement has sufficient length and narrow vertical spacing, the safety factor of overturning is larger than sliding.
2.2. Construction of RSR
The first and second loading test areas consisted of the 1L–1R and 2L–2R sections, respectively. Each area was constructed separately using the construction joints. The construction of the RSR proceeded in the order shown in
Figure 6. The wall-reinforcement connections were constructed differently for each of the three types, as summarized in
Table 1. The cross sections of each connection method are shown in
Figure 7.
3. Loading Test
3.1. Loading System
Considering the failure of the RSR, the maximum load was set to 1000 kPa, which is 20 times the design load of 50 kPa. A reaction beam was installed on the RSR and loaded using a hydraulic cylinder installed between the reaction beam and the surface of the RSR. The earth anchor to hold the reaction frame was designed such that the design load per hole was 1100 kN. The earth anchors were installed 1 m apart from the RSR, and six holes were installed in each test area, with a total of 12 holes. A 2 × 3 m plate was installed on the surface of the RSR, and H beams were arranged on the loading plate so that the load from the hydraulic cylinder was evenly distributed. Four hydraulic cylinders were installed in a 2 × 2 arrangement. For the reaction force beam, four H-beams (944 × 302 × 32 × 64 mm, L = 10 m) were arranged in two stages to ensure sufficient bending stiffness.
Figure 8 shows the cross section of the loading system, and
Figure 9 shows the foreground of the loading system.
The loading test stage was divided into two stages: a 2-cycle repeated loading test stage to calculate the moduli of the subgrade reaction and a static loading test stage to observe the change in the settlement, horizontal displacement of the wall, and geogrid strain according to the load. Each load-loading test was conducted twice because it was divided into the 1L–1R and 2L–2R sections. As shown in
Table 5, the repetitive loading test was loaded up to 500 kPa in two cycles, and the static load loading test was loaded up to 1000 kPa in 12 steps and unloaded to 0 kPa in four steps.
3.2. Installation of the Measurement Sensors
The measurement sensors consisted of strain gauges that were installed on the geogrids during the construction of the RSR and displacement sensors (vertical and horizontal). As shown in
Figure 10, during loading, vertical displacement was measured at the four corners of the loading plate to measure the amount of settlement with respect to the loading step. Three horizontal displacement sensors were installed on the wall at heights of 0.1, 2.5, and 4.9 m to measure displacement according to height. Geogrid strain gauges were installed at a spacing of 1.2 m in height. They were installed 0.7 and 1.5 m from the wall in the 1L and 2R sections, and 0.6 and 1.3 m from the wall in the 1R section.
4. Analyses of Test Results
4.1. Load-Settlement
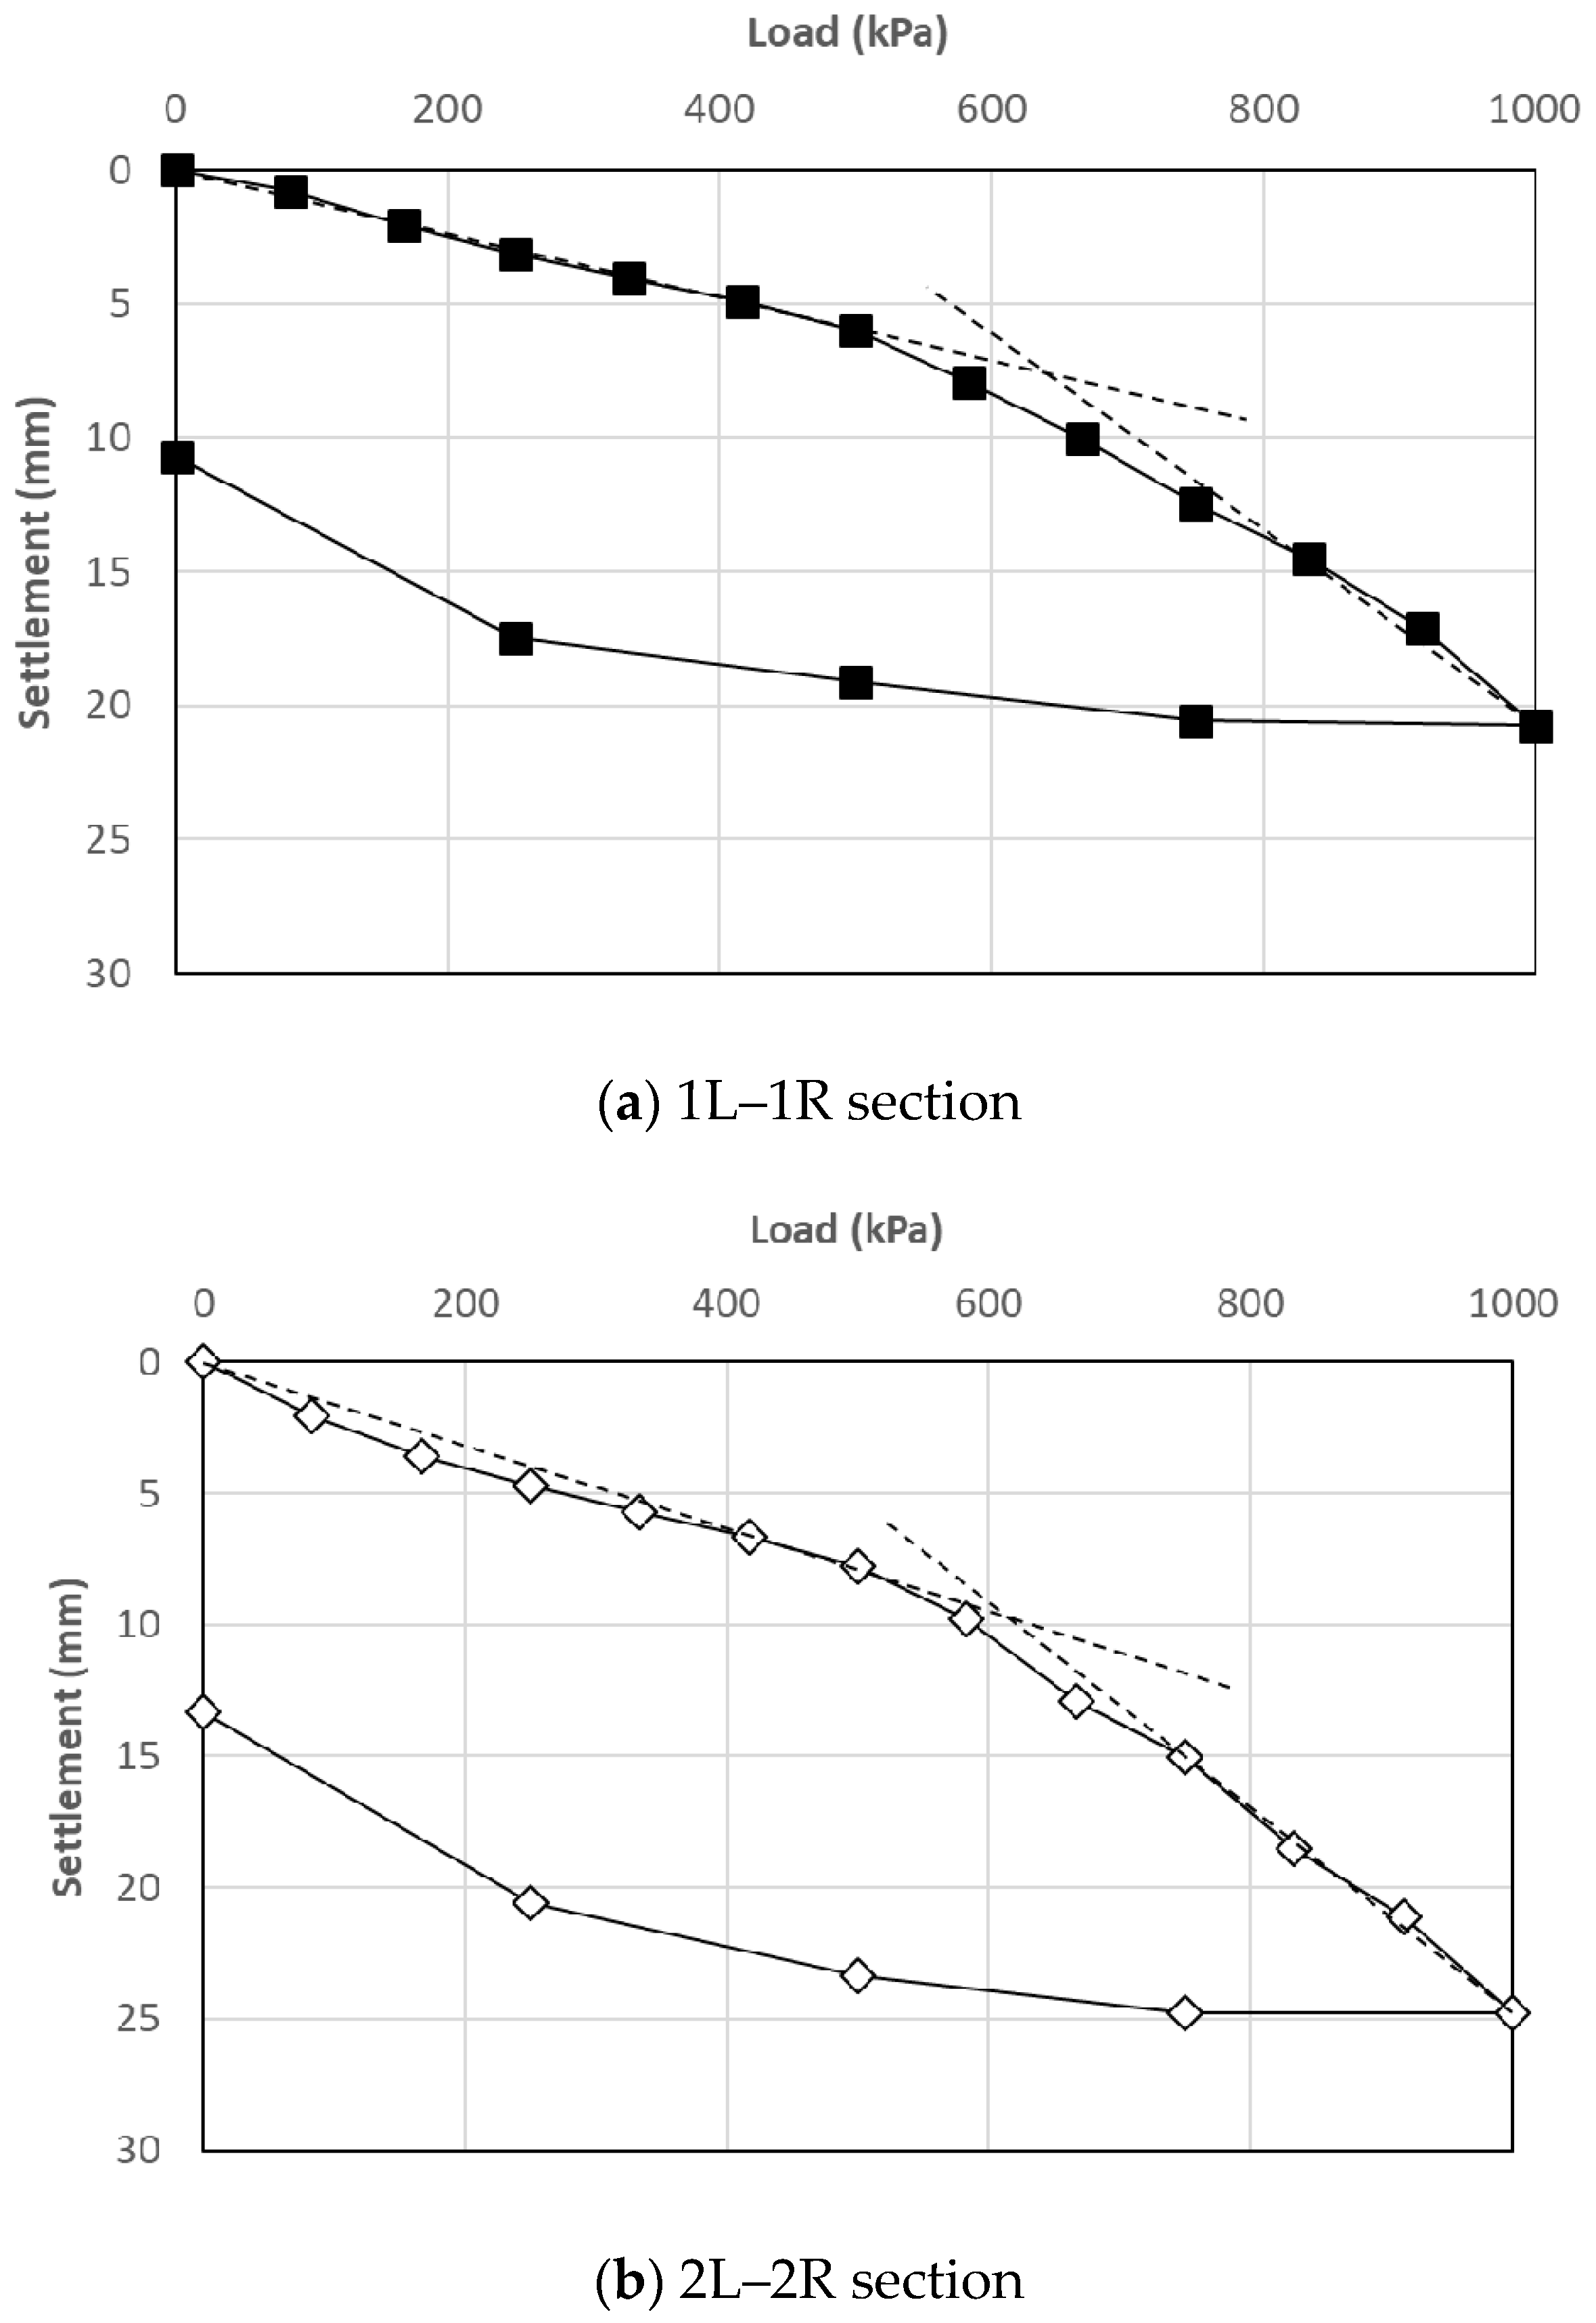
The load-settling curve of the repetitive loading test is shown in
Figure 11. The calculated values of the maximum settlement, residual settlement, and moduli of the subgrade reactions are summarized in
Table 6. When comparing the first and second tests, the results of the first cycle exhibited a difference of approximately 2%. Because the test results contained a significant amount of plastic settlement on the surface, there was little difference between the results of the two tests using the same backfill material. In the second cycle, the maximum settlement increased by 25%, and the residual settlement increased by 221% in the second test compared with the first test; the ground reaction force coefficient accordingly decreased by 20%. This difference may be owing to the large increase in the stiffness of the reinforced soil as more geogrids in the first test were placed in the impact range of the load. The effect of increasing the stiffness of the subgrade via the reduction of the geogrid vertical spacing was similar to that of previous studies, in which the load was applied inside the reinforced area. The test results show that the reduction in the settlement, owing to the installation of the reinforcement, can be obtained even for a load outside the reinforcement area, and the settlement is reduced as the vertical spacing between the reinforcements is narrowed.
The load-settling curves of the first and second static loading tests are shown in
Figure 12; at loads of 500 kPa or less, the slopes of the two curves are similar, and at pressures above 500 kPa, the slopes of the two curves change. The reason for this may be because the yield occurred in the soil under the load plate at the inflection point of the curves (at a load of 500 kPa) and plastic behavior began. At loads of 500 kPa or more, the increase in the stiffness of the reinforced area by the reinforcement has a more significant effect on the settlement reduction; therefore, a difference in the slope between the two curves may have occurred. Even at the maximum load of 1000 kPa, the settlement was 20.75 mm and 24.76 mm in the first and second tests, respectively, which did not reach the allowed maximum settlement (25.4 mm) proposed by Terzaghi et al. [
21]. Similar to previous studies that applied long reinforcements [
22], the effect of increasing the bearing capacity using short reinforcements was confirmed.
The allowable bearing capacity of both sections were calculated, as shown in
Table 7, using the P-S curve method (
Figure 13) and Bowles’s equation considering a safety factor of 2. The allowable bearing capacity (
qa) and modulus of the subgrade reaction (
Ks) of the soil were calculated according to Equations (1) and (2), as described by Bowles [
23]:
where
qa is the allowable bearing capacity (kPa),
FS is the safety factor taken as 2, and
Ks is the initial tangent modulus of the subgrade reaction (kPa/m);
where Δ
σ is the difference between two successive vertical stresses (kPa), and Δ
settlement is the difference between two successive vertical displacements (m).
In addition, the allowable bearing capacity of soil without reinforcement was calculated using Meyerhof’s equation [
24] and compared with the test values. Depending on the vertical spacing of the geogrid and the calculation method, the bearing capacity obtained from the test was 1.4–2.8 times higher than the theoretical value. Even when a load was applied outside the reinforcement area, the reinforcement increased the bearing capacity of subgrade. The P-S curve method showed no significant difference in bearing capacity because the two curves had similar inflection points, whereas the bearing capacity calculated by the Bowles’s equation was 19% larger in the 1L–1R section. Although there are differences depending on the calculation method, it was confirmed that the allowable bearing capacity increased as the vertical spacing of the reinforcement narrowed.
This phenomenon may be caused by the vertical load distribution. The vertical load applied to the ground surface is distributed over a wider range than the loading width, depending on the depth of the soil [
25,
26,
27]. The area can influence an increase in the supporting stiffness of the entire subgrade. Because the load distribution range and the area reinforced by the wall and reinforcements overlap, the stiffness of the reinforced soil can be increased.
4.2. Horizontal Displacement of Wall
Figure 14 shows the maximum horizontal displacement measured at the top of the wall (height 4.9 m) with respect to the load, which was obtained from four cross section with different reinforcement lengths and wall-backfill connection methods. Horizontal displacement in the low load of 417 kPa or less occurred in the order of 2R > 1R > 1L > 2L. Because the largest displacement occurred in the wind-bold-wire type and the smallest in the welded type, the horizontal displacement of the wall at the low load was considered to be greatly influenced by the wall-backfill connection method.
The horizontal displacement of the wall at the maximum load (1000 kPa) occurred in the order of 1R > 2R > 1L > 2L, which tends to decrease because the length of the reinforcement is longer, and the horizontal displacement of the 1R and 2R sections is reversed above a load of 500 kPa. Because the horizontal behavior of the wall changed at a load similar to the yield point of the load-settlement curve, this phenomenon may be highly related to the yield of soil and the tension of the reinforcement in the reinforcement area. As the plastic deformation of the soil proceeds, the effect of the reinforcement on the horizontal displacement of the wall increases. Moreover, a longer reinforcement length decreases the deformation of the wall; thus, the load-wall horizontal displacement curve appeared, as shown in
Figure 14.
The wall-backfill connection method had a governing effect on the horizontal displacement of the wall at a low load below the yield point, which was estimated from the load-settlement curve; the length of the reinforcement had a governing effect on the load above the yield point. The smallest horizontal displacement occurred in the 2L section with reinforcement vertical spacing of 40 cm and a reinforcement length of 2 m. A similar horizontal displacement occurred in the 1L and 2R sections, which have the same reinforcement length of 1.75 m, but different vertical spacings of 0.3 and 0.4 m, respectively, above the load of 653 kPa. Thus, the length of the reinforcement, instead of the vertical spacing, has a greater influence on the horizontal displacement of the wall.
Figure 15 shows the horizontal displacement with respect to the wall height of each load step. In all four sections, the largest displacement occurred in the upper part of the wall. In the 1L section, the wall displacement pattern exhibits an outwardly concave shape, and in other sections, they exhibit an outwardly convex shape. The characteristic of horizontal displacement in the 1L section is that the wall is outwardly concave, unlike previous studies [
28,
29,
30]. This is because the wall and reinforcement are connected by a welded type in the 1L section. The reinforcement with high specifications of 0.3 m and 1.75 m is sufficient for displacement resistance, which is the best performance in the lower area from the middle of the wall. In the case of the 1R section with the same vertical spacing of 0.3 m, the length of the reinforcement is installed as low as 1.5 m; therefore, it was determined that the shape of the 1L section exhibits a convex shape because it could not support the lower part of the wall. The 1R section, which has a reinforcement lower than 1L, at 1.5 m, and a weaker wall-reinforcement connection as the hinge type, exhibits an outwardly convex wall shape despite the same vertical spacing of 0.3 m.
4.3. Strain of Reinforcement
Figure 16 shows the strain of the reinforcement at each layer with respect to the load. The maximum tensile strain was 0.14% at a height of −0.2 m in the 1L section, 0.11% at a height of −0.2 m in the 1R section, and 0.09% at a height of 4.6 m in the 2R section. It was determined that all reinforcements were stable, even at the final loading stage, which exhibited less than 5% of the design tensile strain of the general geogrid. The maximum compressive strain was measured at 0.29% in the 1L section, 0.12% in the 1R section, and 0.37% in the 2R section, all of which occurred at a height of 3.4 m.
Unlike other heights, strain at the heights of 2.2 m and 3.4 m, with a 0.7 m distance from the wall, showed a large compressive strain as the load increased. This compressive strain may be owing to the plastic deformation of the soil and the resistance to the horizontal earth pressure of the rigid wall. Plumey proposed a spiral failure mechanism [
31], in which the upper part of the wall is in a rigid state, and a plastic region occurs in a spiral form from the load point to the middle part of the wall, as shown in
Figure 17. It was considered that compressive strain occurred in the reinforcement installed in the middle part (2.2 m, 3.4 m height) by applying force to the reinforcement while the soil moved along the plastic area. Here, the horizontal stress and displacement generated in the wall are the largest in the middle part of the wall, which is similar to the results of previous studies [
8,
32]. In summary, it was confirmed that when short reinforcements are used, tensile force occurs in the lower part of the wall, and a reinforcement at the 2/3 H height is governed by the compression force. This may be owing to the short reinforcement located on the inner side of the failure surface in the soil.
In the load-strain curves of most reinforcements, a strain pattern showing an inflection point at a load between 500 kPa and 583 kPa was observed. This is similar to the pattern of the settlement and horizontal displacement of the wall described above, and it shows that reinforcement has a greater influence on deformation control after the yield of soil occurs. This pattern is similar to that described above for the settlement and horizontal displacement of the wall, and it shows that the influence of reinforcement on deformation control increases as the load increases after the yield of the soil occurs.
5. Conclusions
A full-scale RSR was designed and constructed, and a load was applied from the outside of the reinforcement area to verify the stiffness increase of the reinforced rigid wall with short reinforcements and the impact of the arrangement of reinforcements. From the test results, the deformation control performance of RSR was confirmed as a structure that satisfies the residual settlement criteria (less than 25 mm) after opening the concrete slab track. The main conclusions of this study are as follows.
The stiffness of a reinforced rigid wall with short reinforcements increased as the vertical spacing of the reinforcement narrowed. This tendency is similar to that of reinforced soil using long reinforcement; even if a load is applied outside the reinforcement area, the stiffness can be increased and the settlement can be reduced when the reinforcement area and load distribution range overlap.
In a reinforced rigid wall with short reinforcement, the deformation of the reinforcements changes depending on the plastic behavior, owing to the yield of the soil. Before the yield of the soil, the shear resistance of the soil had a governing effect on the deformation, and the influence of the reinforcement was relatively small. However, after the yield of the soil, the influence of the reinforcement increased as the load increased. Therefore, a narrower vertical spacing of the reinforcement increases the stiffness and bearing capacity.
At low loads below the yield of the soil, the stronger the reinforcement-wall connection, the smaller the horizontal displacement of the wall. At high loads above the yield, the longer the length of the reinforcement, the smaller the horizontal displacement of the wall. In addition, the length of the reinforcement, instead of the vertical spacing, significantly affected the horizontal displacement of the wall.
Author Contributions
Writing—review and editing, U.K.; supervision, D.S.K. Both authors have read and agreed to the published version of the manuscript.
Funding
This research received no external funding.
Acknowledgments
This research was supported by a grant from the R&D Program “Development of ZSR (Zero Settlement Railroad) Technology” of the Korea Railroad Research Institute (KRRI).
Conflicts of Interest
The authors declare no conflict of interest.
References
- Vidal, H. The principle of reinforced earth. Transp. Res. Rec. 1969, 282, 1–16. [Google Scholar]
- Ho, S.K.; Rowe, R.K. Effect of wall geometry on the behaviour of reinforced soil walls. Geotext. Geomembr. 1996, 14, 521–541. [Google Scholar] [CrossRef]
- Bathurst, R.J.; Walters, D.; Vlachopoulos, N.; Burgess, P.; Allen, T.M. Full scale testing of geosynthetic reinforced walls. In Advances in Transportation and Geoenvironmental Systems Using Geosynthetics; American Society of Civil Engineers: Denver, CO, USA, 2000; pp. 201–217. [Google Scholar]
- Shin, E.C.; Das, B.M.; Lee, E.S.; Atalar, C. Bearing capacity of strip foundation on geogrid-reinforced sand. Geotech. Geol. Eng. 2002, 20, 169–180. [Google Scholar] [CrossRef]
- Santos, E.C.; Palmeira, E.M.; Bathurst, R.J. Behaviour of a geogrid reinforced wall built with recycled construction and demolition waste backfill on a collapsible foundation. Geotext. Geomembr. 2013, 39, 9–19. [Google Scholar] [CrossRef]
- Liu, S.; Fan, K.; Xu, S. Field study of a retaining wall constructed with clay-filled soilbags. Geotext. Geomembr. 2019, 47, 87–94. [Google Scholar] [CrossRef]
- Munoz, H.; Kiyota, T. Deformation and localisation behaviours of reinforced gravelly backfill using shaking table tests. J. Rock Mech. Geotech. Eng. 2020, 12, 102–111. [Google Scholar] [CrossRef]
- Wang, L.; Liu, H.; Wang, C. Earth pressure coefficients for reinforcement loads of vertical geosynthetic-reinforced soil retaining walls under working stress conditions. Geotext. Geomembr. 2018, 46, 486–496. [Google Scholar] [CrossRef]
- Xu, P.; Hatami, K. Sliding stability and lateral displacement analysis of reinforced soil retaining walls. Geotext. Geomembr. 2019, 47, 483–492. [Google Scholar] [CrossRef]
- Zucca, M.; Valente, M. On the limitations of decoupled approach for the seismic behavior evaluation of shallow multi-propped underground structures embedded in granular soils. Eng. Struct. 2020, 211, 110497. [Google Scholar] [CrossRef]
- Tatsuoka, F.; Tateyama, M.; Murata, O. Earth retaining wall with a short geotextile and a rigid facing. In Proceedings of the 12th International Conference on SMFE, Rio de Janeiro, Brazil, 13–18 August 1989; pp. 1311–1314. [Google Scholar]
- Tatsuoka, F. Roles of facing rigidity in soil reinforcing. Keynote Lecture. In Proceedings of the International Symposium on Earth Reinforcement Practice; Ochiai, H., Ed.; CRC Press: Fukuoka, Japan, 1993; pp. 831–870. [Google Scholar]
- Tatsuoka, F.; Tateyama, M.; Uchimura, T.; Koseki, J. Geosynthetic-reinforced soil retaining walls as important permanent structures (1996–1997 Mercer Lecture). Geosynth. Int. 1997, 4, 81–136. [Google Scholar] [CrossRef]
- Tatsuoka, F.; Tateyama, M.; Moltri, Y.; Matsushima, K. Remedial treatment of soil structure using geosynthetic-reinforcing technology. Geotext. Geomembr. 2007, 25, 204–220. [Google Scholar] [CrossRef]
- Kim, D.S. Stability evaluation of reinforced subgrade with short geogrid for railroad during construction. J. Korean Geosynth. Soc. 2014, 13, 11–20. [Google Scholar] [CrossRef] [Green Version]
- Kim, D.S. Reinforcement of collapsed railway subgrade and line capacity increase using short reinforcement with rigid wall. J. Korea Acad.-Ind. Coop. Soc. 2016, 17, 604–609. [Google Scholar] [CrossRef] [Green Version]
- Kim, U.J.; Kim, D.S. Load sharing characteristics of rigid facing walls with geogrid reinforced railway subgrade during and after construction. Geotext. Geomembr. 2020, 48, 940–949. [Google Scholar] [CrossRef]
- Kim, D.S.; Park, S.Y.; Kim, K.H. Effects of vertical spacing and length of reinforcement on the behaviors of reinforced subgrade with rigid wall. J. Korean Geosynth. Soc. 2012, 11, 27–35. [Google Scholar] [CrossRef] [Green Version]
- Ismeik, M.; Guler, E. Effect of wall facing on the seismic stability of geosynthetic-reinforced retaining walls. Geosynth. Int. 1998, 5, 41–53. [Google Scholar] [CrossRef]
- Korea Railway Network Authority. Railway Design Standard for Roadbed; Korea Railway Network Authority: Daejeon, Korea, 2013; ISBN 978-89-91723-95-5. [Google Scholar]
- Terzaghi, K.; Peck, R.; Mesri, G. Soil Mechanics in Engineering Practice, 3rd ed.; John Wiley & Sons Inc.: Hoboken, NJ, USA, 1996; ISBN 978-047-108-658-1. [Google Scholar]
- Kumar, A.; Saran, S. Bearing capacity of rectangular footing on reinforced soil. Geotech. Geol. Eng. 2003, 21, 201–224. [Google Scholar] [CrossRef]
- Bowles, J.E. Foundation Analysis and Design, 5th ed.; Mc Graw-Hill Book Co.: New York, NY, USA, 1996; ISBN 978-125-906-103-5. [Google Scholar]
- Meyerhof, G.G. Some recent research on the bearing capacity of foundations. Can. Geotech. J. 1963, 1, 16–26. [Google Scholar] [CrossRef]
- Lambe, T.W.; Whitman, R.V. Soil Mechanics; John Wiley & Sons Inc.: Hoboken, NJ, USA, 1969; ISBN 978-047-151-192-2. [Google Scholar]
- Perloff, W.H. Pressure Distribution and Settlement, Chapter 4, Foundation Engineering Handbook; Winterkorn, H.F., Fang, H.T., Eds.; Van Nostrand Reinhold Company: New York, NY, USA, 1975; ISBN 978-146-136-752-9. [Google Scholar]
- Chen, W.F.; McCarron, W.O. Bearing capacity of shallow foundations. In Foundation Engineering Handbook; Springer: Boston, MA, USA, 1991; ISBN 978-041-298-891-2. [Google Scholar]
- Al Hattamleh, O.; Muhunthan, B. Numerical procedures for deformation calculations in the reinforced soil walls. Geotext. Geomembr. 2006, 24, 52–57. [Google Scholar] [CrossRef]
- Liu, H. Long-term lateral displacement of geosynthetic-reinforced soil segmental retaining walls. Geotext. Geomembr. 2012, 32, 18–27. [Google Scholar] [CrossRef]
- Benjamim, C.V.D.S.; Bueno, B.D.S.; Zornberg, J.G. Field monitoring evaluation of geotextile-reinforced soil-retaining walls. Geosynth. Int. 2007, 14, 100–118. [Google Scholar] [CrossRef] [Green Version]
- Plumey, S.; Muttoni, A.; Vulliet, L.; Labiouse, V. Analytical and numerical analyses of the load-bearing capacity of retaining walls laterally supported at both ends. Int. J. Numer. Anal. Methods Geomech. 2011, 35, 1019–1033. [Google Scholar] [CrossRef]
- Al-Hussaini, M.M.; Perry, E.B. Field experiment of reinforced earth wall. J. Geotech. Eng. Div. 1978, 104, 307–322. [Google Scholar] [CrossRef]
Figure 1.
Overburden load acting outside the reinforcement area of RSR.
Figure 1.
Overburden load acting outside the reinforcement area of RSR.
Figure 2.
Schematic of the full scale RSR.
Figure 2.
Schematic of the full scale RSR.
Figure 3.
Cross sections of the full scale RSR.
Figure 3.
Cross sections of the full scale RSR.
Figure 4.
Ground condition.
Figure 4.
Ground condition.
Figure 5.
Two-wedge failure mechanism.
Figure 5.
Two-wedge failure mechanism.
Figure 6.
Construction procedures of RSR.
Figure 6.
Construction procedures of RSR.
Figure 7.
Cross sections of wall- reinforcement connection methods.
Figure 7.
Cross sections of wall- reinforcement connection methods.
Figure 8.
Cross section of loading system.
Figure 8.
Cross section of loading system.
Figure 9.
Foreground of loading system.
Figure 9.
Foreground of loading system.
Figure 10.
Location of the sensors.
Figure 10.
Location of the sensors.
Figure 11.
Load-settlement curve of repetitive loading test.
Figure 11.
Load-settlement curve of repetitive loading test.
Figure 12.
Load-settlement curve of static loading test.
Figure 12.
Load-settlement curve of static loading test.
Figure 13.
Estimation of bearing capacity by P-S curve method.
Figure 13.
Estimation of bearing capacity by P-S curve method.
Figure 14.
Load-horizontal displacement of wall curve (at the top).
Figure 14.
Load-horizontal displacement of wall curve (at the top).
Figure 15.
Horizontal displacement of wall with respect to height.
Figure 15.
Horizontal displacement of wall with respect to height.
Figure 16.
Reinforcement strain with respect to load.
Figure 16.
Reinforcement strain with respect to load.
Figure 17.
Spiral failure mechanism (Plumey, 2011).
Figure 17.
Spiral failure mechanism (Plumey, 2011).
Table 1.
Detailed specifications of four sections.
Table 1.
Detailed specifications of four sections.
| Sections | Vertical Spacing of
Reinforcement (m) | Length of
Short Reinforcement | Connection Types | Functions to Connect |
|---|
| 1L | 0.3 | 1.75 m (0.35 H) | Welding | Very Strong |
| 1R | 0.3 | 1.50 m (0.3 H) | Hinge & Bolt | Strong |
| 2L | 0.4 | 2.00 m (0.4 H) | Welding | Very Strong |
| 2R | 0.4 | 1.75 m (0.35 H) | Wind bold wire | Weak |
Table 2.
Test result of backfill soils.
Table 2.
Test result of backfill soils.
| Properties | Upper Subgrade | Lower Subgrade |
|---|
| Specific gravity | 2.64 | 2.65 |
| Maximum dry density (kN/m3) | 17.8 | 17.7 |
| Plasticity index | N.P | N.P |
| Natural water content, ωn (%) | 4.9 | 8.9 |
| Optimum moisture content, ωopt (%) | 11.8 | 13.5 |
| Cohesion, c (kPa) | 1 | 1 |
| Internal friction angle, ϕ (°) | 31.3 | 30.6 |
| Unified soil classification system | GP-GM | SP-SM |
Table 3.
Material properties for RSR design.
Table 3.
Material properties for RSR design.
| Materials | Unit Weight
(kN/m3) | Cohesion
(kN/m2) | Friction Angle
(°) |
|---|
| Backfill | 19 | 0 | 30 |
| Gravel | 22 | 0 | 37 |
| Fill | 18 | 5 | 25 |
| Weathered soil | 19 | 15 | 25 |
| Reinforcement | Geogrid, Design tensile strength = 60 kN/m |
Table 4.
Safety factors of each section.
Table 4.
Safety factors of each section.
| Sections | Safety Factors |
|---|
| Circular Failure | Overturning | Sliding |
|---|
| 1L | 1.534 | 2.168 | 2.151 |
| 1R | 1.527 | 1.834 | 1.956 |
| 2L | 1.502 | 2.167 | 2.452 |
| 2R | 1.502 | 2.041 | 2.332 |
Table 5.
Loading test stage and loading step.
Table 5.
Loading test stage and loading step.
| Test Classifications | Repetitive Loading Test (2 Cycles) | Static Loading Test |
|---|
| Loading | kPa | 80, 160, 240, 320, 400, 450, 500 | 83, 167, 250, 333, 417, 500, 583, 667, 750, 833, 917, 1000 |
| Unloading | kPa | 250, 125, 0 | 750, 500, 250, 0 |
Table 6.
Test result of repetitive loading test.
Table 6.
Test result of repetitive loading test.
| Case | Max. Settlement
(mm) | Residual Settlement
(mm) | Modulus of Subgrade
Reaction, Ks (kPa/m) |
|---|
| 1st test | 1st cycle | 15.87 | 9.46 | 30,876 |
| 2nd cycle | 7.60 | 0.73 | 64,474 |
| 2nd test | 1st cycle | 16.17 | 9.26 | 30,303 |
| 2nd cycle | 9.48 | 2.34 | 51,688 |
Table 7.
Bearing capacities by various methods.
Table 7.
Bearing capacities by various methods.
| Sections | Allowable Bearing Capacity (kPa) |
|---|
| P-S Curve Method | Bowles’s Equation | Meyerhof’s Equation |
|---|
| 1L-1R | 320 | 591 | 210 |
| 2L-2R | 300 | 495 |
| Publisher’s Note: MDPI stays neutral with regard to jurisdictional claims in published maps and institutional affiliations. |
© 2021 by the authors. Licensee MDPI, Basel, Switzerland. This article is an open access article distributed under the terms and conditions of the Creative Commons Attribution (CC BY) license (https://creativecommons.org/licenses/by/4.0/).


