Article

Solid-State Foaming Process Optimization for the Production of Shape Memory Polymer Composite Foam

Department of Mechanical Engineering, UAE University, Al Ain 15258, United Arab Emirates
*
Author to whom correspondence should be addressed.
Appl. Sci. 2021, 11(8), 3433; https://doi.org/10.3390/app11083433
Submission received: 19 March 2021 / Revised: 6 April 2021 / Accepted: 9 April 2021 / Published: 12 April 2021
(This article belongs to the Special Issue Smart Manufacturing Technology)

Abstract

:
This research examined the optimization of the sustainable manufacturing process for polyester-based polymers/Fe3O4 nanocomposite foaming. The foamed structure was achieved by using a solid-state foaming process, where the prepared foams were tested in order to ascertain the optimum foaming parameters with the highest foaming ratios and the lowest foaming densities. The foaming parameters used in this research were the polymer type, nanoparticle percentage, packing pressure, holding time, foaming temperature, and foaming time. Two levels were selected for each factor, and a Taguchi plan was designed to determine the number of experiments required to reach a conclusion. Further characterization techniques, namely, differential scanning calorimetry (DSC), Fourier transform infrared spectroscopy (FTIR), and X-ray diffraction (XRD) were used with the original samples to gain a better understanding of their structure and chemical composition. The data analysis showed that regardless of the parameters used, a high foaming ratio resulted in a low density. The introduction of nanoparticles (NPs) to the polymer structure resulted in higher foaming ratios. This increment in foaming ratio was noticeable on Corro-Coat PE Series 7® (CC) polymer more than Jotun Super Durable 2903® (JSD). The optimum parameters to prepare the highest foaming ratios were as follows: CC polymer with 2% NPs, compressed under a pressure of 10 K lbs. for a 3 min holding time and foamed at 290 °C for 15 min in the oven.

1. Introduction

Shape memory materials are stimuli-responsive materials with the ability to change their shape, after having been quasi-plastically distorted upon the application of an external stimulus. The stimulus is mostly heat, as reported by Carrell et al. [1]. After designing shape memory polymer snap fits triggered by heating, Chiodo et al. [2] conducted further development on heat triggered snap fits and fastening methods for the assembly/disassembly of products. Inadvertent triggering was the main obstacle for spreading of such joining methods. Ziout et al. [3] investigated various triggering methods, such as biological and magnetic triggers, as well as provided a non-comprehensive list of various triggers, such as physical- and chemical-based triggers.
The most common shape memory materials are shape memory alloys (SMAs) and shape memory polymers (SMPs). SMPs are distinguished from SMAs by unique properties, such as their light weight, ease of processing, low cost, and high shape recovery abilities. The shape memory effect can be observed in heat-activated SMPs when thermo-mechanical cycles are performed. These thermo-mechanical cycles consist of three main steps. First, the SMP is processed into a permanent shape, then it is heated up beyond glass transition temperature (Tg) and deformed. Next, it is cooled to reach its temporary shape. After that, it is heated to glass transition temperature (Tg) to trigger the shape recovery process, which returns it to its original permanent shape. The thermo-mechanical cycles are shown in Figure 1.
Consequently, SMPs are used widely for different applications, such as being light actuators, structural parts of a reduced size during transport, and as expandable/deployable structures. Furthermore, they can be used as hydrogen gas storage. Banyay et al. [4] created enclosed cells in cross-linked PVC foam and elastomeric polyurethane foam to store hydrogen gas; the tested foams did not show better volumetric capacity over metallic foams. However, they are preferred due to the permeability of hydrogen gas.

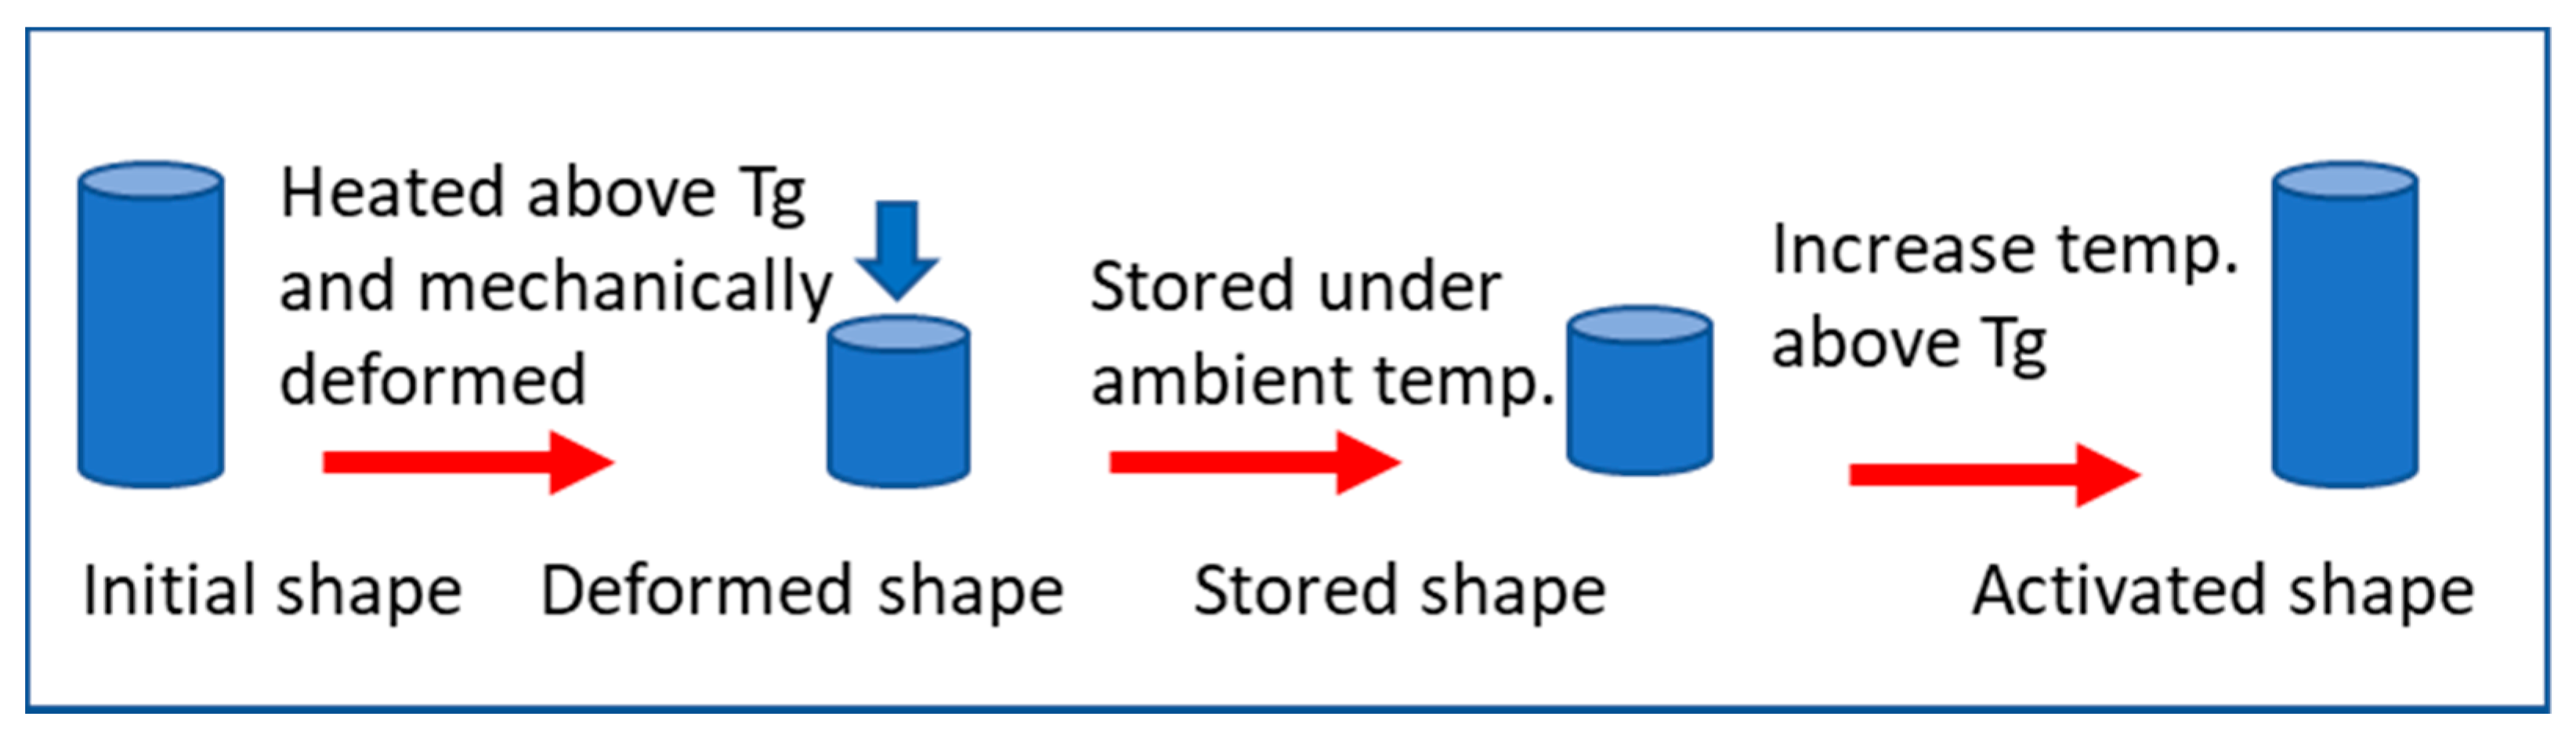
1.1. Shape Memory Foam

Polymers in foam structures have the advantages of being low density, compressible, lighter, and have a lower recovery force with a reduced stiffness and mechanical strength. The most common methods for producing foams are chemical or physical; these processes are complex, as they require the insertion of blowing agents. Some other methods are used to produce metallic foams, such as the melt-foaming process, which creates small pores in cell walls that decrease their stiffness. Zhang et al. [5] generated aluminum foam using the previously mentioned method. Another foaming process used with polymeric material is the two-step quenching route; Nam et al. [6] used this method to generate PLLA foams in which the polymer is cooled to a temperature below cloud temperature and maintained at that temperature for 1 min, and in the second step, rapid quenching takes place in a brass mold pre-equilibrated with liquid nitrogen. An emerging foaming process that does not require a chemical reaction or a physical foaming agent is solid-state foaming. This process has been tested on epoxy polymers by Quadrini and his team. The main purpose of this foaming process is to simplify the overall process and to reduce the cost. It is done by compacting the polymer powder into tablets, and then heating it inside an oven at a temperature higher than the boiling point of the epoxy for a certain period of time, after which is cooled by air.

1.2. Shape Memory Polymer Composites

Shape memory composites have higher levels of strength and stiffness. Zheng et al. [7] inserted Fe3O4 nanoparticles into a poly(d,l-lactide) (PDLLA) matrix and found that the more Fe3O4 added to the structure, the higher the tensile strength obtained. According to the authors, this is attributed to the interfacial interaction between the nanoparticle (NP) phase and the polymer phase in the composite matrix. Abdullah and Ansari [8] reported an increment in the tensile strength of epoxy resin after the addition of different volume percentages of graphene oxide.
Similarly, Fei et al. [9] synthesized an SMP composite using ultrasound technology composed of poly(methyl methacrylate) and carbon nanotubes. The composite was triggered by heat generated from local application of electric voltage. The ease of control of the shape memory process via local application of electricity on a synthesized composite makes it a good contribution in medical applications such as intravascular medical devices.
Squeo and Quadrini [10] studied the effect of adding nanoclay to epoxy foam and also reported an increment in compressive strength and toughness as a greater weight percentage of nanoclay was added to the matrix, due to the interaction between nanoclay and the epoxy foam structure, which leads to a change in the intrinsic behavior of the foam under loading. This offers further advantages over SMPs. The reviewed literature of the solid-state foaming process has not been fully explored; process performance with respect to various polymers needs to be studied, and the selection of optimal process parameters for a specific polymer need to be identified. Therefore, this research was concerned with studying the foaming process of polyester-based thermoset polymers, where the foam ratio and density were used as process performance indicators. The optimum foaming parameters need to be identified based on the highest foaming ratio and the lowest foaming density for the prepared samples.

2. Experimental Method

2.1. Materials

This research utilized the syntheses method proposed by Kulkarni et al. [11], who used the co-precipitation technique to prepare nanoparticles. Ferric and ferrous chlorides were blended in a 2:1 proportion. Fe2+ and Fe3+ solutions were prepared by making their aqueous solutions in distilled water; both ions were present in the solution and were heated for 10 min at a temperature of 50 °C. The solution was precipitated after heating using ammonia under continuous stirring on a magnetic stirrer at 50 °C. Black-colored iron oxide particles precipitated and were isolated using a strong magnet, and afterwards cleaned with distilled water. The powder was then dried gradually via air. The process of synthesizing Fe3O4 is based upon the following reaction:
Fe+2 + 2Fe+3 +8(OH)−1 ➔ Fe3O4 + 4H2O
Polyester-based polymers have not been studied for foam production using the solid-state foaming process. This type of polymer gets excited and breaks its inter-polymer bonding when exposed to enough heat, and once cooled down, most of these bonds reform. Hence, its foam is expected to show shape memory behavior. This feature makes polyester-based polymers suitable for this research. First, the polymer Corro-Coat PE Series 7® was purchased from Jotun Paints. This polymer is usually used for fixtures and to paint automotive parts and/or accessories. What makes this polymer appropriate for this research is also the reactive carboxyl groups cured by triglycidyl iocyanurate (TGIC). TGIC has three pendant epoxide groups that react with the carboxyl groups on the polyester resin in an additive fashion and acts as a crosslinker. The second polymer, JSD, is a TGIC-free powder with no volatile organic compounds. This is an eco-friendly product used in architectural-extracted aluminum and cladding.

2.2. Material Characterization
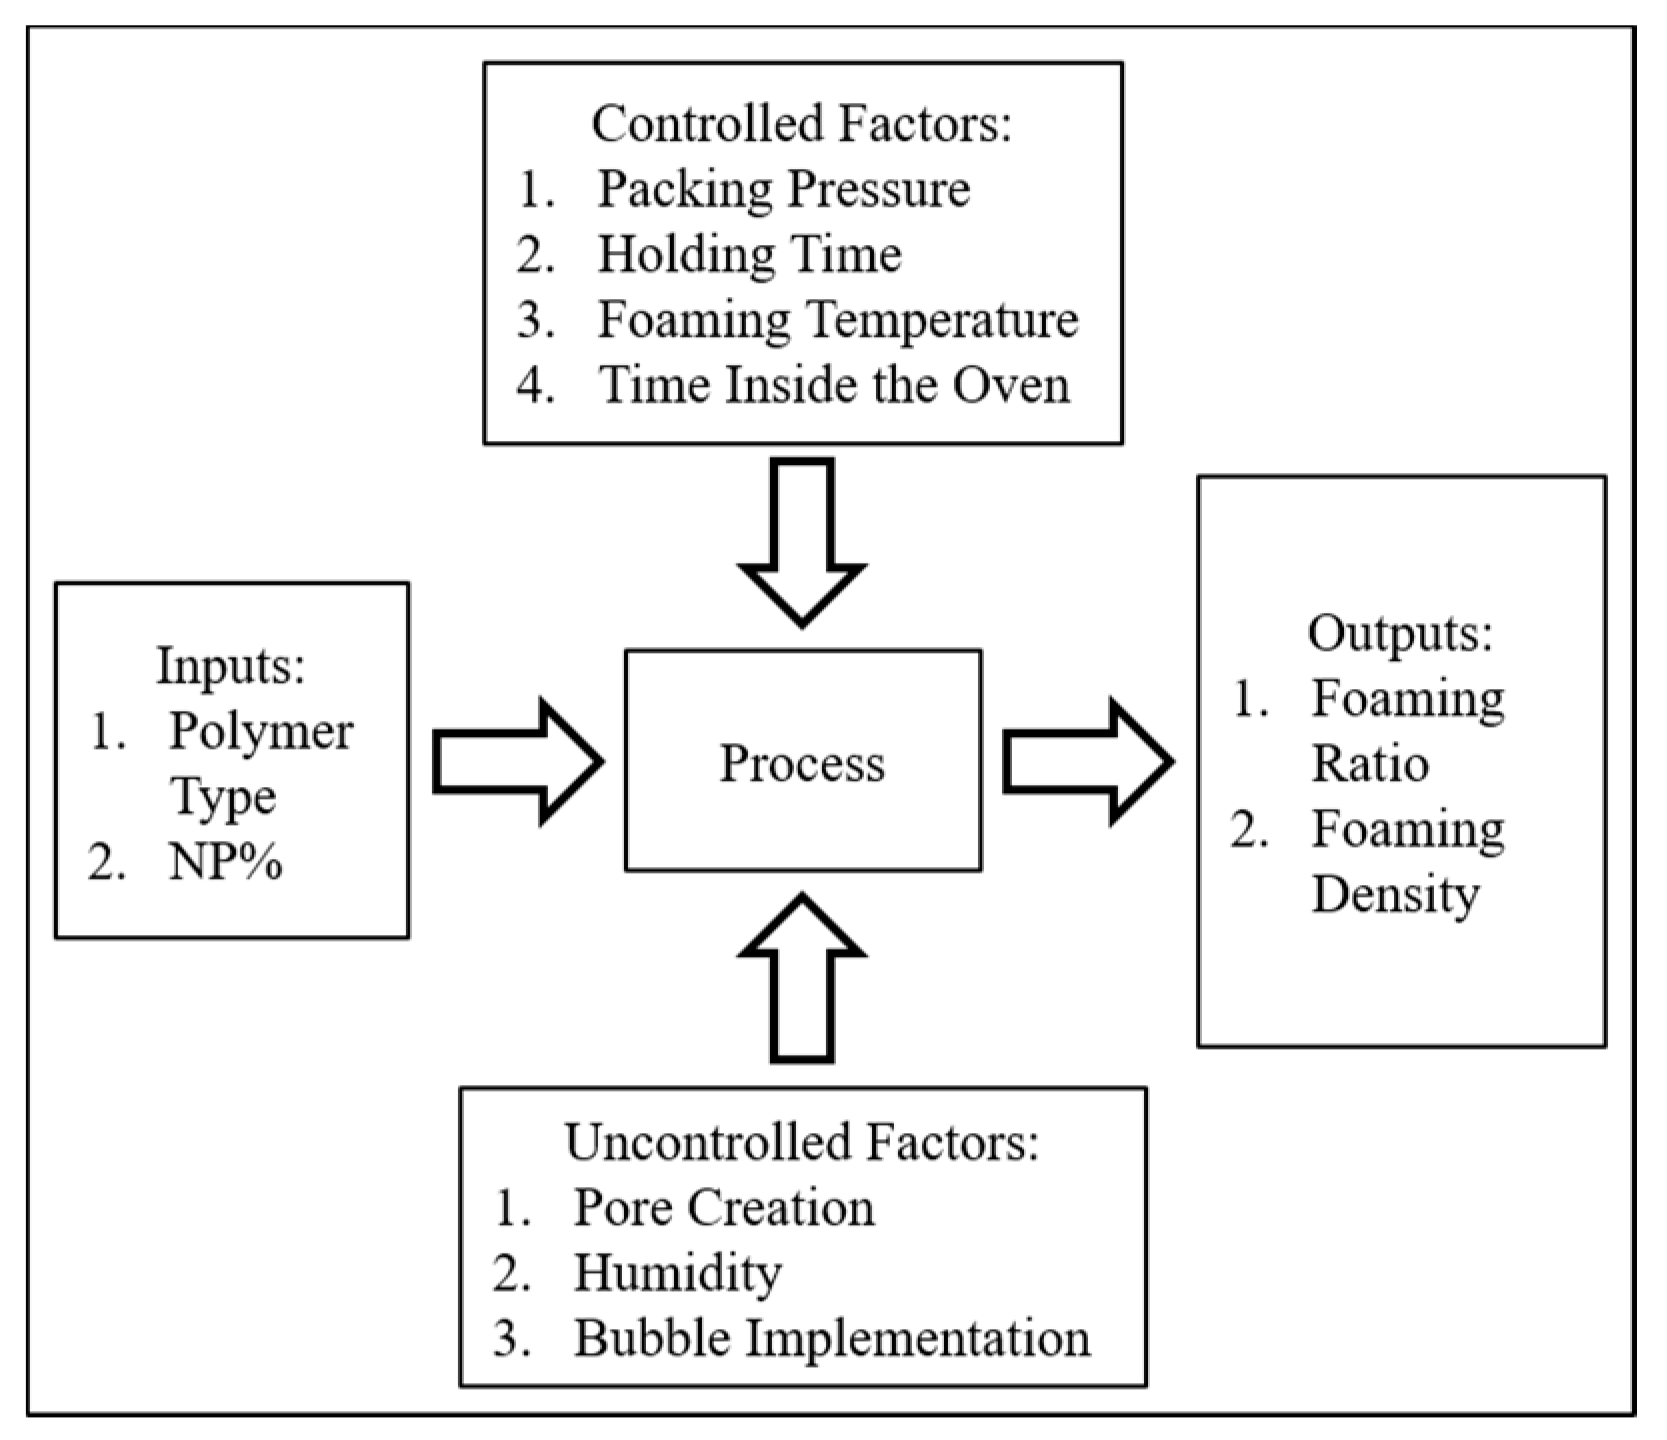
Differential scanning calorimetry (DSC) in the range 30–250 °C with an accuracy of up to ±0.1 °C was employed. All of the samples were heated from room temperature up to 250 °C at an incremental rate of 10 °C/min in order to remove any heating history from the sample. It was then cooled down at the same rate to return it to room temperature. In the end, the sample was heated again to 250 °C at the same rate of 10 °C/min. Next, DSC was performed on pure CC polymer, CC + 0.5 wt.% Fe3O4, pure JSD, and JSD + 2 wt.% Fe3O4 NPs. These samples had measured weights of 8.3 mg, 6.8 mg, 8.1 mg, and 8.2 mg, respectively.
X-ray diffraction (XRD) was operated to determine the crystal size apparent in our nanoparticles. The machine operated within an angle range of 20° to 80°, at a scanning rate of 2°/min. The machine had a Cu-Kα X-ray source. Finally, the graphs obtained from the XRD machine were analyzed to determine the crystal size of the sample by using the Sherrer Equation.

2.3. Taguchi Design

After the nanoparticle preparation and selection of the polymers, a Taguchi plan was designed utilizing Minitab software (Minitab.v17 Minitab, LLC, State College, PA, USA). This method uses the principle of orthogonal arrays to study the effect of a certain number of parameters while allowing for a reduced number of experiments in order to find the main factors effecting the output. The number of experiments was determined based on the Taguchi plan with the formula below:
N T a g u c h i   =   1   +   N v   ( L 1 )
where N T a g u c h i is the number of experiments, N v is the number of parameters, and L is the levels for each parameter. In this research, six different factors were selected to study their effect on the foaming process. These were the percentage of NPs, polymer type, packing pressure, holding time, foaming temperature, and foaming time. The Taguchi plan was designed using Minitab software to determine the effect of the different parameters on the foaming process. Three replicas were created for every set of experiments. The orthogonal array design for this research can be seen in Table 1.
The input materials used in this research were the polymer type and the amount of NPs. The control factors that could be manipulated were packing pressure, holding time, foaming temperature, and foaming time. The uncontrolled factors that could not be changed were pore creation, humidity, and bubble implementation. The output from the process was the foaming ratio and density as measured. A model can be seen in Figure 2 below.

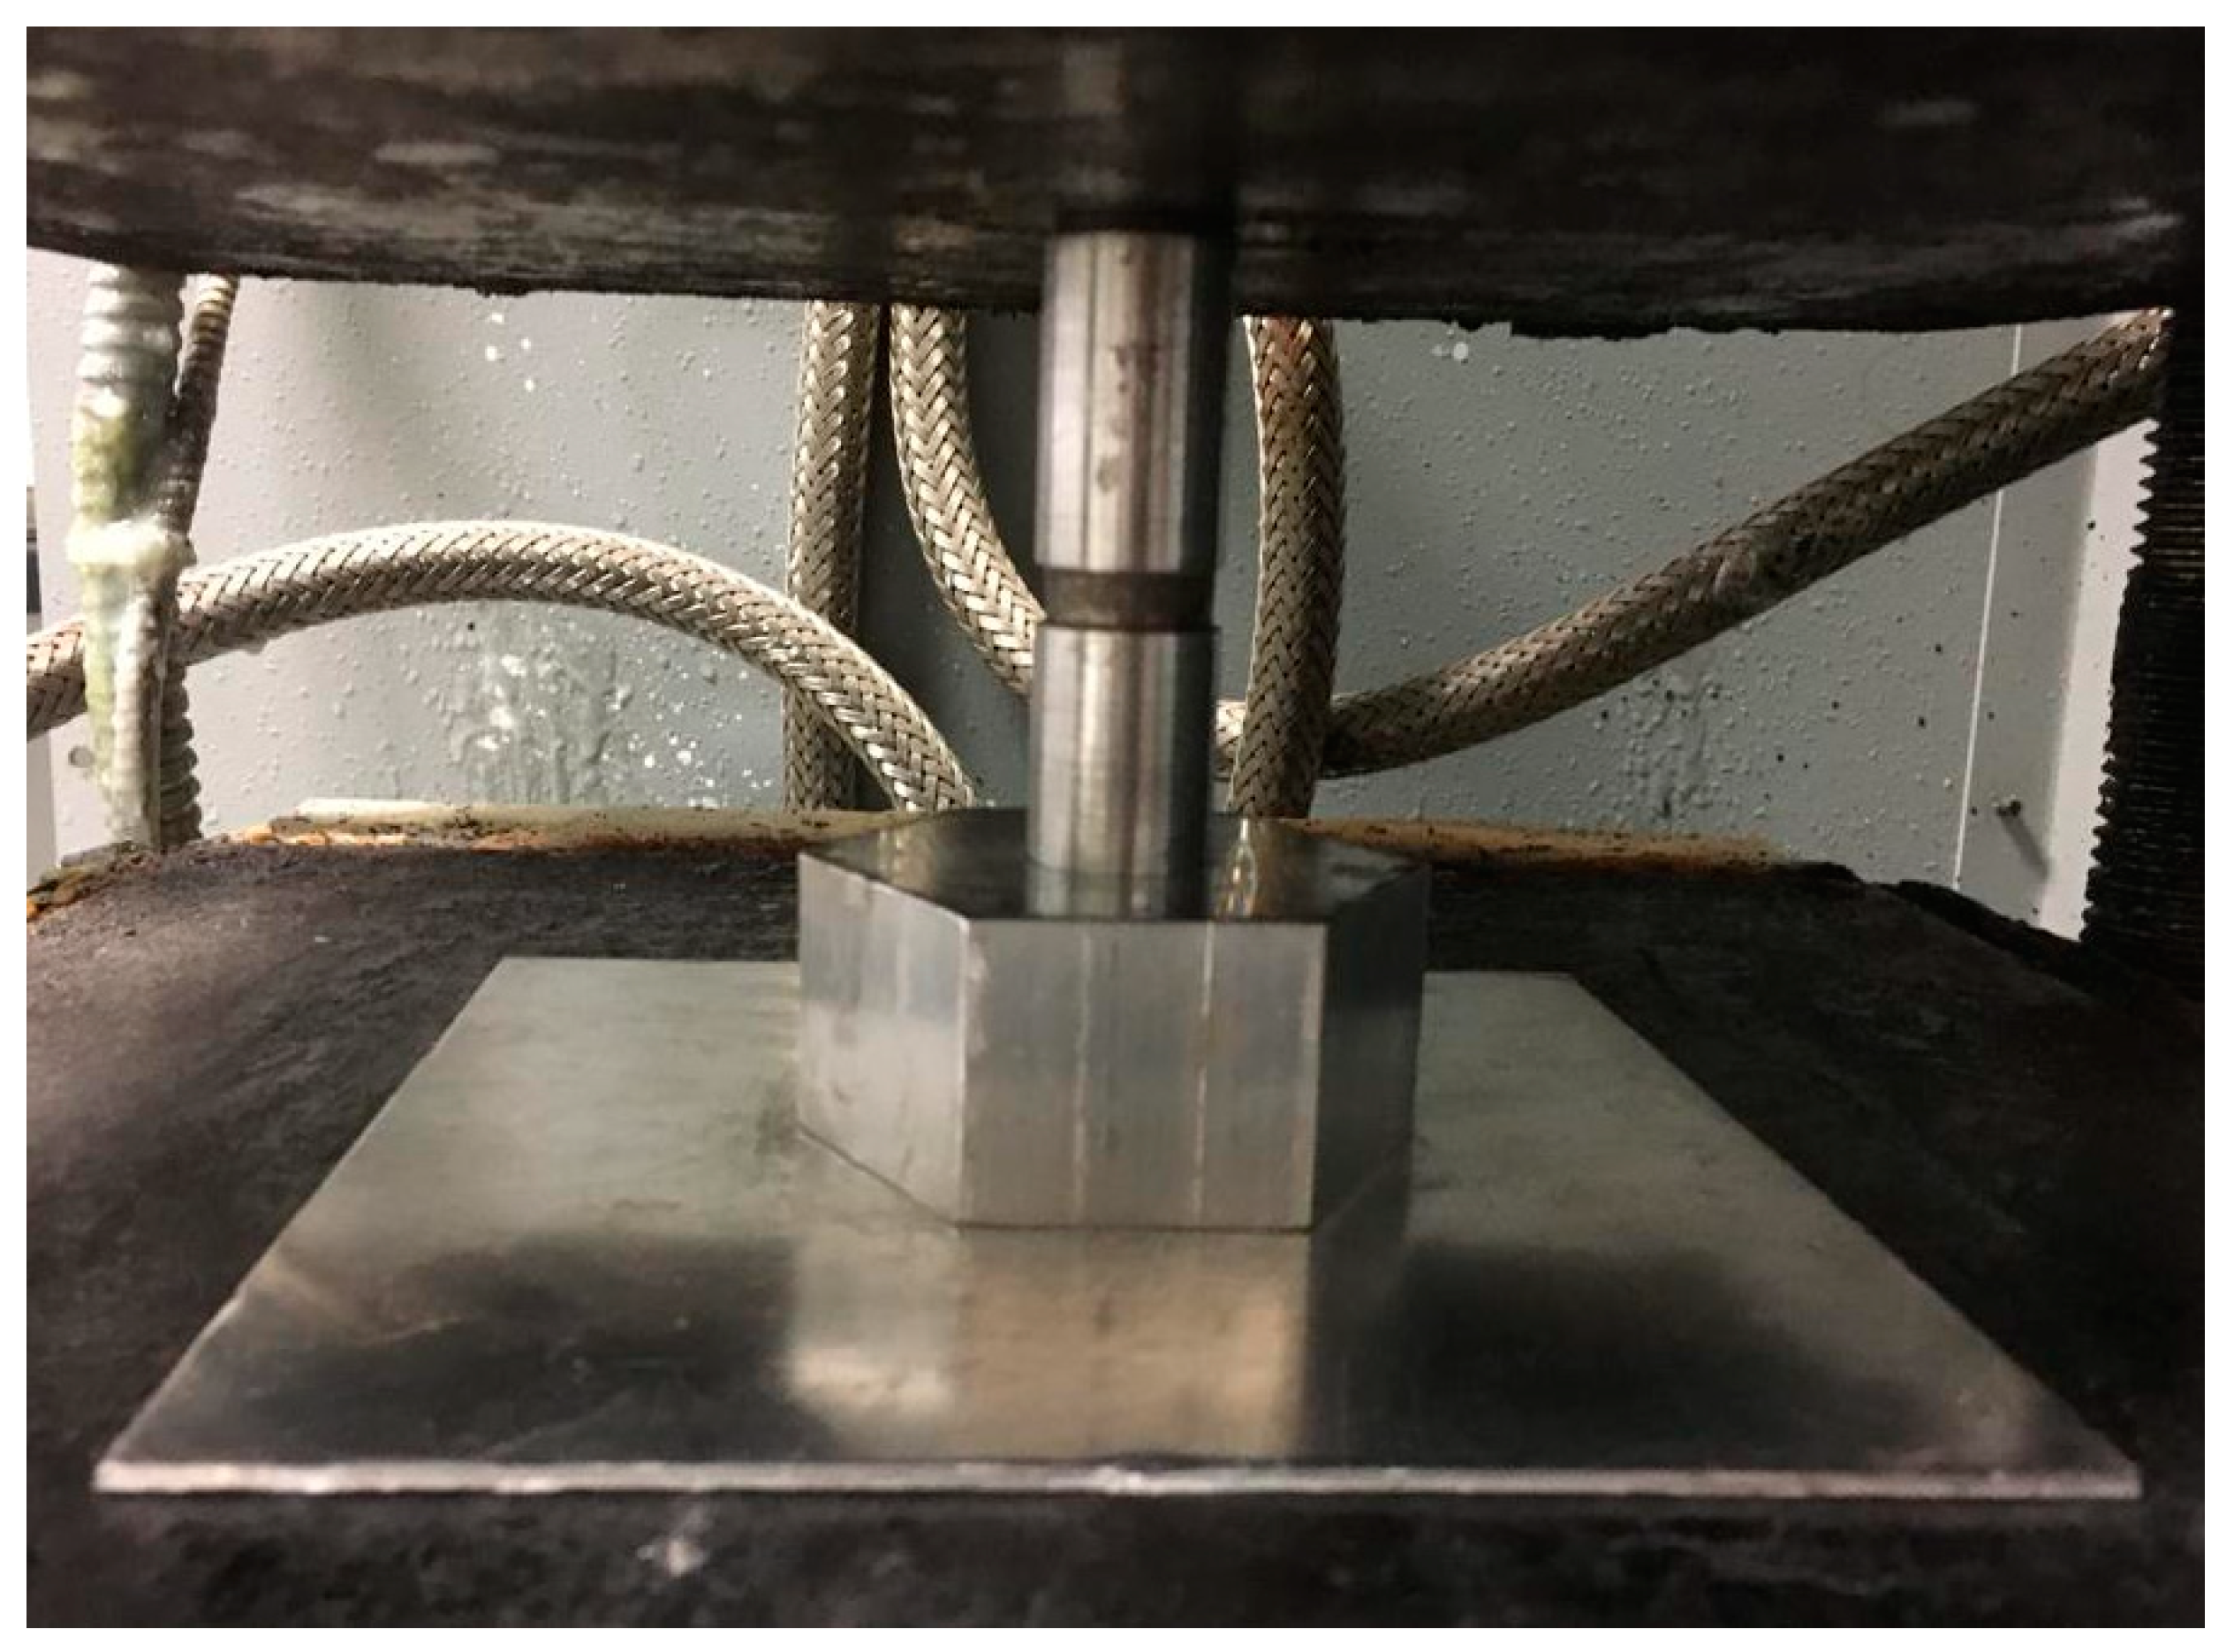
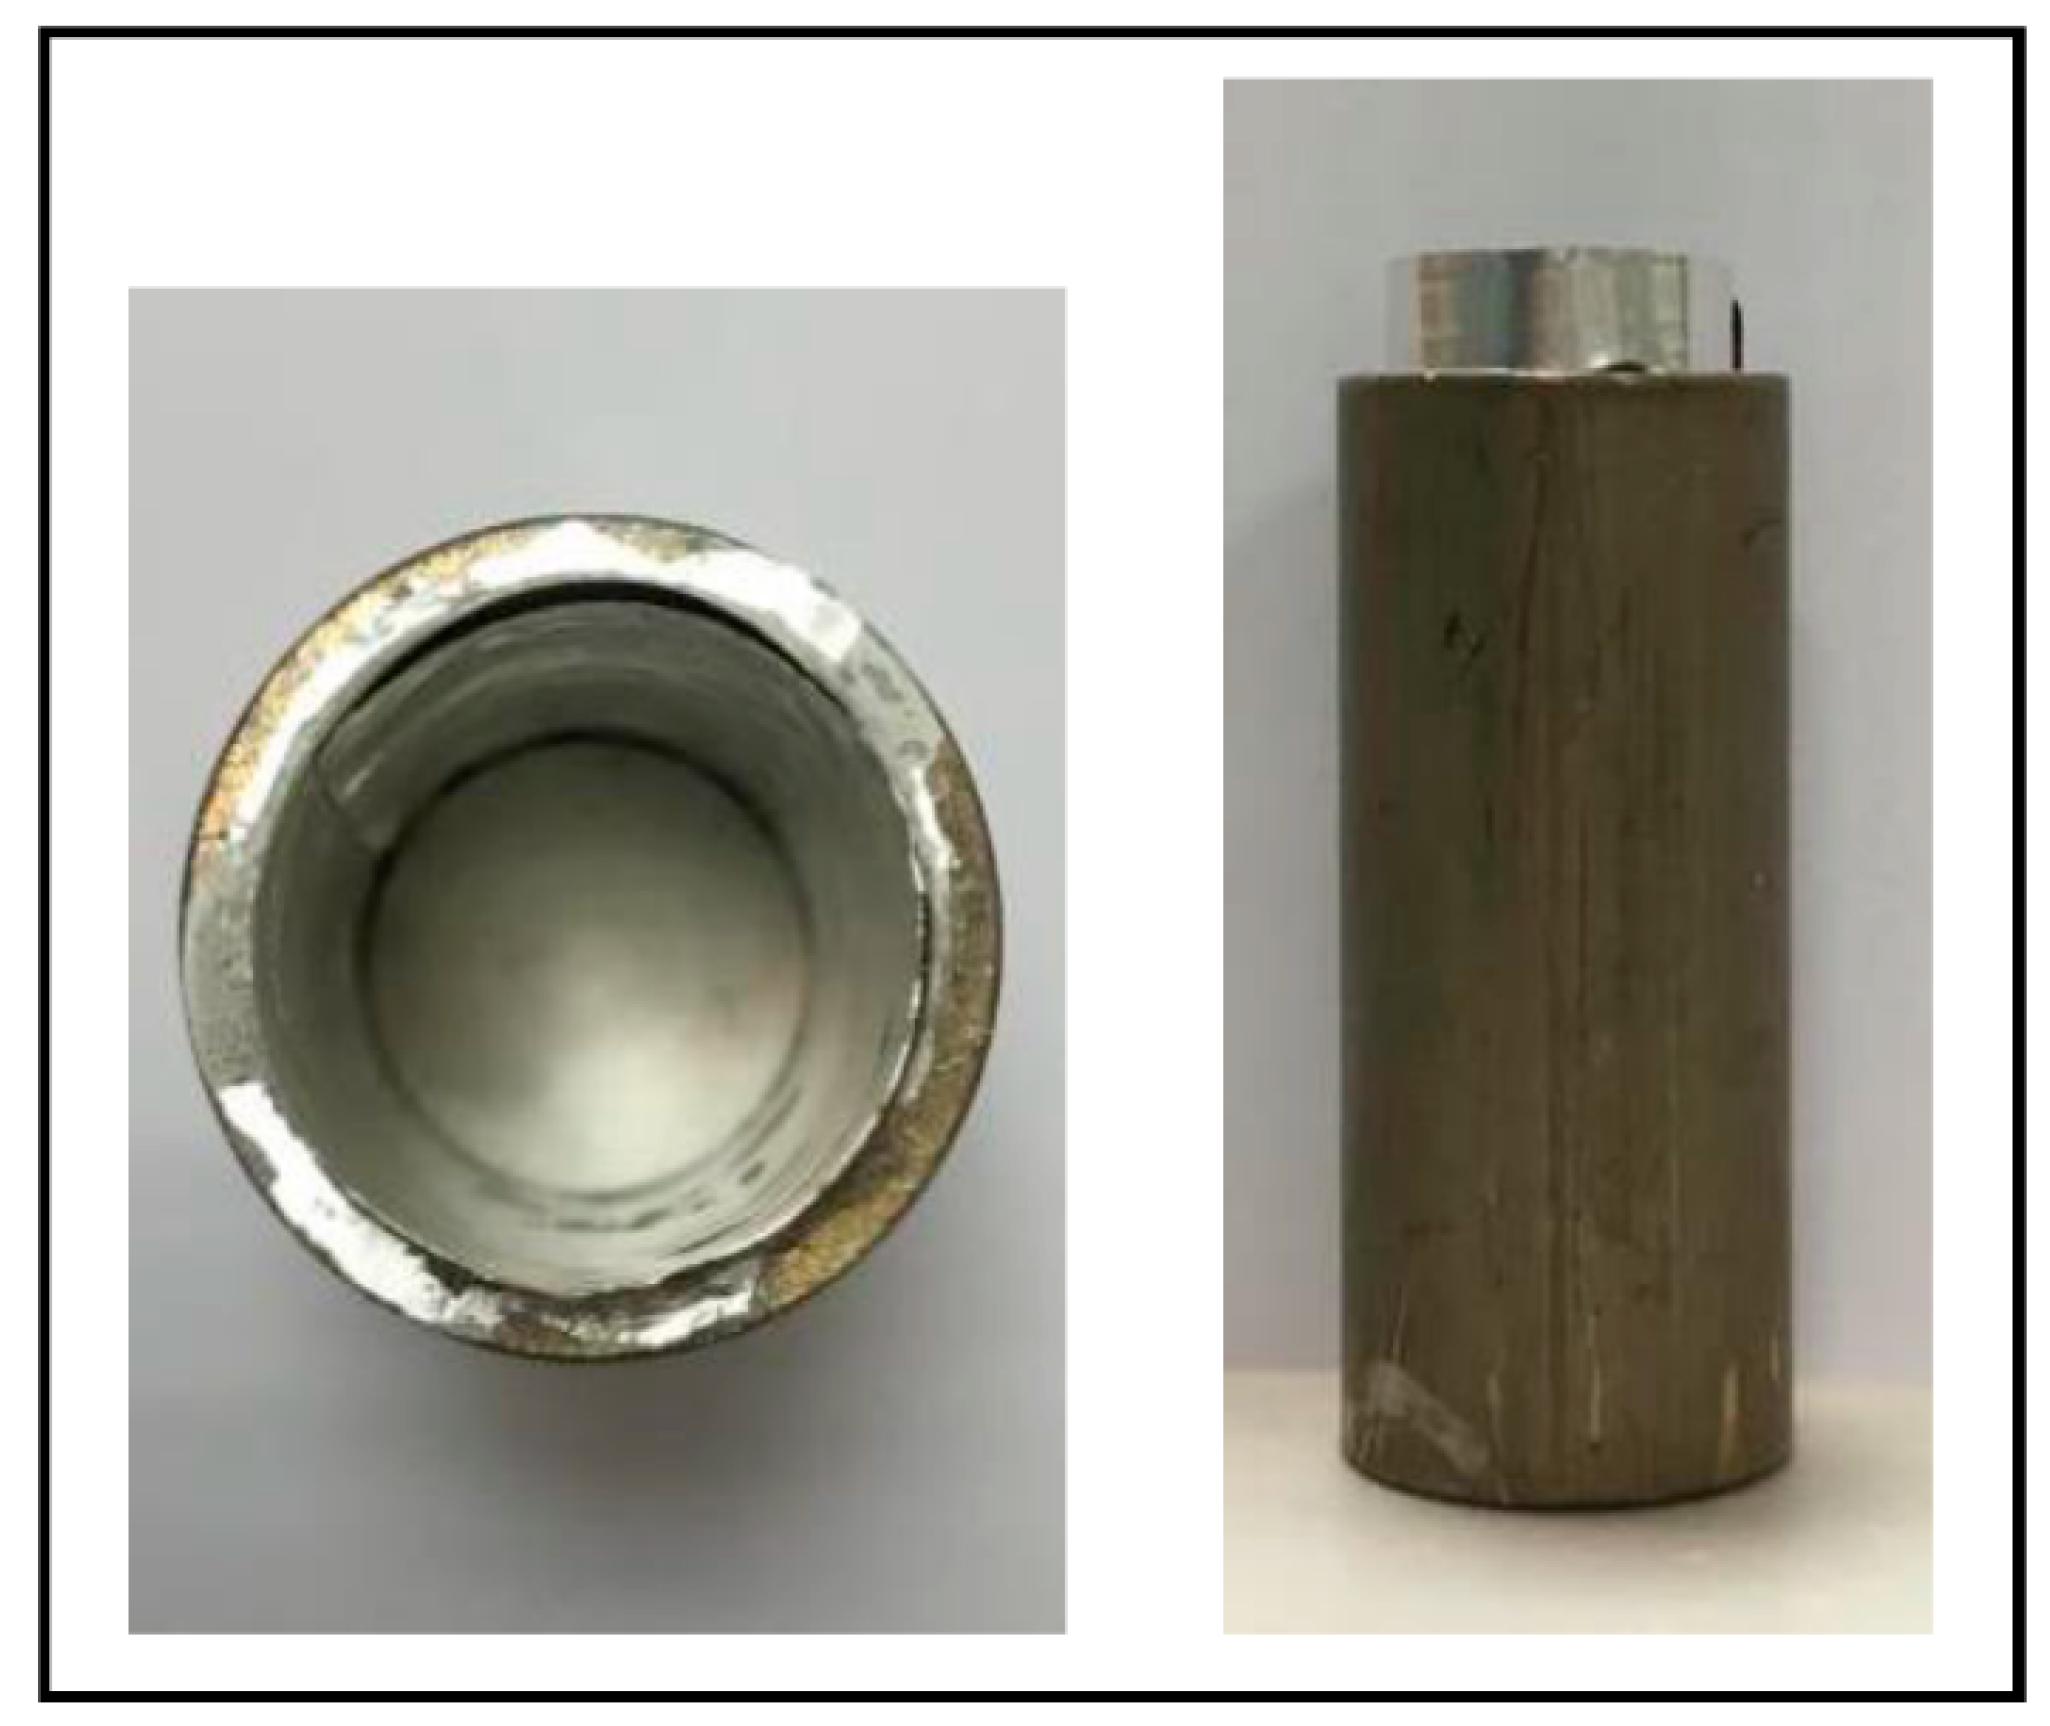
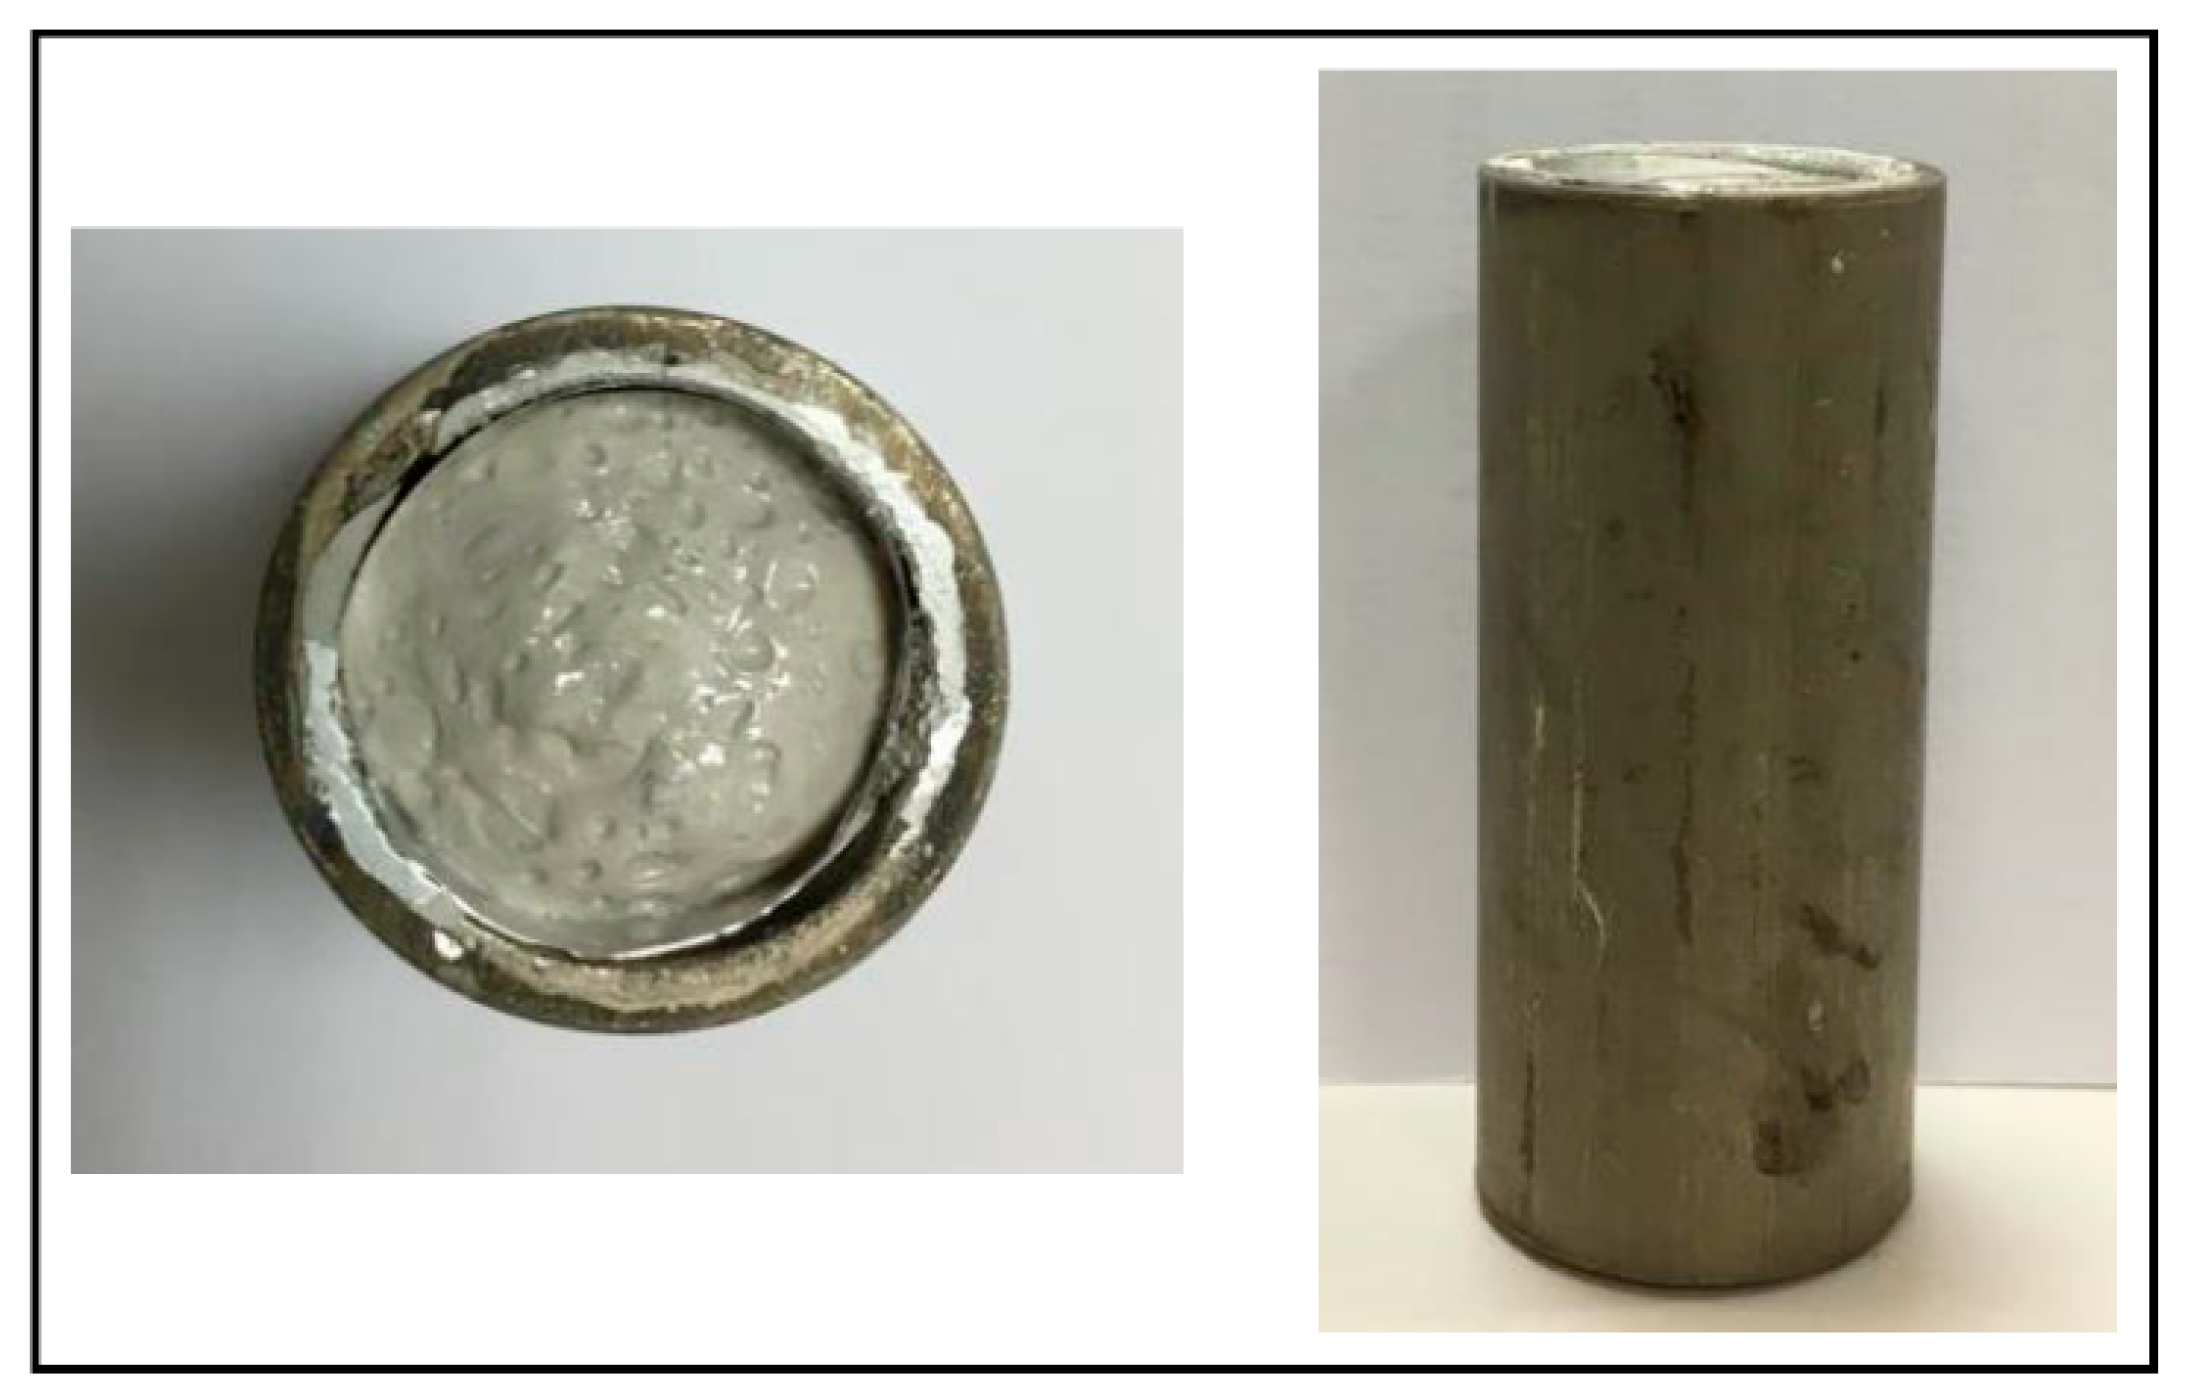
2.4. Tablet Preparation

The tablets used in this research were prepared according to different parameters, based on the Taguchi plan generated. All of the tablets had a total weight of 5 g of polymer powder or, in some cases, polymer powder plus Fe3O4 NPs. The powder was poured into a stainless steel mold with an inner diameter of 20.3 mm, and the mixture was then packed gently into the mold using a stainless steel plunger. This weight was selected in order to avoid any powder loss when packing with the plunger. The whole setup was then placed on a stainless steel base. A Carver Hydraulic Press System® provided the required pressure at a pump rate of 1.56 mm/s, as shown in Figure 3. Applying high pressure to the powder causes it to stick together and form a tablet with the desired dimensions of 9 mm in height and 20.3 mm in diameter. Finally, the tablet was extracted from the mold via a gentle hammering process to avoid cracking or breaking it.

2.5. Tablet Foaming

After the tablet is extracted, it is ready for the second processing stage, namely, the foaming stage. The foaming temperature and time have to be determined. Thus, a pre-test was carried out to choose the best foaming temperatures. All of the tablets were placed on a thick aluminum sheet and then slowly inserted inside another mold (see Figure 4) with an inner diameter of 20.7 mm. They were then placed in an oven with a predetermined temperature in order to start the foaming process. These tablets were placed in the oven for specified times and were allowed to cool in air for 15 min. The resultant sample shape was cylindrical (see Figure 5). This foaming technique is called solid-state foaming and it was recently proposed and tested for the first time on polymers using 3M Epoxy Resin by Quadrini and Squeo [12]. After foaming, the samples were extracted from the mold and transferred for further testing.

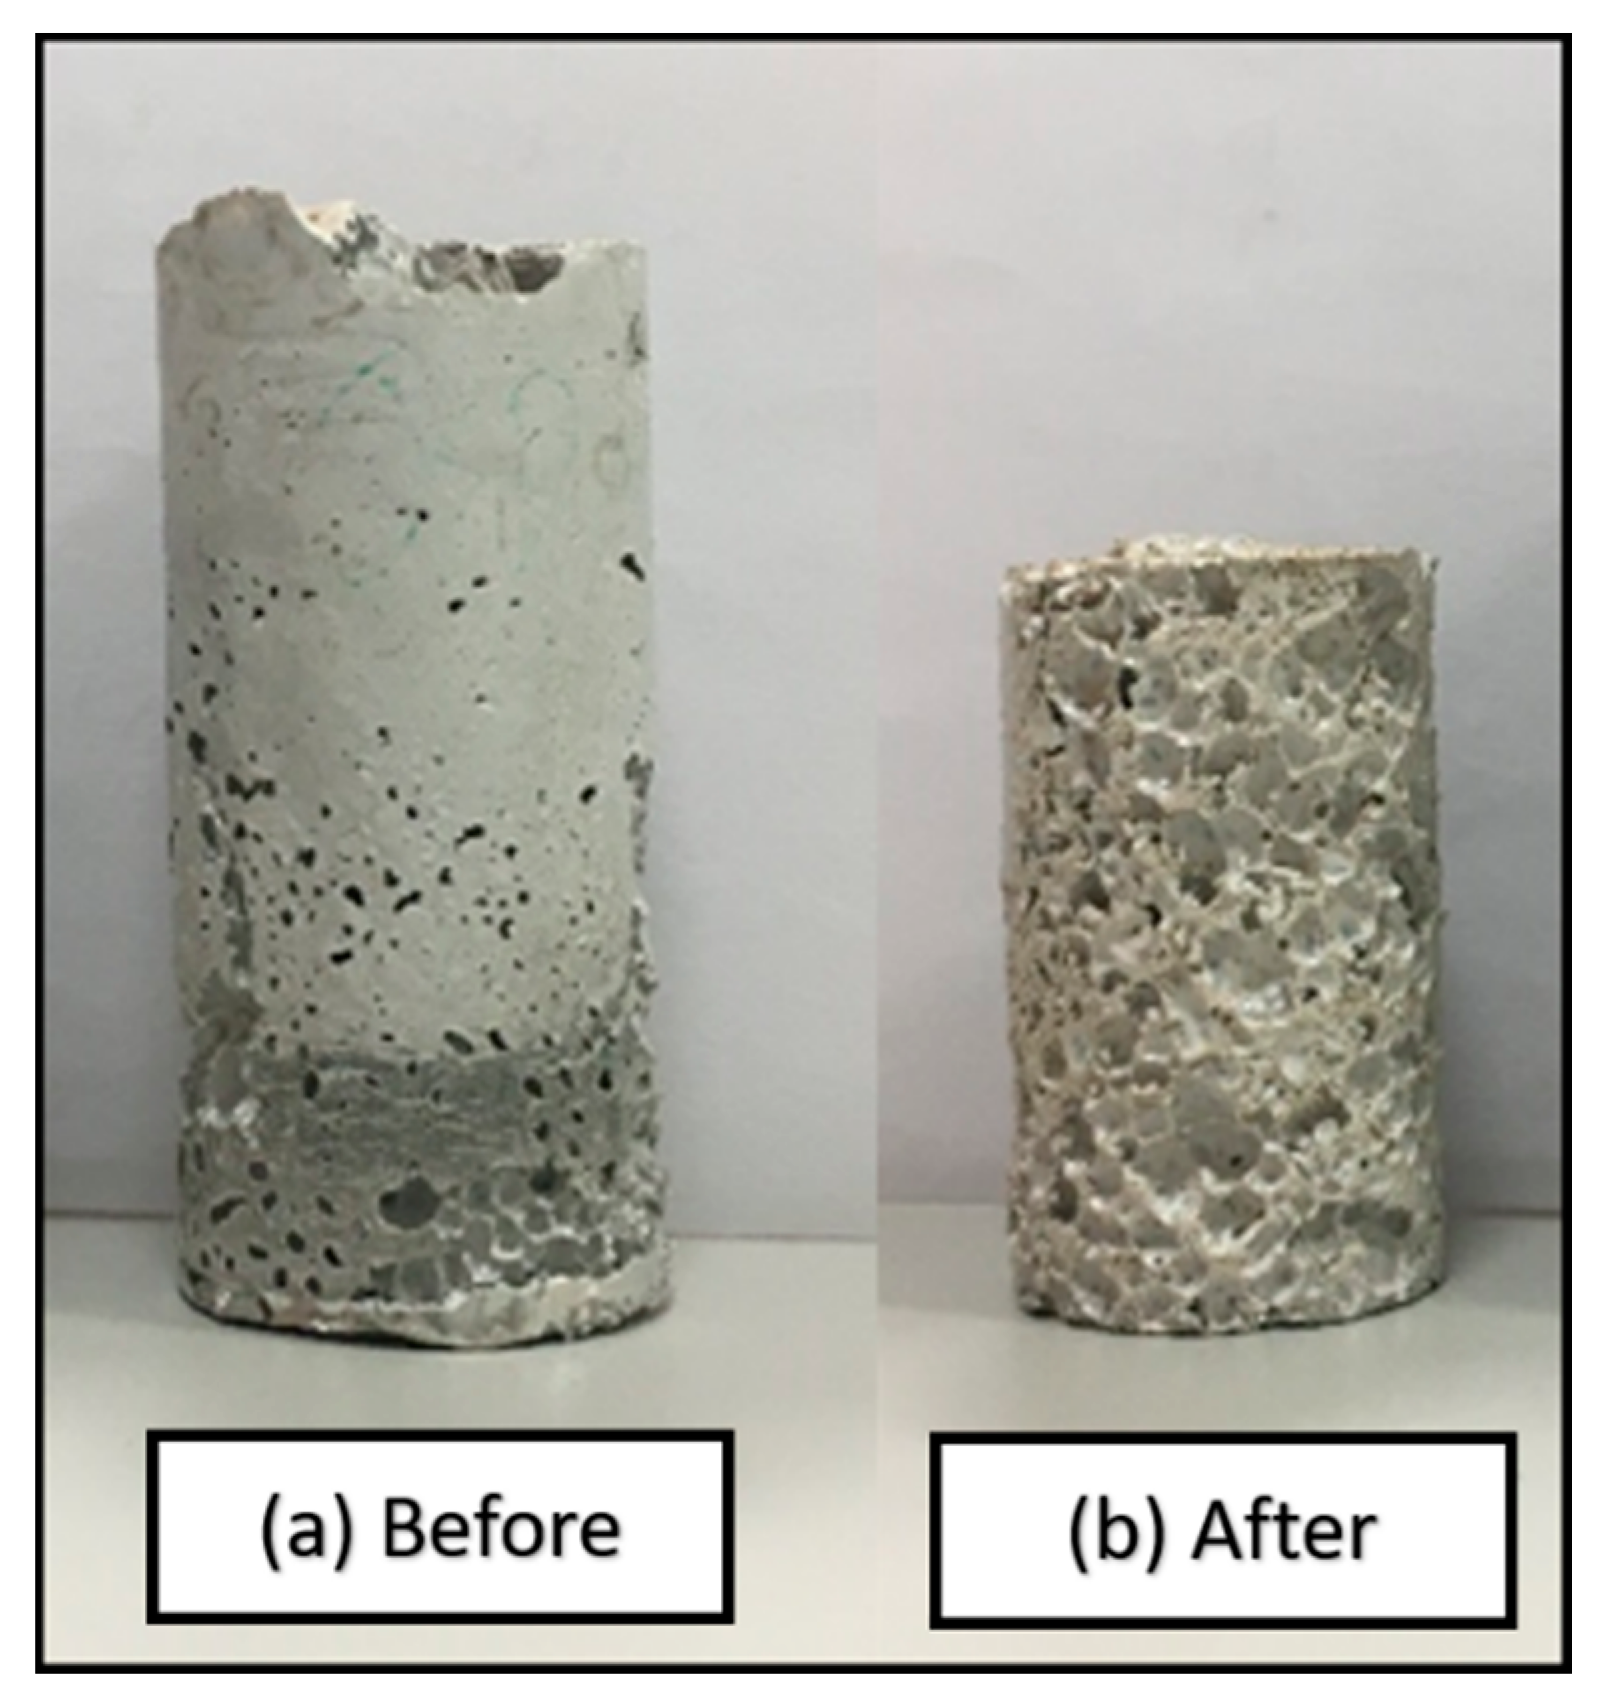
2.6. Sample Machining

The foamed samples did not have regular dimensions, especially in their upper parts, where they tended to form either a dome shape or left a void in the middle with higher foam on the sides of the cylinder. These deformations occurred because the solid-state foaming process cannot meet tight dimensional tolerances, so it was necessary to use a Computer Numerical Control (CNC) turning machine; to grant them regular shapes with uniform height for easier calculation (see Figure 6). After achieving a uniform height and length, the foamed samples were ready for testing.

2.7. Foaming Ratio Determination

Foaming ratio measurements were performed on three different samples from each experiment, and were calculated after the tablet foaming and sample machining stages. The foaming ratio in this paper is defined as the ratio between the foam height and the tablet height. The heights and diameters of each sample were measured using a digital caliper after it cooled down in an air environment. The mass was also measured for every sample from each experiment using a single pan analytical digital balance. Additionally, the average height for each set of replicas was divided by the average tablet height from the same set to obtain the average foam ratio for that run. All of the data were entered into an Excel spreadsheet using the formula below to calculate the volume of a sample.
V =   π r 2 h
where r refers to the radius of the sample and h indicates the height. After the volume was calculated, another formula was used to measure the foam density of each sample. This was achieved by dividing the average mass from each experiment by the calculated average volume from the same experimental set. A pycnometric test was conducted to improve the foam porosity measurements and to measure the absolute density of the prepared foamed samples; the results are shown in Table 2.

2.8. Foaming Temperature Determination

Samples were prepared with pure CC and CC + 2 wt.% Fe3O4 NPs, as well as pure JSD and JSD + 2 wt.% Fe3O4 NPs. The main goal of this experiment was to test for the best foaming temperature. The foaming temperatures tested were 200, 240, 260, and 290 °C. Selecting these values was far from random, as they had to be optimum to avoid burning and to assure the polymerization of the polymer powder. The temperature at which the lowest density was obtained was considered to be the best foaming temperature.
It is clear from Figure 7 and Figure 8 that the increment in the foaming temperature caused an increment in the foaming ratio, resulting in larger pores in both polymer matrices. The foaming temperature’s impact on the CC polymer was at its maximum between 260 and 290 °C, but the difference between these values was not significant. On the contrary, JSD showed a different range of working temperatures at which the highest foam ratio could be obtained. However, 260 and 290 °C were selected as the two levels for the foaming temperature because of their obvious positive impact on the ratio of CC foam.

3. Results and Discussion

3.1. Material Characterization

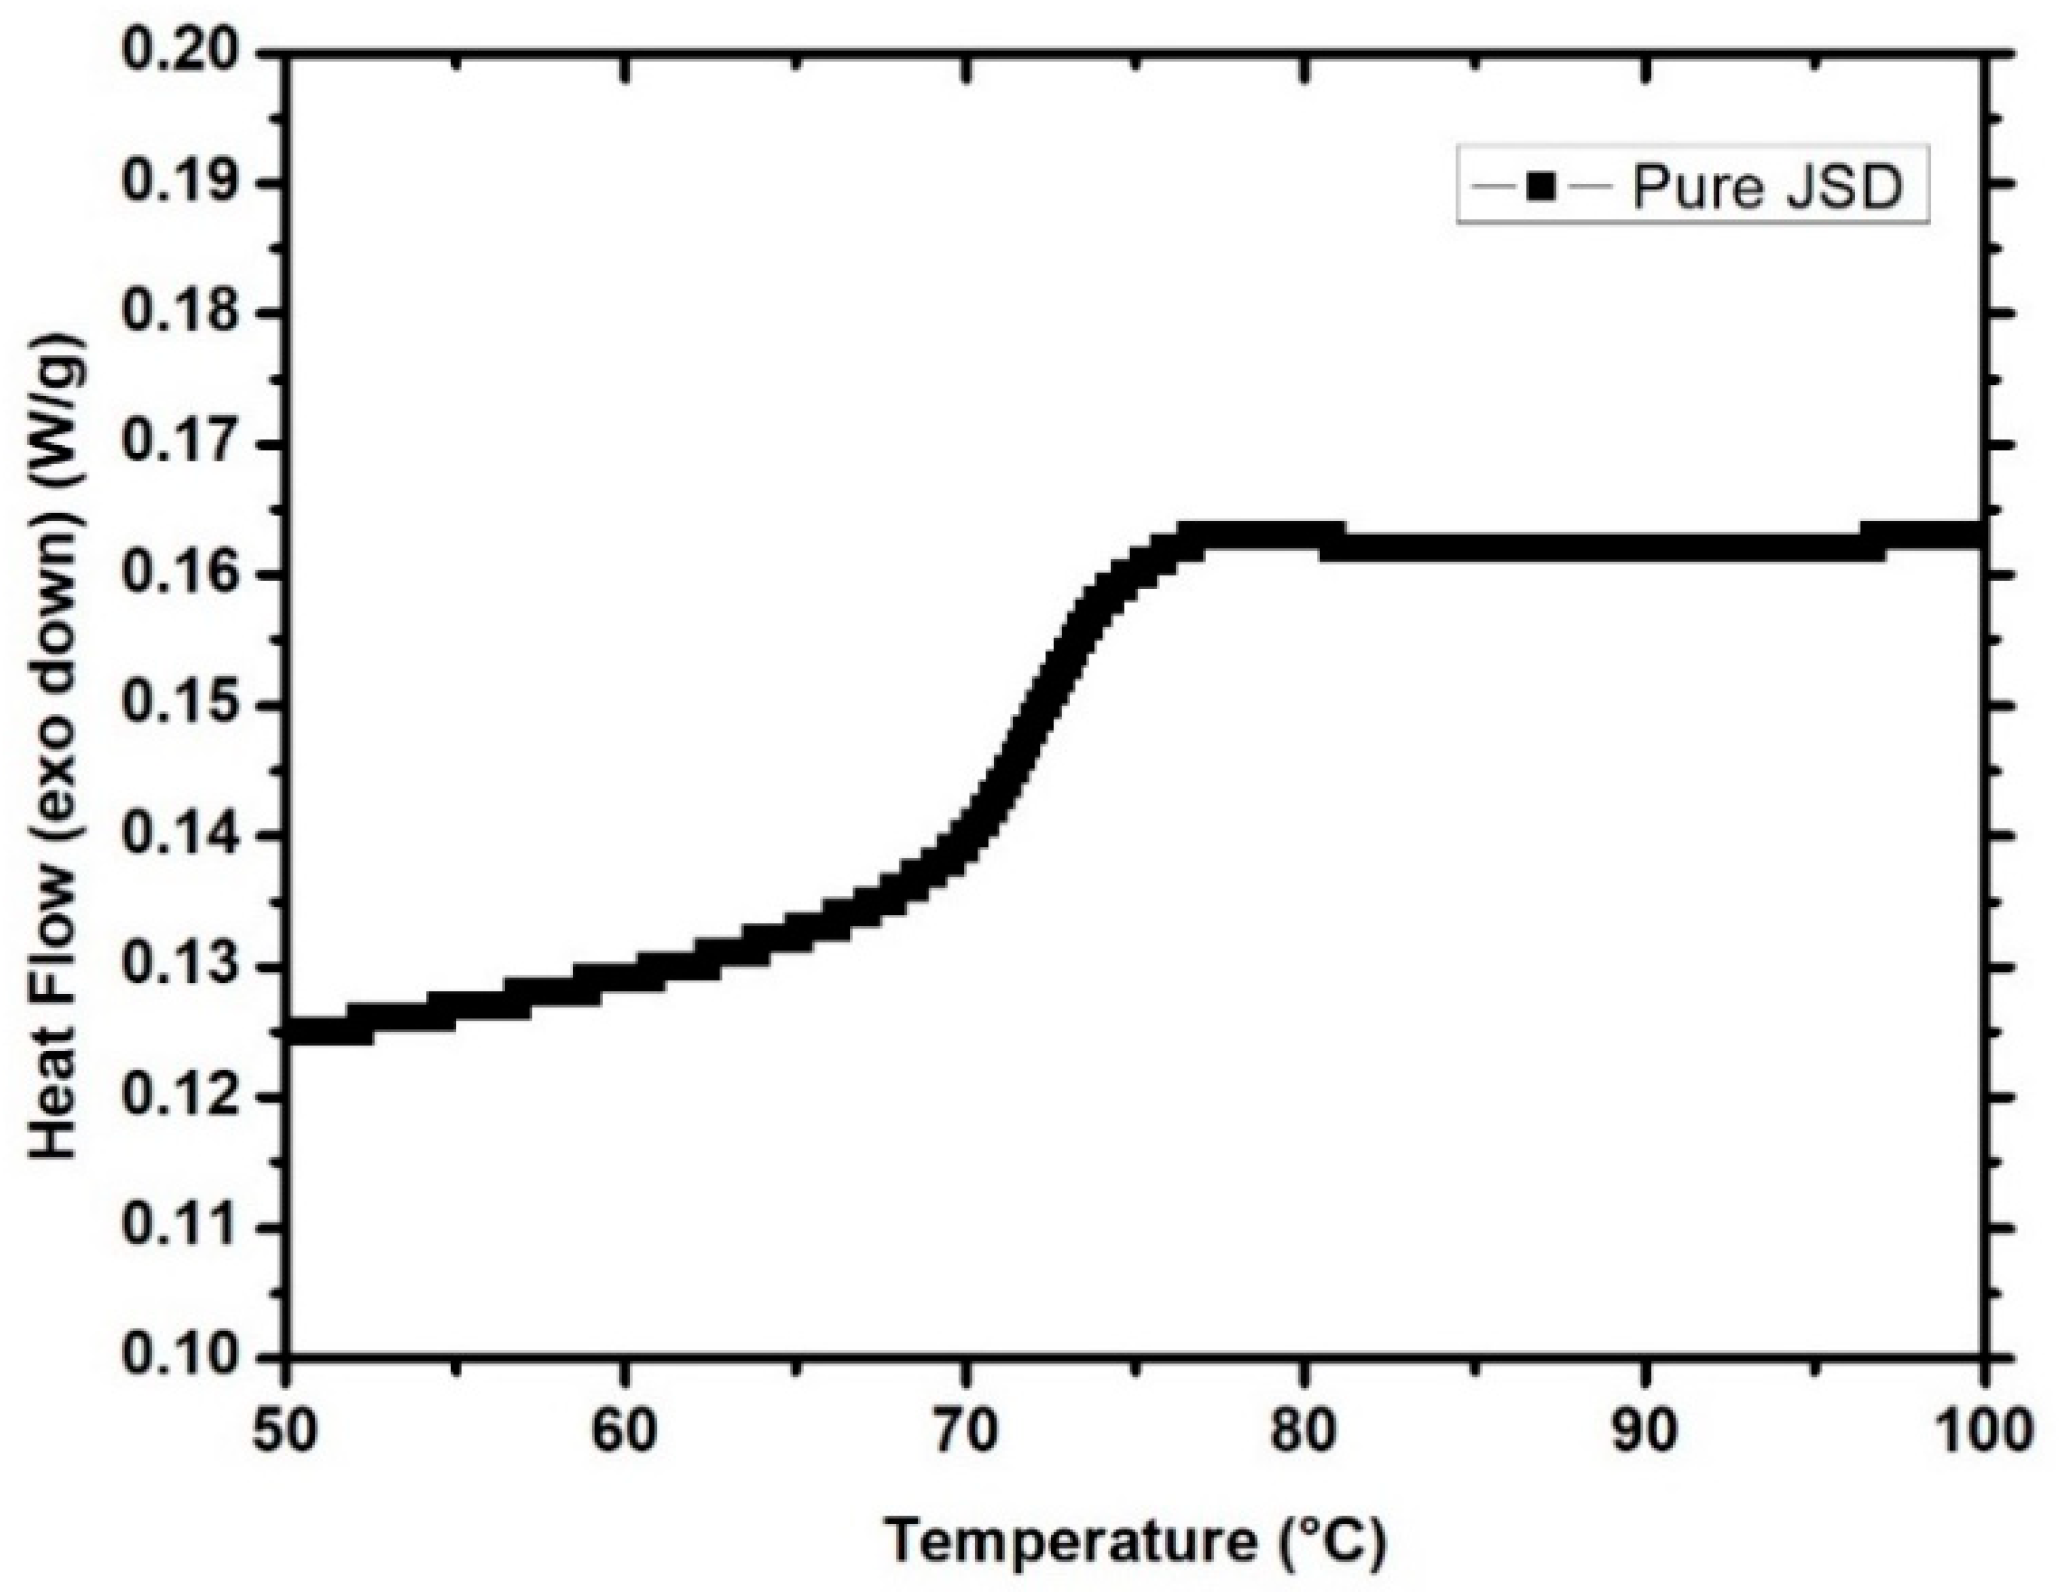
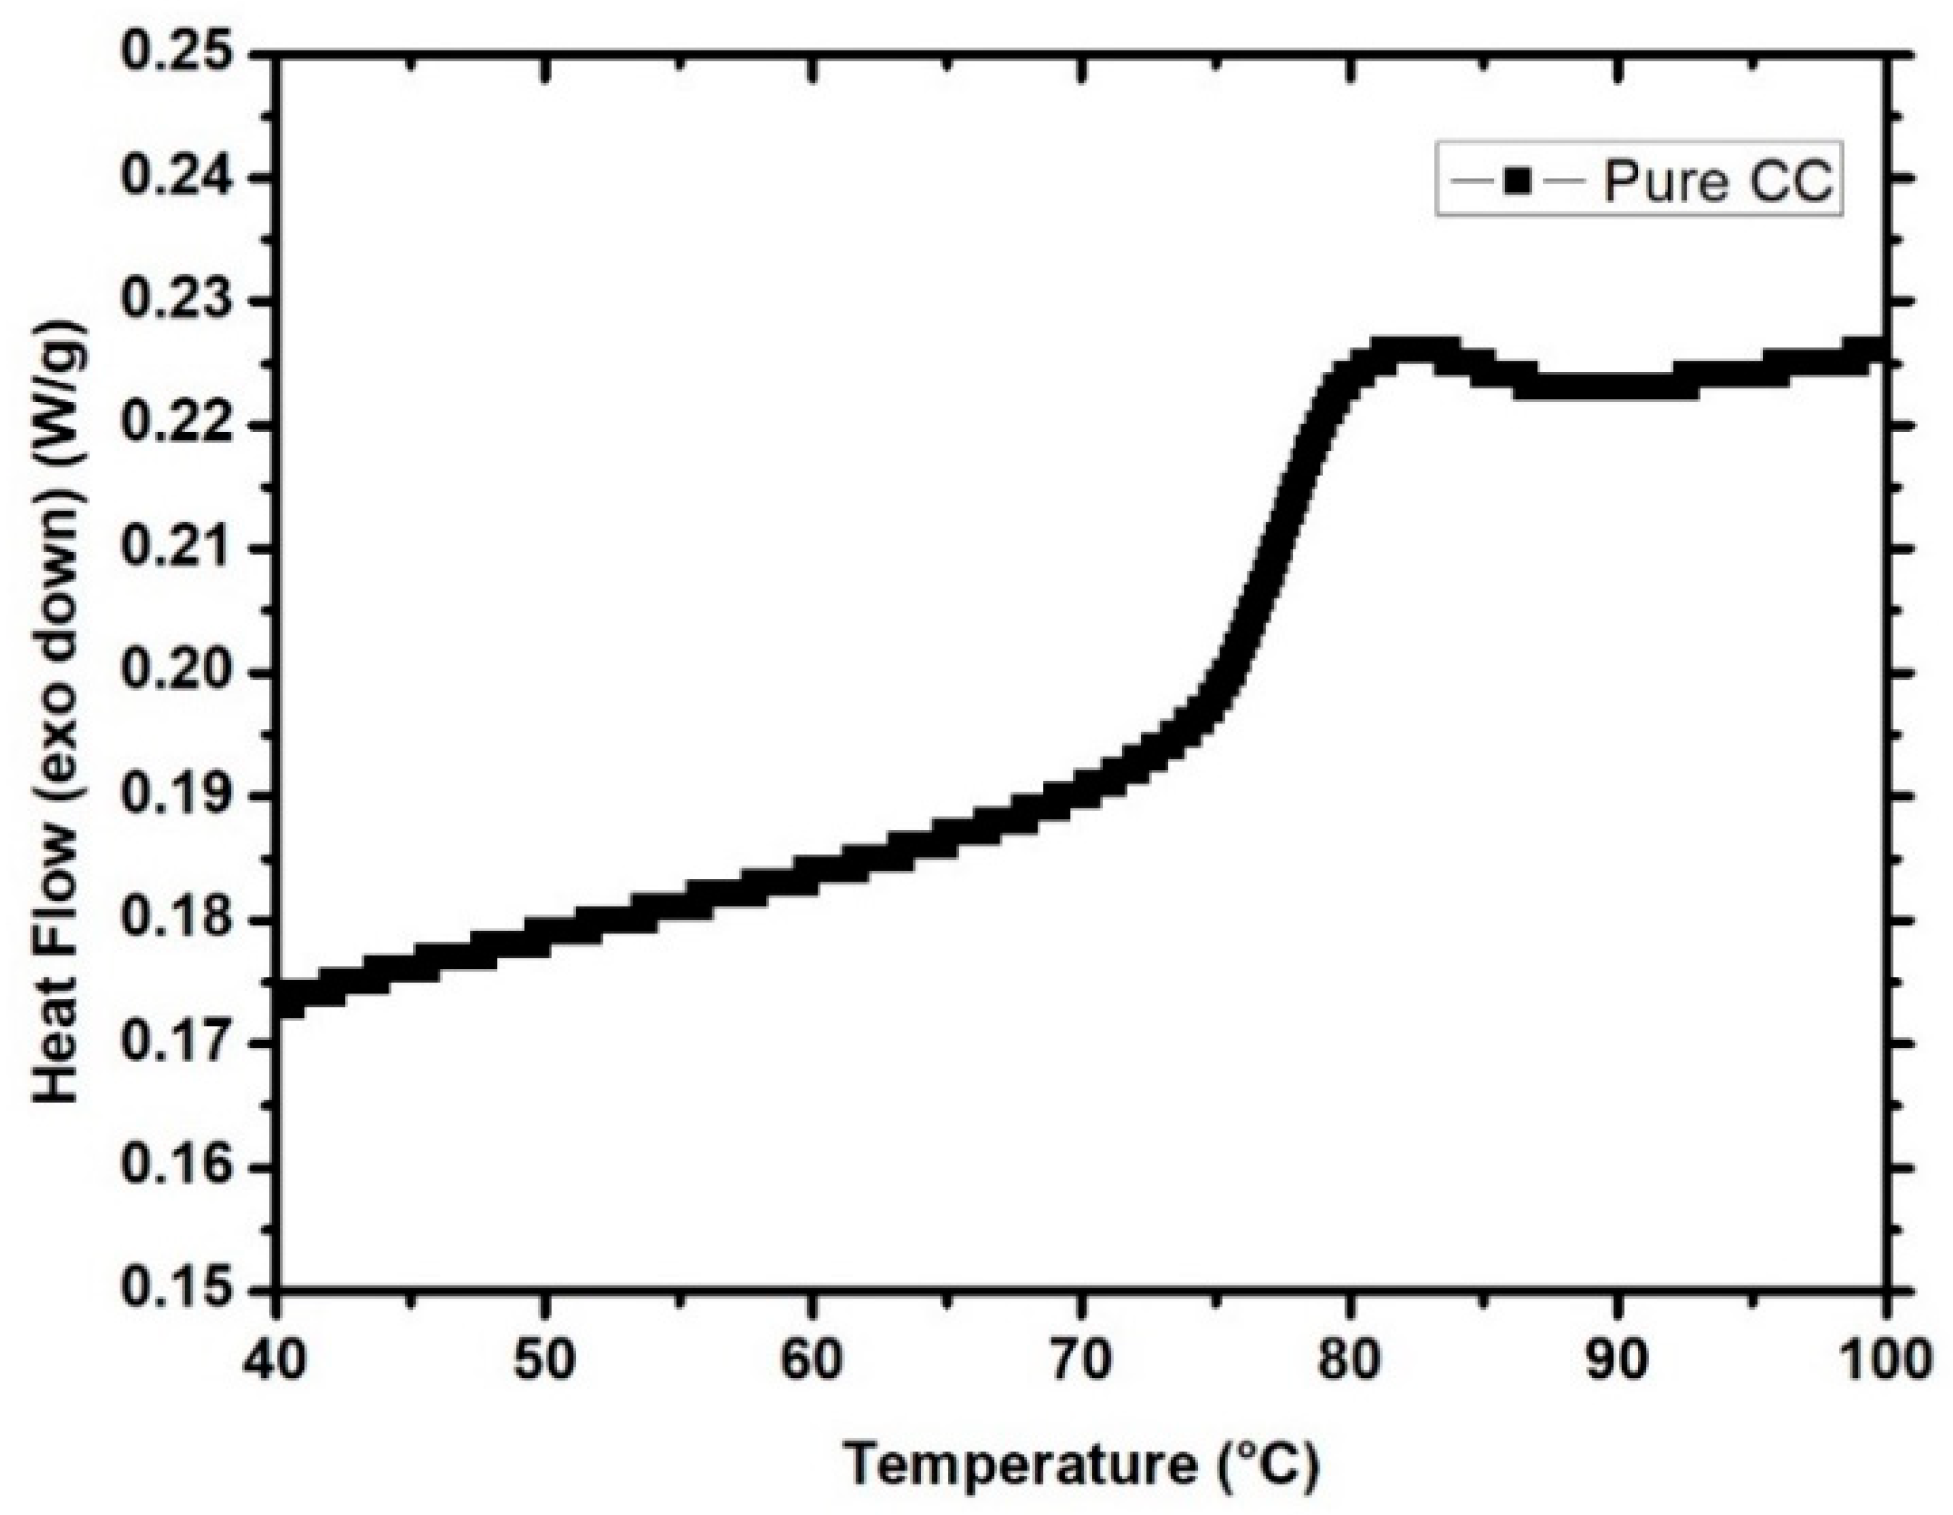
3.1.1. Differential Scanning Calorimetry (DSC)

Before starting the foaming process, it was essential to decide which foaming temperatures to use. These values had to be less than the burning temperature of the polymer in order to avoid damaging the sample, and more than the glass transition temperature (Tg) of the polymer. Thus, DSC was performed on both polymers, and the graphs obtained can be seen in Figure 9 and Figure 10. The analysis of the DSC graphs used TRIOS software. The resultant Tg of pure CC was around 78.1 °C, whereas the Tg for JSD was around 75 °C.
The DSC runs were operated at a maximum temperature value of 250 °C for all runs, and none of these showed a melting temperature curve. Therefore, the foaming temperature ranged from 200 to 290 °C. The ratios measured at 260 °C and 290 °C were the highest ratios for any temperature. The high ratios obtained indicate that the tablets had foamed properly, and that large pores were generated in the polymer matrix. This can be attributed to the motion of the polymer chains within the matrix, as they have more freedom at higher temperatures, which allows the chains to move away from one another and make larger pores.

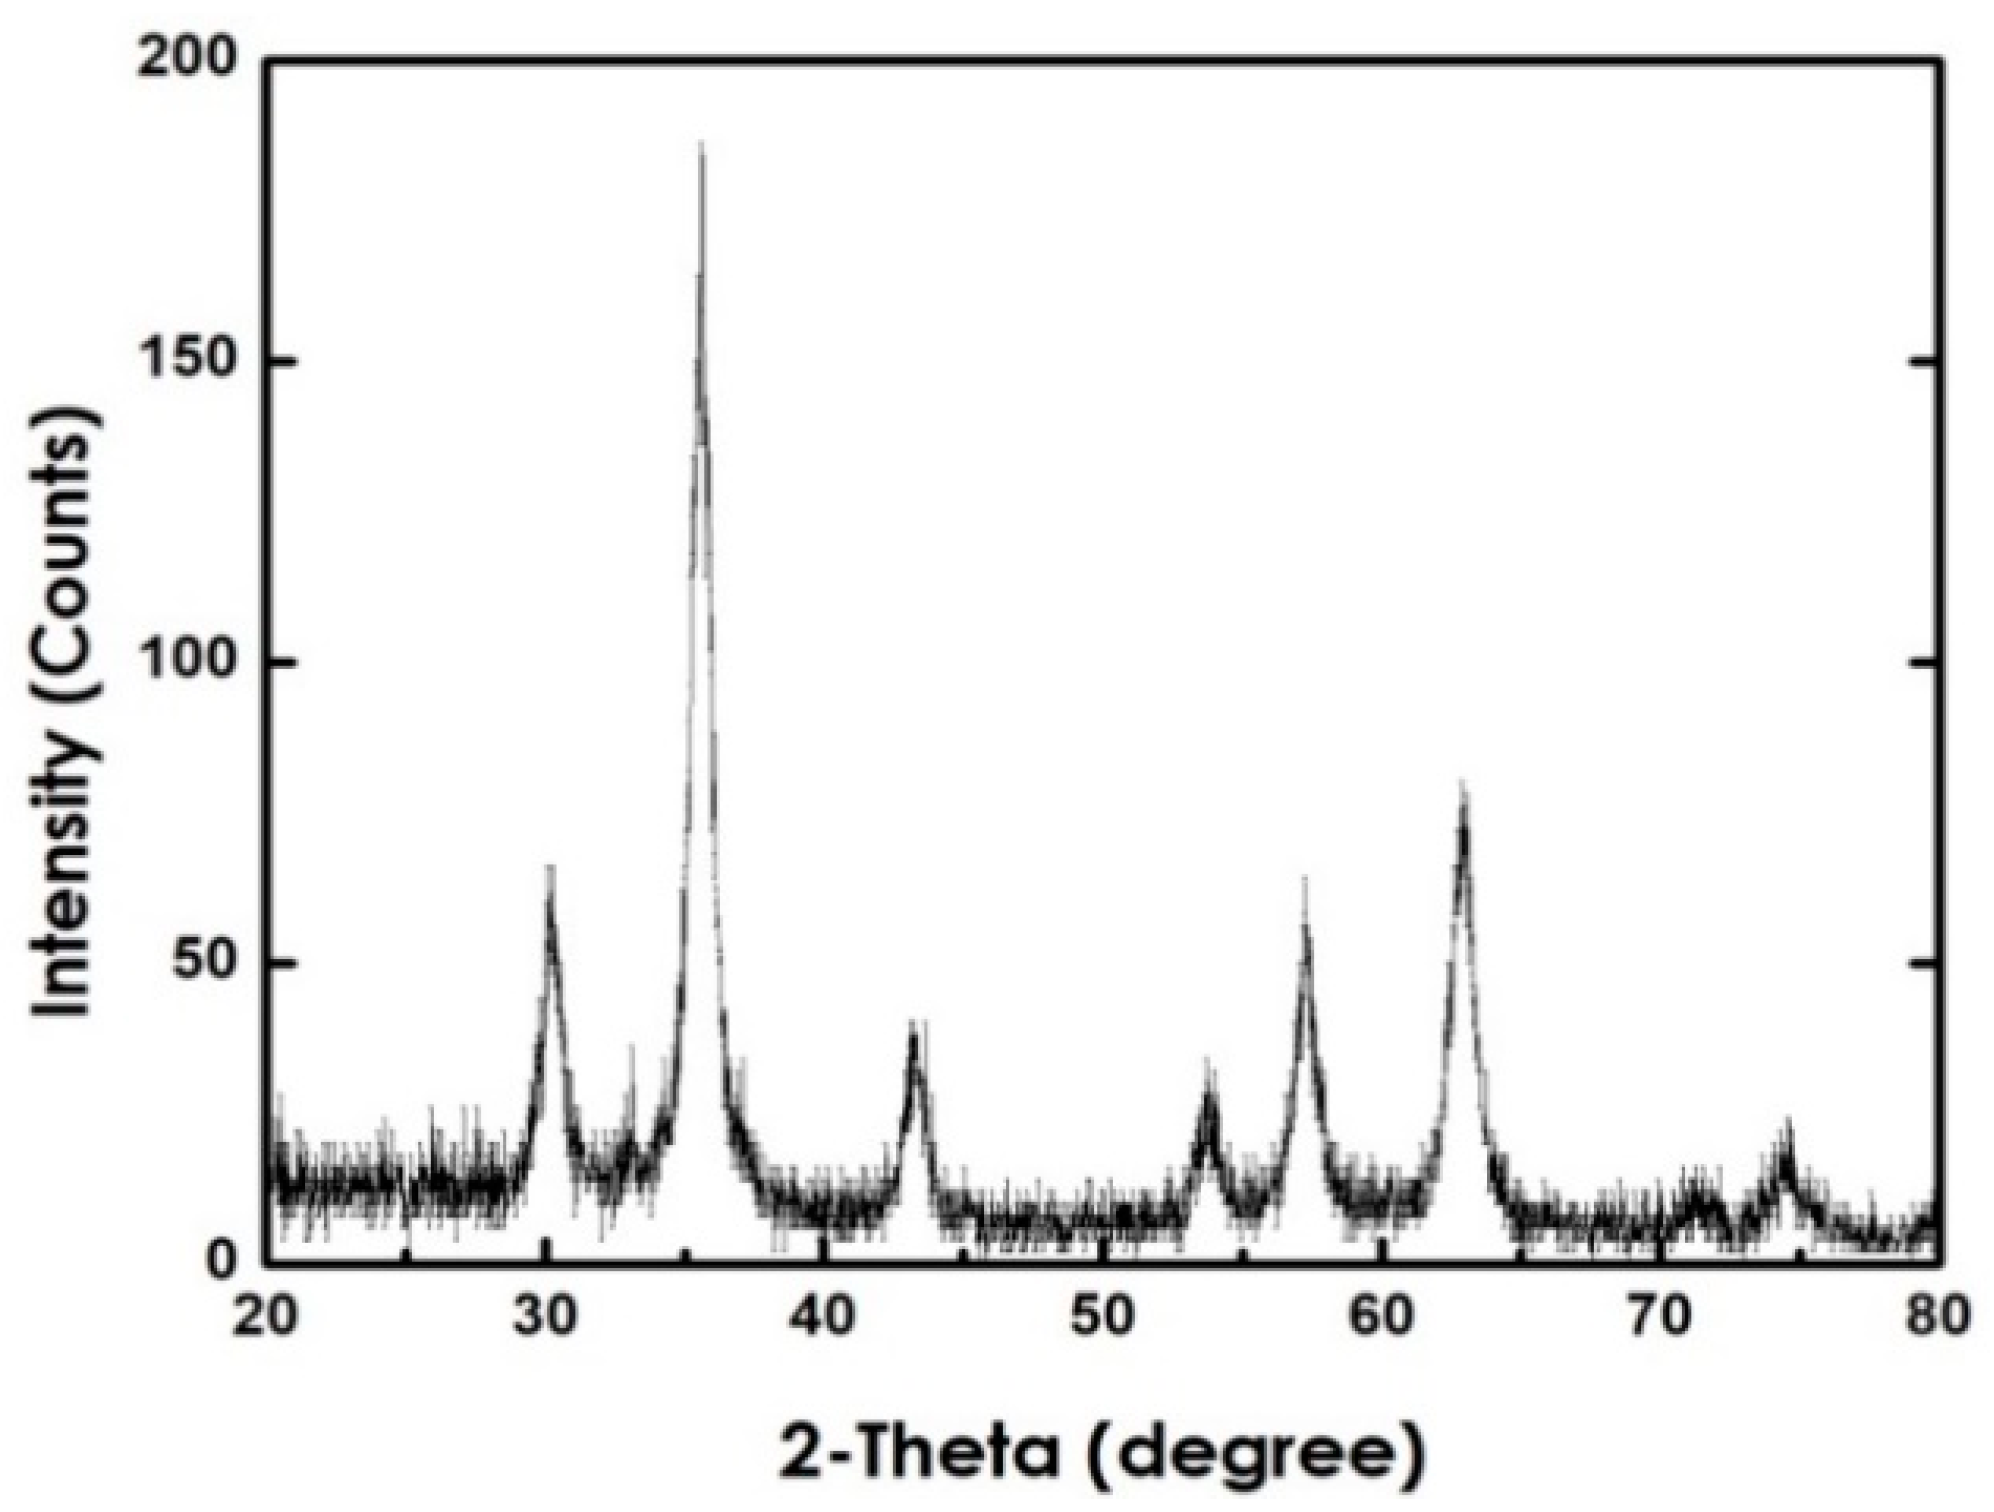
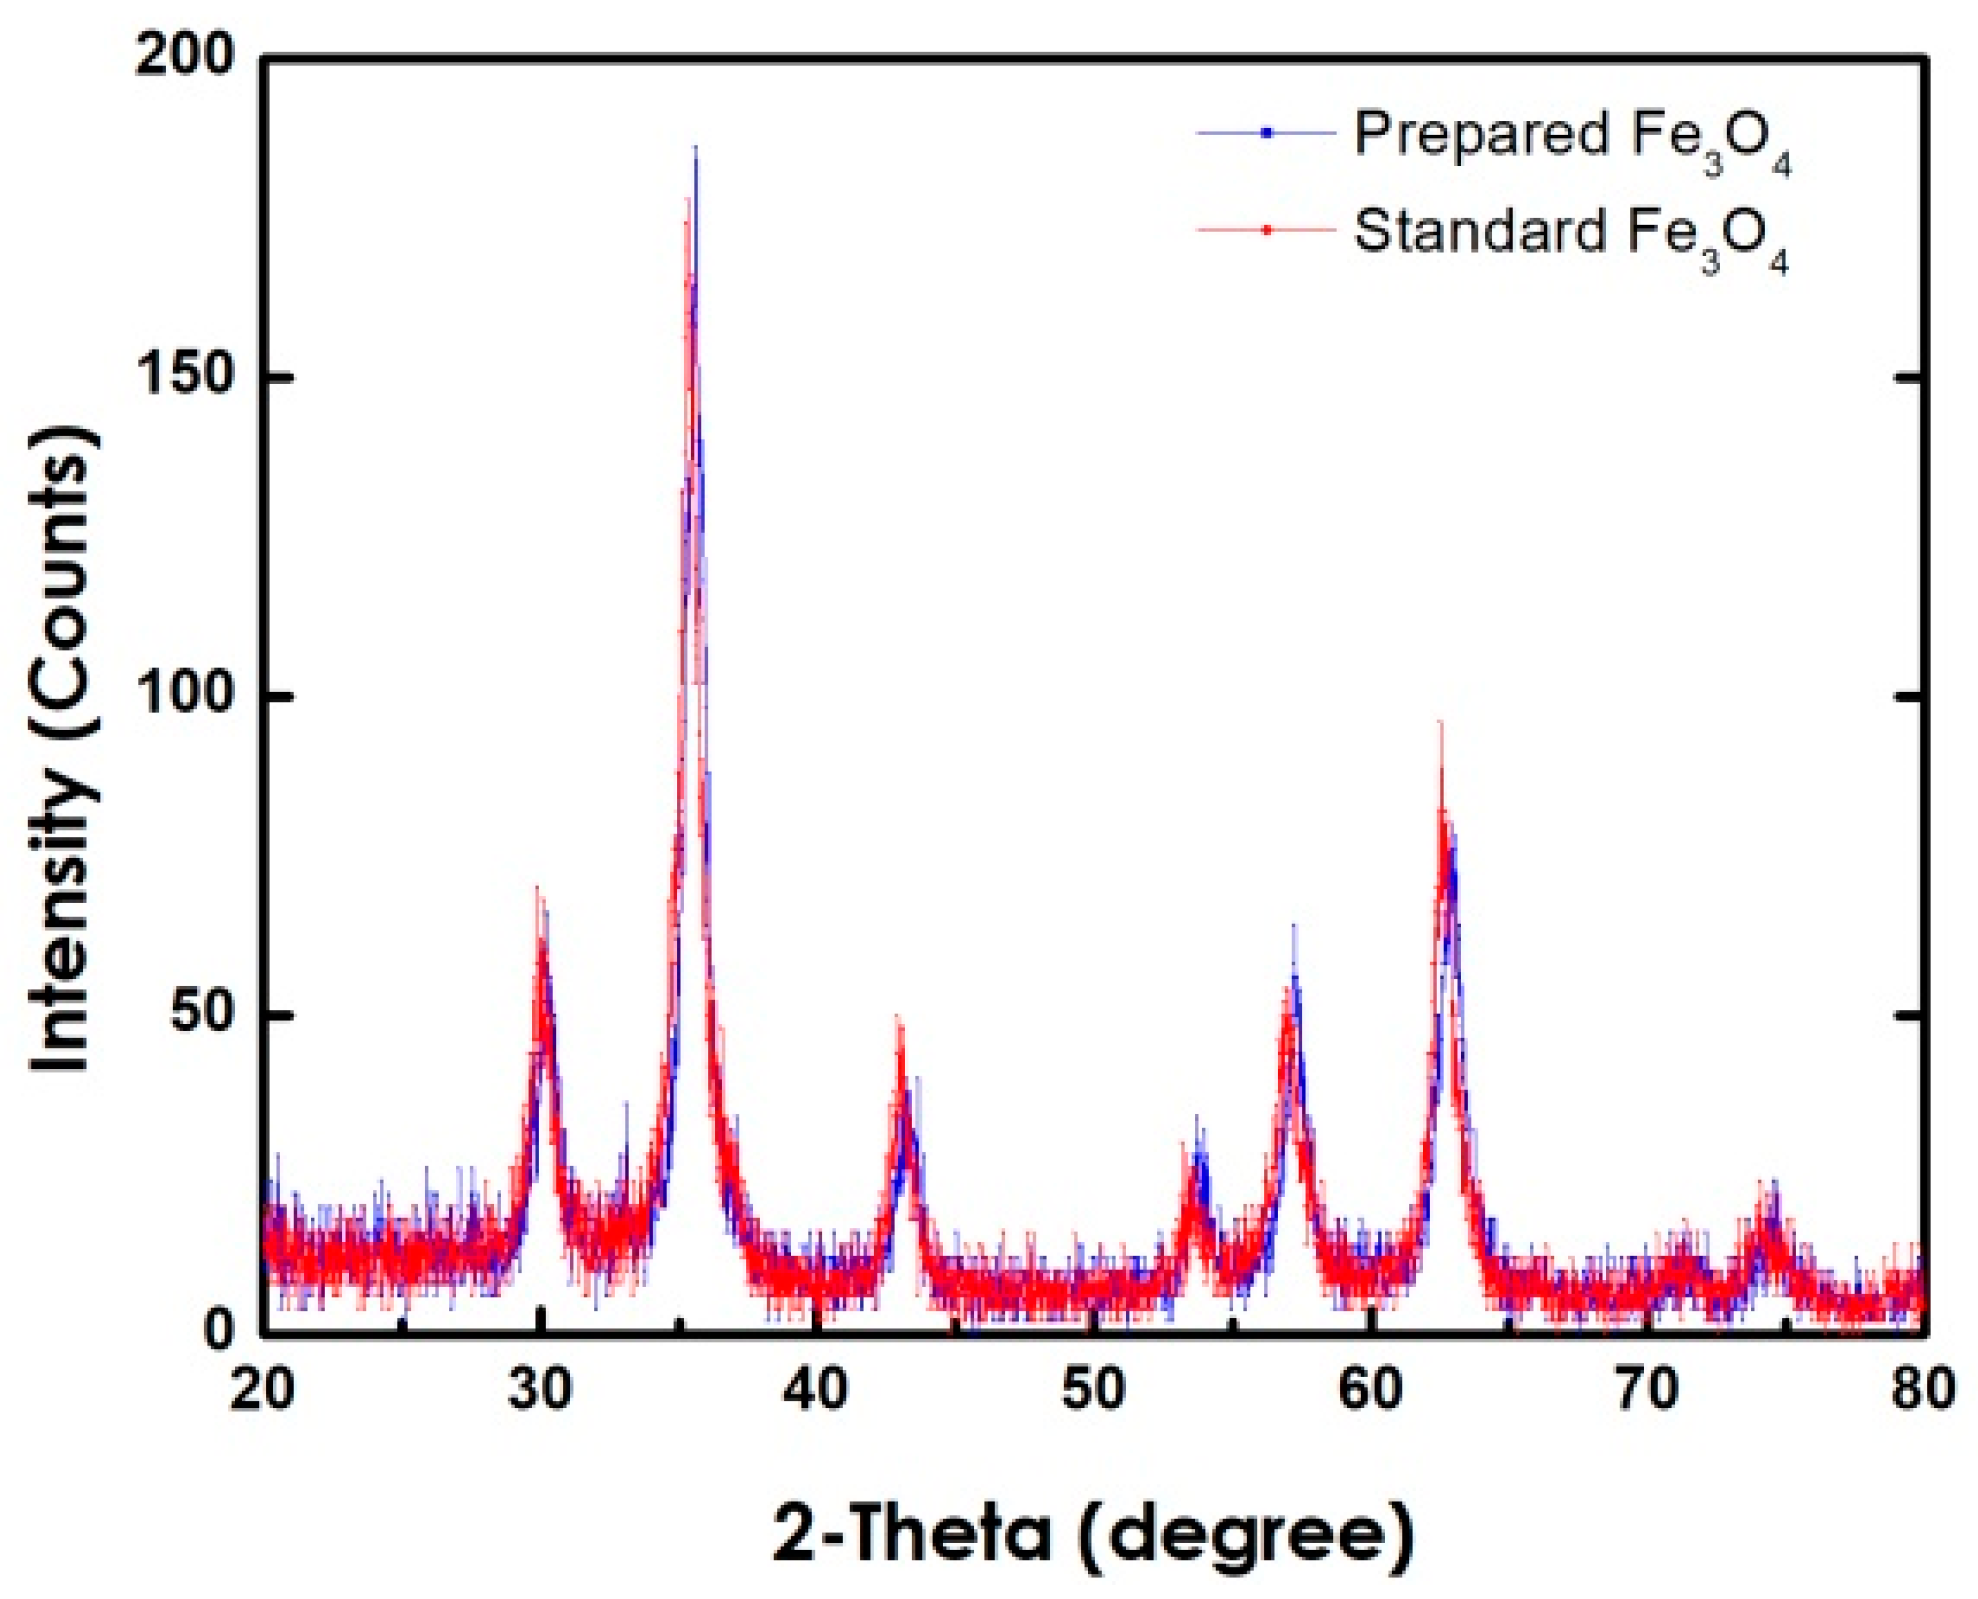
3.1.2. X-ray Diffractometer (XRD)

In order to explore the structural properties, XRD runs were performed using copper (Cu) Kα radiation with a wavelength of λ = 1.540 Å. This was conducted at a scanning rate of 2° per minute within a range from 20° to 80°. Figure 11 shows the XRD pattern for the prepared Fe3O4. This pattern matches perfectly the standard patterns shown in Figure 12. The crystal size of the nanoparticles was obtained by using OriginPro8 software and the Sherrer Equation (see below):
D = K   λ β   c o s   θ
where D is the crystal size, K is the Sherrer constant and is equal to 0.9, λ is the source wavelength and is equal to 0.1540 nm, β is the full width at half maximum (FWHM), and θ is the peak position on the x-axis. The average crystal size was 9.71 nm for the prepared NPs.

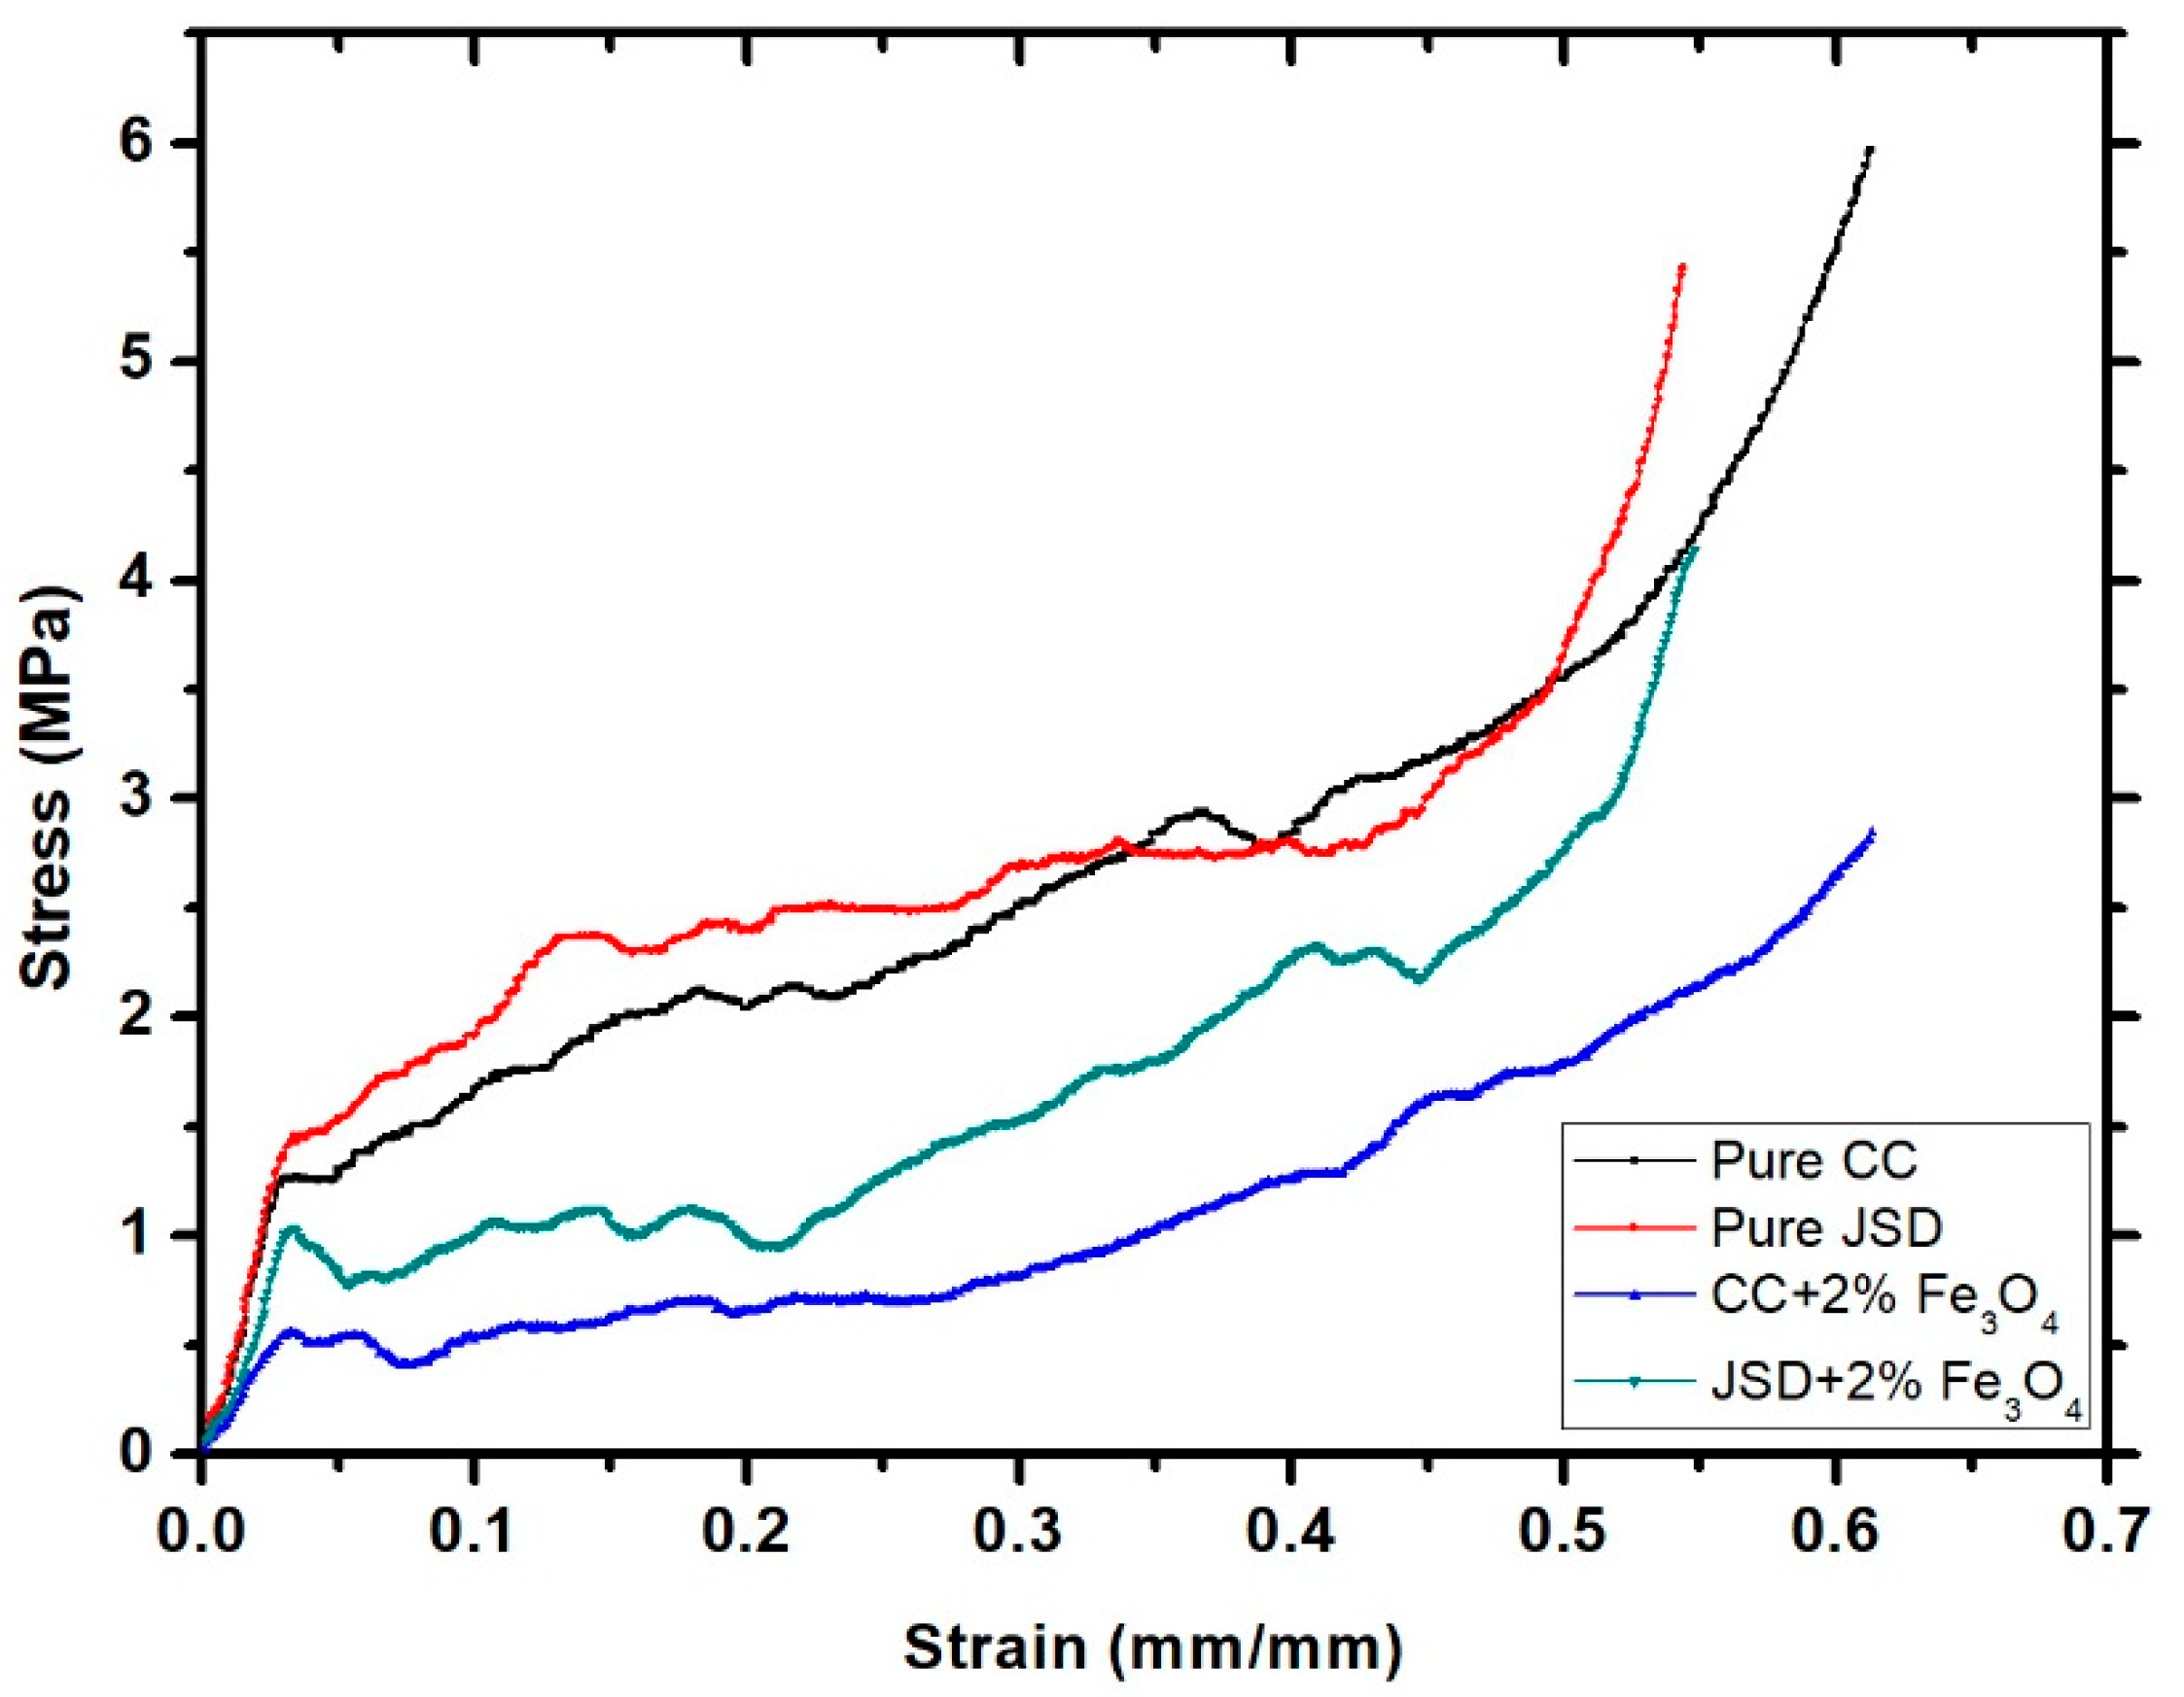
3.1.3. Mechanical Testing

Mechanical compression tests were operated on pure polyester, pure JSD, polyester composite, and JSD composite. The results are shown in Figure 13 below; the addition of Fe3O4 into both polymers’ matrices caused a reduction in the yield strength of both composites, a strong reason for which might be the thermoset property of the polymers used.

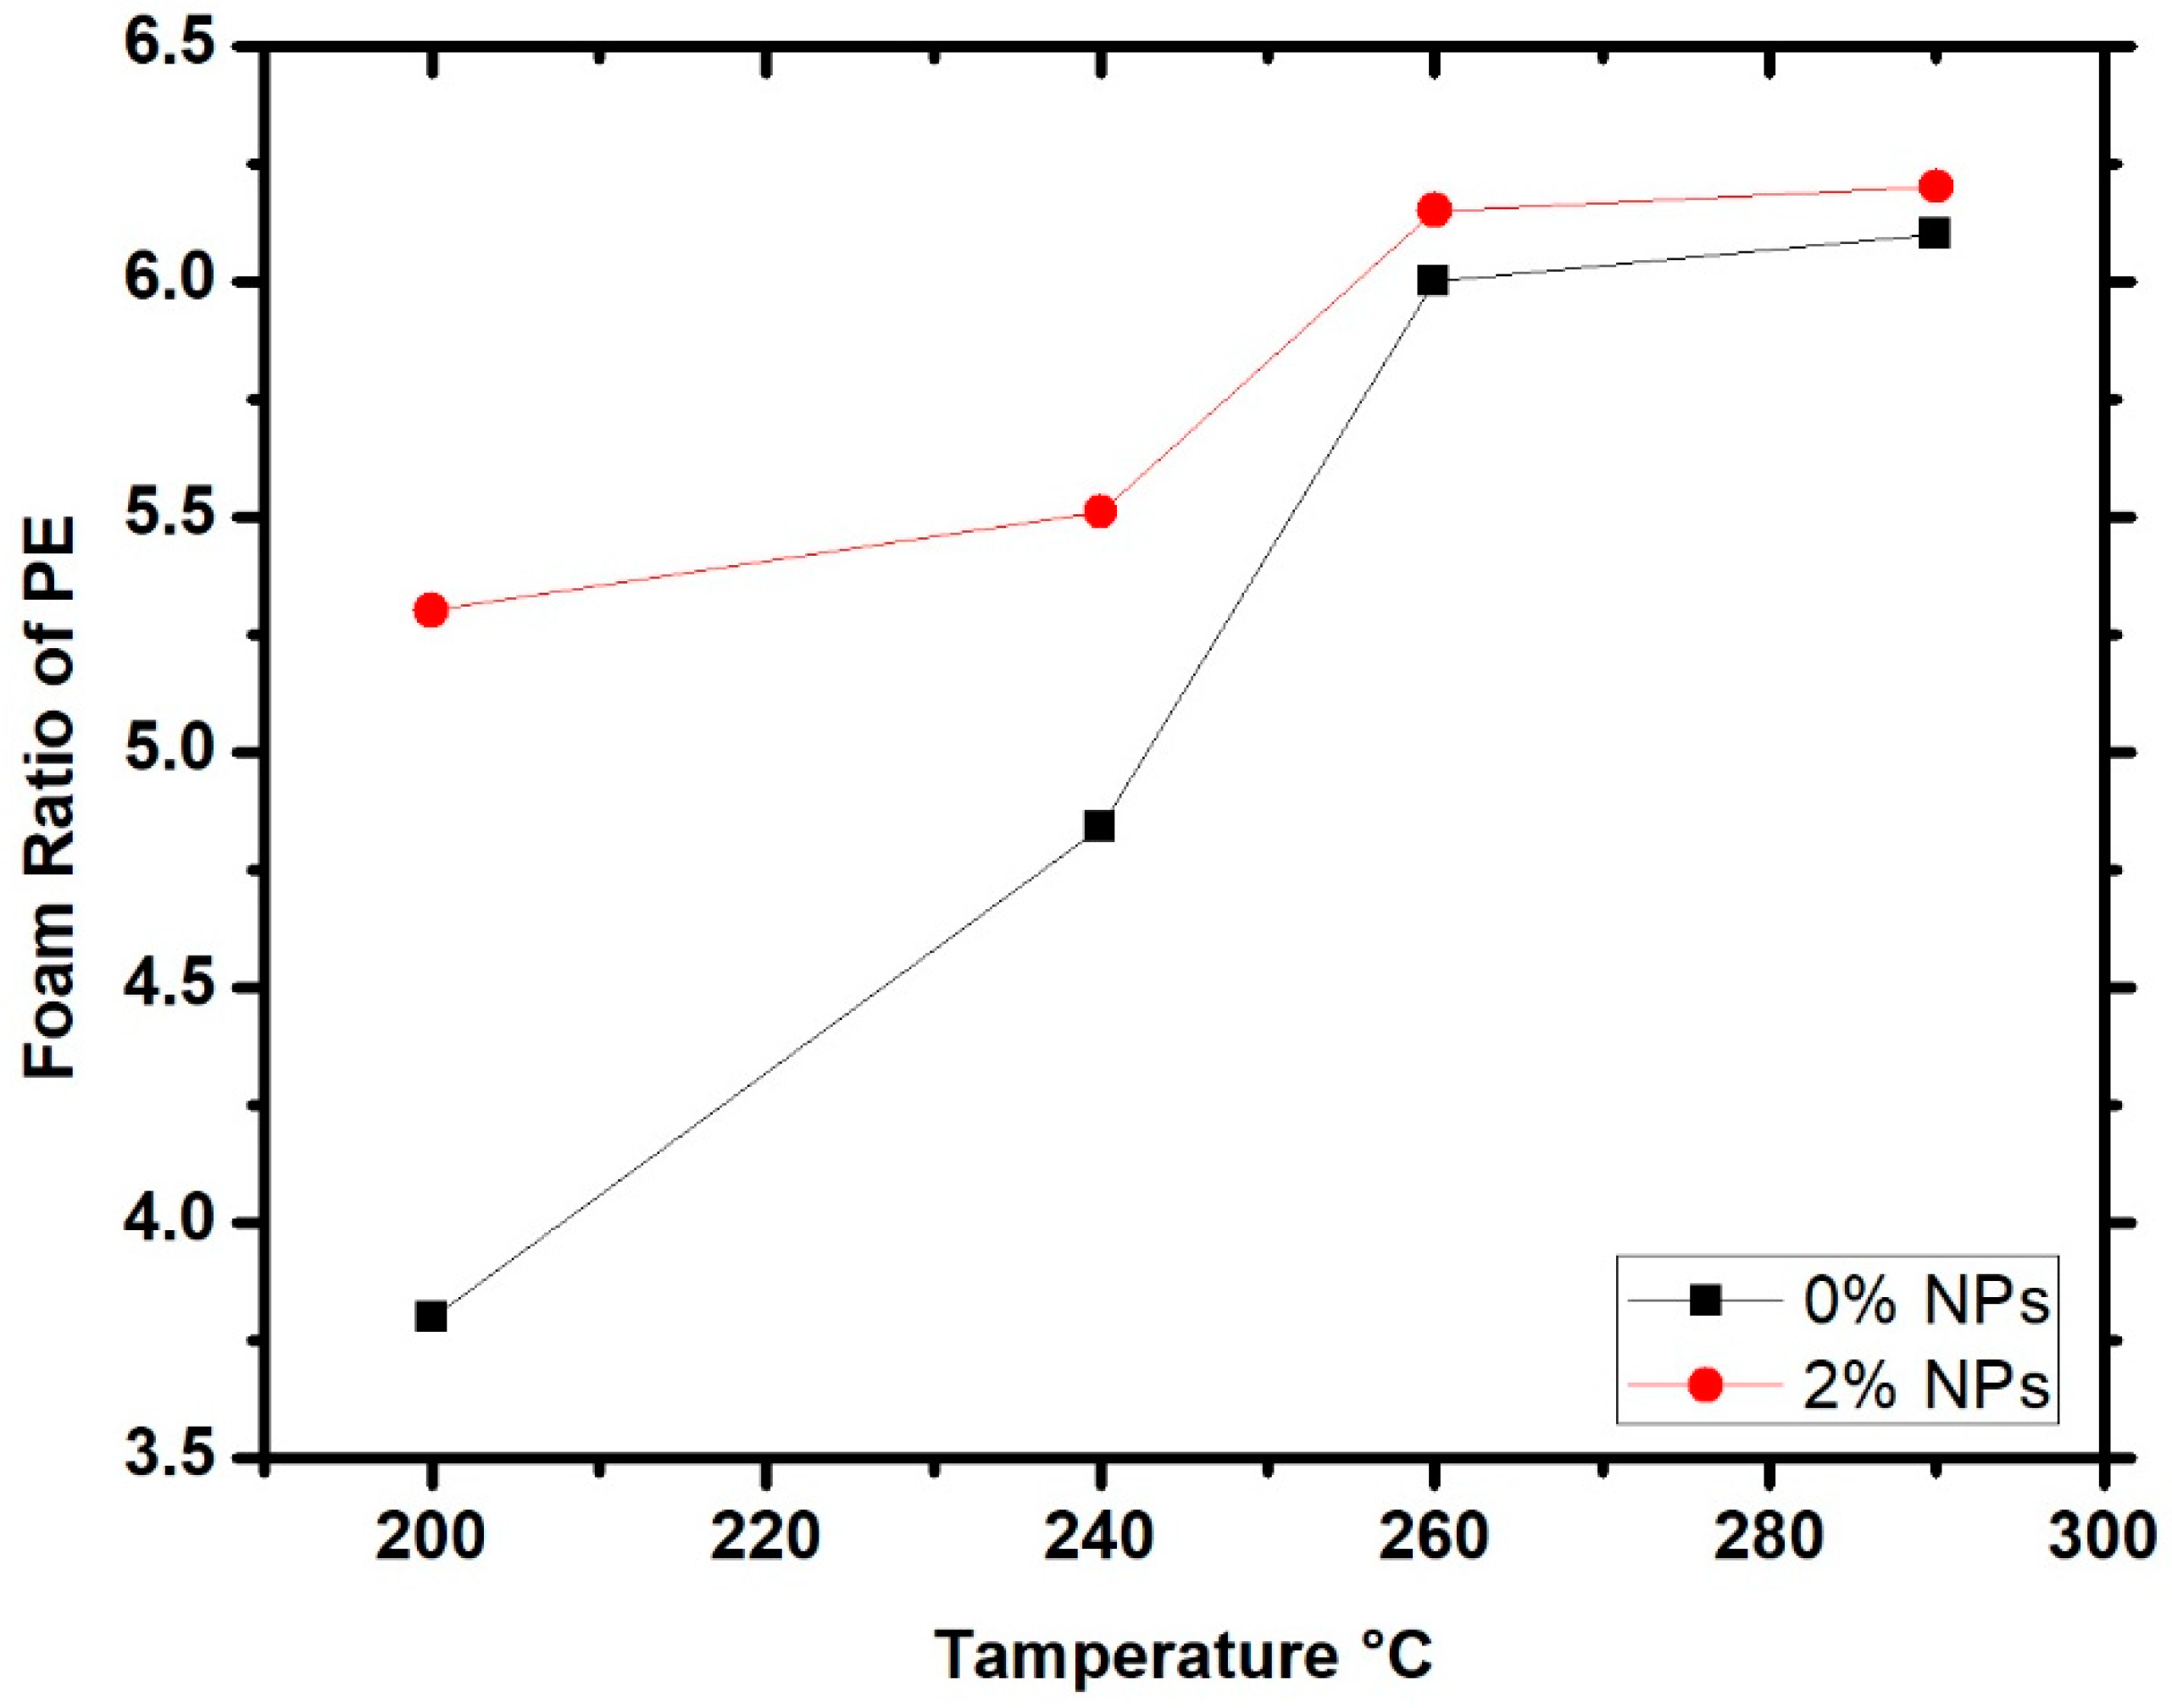
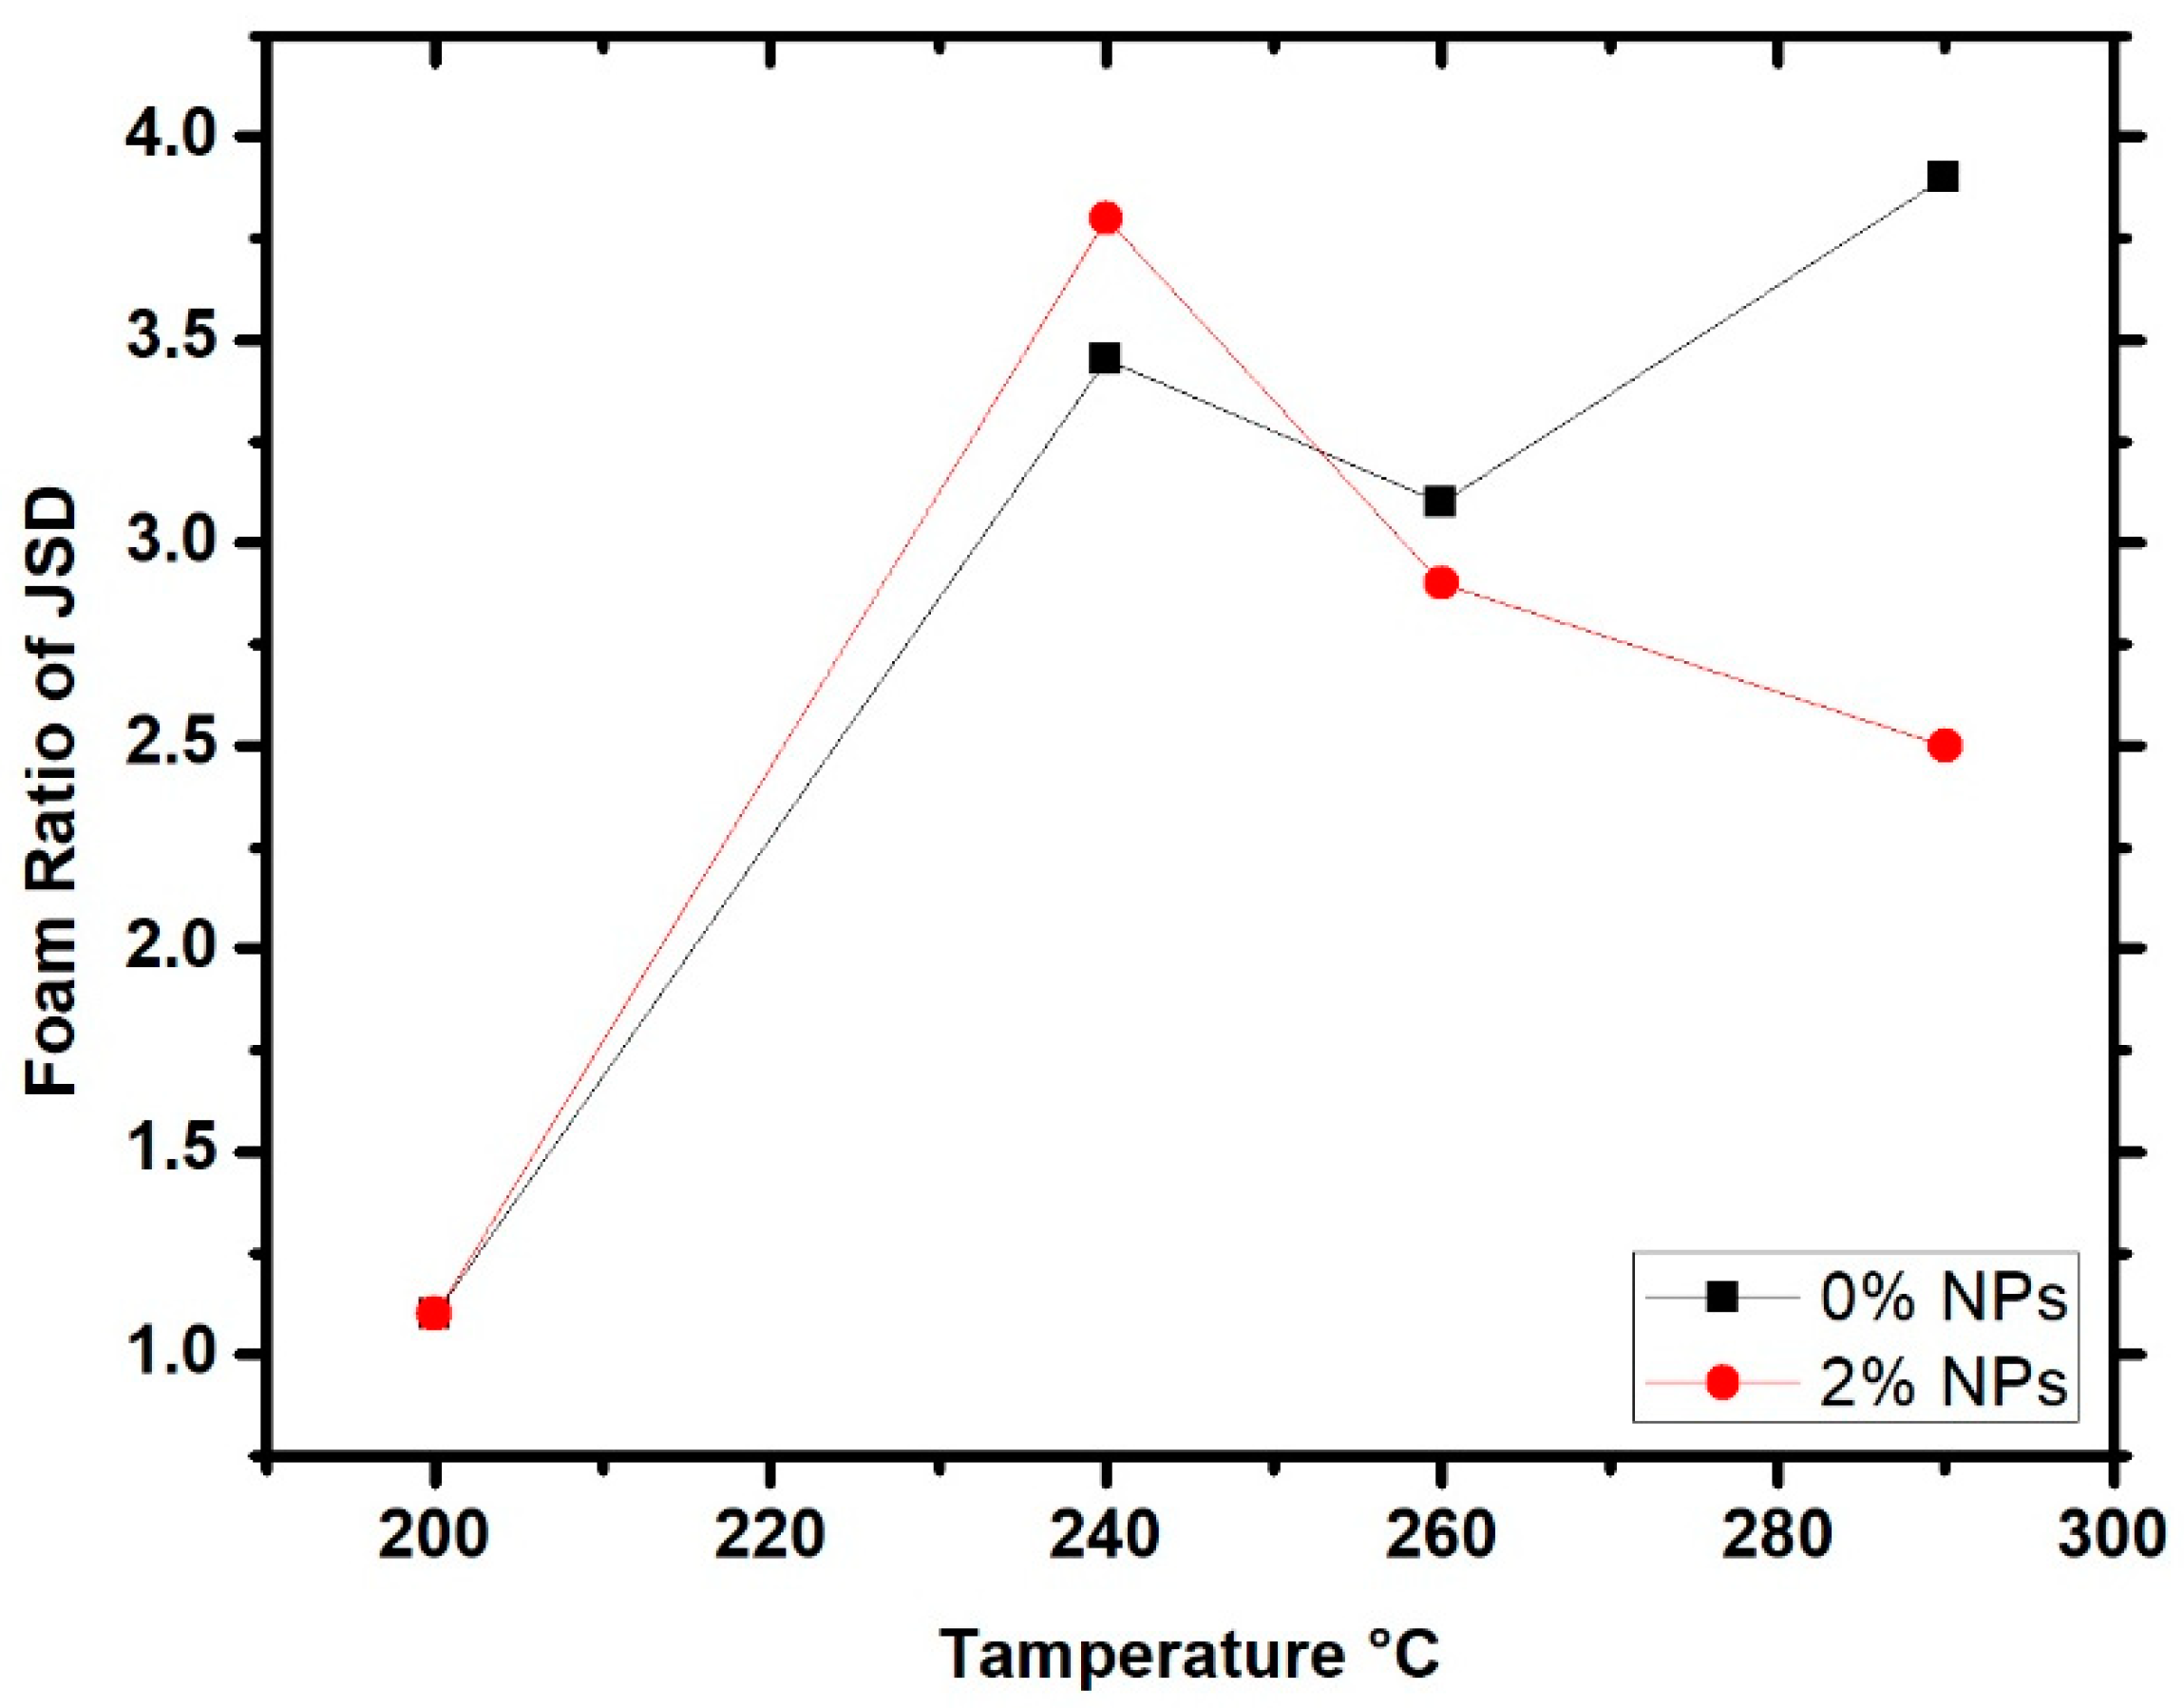
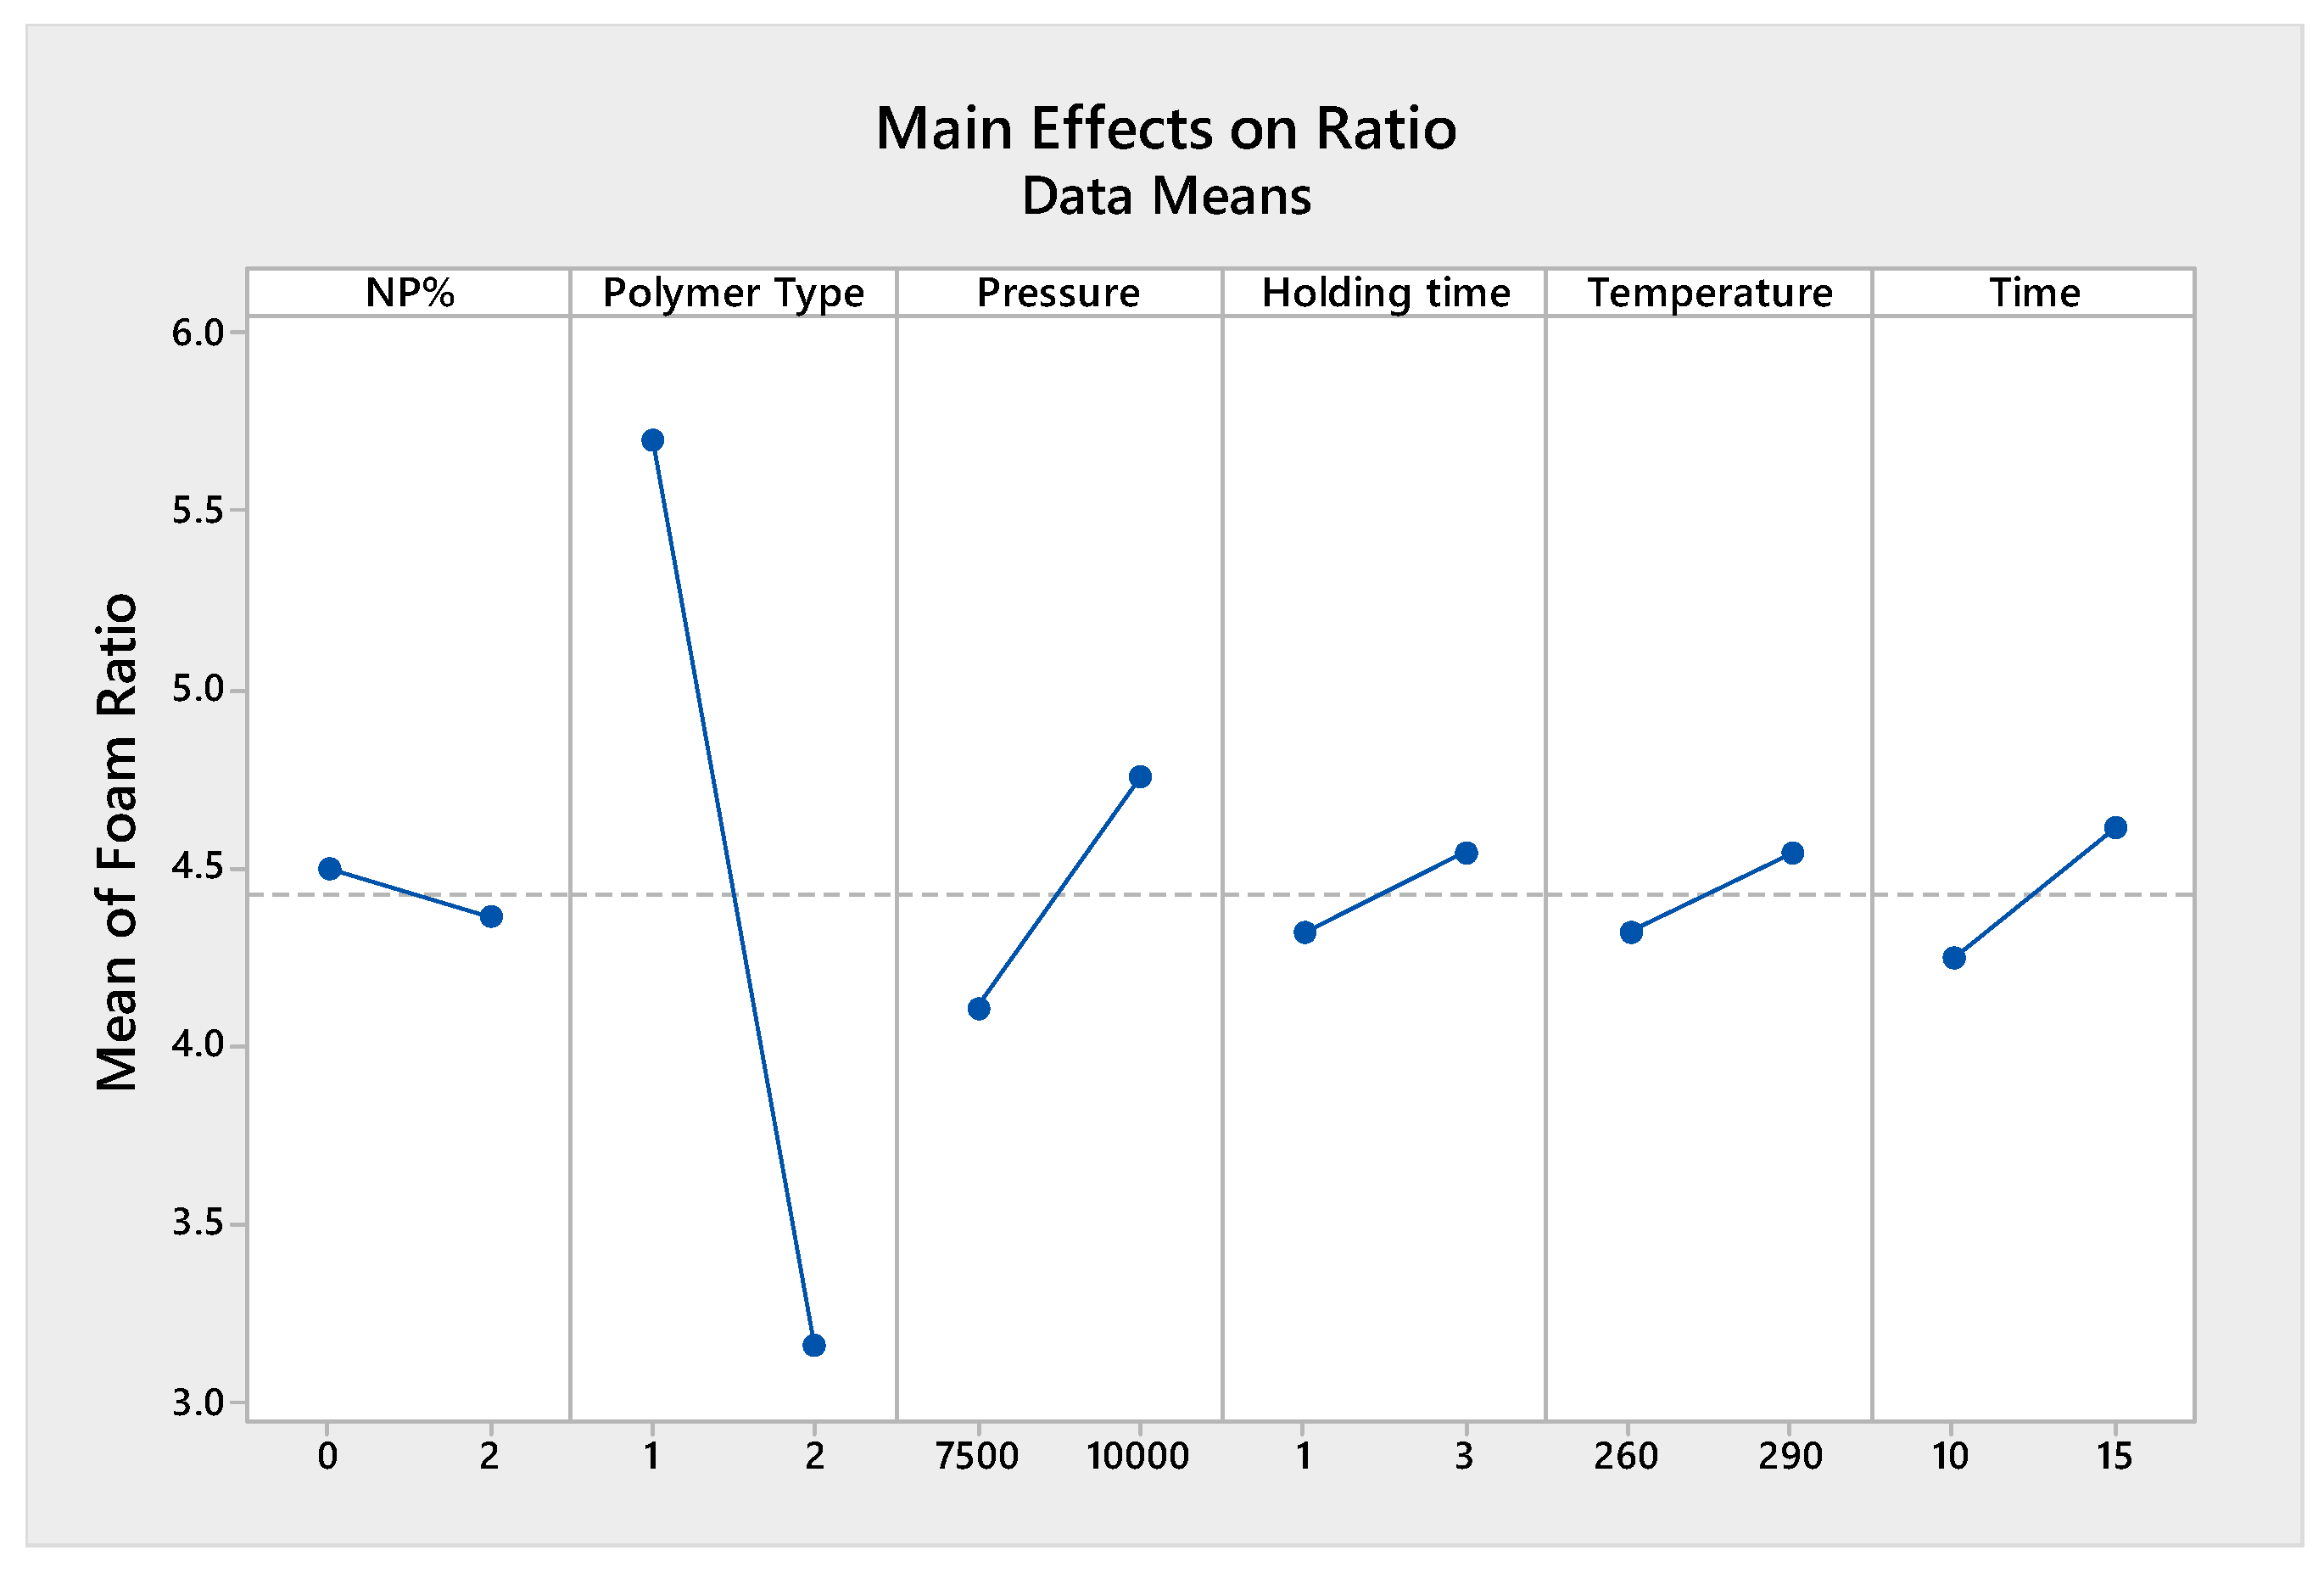
3.2. Foaming Ratio and Density

The foaming ratio is defined as the ratio between the foam height and the initial tablet height. Both heights were measured using a digital caliper to ensure accuracy. The density was calculated using the formula below:
ρ = m V
where ρ is the density of the foam, m is the mass of the foamed sample, and V is the measured volume of the foamed sample. Additionally, the results of pycnometric test are shown in Table 2 above.
Prior to designing a Taguchi plan and selecting the foaming temperature levels, three samples were prepared from every set of experiments to determine the best parameters required in order to obtain the highest foaming ratio and lowest foam density. The average foaming ratio and density were calculated using Excel software for each experiment. The results were later analyzed using Minitab software. The samples’ foaming ratios and densities can be found in Table 3 below.
An analysis of the data showed that regardless of the parameters, a high foaming ratio resulted in a low density. This inverse relationship between foaming ratio and density is logical, because a higher foaming ratio in a sample means it has better foamability, resulting in greater pore formation and ultimately an increased volume of the foamed sample, thus lowering its density. The more nanoparticles introduced into the polymer matrix, the higher the foaming ratio. This results in a lower foam density. Therefore, the addition of NP% had a positive impact on the foamability of the samples. The CC polymer had better foaming potential, as it had a much higher foam ratio and a much lower foam density when compared to the JSD polymer.
Moreover, as more packing pressure was applied while making the tablets, a higher foaming ratio was obtained with a lower foam density. This trend is also noticeable regarding holding time, foaming temperature, and foaming time (see Figure 14 and Figure 15). All of the parameters exhibited higher foaming ratios and lower foaming densities at their higher levels.
The process parameters were expected to have the same effect on the foaming ratio and density, as increasing foaming ratios lead to a decrease in density. This is valid unless NPs are added. If the polymer contains NPs, the foaming ratio is improved, but the density does not necessarily decrease just because the NP density increases the composite density.
The polymer type and packing pressure were the most influential factors for both the density and foam ratio in the samples. This indicates that these properties depend on the material being used, as well as how much that material has been compressed. More pressure causes the powder to be more compacted and connected, thus resulting in better heat transfer within the structure itself.
The NP% showed a significant impact (10%) on the foam density, as well as on the observed foaming ratio, when added to CC. It was expected that any increment in NP% would improve the heat transfer within the CC polymer matrix and thus give a higher foam ratio and a lower density. However, the same significance level was not obtained when NPs were added to JSD. The CC polymer showed very high ratios of 5.95 when NPs were added as compared to 5.44 at 0% of NPs (see Table 2).
On the contrary, the JSD showed lower ratios of 2.75 as compared to 3.54 at 0% of NPs. This result is not consistent with the expected outcome, as the addition of NPs is supposed to improve formality. A careful investigation of this phenomenon suggested that the foaming temperature working range was dependent on polymer type. Hence, a new experiment was conducted to verify this. A foaming temperature of 240 °C was used and the foaming ratio was 3.8, which indicated an improvement of 7% as compared to the 0% of NPs. It can, therefore, be concluded that the effect of foaming temperature is dependent on polymer type. Due to this dependency, the parameters suggested by the Taguchi analysis were not optimal. Therefore, a further tuning of the Taguchi parameters was carried out and the following sections discuss the results obtained from the optimal factors suggested by the Taguchi analysis and the modified factors based on our experimental observations.

3.3. Confirmation Experiment

3.3.1. Taguchi Optimum Process Parameters

According to the Taguchi analysis, the optimum parameters that give the highest foaming ratio were pure CC tablets prepared with 0% of NPs and compressed under a pressure of 10,000 lbs. for 3 min and foamed at 290 °C for 15 min in the oven. The tablets were foamed and prepared using these factors and showed an average foam ratio of 5.38 and an average density of 0.261 g/mm3. These are not the best results when compared to Taguchi design experiments. The results are shown in Table 4 below.
Three samples were prepared based on the suggested Taguchi levels. The average foam ratio was ranked fourth in this case. Since this is not optimal, further tuning of the suggested parameters was required. This necessitated a Taguchi design, where the independency assumption was violated. A summary of the suggested Taguchi design is shown in Table 5 below.

3.3.2. Modified Optimal Parameters as Suggested by the Taguchi Design

As above, there is a dependency between the polymer type and foaming temperature. Thus, one experiment with three replicated samples was conducted. This experiment had all of the suggested levels from the Taguchi design, except where the NP% was selected as 2%, as this was expected to deliver better results. The foam ratio obtained from this experiment was the highest of all of the experiments conducted at 7.02 and a measured density of 0.211 g/mm3, which was the second lowest of all of the experiments.

4. Conclusions

A solid-state foaming process with no foaming agent was tested on two different polymers, namely, CC and JSD. Tablets were prepared at different levels of packing pressure, holding time, and nanoparticle concentration. The prepared tablets were foamed at different levels of foaming temperature and foaming time. Different tests were conducted on these samples to measure their foaming ratios and densities. The results showed that CC polymer powder had a greater tendency to show higher foaming ratios and lower densities as compared to JSD. This was due to the existence of TGIC crosslinks within the matrix, which allow better heat conductivity and easier motion. The proposed optimum process parameters to obtain the optimum foaming ratio and density were as follows: CC polymer mixed with 2% Fe3O4 NPs compressed at a pressure of 10,000 lbs. for 3 min and foamed at 290 °C for 15 min.

Author Contributions

Conceptualization, A.Z.; data curation, T.S.; formal analysis, T.S. and A.Z.; funding acquisition, A.Z.; investigation, T.S. and A.Z.; methodology, A.Z. and T.S.; project administration, A.Z.; resources, A.Z.; software, T.S.; visualization, T.S.; writing—original draft, T.S.; writing—review and editing, A.Z. All authors have read and agreed to the published version of the manuscript.

Funding

This research was funded by Space Center, United Arab Emirates University, grant number: 31R205-Research Center-NSS-1-2018. The APC was funded by Space Center, United Arab Emirates University.

Acknowledgments

This research was funded through a Space Center grant from the United Arab Emirates University, fund number: 31R205-Research Center-NSS-1-2018.

Conflicts of Interest

The authors declare no conflict of interest.

References

  1. Carrell, J.; Tate, D.; Wang, S.; Zhang, H.-C. Shape memory polymer snap-fits for active disassembly. J. Clean. Prod. 2011, 19, 2066–2074. [Google Scholar] [CrossRef]
  2. Chiodo, J.; Jones, N. Smart materials use in active disassembly. Assem. Autom. 2012, 32, 8–24. [Google Scholar] [CrossRef]
  3. Ziout, A.; Azab, A.; Atwan, M. A holistic approach for decision on selection of end-of-life products recovery options. J. Clean. Prod. 2014, 65, 497–516. [Google Scholar] [CrossRef]
  4. Banyay, G.; Shaltout, M.; Tiwari, H.; Mehta, B. Polymer and composite foam for hydrogen storage application. J. Mater. Process. Technol. 2007, 191, 102–105. [Google Scholar] [CrossRef]
  5. Zhang, Y.; Jin, T.; Li, S.; Ruan, D.; Wang, Z.; Lu, G. Sample size effect on the mechanical behavior of aluminum foam. Int. J. Mech. Sci. 2019, 151, 622–638. [Google Scholar] [CrossRef]
  6. Nam, Y.S.; Park, T.G. Biodegradable polymeric microcellular foams by modified thermally induced phase separation method. Biomaterials 1999, 20, 1783–1790. [Google Scholar] [CrossRef]
  7. Zheng, X.; Zhou, S.; Xiao, Y.; Yu, X.; Li, X.; Wu, P. Shape memory effect of poly(d,l-lactide)/Fe3O4 nanocomposites by inductive heating of magnetite particles. Colloids Surf. B Biointerfaces 2009, 71, 67–72. [Google Scholar] [CrossRef] [PubMed]
  8. Abdullah, S.I.; Ansari, M.N.M. Mechanical properties of graphene oxide (GO)/epoxy composites. HBRC J. 2015, 11, 151–156. [Google Scholar] [CrossRef]
  9. Fei, G.; Li, G.; Wu, L.; Xia, H. A spatially and temporally controlled shape memory process for electrically conductive polymer–carbon nanotube composites. Soft Matter 2012, 8, 5123–5126. [Google Scholar] [CrossRef]
  10. A Squeo, E.; Quadrini, F. Shape memory epoxy foams by solid-state foaming. Smart Mater. Struct. 2010, 19, 105002. [Google Scholar] [CrossRef]
  11. Kulkarni, S.A.; Sawadh, P.; Palei, P.K.; Kokate, K.K. Effect of synthesis route on the structural, optical and magnetic properties of Fe3O4 nanoparticles. Ceram. Int. 2014, 40, 1945–1949. [Google Scholar] [CrossRef]
  12. Quadrini, F.; Squeo, E.A. Solid-State Foaming of Epoxy Resin. J. Cell. Plast. 2008, 44, 161–173. [Google Scholar] [CrossRef]
Figure 1. Thermo-mechanical cycle steps performed on shape memory materials.
Applsci 11 03433 g001
Figure 2. Process model used to produce polymer foam.
Applsci 11 03433 g002
Figure 3. Stainless steel mold containing the powder that is packed using the hydraulic press machine.
Applsci 11 03433 g003
Figure 4. Prepared tablet inserted in a thick aluminum sheet, and a mold on a stainless steel base ready to be foamed.
Applsci 11 03433 g004
Figure 5. Samples after the foaming process and removal from the oven, ready to be extracted from the molds.
Applsci 11 03433 g005
Figure 6. Samples (a) before machining, (b): being machined and shaped into uniform shape for easier calculations with a CNC turning machine.
Applsci 11 03433 g006
Figure 7. Foam ratios as a function of temperature for pure CC and CC + 2% NPs.
Applsci 11 03433 g007
Figure 8. Foam ratios as a function of temperature for pure JSD and JSD + 2% NPs.
Applsci 11 03433 g008
Figure 9. Differential scanning calorimetry (DSC) run of pure JSD.
Applsci 11 03433 g009
Figure 10. DSC run of pure CC.
Applsci 11 03433 g010
Figure 11. XRD pattern for the prepared nanoparticles.
Applsci 11 03433 g011
Figure 12. Comparison between the prepared and standard Fe3O4.
Applsci 11 03433 g012
Figure 13. Stress–strain curves of the pure polymers and their composites.
Applsci 11 03433 g013
Figure 14. Effect of all of the parameters on the foam density.
Applsci 11 03433 g014
Figure 15. Effect of all of the parameters on the foaming ratio.
Applsci 11 03433 g015
Table 1. Taguchi plan for this research.
ParametersNPs%Polymer Type *Packing Pressure (lbs.)Holding Time (Minutes)Foaming Temperature (°C)Foaming Time (Minutes)
Run #
1017500126015
2017500329010
30210,000126010
40210,000329015
52110,000129015
62110,000326010
7227500129010
8227500326015
* Polymer type 1 is CC, while polymer type 2 is JSD. NP, nanoparticle.
Table 2. Absolute density of the prepared foamed samples.
Weight in AirWeight in WaterAbsolute Density (g/mm3)
CC 3.833.770.064
JSD3.193.130.053
CC + 2% NPs 3.363.290.048
JSD + 2% NPs2.462.330.019
Table 3. Average calculated foaming ratio and average foam density for each set of experiments.
Run #12345678
Average foaming ratio5.435.543.183.966.215.792.562.96
Standard deviation of the foaming ratio0.0490.230.1570.2470.110.100.250.45
Average foam density (g/mm3)0.250.230.310.280.210.200.370.37
Standard deviation of the foaming density0.010.0010.020.0120.0020.0020.0160.05
Table 4. Results of the confirmation experiment using the parameters recommended by the Taguchi analysis.
Sample NumberSample Height
(mm)
Foam Height
(mm)
Mass
(g)
Volume
(cm3)
Foam RatioFoam Density
(g/mm3)
S1949.124.0816.1415.450.252
S29.147.444.2515.225.210.279
S3949.334.0716.175.480.251
Std. dev.0.050.840.0820.440.120.013
Table 5. Taguchi design of the process parameter optimum ratio and density.
Process ParameterValueUnit
NP%0%N/A
Polymer TypeCCN/A
Packing Pressure10,000lbs.
Holding Time3Minutes
Foaming Temperature290°C
Foaming Time15Minutes
Publisher’s Note: MDPI stays neutral with regard to jurisdictional claims in published maps and institutional affiliations.

