
Battery Characterization via Eddy-Current Imaging with Nitrogen-Vacancy Centers in Diamond

 , ,
, ,  , ,
, ,  , and
, and 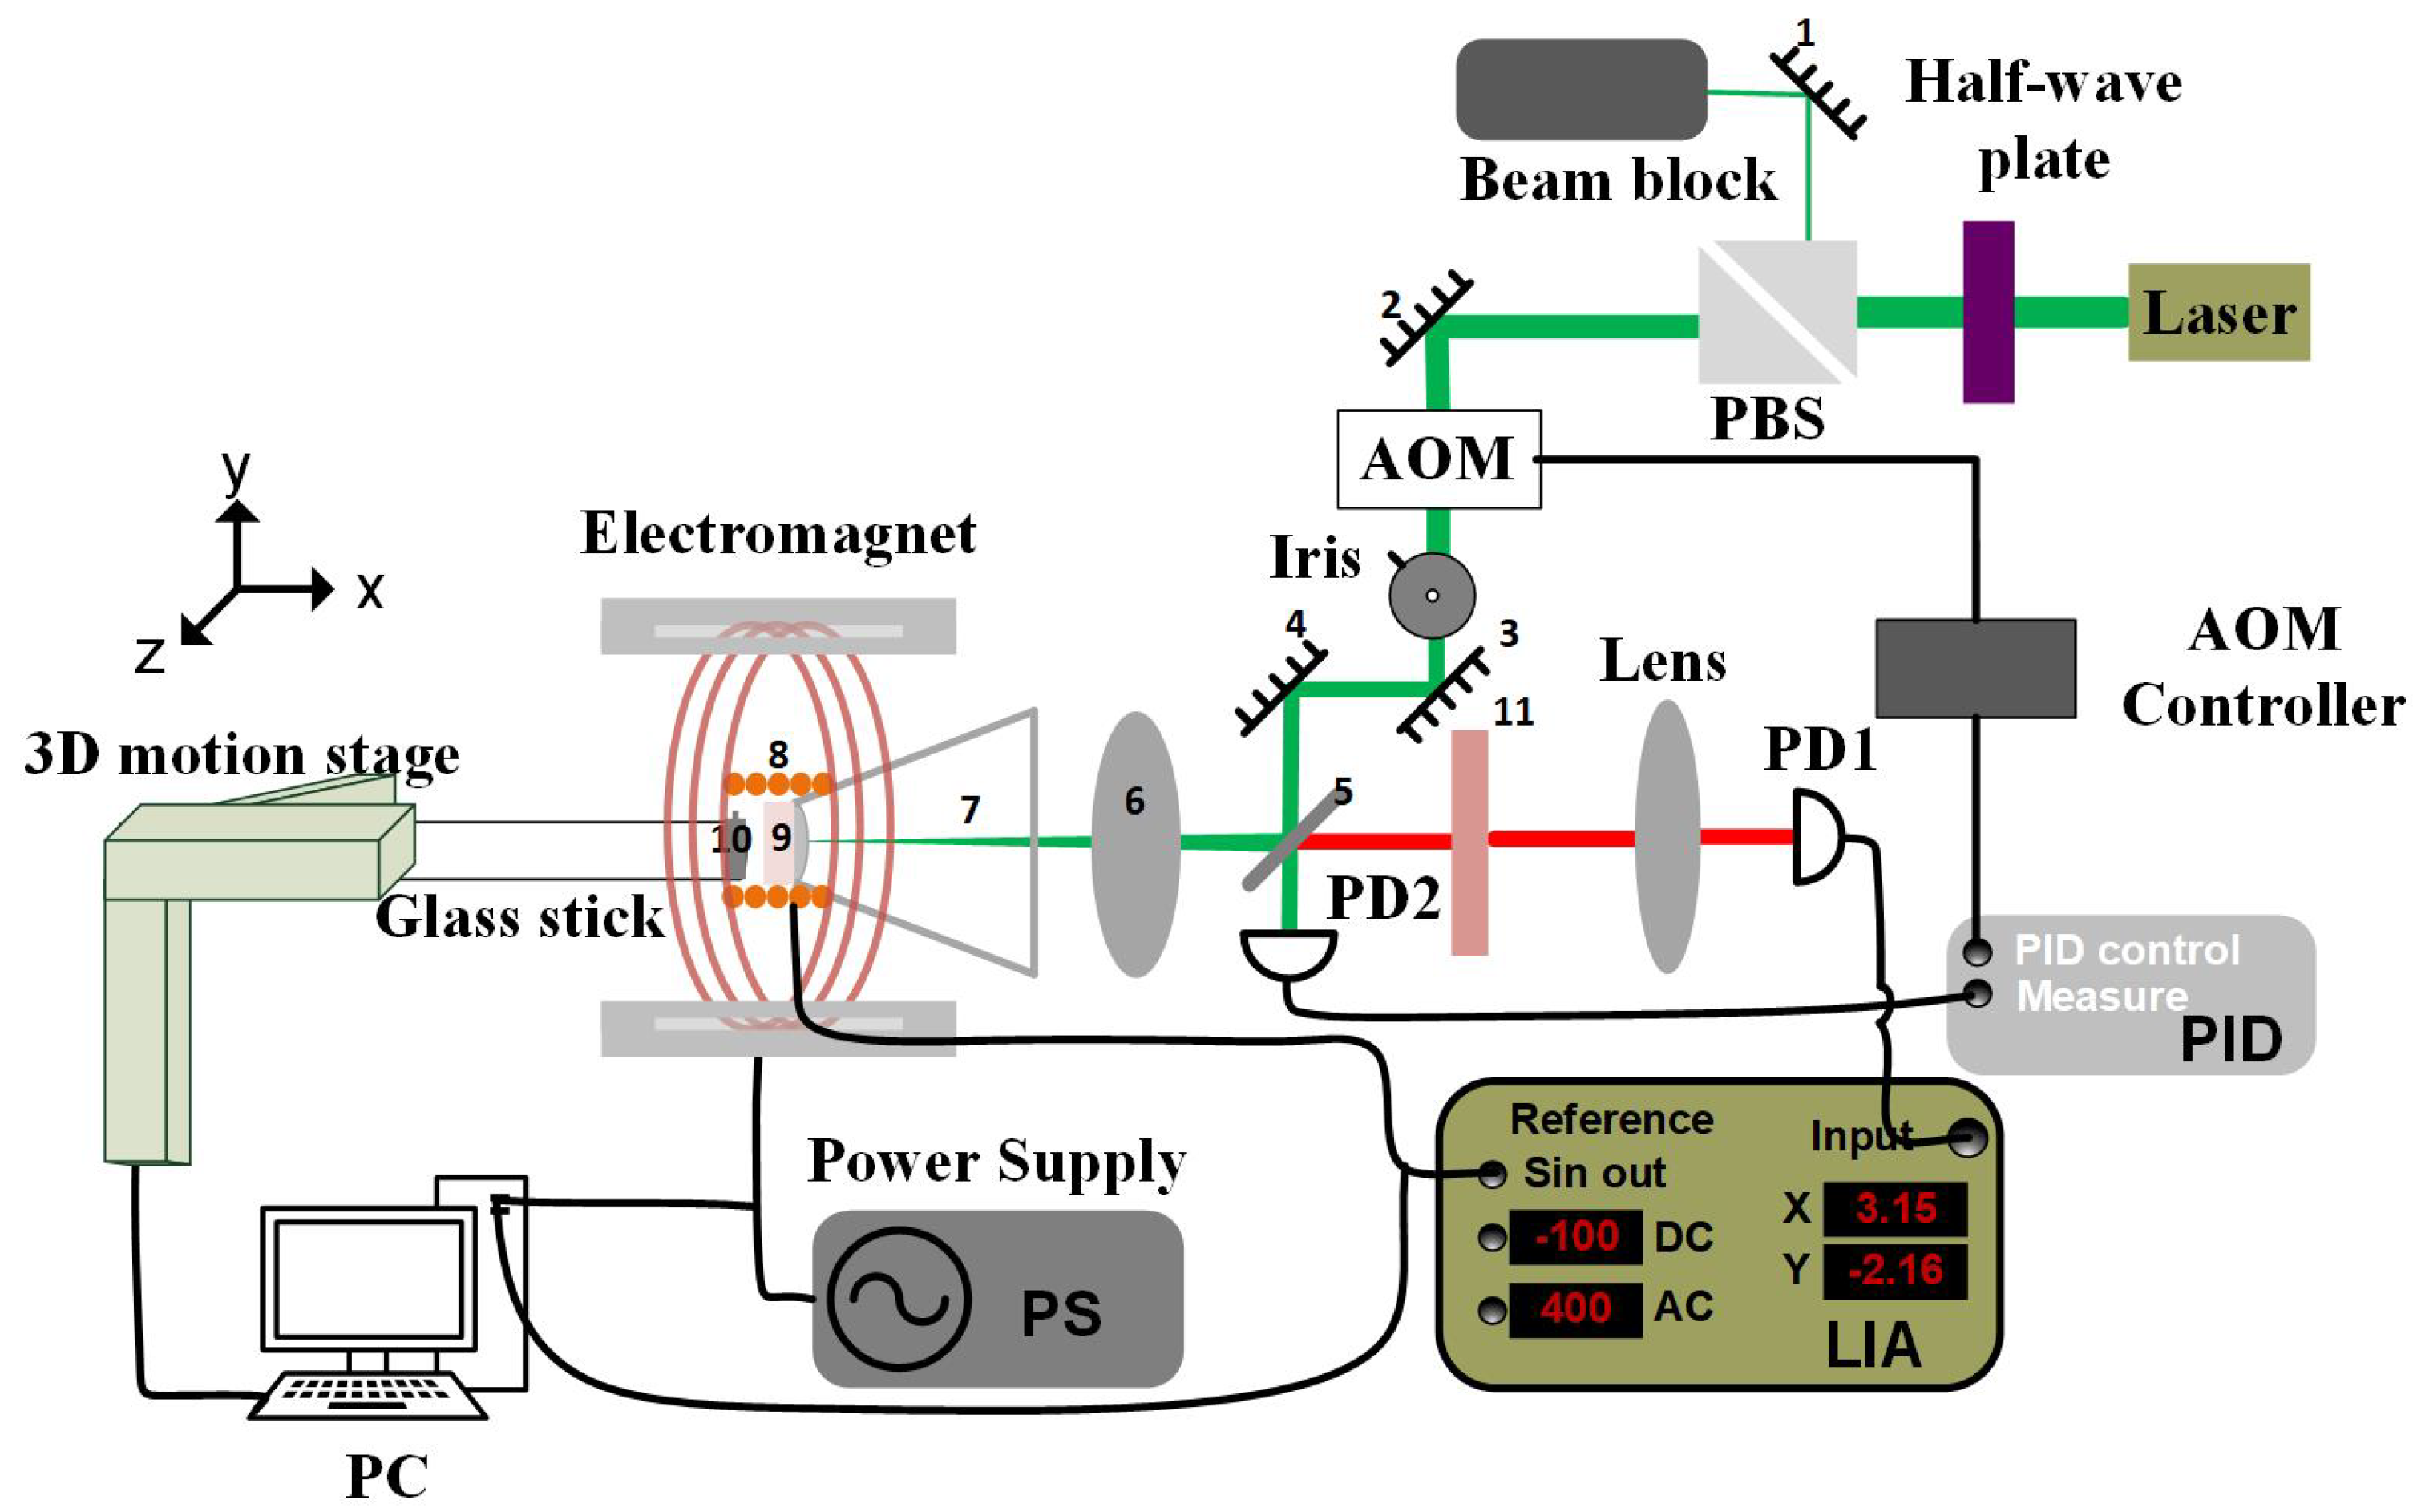
Abstract
:1. Introduction
2. Experimental Apparatus
3. AC Magnetometry
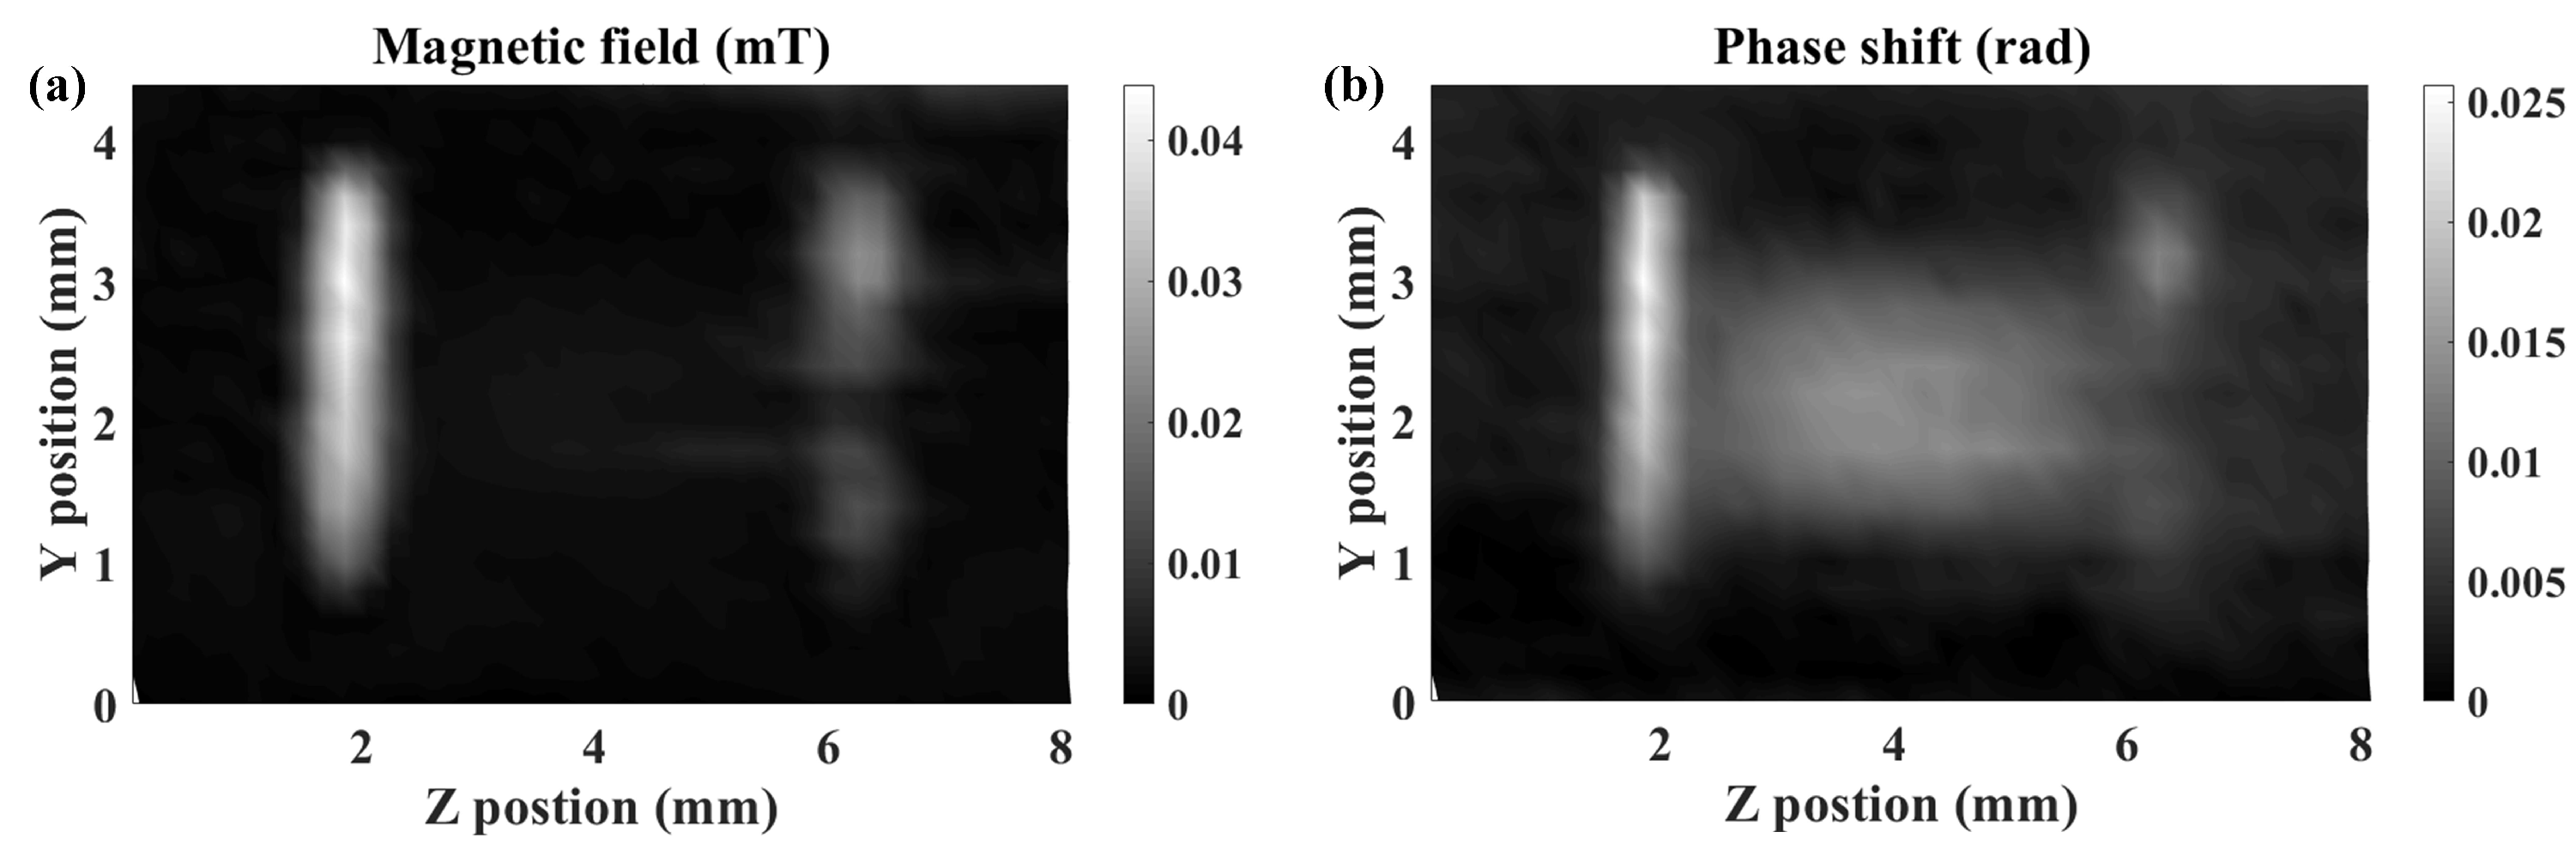
4. Battery Measurement
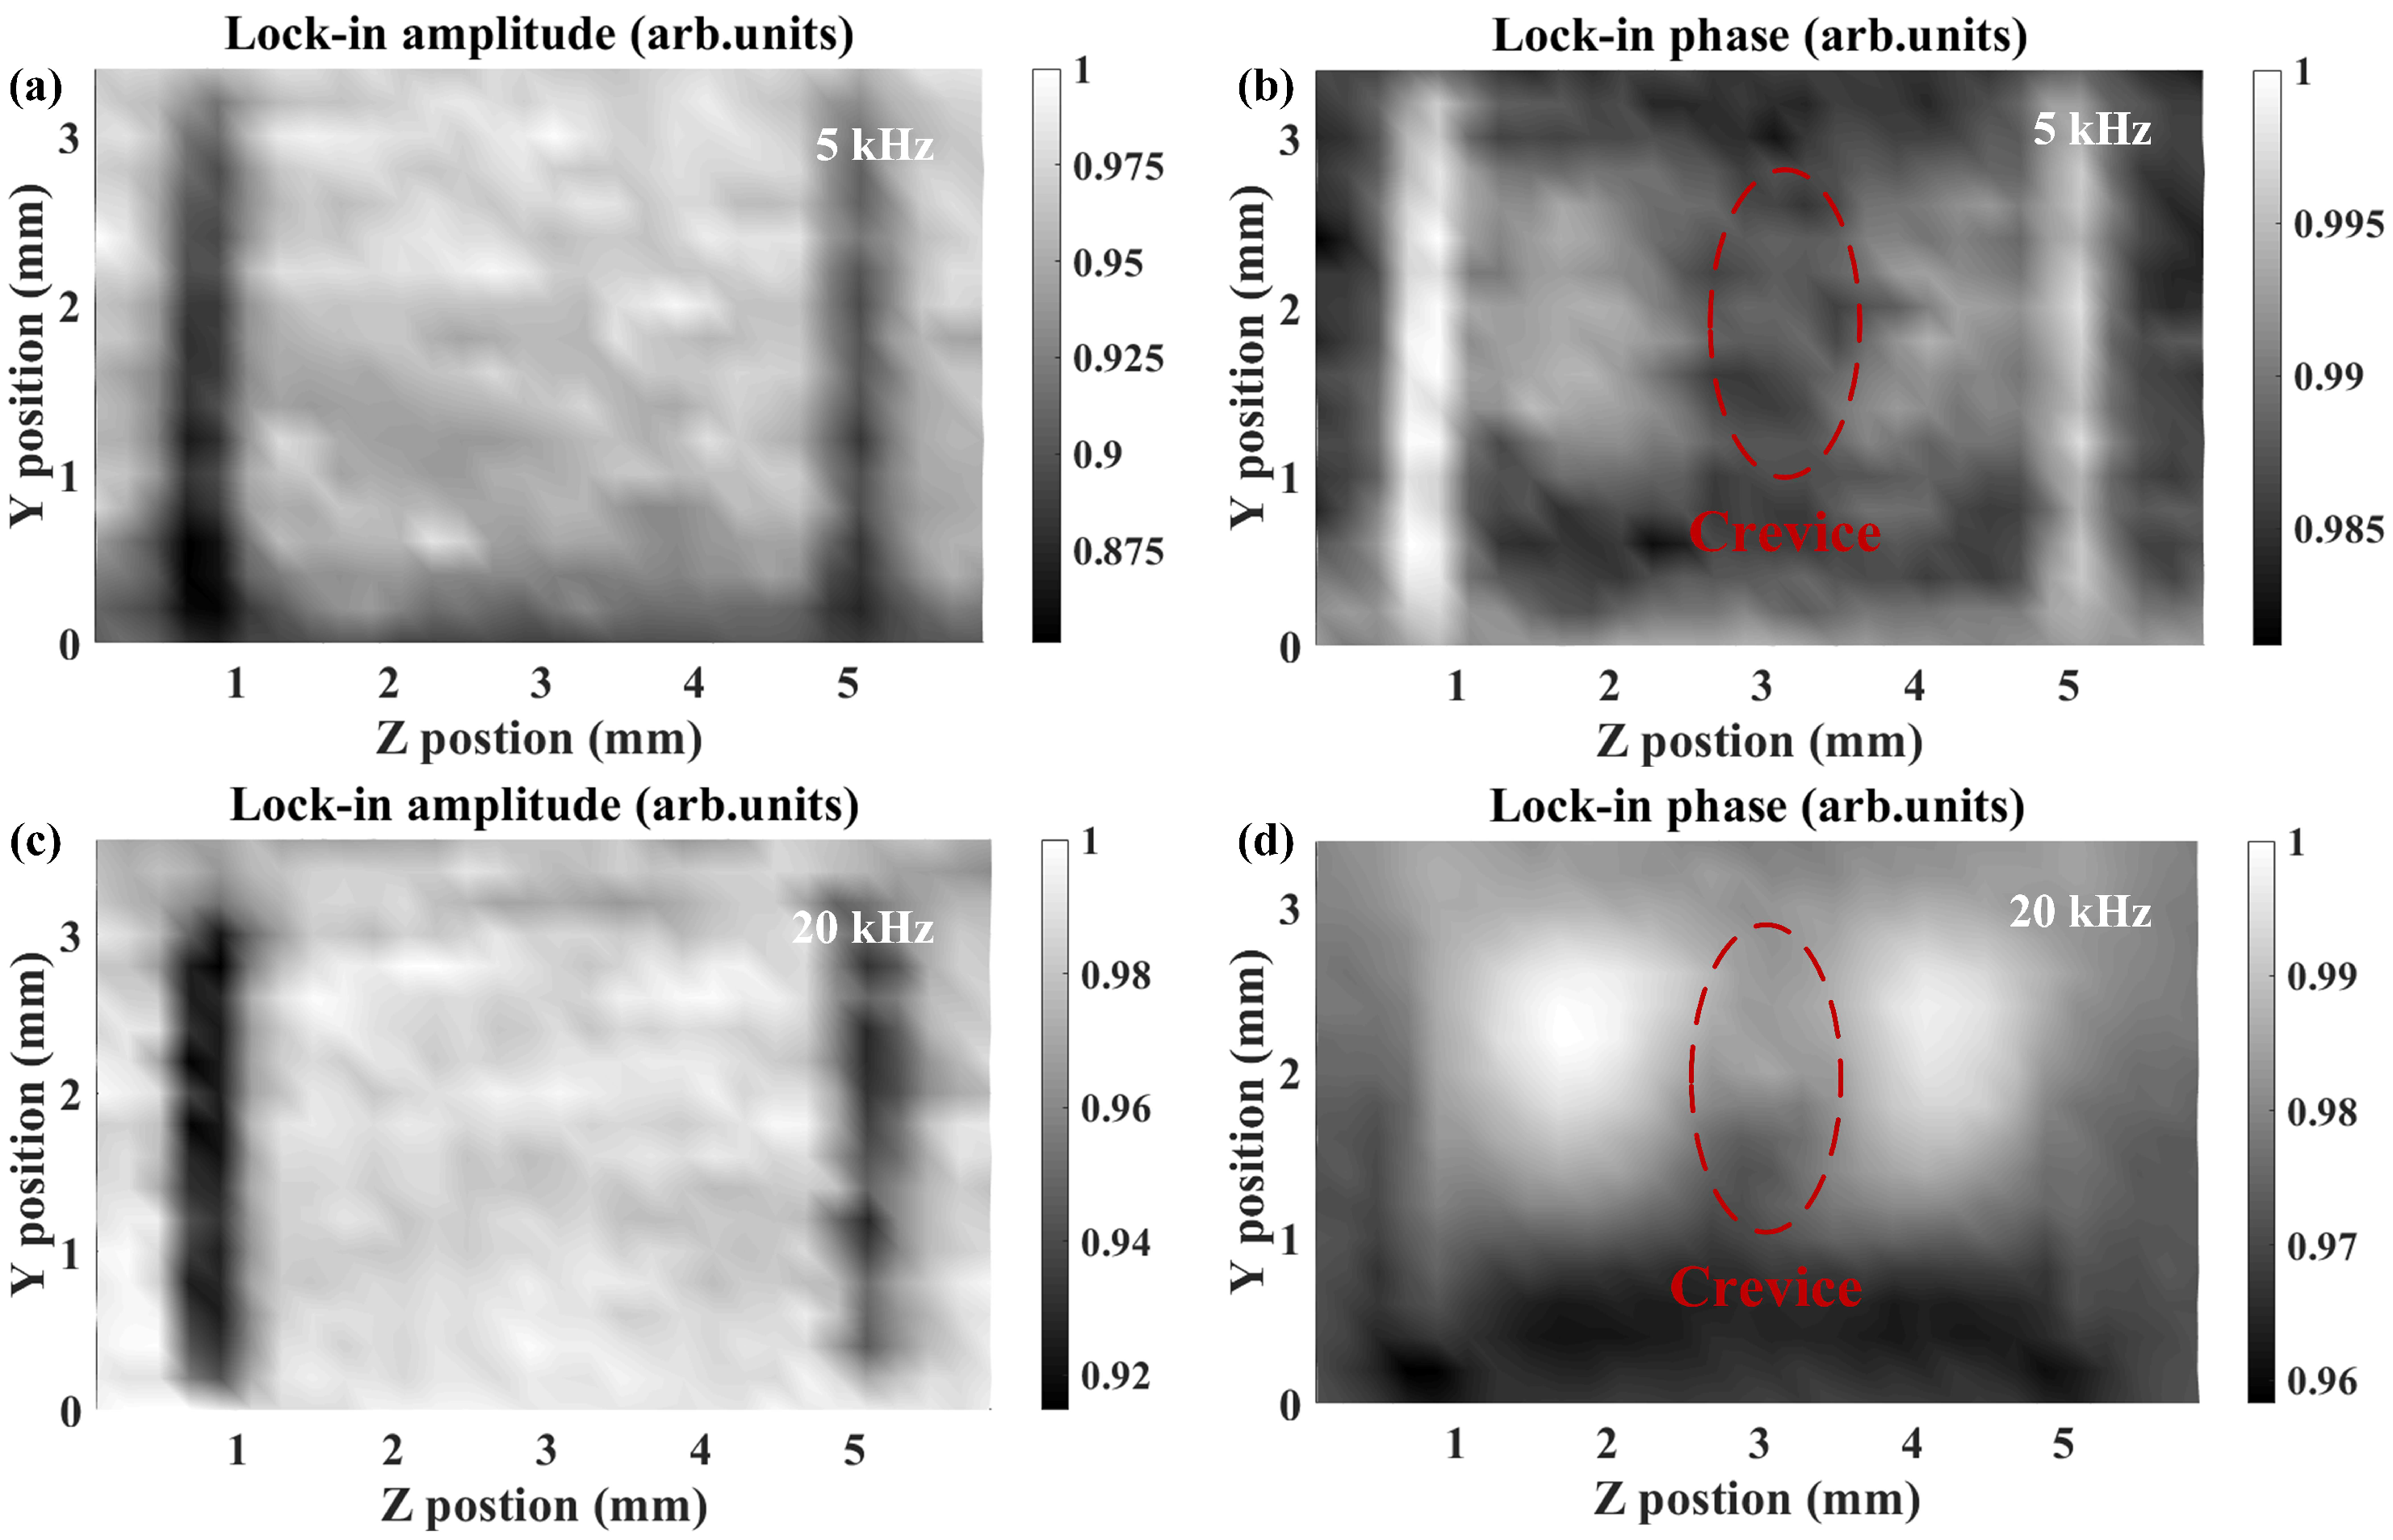
5. Spatial Resolution
6. Conclusions and Outlook
Author Contributions
Funding
Conflicts of Interest
References
- Wickenbrock, A.; Zheng, H.; Bougas, L.; Leefer, N.; Afach, S.; Jarmola, A.; Acosta, V.M.; Budker, D. Microwave-free magnetometry with nitrogen-vacancy centers in diamond. Appl. Phys. Lett. 2016, 109, 053505. [Google Scholar] [CrossRef]
- Kucsko, G.; Maurer, P.C.; Yao, N.Y.; Kubo, M.; Noh, H.J.; Lo, P.K.; Park, H.; Lukin, M.D. Nanometer scale thermometry in a living cell. Nature 2013, 500, 54–58. [Google Scholar] [CrossRef] [PubMed]
- Ovartchaiyapong, P.; Lee, K.W.; Myers, B.A.; Jayich, A.C.B.; Stacey, A.; Budker, D.; Hollenberg, L.C.L. Dynamic strain-mediated coupling of a single diamond spin to a mechanical resonator. Nat. Commun. 2014, 5, 4429. [Google Scholar] [CrossRef] [PubMed] [Green Version]
- Ajoy, A.; Cappellaro, P. Stable three-axis nuclear-spin gyroscope in diamond. Phys. Rev. A 2012, 86, 062104. [Google Scholar] [CrossRef]
- Ledbetter, M.; Jensen, K.; Fischer, R.; Jarmola, A.; Budker, D. Gyroscopes based on nitrogen-vacancy centers in diamond. Phys. Rev. A 2012, 86, 052116. [Google Scholar] [CrossRef] [Green Version]
- Dolde, F.; Fedder, H.; Doherty, M.W.; Nobauer, T.; Rempp, F.; Balasubramanian, G.; Wolf, T.; Reinhard, F.; Hollenberg, L.C.L.; Jelezko, F.; et al. Electric-field sensing using single diamond spins. Nat. Phys. 2011, 7, 459–463. [Google Scholar] [CrossRef]
- Block, M.; Kobrin, B.; Jarmola, A.; Hsieh, S.; Zu, C.; Figueroa, N.L.; Acosta, V.M.; Minguzzi, J.; Maze, J.R.; Budker, D.; et al. Optically Enhanced Electric Field Sensing using Nitrogen-Vacancy Ensembles. arXiv 2020, arXiv:2004.02886. [Google Scholar]
- Wickenbrock, A.; Jurgilas, S.; Dow, A.; Marmugi, L.; Renzoni, R. Magnetic induction tomography using an all-optical 87Rb atomic magnetometer. Opt. Lett. 2014, 39, 6367–6370. [Google Scholar] [CrossRef] [PubMed] [Green Version]
- Marmugi, L.; Hussain, S.; Renzoni, F. Electromagnetic induction imaging with a radio-frequency atomic magnetometer. Appl. Phys. Lett. 2016, 108, 103503. [Google Scholar]
- Wickenbrock, A.; Leefer, N.; Blanchard, J.W.; Budker, D. Microwave-free magnetometry with nitrogen-vacancy centers in diamond. Appl. Phys. Lett. 2016, 108, 183507. [Google Scholar] [CrossRef] [Green Version]
- Chatzidrosos, G.; Wickenbrock, A.; Bougas, L.; Zheng, H.; Tretiak, O.; Yang, Y.; Budker, D. Eddy-current imaging with nitrogen-vacancy centers in diamond. Phys. Rev. Appl. 2019, 11, 014060. [Google Scholar] [CrossRef] [Green Version]
- Acosta, V.M.; Bauch, E.; Jarmola, A.; Zipp, L.J.; Ledbetter, M.P.; Budker, D. Broadband magnetometry by infrared-absorption detection of nitrogen-vacancy ensembles in diamond. Appl. Phys. Lett. 2010, 97, 174104. [Google Scholar] [CrossRef] [Green Version]
- Zheng, H.; Chatzidrosos, G.; Wickenbrock, A.; Bougas, L.; Lazda, R.; Berzins, A.; Gahbauer, F.H.; Auzinsh, M.; Ferber, R.; Budker, D. Level anti-crossing magnetometry with color centers in diamond. Proc. SPIE 2017, 10119, 101190X. [Google Scholar]
- Hall, L.T.; Kehayias, P.; Simpson, D.A.; Jarmola, A.; Stacey, A.; Budker, D.; Hollenberg, L.C.L. Detection of nanoscale electron spin resonance spectra demonstrated using nitrogen-vacancy centre probes in diamond. Nat. Commun. 2016, 7, 10211. [Google Scholar] [CrossRef] [PubMed]
- Anishchik, S.V.; Ivanov, K.L. Sensitive detection of level anticrossing spectra of nitrogen vacancy centers in diamond. Phys. Rev. B 2017, 96, 115142. [Google Scholar] [CrossRef] [Green Version]
- Acosta, V.M.; Bauch, E.; Ledbetter, M.P.; Waxman, A.; Bouchard, L.S.; Budker, D. Temperature Dependence of the Nitrogen-Vacancy Magnetic Resonance in Diamond. Phys. Rev. Lett. 2010, 104, 070801. [Google Scholar] [CrossRef] [PubMed] [Green Version]
- Hu, Y.; Iwata, G.Z.; Bougas, L.; Blanchard, J.W.; Wickenbrock, A.; Jakob, G.; Schwarz, S.; Schwarzinger, C.; Jerschow, A.; Budker, D. Rapid online solid-state battery diagnostics with optically pumped magnetometers. Appl. Sci. 2020, 10, 7864. [Google Scholar] [CrossRef]
- Gomory, F. Complex Harmonic Susceptibilities of Bi2Sr2Ca2Cu3Oy with Different Critical-Current Density. Supercond. Sci. Technol. 1997, 10, 523–542. [Google Scholar]
- Mulder, C.A.M.; van Duyneveldt, A.J.; Mydosh, J.A. Susceptibility of the Cu Mn spin-glass: Frequency and field dependences. Phys. Rev. B 1981, 23, 1384. [Google Scholar] [CrossRef]
- Hu, Y.; Iwata, G.Z.; Mohammadi, M.; Silletta, E.V.; Wickenbrock, A.; Blanchard, J.W.; Budker, D.; Jerschow, A. Sensitive magnetometry reveals inhomogeneities in charge storage and weak transient internal currents in Li-ion cells. Proc. Natl. Acad. Sci. USA 2020, 117, 10667–10672. [Google Scholar] [CrossRef] [PubMed]


Publisher’s Note: MDPI stays neutral with regard to jurisdictional claims in published maps and institutional affiliations. |
© 2021 by the authors. Licensee MDPI, Basel, Switzerland. This article is an open access article distributed under the terms and conditions of the Creative Commons Attribution (CC BY) license (https://creativecommons.org/licenses/by/4.0/).
Share and Cite
Zhang, X.; Chatzidrosos, G.; Hu, Y.; Zheng, H.; Wickenbrock, A.; Jerschow, A.; Budker, D. Battery Characterization via Eddy-Current Imaging with Nitrogen-Vacancy Centers in Diamond. Appl. Sci. 2021, 11, 3069. https://doi.org/10.3390/app11073069
Zhang X, Chatzidrosos G, Hu Y, Zheng H, Wickenbrock A, Jerschow A, Budker D. Battery Characterization via Eddy-Current Imaging with Nitrogen-Vacancy Centers in Diamond. Applied Sciences. 2021; 11(7):3069. https://doi.org/10.3390/app11073069
Chicago/Turabian StyleZhang, Xue, Georgios Chatzidrosos, Yinan Hu, Huijie Zheng, Arne Wickenbrock, Alexej Jerschow, and Dmitry Budker. 2021. "Battery Characterization via Eddy-Current Imaging with Nitrogen-Vacancy Centers in Diamond" Applied Sciences 11, no. 7: 3069. https://doi.org/10.3390/app11073069