
Quo Vadis Solar Energy Research?


Department of Chemical and Energy Technology, School of Experimental Sciences and Technology (ESCET), Rey Juan Carlos University, 28933 Móstoles, Spain
Appl. Sci. 2021, 11(7), 3015; https://doi.org/10.3390/app11073015
Submission received: 8 March 2021
/
Revised: 22 March 2021
/
Accepted: 25 March 2021
/
Published: 28 March 2021
(This article belongs to the Special Issue Celebrating Applied Sciences Reaching the 20,000 Article Milestone: Invited Papers in the Section Energy)
Abstract
:In this paper, solar energy research trends and their publishing evolution are presented in terms of bibliometric analysis tools applied to the existing publications within the Web of Science Core Collection. Publishing evolution shows a clear interest in solar energy topics, as 50% of the total number of publications have been published within the time period between 2015 and 2020; most of them at journals and conference proceedings. A results analysis shows that China, the United States and India were the most productive countries in terms of solar energy research publications, and the list of the 10 most productive countries accounted for 83% of total publications within 2019 and 2020. The study pointed out as well that the main thematic areas in solar energy research in 2019–2020 were related to particular topics such as solar cells and optical properties, nanoparticles and composites, TiO2 and photocatalysis, and more general topics such as performance, simulations optimization and renewable energy. Based on paper findings, the research future of solar energy is bright, with continued growth in the publications record and a wide variety of research topics.
1. Introduction
The increase in energy consumption is a direct consequence of improvements in our living standards, the growing worldwide population and the general increase of nations wealth [1]. However, extensive energy consumption is associated with climate change and global warming, due to greenhouse gases emissions and other pollutants from the massive use of traditional energy resources based on fossil fuels [2]. Climate protection awareness to mitigate energy consumption consequences has led to stringent pollutant emissions legislation and extensive research in energy conversion technologies seeking higher conversion efficiencies. However, also to a global awareness about the importance of energy-saving, energy efficiency and renewable and sustainable energy resources [3,4,5,6]. In that context, solar energy is seen as one of the best alternatives to meet climate change actions, whether for electricity generation utilizing solar photovoltaics (PV) and concentrating solar power (CSP), or for heat generation, whether for the domestic or industrial application using different solar thermal energy technologies [7].
In the last few decades, solar energy technologies have experienced a significant cost reduction through new materials developments, technology improvement and wider commercial experience [8]. Between the years 2010 and 2015, solar photovoltaics (PV) reduced the global weighted average levelized cost of electricity (LCoE) from an average 0.30 USD/kWh to an average 0.13 USD/kWh, mainly thanks to PV panels’ new materials and larger operational experience. Predictions estimate that by 2025, installed cost reductions together with O+M costs will decline and the increase in the global weighted average capacity factor will result in 0.055 USD/kWh. Furthermore, the 5th to 95th percentile LCoE cost for individual utility-scale solar PV projects could fall to between 0.03 USD/kWh to 0.12 USD/kWh [8]. Cost reduction has contributed to the technology deployment evolving from 40.277 GW nominal power installed worldwide in the year 2010 to 580.159 GW by the year 2019 that represented an increase of 1340% of the installed power [9]. In the case of concentrating solar power, levelized cost of electricity (LCoE) has been reduced from 0.346 USD/kWh average in the year 2010 down to 0.182 USD/kWh average in the 2019 year. This represented a reduction of 47% during the last decade, while the auction database for 2021 reflects LCoE of 0.075 USD/kWh [10]. Regarding power installation, its fast deployment in 2008–2014 was slowed down due to policy changes in relevant CSP countries such as Spain [11]. However, CSP installation has sped up again during the last few years, with the large projects in the Middle East and North of Africa region leading to 6.275 GW of total installed capacity by 2019 compared to 1.266 GW of installed capacity by the year 2010, what represented an increase of 396% in the last decade. Furthermore, a large interest in CSP technologies has arose based on their potential for large thermal energy storage that enables thermal energy harvesting and electricity production being decoupled. This is offering a cost-competitive solution for large energy storage, which is contributing to grid stability and the deployment of non-dispatchable energy resources [12,13].
Cost reductions on solar energy technologies and their growing relevance in current energy and environmental context have been supported by extensive research that can be found in scientific journals, conference proceedings, books and other materials. Based on a large number of publishing sources and the existing materials on this topic, a systematic methodology is required to analyze this big data and to derive research trends and conclusions from the study of all those publications. One of those methodologies is known as bibliometric analysis and consists of the statistical study of the existing publications in a field by using networking maps and semantic analysis [14]. Bibliometric analysis has been traditionally applied to social sciences and humanities. Nevertheless, its application to engineering topics and energy research is of great interest to discover connections between different institutions, collaborations among countries, and to obtain a wider picture of research trends in the field of study. They also allow identifying hot emerging topics within the research field by analyzing the change in the number of publications and citations for the given keywords. Compared to a traditional literature review approach that is mostly based on scholar experience and institutional access to different editorial repositories, bibliometric analysis benefits from big data extraction and processing tools to get a better view of a research topic and to identify main contributors in the field, as well as trending and hot topics of research [15]. They can also be used to identify gaps in the research field, helping scholars to fulfil deeper studies and reviews to cover that research gap [16]. Bibliometric methods together with networking map layouts are a good complement to perform systematic literature reviews, as they enable one to find connections and research trends by extracting large data contained in whole corpus publication.
Bibliometric analysis has been applied recently to investigate energy research topics, both from trends and thematic areas point of view. Some examples of the existing literature are referring to the use of bibliometric mapping to identify areas of research on sustainable supply chain management and how hot topics in that field changed over the last decade [17]. There are studies as well about the global transition to low-carbon electricity systems based on research hot spots and trends analysis for the last three decades [18]. Other bibliometric studies have been focused on the relationship between energy, economy and environment, based on different subject areas and by performing a clustering study to analyze the evolution of most common keywords along two decades to conclude those which were the research trends and hot topics in the field area [19]. Other works analyzed thermal energy storage perspectives based on their most referenced publications [20] and detected the research trends [20]; others studied the relevance of distributed cogeneration of power and heat within an energy management strategy [21] or studied the research contribution of a particular country in wind energy research [22]. Regarding bibliometric studies on solar energy research, some examples analyze the existing solar energy literature between 1992 and 2011 [23], the analysis of solar power-related publications between 1991 and 2010 [24], or the analysis of open innovation in solar energy research between 2000 and 2014 [25]. There are some works about more detailed studies regarding the integration of combined cycles with concentrating solar power plants [26], others referring to the state of the art of solar cooling technologies [27] and the analysis of research tendencies on photovoltaic solar energy management [28].
This paper aims to identify the main areas of research in solar energy that have emerged over the last few decades by analyzing indexed publications metadata. The paper is of relevant interest for scholars and researchers in solar energy to understand the evolution of research hot topics and which new ones have appeared. That analysis is performed by comparing most common research keywords and their interdependence through networking and heat maps over the last few decades. First of all, it is reviewed about the growing number of publications in the solar energy field, which are the most productive countries and which ones are gaining or losing relevance in the international research picture in terms of number of publications and publishing sources. Secondly, changes in thematic areas according to the different research categories are discussed to detect modifications on research interest. After that, keywords occurrence analysis is used as the basis for hot topics investigation and their publishing evolution.
2. Data and Methodology
Web of Science (WOS) Core Collection metadata from indexed publications on solar energy topic have been extracted for bibliometric analysis purposes. Those publications represent the corpus data that will be used for technology research trend analysis. Web of Science (WOS) indexed publications have been preferred rather than Scopus indexed ones, as WOS has strong coverage which goes back to 1990, which will provide a better view of research evolution. On the contrary, the Scopus database covers a superior number of journals, but with lower impact [29].
Methodology
Question query “solar energy” has been used as the topic for WOS Core Collection search what will retrieve indexed publications containing that exact text string whether in publication title, abstract, keywords provided by authors or Keywords Plus®. The latter are words or phrases that frequently appear in the titles of an article’s references, but do not appear in the title itself based on the Clarivate Analytics algorithm [30]. Bibliometric analysis has been performed using both the add-on tool from Clarivate Analytics available at the Web of Science [31] and VOSviewer 1.6.16 networking software for scientific landscape mapping [32]. Analysis tools available on WOS for data analytics include visualization for constructors such as research categories, publication years, document types, funding agencies, authors, countries/regions, source titles or organizations, among others. Filtering options are provided to exclude and refine publication search, in terms of those categories what allows researchers to focus their searches.
For search events that are containing less than 10,000 records, Web of Science includes citation report creation that includes the total number of publications and citations, their publishing evolution per year, h-index and average citation per item for the question query. WOS h-index is calculated based on a list of publications ranked in descending order by the times cited count. In other words, an h-index of h means that there are h papers that have each been cited at least h times [33]. Citation report generated by the WOS can be downloaded and its data are extracted, which facilitates further insight into research studies using bibliometric analytics tools. Publications ranked by WOS citation report are linked to author’s profile, which provides useful data for researchers such as researcher ID, author alternative names, affiliation evolution, the total list of publications, author h-index, the sum of times cited, citing articles, author statistics in terms of being the corresponding author, first author and last author of his publications and author network displaying the top 5 most frequent co-authors on the publications in this author record.
Among the variety of indicators and items that can be analyzed from WOS extracted data, keywords analysis and density maps allow investigating hot topics within the thematic area and connections among authors, countries, affiliations or publishing sources. Those analyses can be performed using networking mapping bibliometric tools, such as VOSviewer, of which different indicators are shown in Figure 1. During the postprocessing stage using VOSviewer, it is key constructing and applying thesauri about the research field of study. Through that mechanism, duplicities that may appear among similar keywords (plural forms, compound words or synonyms that would) would be eliminated and networking and heat map analyses will not be affected [34].
3. Results
In this section, solar energy research evolution is discussed in terms of the total number of publications, the most common publishing sources, most productive countries, different research categories and current research trends from keywords analysis.
3.1. Solar Energy Research Evolution between 1900–2020
Solar energy research evolution is analyzed in terms of all indexed publications retrieved by the WOS Core Collection for the question query “solar energy” between 1900 and 2020. As was mentioned before, the WOS database includes more indexed publications than Scopus database before 1990, and therefore it was preferred instead. Question query was searched through publications containing “solar energy” string whether as their publication title, author keywords or Keyword Plus®.
Figure 2 shows the publishing evolution in terms of the number of publications per year (records) and the accumulated number of publications (in percentage). Between 1900 and 2020, a total amount of 48,738 publications were published on solar energy research topics with a clear growing trend during the last decade, which confirms the increasing interest of academia in these topics. For the sake of clarity, a close-up figure for the time period 1900–1970 has been included in the graph for the better observation of early solar energy publications. It can also be observed on the secondary vertical axis of the figure that 90% of the total number of solar energy publications were published between 2000 and 2020 and 50% of publications were only published during the time period between 2015 and 2020, which confirms the very high and recent interest in solar energy research.
It can also be observed that 95% of total publications were released after 1991 and 99% of publications after 1976. Before 1970, the number of indexed publications on solar energy research according to WOS Core Collection was marginal with an accumulated number of 150 publications (of the total 48,738 publications of the corpus data); those numbers represent 0.31% of total publications. It is worth mentioning that before 1950, only 12 publications were indexed about solar energy and the oldest one was recovered is from 1903 regarding the recent discovery of radium and its guess as a source of energy in the sun [35]. Attending to the document types, indexed publications on solar energy research can be classified as they are represented in Figure 3.
As can be observed, the most common publishing sources in solar energy research were articles (accounting for 63% of total) followed by proceedings papers (26%), both together accounted for 89% of total publications. To a lesser extent, review articles (8%) together with book chapters, meeting abstract and editorial material covered 99% of total publications, while notes, letters, new items or retracted publications had a marginal impact in publishing distribution.
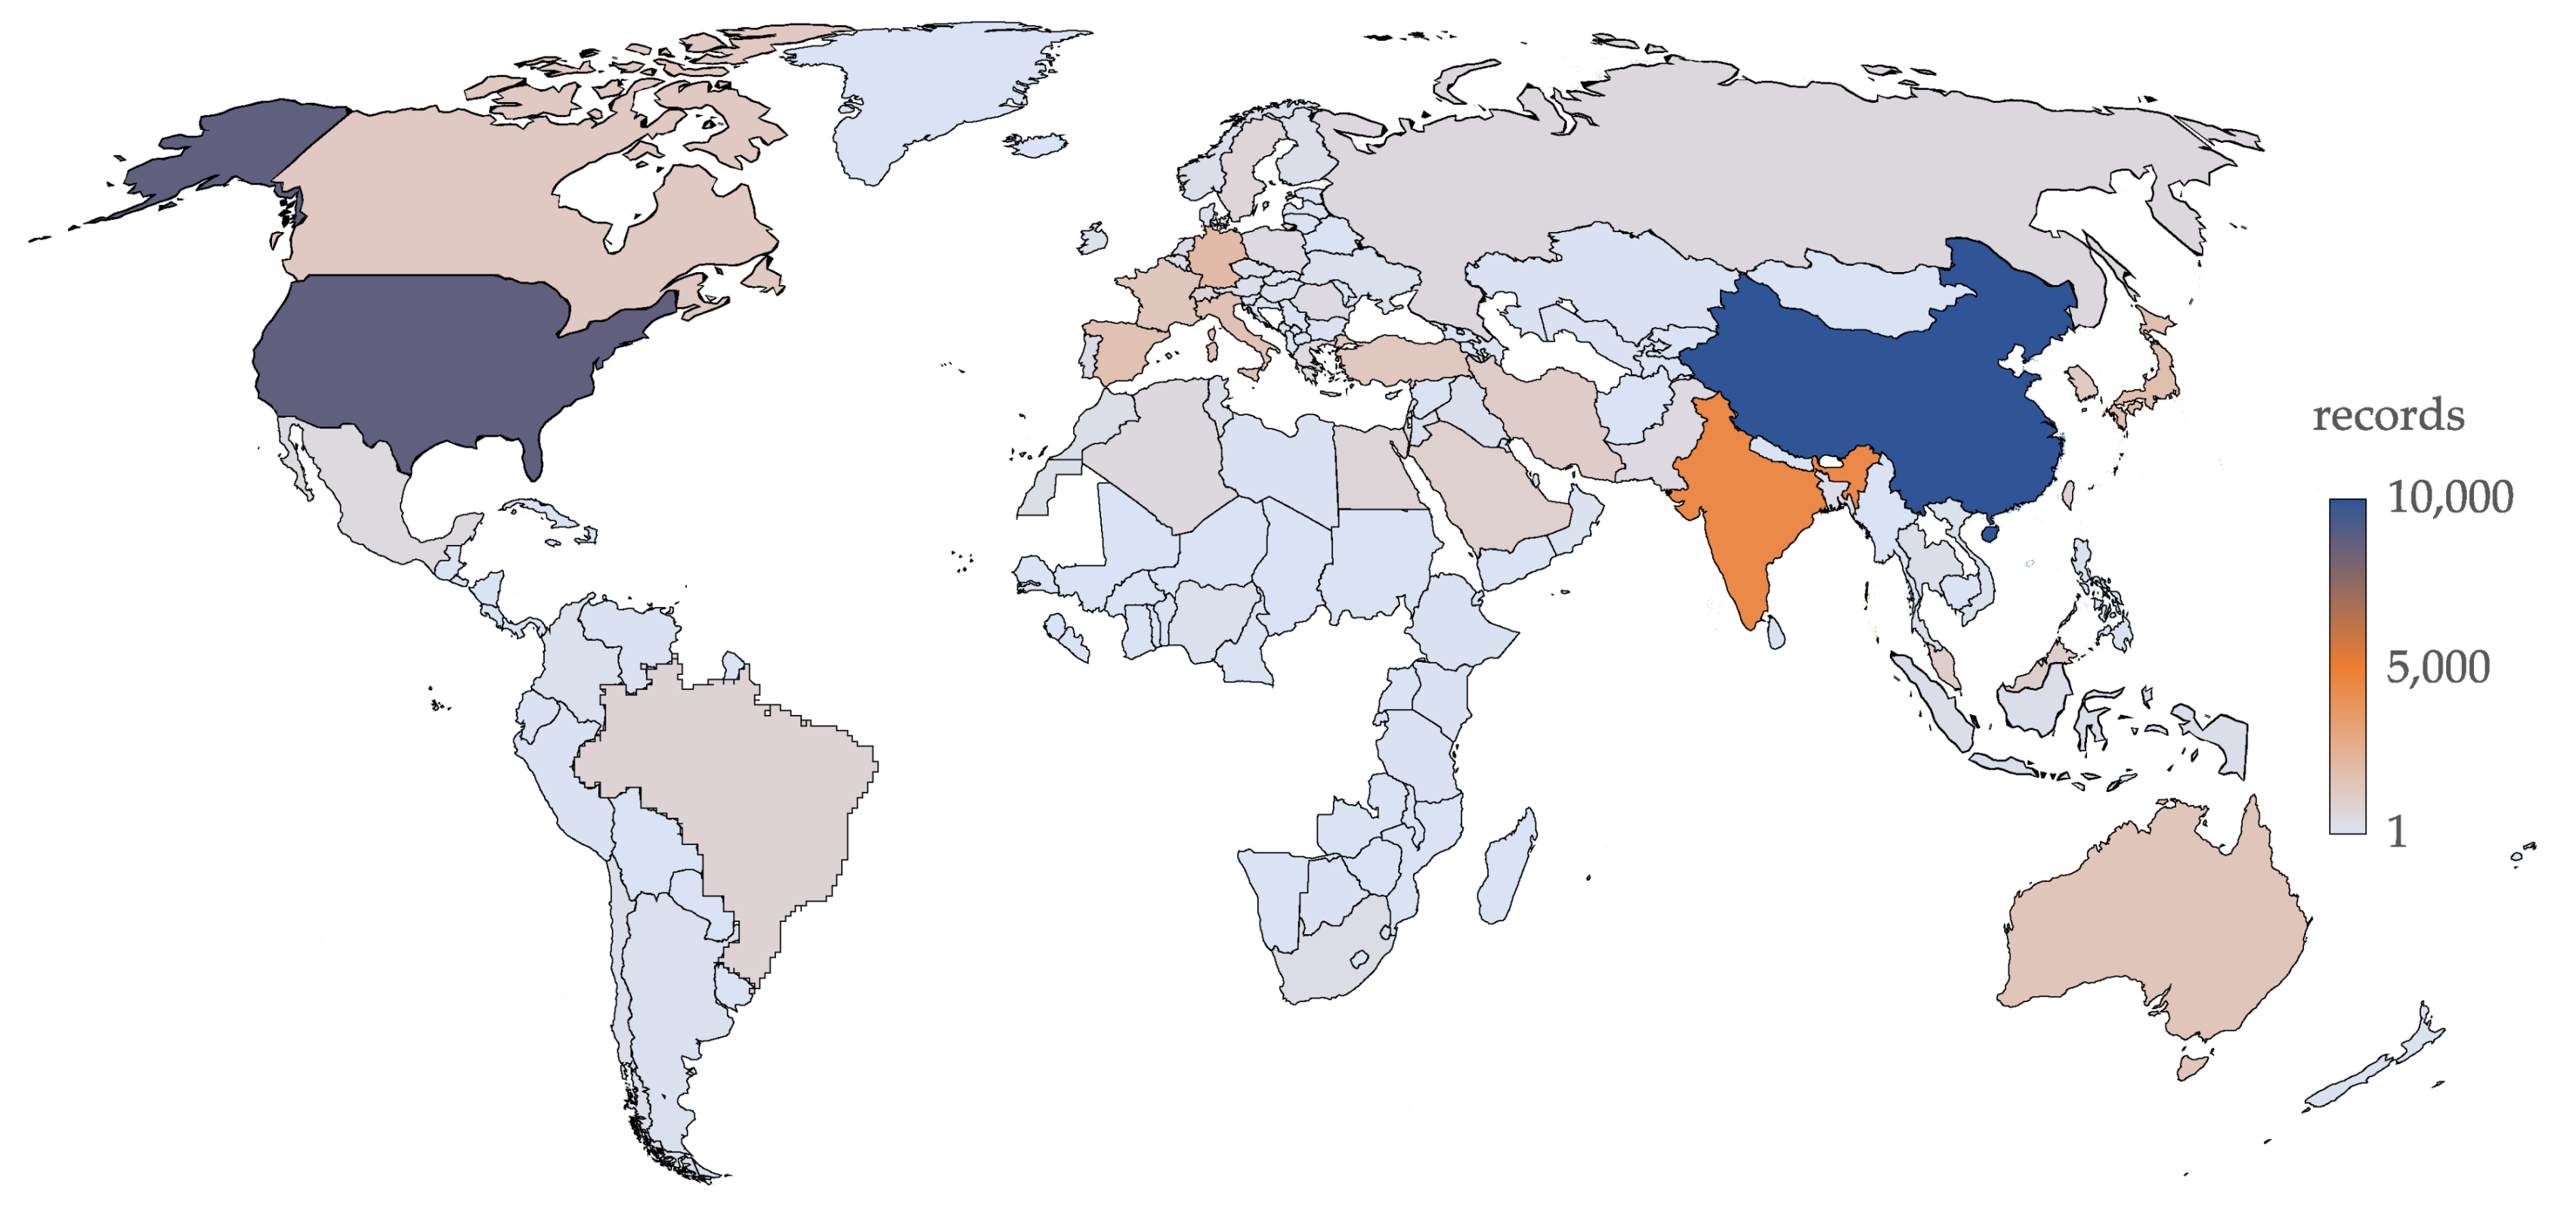
Figure 4 shows worldwide publishing distribution in solar energy research for the whole time period (between 1900 and 2020). Regions without publications have been omitted for representation purposes.
In that figure, no distinction is made among the different publishing sources sorted in Figure 3, as all documents’ contributions have been counted equally. As it can be observed, solar energy research is dominated by the United States and China in terms of scientific publications, as both of them account for 39.7% of the total indexed documents. Table 1 ranks the 10 most productive countries, both in terms of documents number and their global contribution. As can be noted, publications from these countries (35,855 documents) account for 73.6% of the total indexed documents.
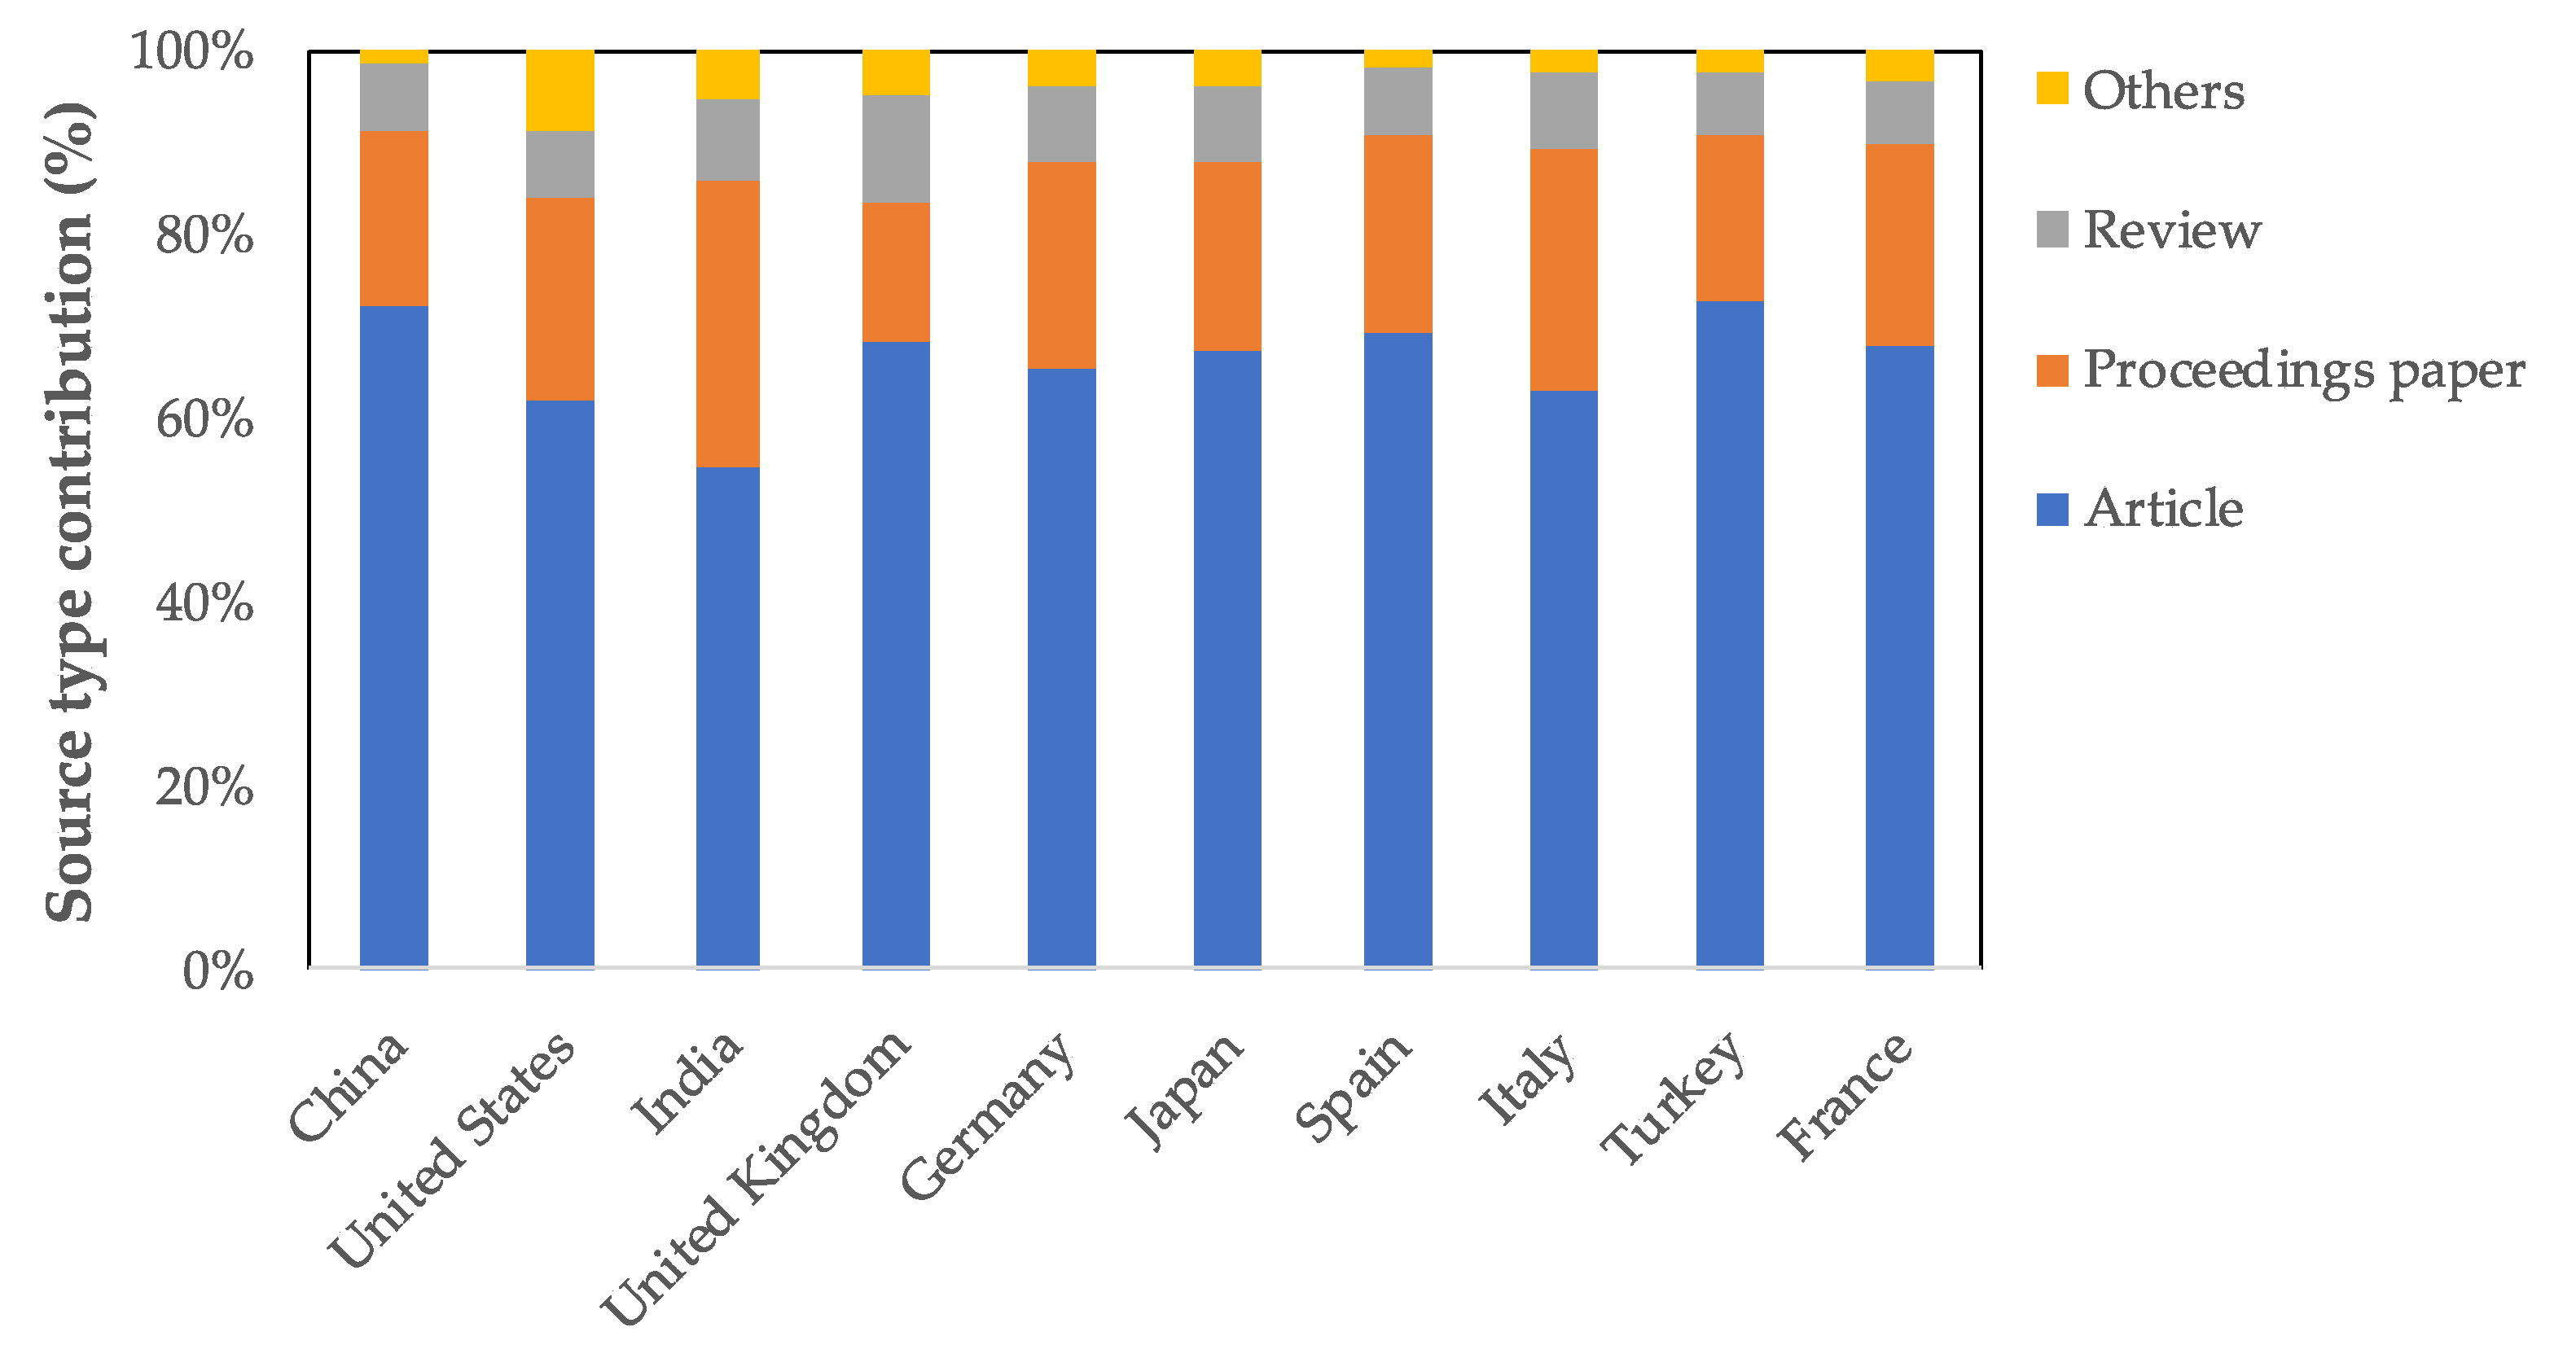
Figure 5 highlights publishing source distribution for the most productive countries gathered in Table 1. As can be observed, China and Turkey have the highest ratio of article publications—over 72% of their total documents, while India shows the lowest with less than 55%. On the contrary it has the highest contribution on proceedings papers with more than 31% of their publications. It can also be observed that United Kingdom is the most productive country in terms of review publications for solar energy research with 11.4% followed by India with 9.2%. On average, most productive countries shown a 66.4% articles contribution that was above the 63% average shown by Figure 3 and a lower proceedings article with 21.8% average compared to 26% contribution, considering all countries.
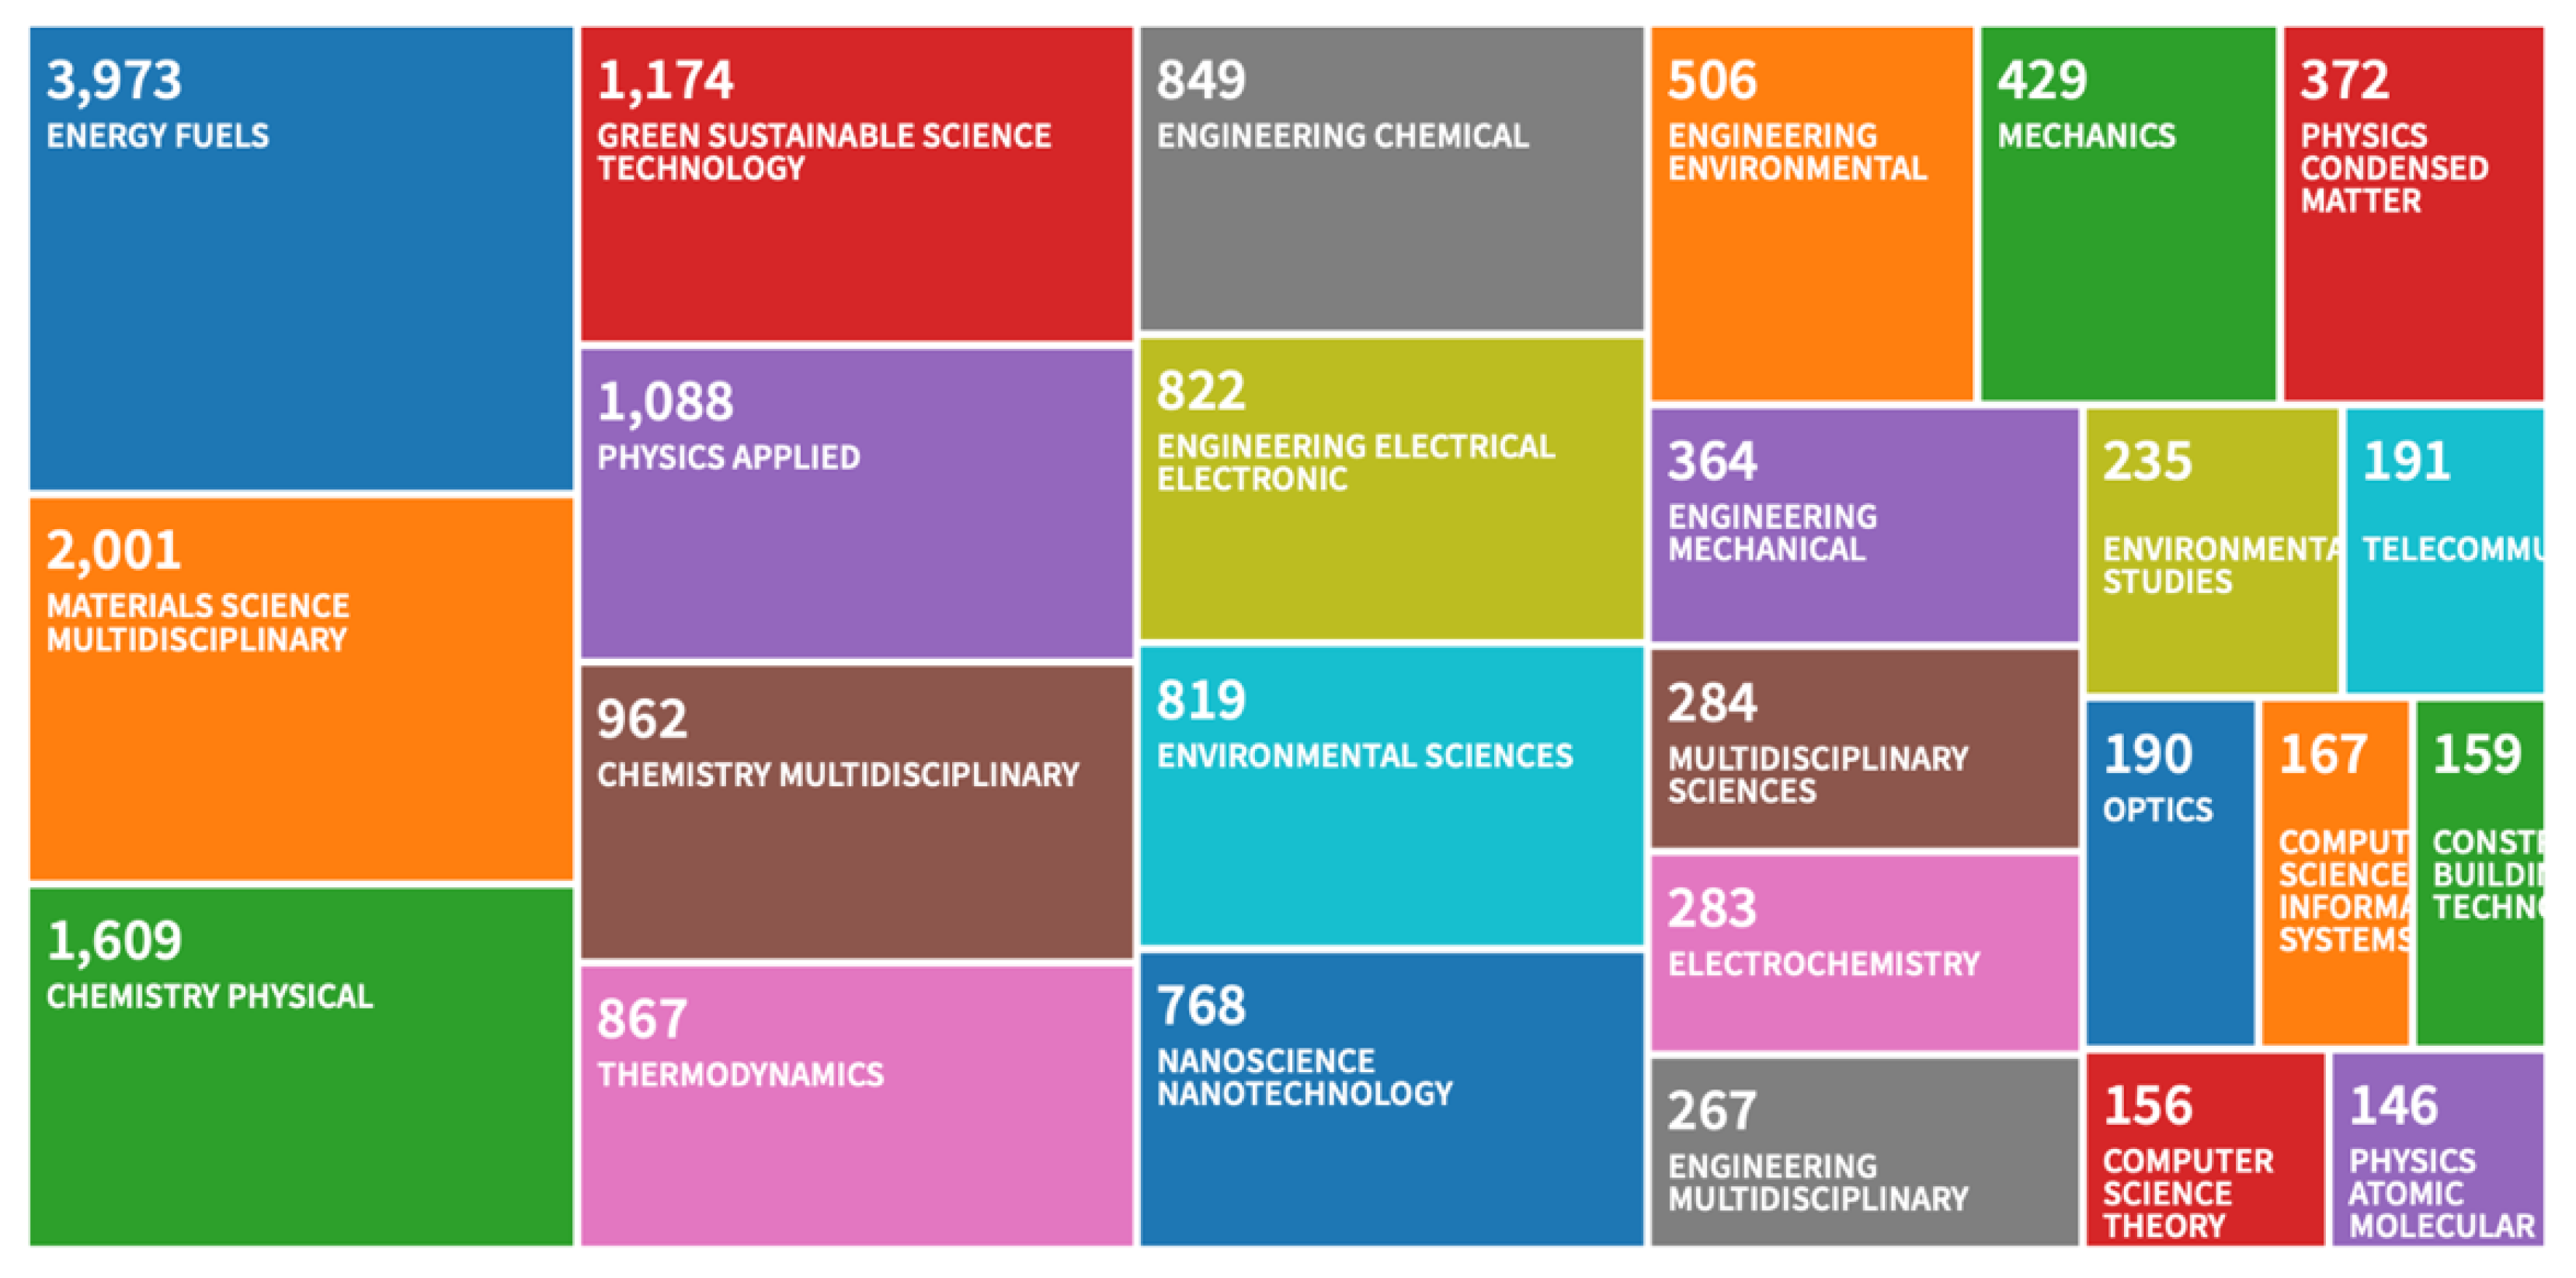
Retrieved publications can be classified as well, attending to Web of Science categories as it is shown in Figure 6 that includes the 25 most common research categories. As can be noticed, publications can be classified in the WOS attending to one or several categories what is translated into a larger number of items than the total number of publications. Nevertheless, several conclusions can be derived from research categories, Energy Fuels (18,972 documents) has traditionally been the most common area for solar energy research. Followed by Materials Science Multidisciplinary (7755), Engineering Electrical Electronic (5832), Chemistry Physical (5650), Physics Applied (5066) and Green Sustainable Science Technology (4693) with a similar relevance. These indicators reveal the importance of some topics in solar energy research, such as photovoltaics, photocatalysis, hydrogen production and conversion efficiency, as will be discussed in the next section.
3.2. Solar Energy Research during 2019–2020
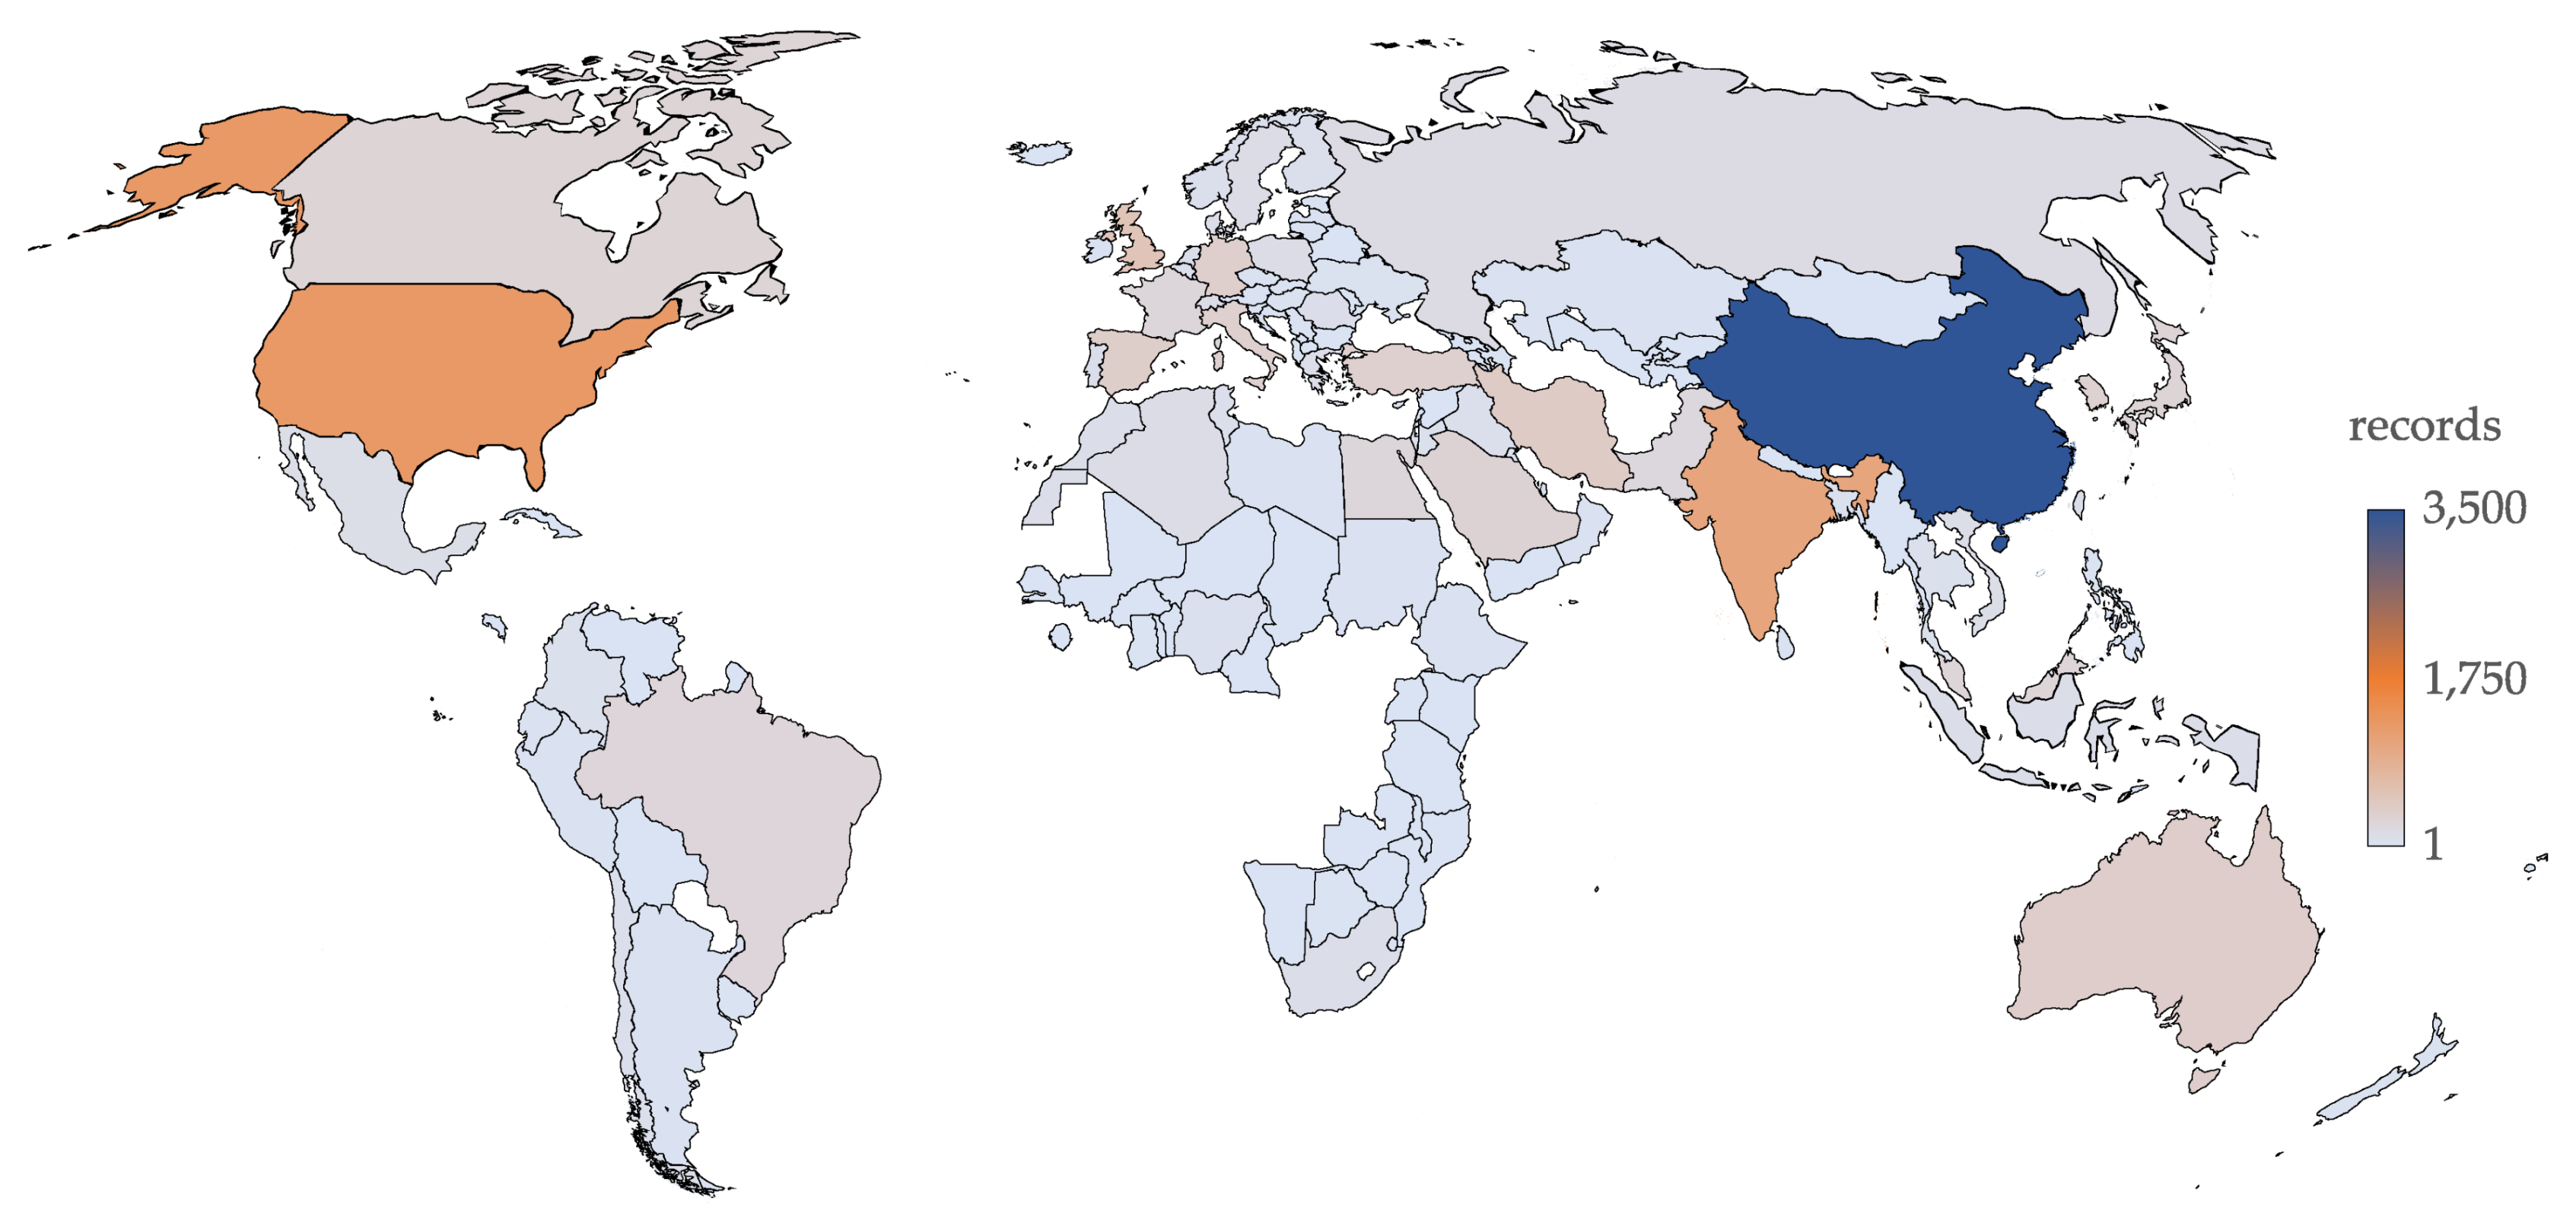
Attending to solar energy publications published in 2019–2020, Figure 7 shows their geographical distribution, where China was the most productive country with more than 3500 publications, followed by the United States with 1270 documents.
Table 2 gathers publishing information from the 10 most productive countries in solar energy research during 2019–2020 and data comparison of those countries between 1900 and 2018. As can be noticed, China has become the main publishing country in solar energy research with their publications accounting for 34.2% of the total number in the last couple of years, compared to 18.5% (between 1900 and 2018) what represented the second position of the ranking. On the contrary, the United States, Germany and Italy research contribution during 2019–2020 was reduced in terms of percentage of publications compared to the period 1900–2018. As can be observed, Iran, Australia and Turkey escalated several positions from global rankings 16th, 10th and 12th positions up to 5th, 6th and 9th global positions during the last couple of years.
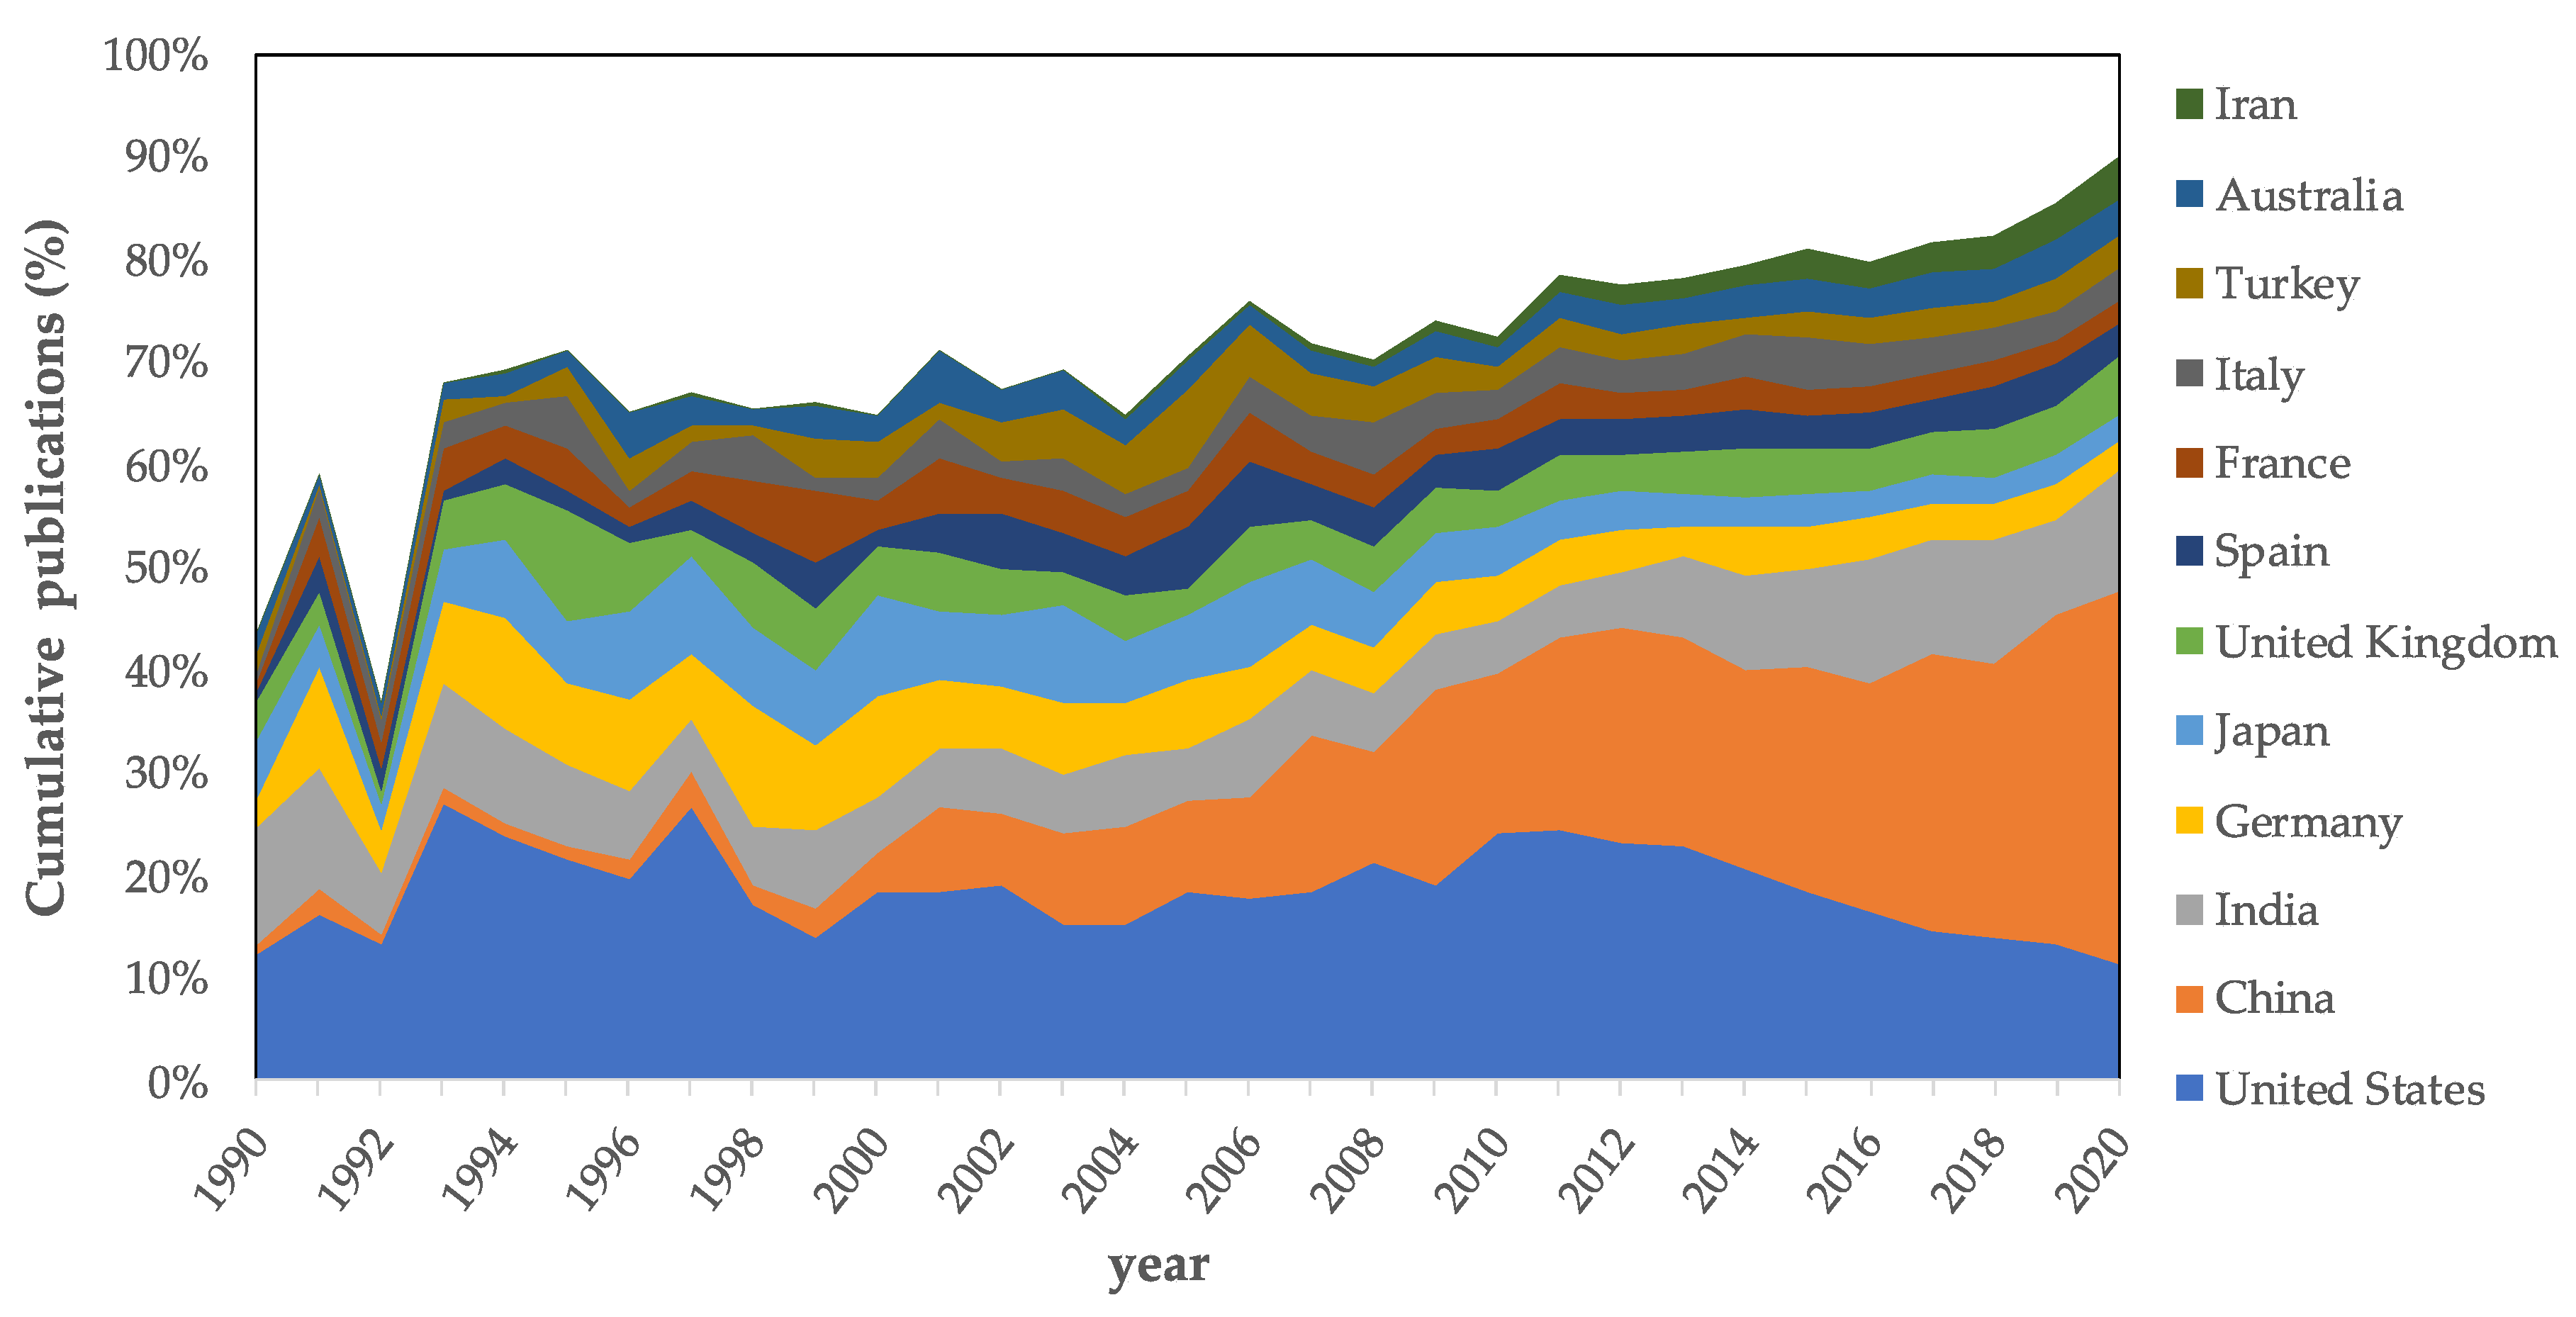
The same publication trend can be observed in Figure 8, where publishing evolution during the last three decades has been shown for the most productive countries. As it was stated in Figure 2, this time period covers more than 95% of total research documents. The publishing decline of the United States and the growing dominance of China from 2014 can be appreciated. The decline of Japanese solar energy research contribution from 2010 compared to other countries and the fast growing of Iranian publications over the last couple of years can also be noted. It can also be appreciated that the 12 countries represented in Figure 8 accounted for 90% of publications in year 2020 compared to 79.6% contribution in 2016 or a modest 36.8% back in 1992. It is also remarkable that back in 1990, Chinese contribution in solar energy research accounted for 0.95% of total publications, while in 2020, it was the dominant country, with 36.2% of the total documents.
Regarding the most common research categories for solar energy publications during 2019–2020, it can be observed in Figure 9 that Energy Fuels (3973 documents), Materials Science Multidisciplinary (2001) and Chemistry Physical were the preferred categories. Meanwhile, Green Sustainable Science Technology that had been reported as the 6th most common research topic in Figure 6 escalated to 4th most common.
4. Discussion
In this section, solar energy research trends are investigated through publication keywords analysis. Data from the last couple of years (2019–2020) and for the last decades are analyzed separately in order to detect new topics in solar energy research.
4.1. Solar Energy Hot Areas of Research (1990–2020)
Figure 10 shows the heat density map for the most frequent keywords on solar energy research within 2011–2020 Hottest areas in the map (red–orange–yellow) are indicating high keywords occurrence or hot topics on solar energy research from indexed publications. In this map, “solar energy” as a keyword has been removed for clarity purposes as it is concentrated in the hottest areas in the map. In this map, the 1% most common keywords for solar energy research between 2011 and 2020 are represented. Based on the large number of publications appearing over the last decade (73,042 extracted keywords), the 1% criteria are met by those keywords with a minimum number of occurrences of 51.
As can be observed, the most frequent keywords are related to simulation, photocatalysis, photovoltaics and hydrogen production, as the hottest areas are involving keywords such as system, design, simulation, optimization, models and performance. There are also hot areas around energy conversion involving keywords such as optical-properties and surface, and mild hot area (in yellow) related to thin-fil solar cells, nanocrystals and quantum dots. In the north-east of the map orange areas group keywords such as nanoparticles and nanomaterials. The relevance on photocatalysis, TiO2 and hydrogen production in the east side of the map can also be observed. The lesser relevance of terms related to concentrated solar energy, the ones related appear in the north west side of the diagram with the dominant keywords of heat transfer and thermal energy storage can also be noted. In the vicinity of that region, other related keywords such as parabolic trough collector, receiver, flat-plate and molten salts appear.
Figure 11 represents the 1% most common keywords in solar energy research within the period between 2000 and 2010; based on the lower number of publications, there were extracted 17,537 keywords what reduces the map to 175 keywords that are meeting a minimum number of occurrences of 25. As can be observed, during that period, hot areas are located around keywords such as photovoltaics, performance, models and system. In the west side of the map, hot areas also appear around hydrogen and solar cells. A higher relative relevance in desalination and distillation compared to the period 2011–2020 can also be noted. An incipient relevance of photocatalysis and titanium dioxide based on the orange color can also be observed, but this is located in the outskirts of the map
Figure 12 shows hot areas in solar energy early research during the 1990s. Due to the low number of publications, a reduced number of keywords were extracted (5239), from which the map only represents the 1% most common ones that are meeting a minimum number of 15 appearances.
Based on the fewer keywords, hot areas appear isolated, but a higher relevance on solar-energy conversion topics can be appreciated, as well as in photovoltaics, titanium dioxide and systems. It is also worth mentioning that there is no indication of relevant solar cells technologies, apart from incipient general keywords such as silicon, semiconductors or coatings that appeared in the outskirts of the map.
Figure 13 analyzes the appearance evolution of the 50 most common keywords within solar energy research between 1990 and 2020. In order to do so, the 50th most common keywords of 2020 have been taken and which position they occupied through previous year publications has been discovered. Based on those positions, a score has been given, which can be translated into the heat map of Figure 13, where hot colors indicate higher appearance while cold ones are a lower ranking position. A white color on the map indicates that the keyword was not among the 50th most common of that particular year. Based on this representation, the growing importance among a list of 50 common keywords can be compared. As can be observed, question query “solar energy” appeared as the most common keyword for the whole time period, followed by solar cells, system, photovoltaics, performance, energy, efficiency and design, which have always had a very relevant contribution in solar energy research publications. This map also indicates the growing relevance of some new research topics, such as nanoparticles that have been gaining attention since 2012, although it had appeared in a modest position by 2005. Related topics such as nanofluids and nanosheets appeared after 2016 and have quickly gained attention, and according to the evolution observed, they might keep growing in relevance. A quick growth of graphene keywords within solar energy research can also be observed, which in a couple of years, passed from an incipient contribution to appear as one of the most common keywords during within 2018–2020. It is also worth pointing out that the thermal application of solar energy that is represented in the map as CSP (concentrating solar power) has always shown a lower relevance compared to photovoltaics technologies. However, between 1998 and 2004, desalination publications had a great relevance according to that keyword appearance. It can be noticed that hydrogen-related topics (hydrogen, hydrogen evolution and hydrogen production) had a bigger impact between 2006 and 2014. It can also be inferred from the map that optimization is one of the core topics for future publications attending to the fast growing in related publications over the last few years.
4.2. Recent Trends in Solar Energy Research (2019–2020)
Research trends in Solar Energy research have been analyzed in terms of keywords occurrence for WOS publications in 2019–2020. All metadata from retrieved publications, including full record and cited references were extracted to construct networking map using VOSviewer tool [32]. As can be observed in Table 3, a total number of 30,895 keywords were identified from solar energy publications in 2019–2020. That number decreased to 90% (down to 2,681) for keywords that were appearing at least 5 times and decreased by more than 99% (down to 226) for those keywords appearing 50 times.
Figure 14 shows the networking map for the 200 most common keywords on solar energy research in 2019–2020. According to what was indicated in Table 3, that number of keywords correspond to a minimum occurrence of 100 times. As can be observed in the networking map, each keyword is represented by a node (a bubble), of which the size is an indicator of the node relevance; in this case, the number of occurrences of the keyword. Nodes that appeared together in publications and fulfil the minimum number of occurrences are connected in the map by using links. The line thickness of connected nodes indicates the link strength in terms of how many times both nodes appeared together. For the sake of clarity, networking software groups nodes in larger families known as clusters that represent groups of nodes that commonly appear together in publications.
The use of this bibliometric methodology allows identifying which are the leading thematic areas in the field and to explore their composition and relationship among them [17]. As can be seen, nodes are organized into three different clusters (cluster #1 in red color, cluster #2 green and cluster #3 in blue). Typically, each cluster is dominated by a single keyword. Nodes from a given cluster are connected to other nodes inside the same cluster (stronger bounds) and other nodes from different clusters (weaker bounds). Furthermore, nodes are displayed inside the map following repulsion criteria, which indicates that non-related keywords appear distantly in the map, while very related keywords appear closely. For example, wind energy keyword is located south-east of cluster #2, which indicates that this topic is not that closely related to the rest of nodes in the cluster, nor to the other nodes in the map. However, near to that node appear other keywords such as wind power, renewable energy sources or impacts that are related to that keyword. Common and general keywords to the research field, such as efficiency, performance, energy and solar energy, usually appear in the middle of keyword map, as they are common to all areas, and it can be noticed as well for their larger bubble size. For the sake of clarity and research relevance, only the 200 most common keywords have been represented in Figure 14. However, if a larger set of keywords would have been represented, some gaps and less populated areas of the map would have been covered with new keywords matching the topics of their neighboring nodes.
Table 4 shows the 10 most common keywords for each cluster, the number of appearances of each keyword (node size) in the first place and the relevance of that topic (total link strength) meeting selected criteria in the second place.
Observing keywords and clusters organization, the following pattern on solar energy research in 2019–2020 can be derived. Cluster one (red) is devoted to chemical processes and materials science involving solar energy, as it can be derived from its most common keywords referring to photocatalysis (2nd position in the cluster), nanoparticles (3rd position), hydrogen production (4th position), graphene (7th position), titanium dioxide (9th position) and other keywords in the cluster, such as quantum dots, perovskites or composites. Cluster two (green) is devoted to generation technologies and simulation as it can be derived for common keywords in the cluster, such as system (2nd most common), photovoltaics (3rd position), design (5th position), energy efficiency (6th position), optimization (7th position), renewable energy (8th position) or models (10th position). Other keywords in the cluster, such as CSP (concentrating solar power), CPV (concentrated photovoltaics), power-generation, wind energy or plants are also relevant. Cluster 3 (blue) is devoted to heat and storage, as it can be derived from its most common keywords, referring to desalination (2nd position), phase change materials (3rd position), heat transfer (4th position), thermal energy storage (7th position), thermal performance (8th position) or heat (9th position). However, this is also due to other keywords, such as molten salts or nanofluids.
It is worth mentioning that concentrating solar power (also known as CSP) had a much lower relevance in research publications in 2019–2020 (208 occurrences), compared to photovoltaics (PV) with 950 appearances. Concentrating photovoltaics (CPV) had a much lower impact, with 52 appearances. Among CSP related keywords, parabolic trough collectors were dominant, with 181 occurrences.
4.3. Photovoltaics Solar Cells’ Keywords Publishing Evolution (2000–2020)
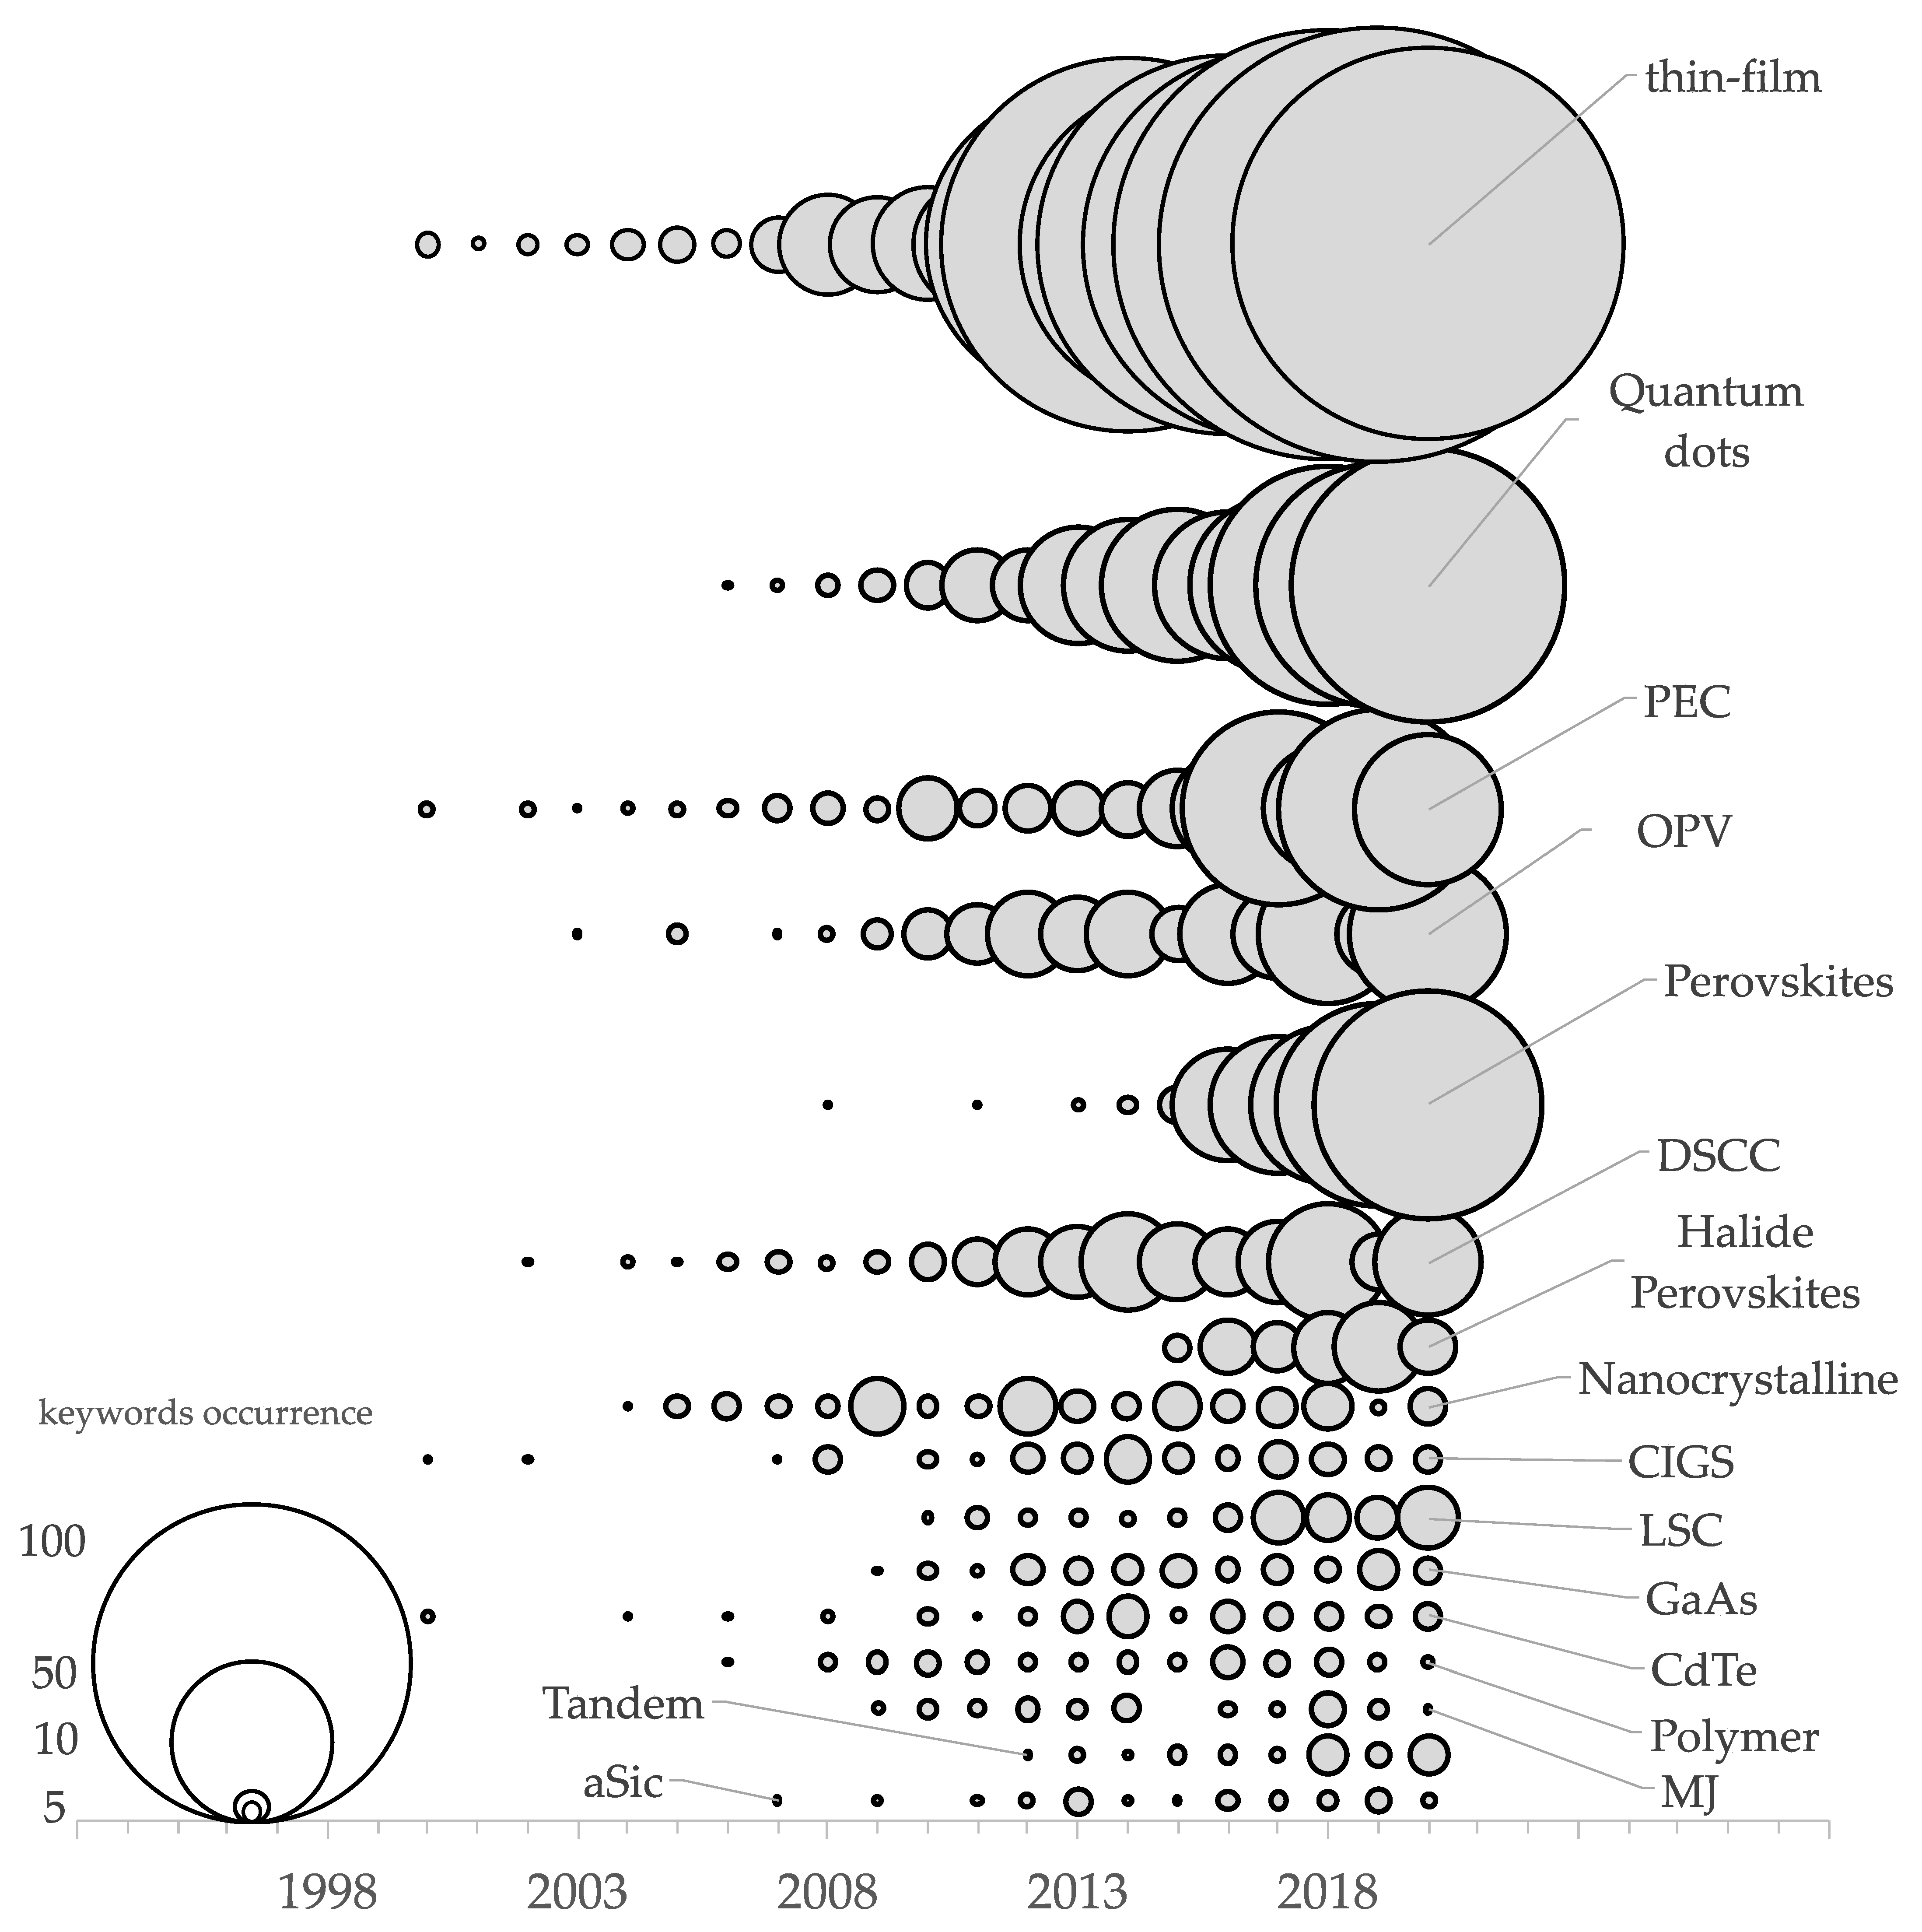
Based on the relevance of photovoltaics topic (most common keyword after solar energy, performance and system), Figure 15 analyzes the appearance evolution of types of solar cells in publications. In particular, cadmium telluride (CdTe), copper indium gallium selenide (CIGS), dye-sensitized solar cells (DSCC), gallium arsenide germanium solar cells (GaAs), luminescent solar concentrator cells (LSC), multi-junction solar cells (MJ), organic photovoltaic solar cells (OPV), photoelectrochemical cells (PEC), perovskites, halide perovskites, quantum dots (QD), thin-film solar cells (TFSC), amorphous silicon (aSi), tandem solar cells, nanocrystalline solar cells and polymer solar cells [36] are represented in the figure.
As can be observed, thin-film was the solar cell technology with higher relevance in indexed publications, with a clear growth since 2013 and a sustained contribution over 100 appearances per year of that term among the publication keywords. Another technology that has exhibited a fast growth within solar energy research was quantum dots since 2018, and perovskites, of which the contribution was marginal before 2015, but in the last couple of years, they have experienced a fast growth. Photoelectrochemical cells (PEC) also experienced a quick growth in publications in 2017 and 2019, but their contribution was reduced in 2020. A continuous growth within organic photovoltaics (OPC) and dye-sensitized solar cells (DSCC) research can also be observed, but it cannot be compared to the burst growth experienced by quantum dots (QD) and perovskites. It can also be observed that before 2008, the appearance of solar cell technology-related keywords was marginal within documents’ titles, abstracts or keywords, which were the metadata available from indexed WOS publications.
5. Conclusions
In this paper, bibliometric tools have been applied to indexed publications on solar energy research that have been published between 1900 and 2020 according to the Web of Science Core Collection database. The main aim of the paper was to identify the recent hottest topics on solar energy research by analyzing extracted data from indexed publications and to serve as a basis for scholars to identify gaps of interest for their research. The main conclusions derived from this paper are as follows:
- There is a growing interest in solar energy research, as 90% of the total number of publications appeared during the last decade, with a total number of 48,738 publications reported since 1900.
- The most common publishing sources for solar energy research were articles in journals with 31,998 documents, which accounted for 63% of total published research followed by conference proceedings with 12,953 documents, which account for 26% of total publications.
- The most productive publishing countries account for more than 73% whole publishing documents for the 1900–2020 period, with the United States, China and India being the most productive ones. This contribution goes up to 83% due to the highest Chinese production over the last couple of years.
- There have been some changes in research categories over the last decades in solar energy publications with more weight of green sustainable science technology in the last year. Energy fuels and materials science multidisciplinary remain as the two main research categories for indexed WOS publications.
- According to keywords extracted from solar energy publications, the recent hottest topics for research were related to optimization and performance studies, integration of renewables, solar cells, photocatalysis and nanoparticles. A growing relevance within thin-film solar cells, quantum dots (QD), photoelectrochemical cells (PEC), organic photovoltaics and a recent burst of perovskites were also observed.
Funding
This research received no external funding.
Conflicts of Interest
The author declares no conflict of interest.
References
- Hall, C.A.S.; Klitgaard, K. Energy and the Wealth of Nations: An Introduction to Biophysical Economics; Springer International Publishing: Berlin/Heidelberg, Germany, 2018; ISBN 9783319662190. [Google Scholar]
- Akhmat, G.; Zaman, K.; Shukui, T.; Sajjad, F. Does energy consumption contribute to climate change? Evidence from major regions of the world. Renew. Sustain. Energy Rev. 2014. [Google Scholar] [CrossRef]
- Carvalho, M.D.G. EU energy and climate change strategy. Energy 2012, 40, 19–22. [Google Scholar] [CrossRef]
- Boto-García, D.; Bucciol, A. Analysis climate change: Personal responsibility and energy saving. Ecol. Econ. 2020, 169. [Google Scholar] [CrossRef] [Green Version]
- Sanchez, D.L.; Sivaram, V. Saving innovative climate and energy research: Four recommendations for Mission Innovation. Energy Res. Soc. Sci. 2017, 29, 123–126. [Google Scholar] [CrossRef]
- Chakravarty, S.; Tavoni, M. Energy poverty alleviation and climate change mitigation: Is there a trade off? Energy Econ. 2013, 40, S67–S73. [Google Scholar] [CrossRef] [Green Version]
- Kalogirou, S.A. Solar Energy Engineering: Processes and Systems, 2nd ed.; Academic Press: Cambridge, MA, USA, 2014; ISBN 978-0-12-397270-5. [Google Scholar]
- International Renewable Energy Agency (IRENA). The Power to Change: Solar and Wind Cost Reduction Potential to 2025; IRENA: Masdar City, Abu Dhabi, 2016; ISBN 9789295111974. [Google Scholar]
- International Renewable Energy Agency (IRENA). Renewable Capacity Statistics 2020; IRENA: Masdar City, Abu Dhabi, 2020; ISBN 978-92-9260-239-0. [Google Scholar]
- International Renewable Energy Agency (IRENA). Renewable Power Generation Costs in 2019; IRENA: Masdar City, Abu Dhabi, 2020; ISBN 978-92-9260-040-2. [Google Scholar]
- REN21. Renewables 2019—Global Status Report; REN21: Paris, France, 2019. [Google Scholar]
- Kuravi, S.; Trahan, J.; Goswami, D.Y.; Rahman, M.M.; Stefanakos, E.K. Thermal energy storage technologies and systems for concentrating solar power plants. Prog. Energy Combust. Sci. 2013, 39, 285–319. [Google Scholar] [CrossRef]
- Rovense, F.; Reyes-Belmonte, M.A.; González-Aguilar, J.; Amelio, M.; Bova, S.; Romero, M. Flexible electricity dispatch for CSP plant using un-fired closed air Brayton cycle with particles based thermal energy storage system. Energy 2019. [Google Scholar] [CrossRef]
- Sengupta, I.N. Bibliometrics, informetrics, scientometrics and librametrics: An overview. Libri 1992, 42, 75–98. [Google Scholar] [CrossRef]
- Porter, A.L.; Kongthon, A.; Lu, J.-C. Research profiling: Improving the literature review. Scientometrics 2002, 53, 351–370. [Google Scholar] [CrossRef]
- Carter, C.R.; Washispack, S. Mapping the path forward for sustainable supply chain management: A review of reviews. J. Bus. Logist. 2018, 39, 242–247. [Google Scholar] [CrossRef]
- Lis, A.; Sudolska, A.; Tomanek, M. Mapping research on sustainable supply-chain management. Sustainability 2020, 12, 3987. [Google Scholar] [CrossRef]
- Wang, L.; Wei, Y.M.; Brown, M.A. Global transition to low-carbon electricity: A bibliometric analysis. Appl. Energy 2017, 205, 57–68. [Google Scholar] [CrossRef]
- Uribe-Toril, J.; Ruiz-Real, J.L.; Milán-García, J.; Valenciano, J.D.P. Energy, economy and environment: A worldwide research update. Energies 2019, 12, 1120. [Google Scholar] [CrossRef] [Green Version]
- Calderón, A.; Barreneche, C.; Hernández-Valle, K.; Galindo, E.; Segarra, M.; Fernández, A.I. Where is Thermal Energy Storage (TES) research going?—A bibliometric analysis. Sol. Energy 2020, 200, 37–50. [Google Scholar] [CrossRef]
- Kikuchi, Y.; Kanematsu, Y.; Sato, R.; Nakagaki, T. Distributed cogeneration of power and heat within an energy management strategy for mitigating fossil fuel consumption. J. Ind. Ecol. 2016, 20, 289–303. [Google Scholar] [CrossRef] [Green Version]
- Hernández-Escobedo, Q.; Perea-Moreno, A.J.; Manzano-Agugliaro, F. Wind energy research in Mexico. Renew. Energy 2018, 123, 719–729. [Google Scholar] [CrossRef]
- Du, H.; Li, N.; Brown, M.A.; Peng, Y.; Shuai, Y. A bibliographic analysis of recent solar energy literatures: The expansion and evolution of a research field. Renew. Energy 2014, 66, 696–706. [Google Scholar] [CrossRef]
- Dong, B.; Xu, G.; Luo, X.; Cai, Y.; Gao, W. A bibliometric analysis of solar power research from 1991 to 2010. Scientometrics 2012, 93, 1101–1117. [Google Scholar] [CrossRef]
- De Paulo, A.F.; Porto, G.S. Solar energy technologies and open innovation: A study based on bibliometric and social network analysis. Energy Policy 2017, 108, 228–238. [Google Scholar] [CrossRef]
- Reyes-Belmonte, M.Á. A bibliometric study on Integrated Solar Combined Cycles (ISCC), trends and future based on data analytics tools. Sustainability 2020, 12, 8217. [Google Scholar] [CrossRef]
- Saikia, K.; Vallès, M.; Fabregat, A.; Saez, R.; Boer, D. A bibliometric analysis of trends in solar cooling technology. Sol. Energy 2020, 199, 100–114. [Google Scholar] [CrossRef]
- David, T.M.; Silva Rocha Rizol, P.M.; Guerreiro Machado, M.A.; Buccieri, G.P. Future research tendencies for solar energy management using a bibliometric analysis, 2000–2019. Heliyon 2020, 6, e04452. [Google Scholar] [CrossRef] [PubMed]
- Aghaei Chadegani, A.; Salehi, H.; Md Yunus, M.M.; Farhadi, H.; Fooladi, M.; Farhadi, M.; Ale Ebrahim, N. A comparison between two main academic literature collections: Web of Science and Scopus databases. Asian Soc. Sci. 2013, 9, 18–26. [Google Scholar] [CrossRef] [Green Version]
- Garfield, E.; Sher, I.H. KeyWords PlusTM—Algorithmic derivative indexing. J. Am. Soc. Inf. Sci. 1993, 44, 298–299. [Google Scholar] [CrossRef]
- Trusted Insights and Analytics. Available online: https://clarivate.com/ (accessed on 7 November 2020).
- Van Eck, N.J.; Waltman, L. Software survey: VOSviewer, a computer program for bibliometric mapping. Scientometrics 2010, 84, 523–538. [Google Scholar] [CrossRef] [Green Version]
- Meho, L.I.; Rogers, Y. Citation counting, citation ranking, and h-index of human-computer interaction researchers: A comparison of Scopus and Web of Science. J. Am. Soc. Inf. Sci. Technol. 2008, 59, 1711–1726. [Google Scholar] [CrossRef] [Green Version]
- Bruce, H.; Fidel, R.; Ingwersen, P.; Vakkari, P. Emerging frameworks and methods: CoLIS 4. In Proceedings of the Fourth International Conference on Conceptions of Library and Information Science, Seattle, WA, USA, 21–25 July 2002. [Google Scholar]
- Wilson, W.E. Radium and solar energy. Nature 1903, 68, 222. [Google Scholar] [CrossRef] [Green Version]
- Mohammad Bagher, A. Types of solar cells and application. Am. J. Opt. Photonics 2015, 3, 94. [Google Scholar] [CrossRef] [Green Version]
Figure 1.
VOSviewer options for bibliometric and networking analysis [26].
Figure 1.
VOSviewer options for bibliometric and networking analysis [26].

Figure 2.
Number of publications evolution on Solar Energy research (between 1900 and 2020).

Figure 3.
Publishing sources on solar energy research (between 1900 and 2020).

Figure 4.
Most productive countries in terms of Solar Energy research between 1900 and 2020 (regions without publications have been omitted).
Figure 4.
Most productive countries in terms of Solar Energy research between 1900 and 2020 (regions without publications have been omitted).

Figure 5.
Most productive countries comparison in terms of source type contribution (between 1900 and 2020).
Figure 5.
Most productive countries comparison in terms of source type contribution (between 1900 and 2020).

Figure 6.
Publications according to WOS research categories for solar energy research (between 1900 and 2020).
Figure 6.
Publications according to WOS research categories for solar energy research (between 1900 and 2020).

Figure 7.
Most productive countries in terms of Solar Energy research in 2019–2020 (regions without publications have been omitted).
Figure 7.
Most productive countries in terms of Solar Energy research in 2019–2020 (regions without publications have been omitted).

Figure 8.
Publishing evolution of the most productive countries (from 1990–2020).

Figure 9.
Publications according to WOS research categories for solar energy research in 2019–2020.

Figure 10.
Hot topics in Solar Energy research in 2011–2020 (1% most common keywords).

Figure 11.
Hot topics in Solar Energy research in 2000–2010 (1% most common keywords).

Figure 12.
Hot topics in Solar Energy research between 1990–1999 (1% most common keywords).

Figure 13.
Evolution of 50 most common keywords of year 2020 within the period 1990–2020.

Figure 14.
The 200 most common keywords network mapping for solar energy research during 2019–2020.

Figure 15.
Publishing evolution on solar cells technologies.


Table 1.
Most productive countries in Solar Energy research (between 1900 and 2020).
| Rank | Country | Number of Publications | % of Publications |
|---|---|---|---|
| 1 | China | 10,624 | 21.8 |
| 2 | United States | 8713 | 17.9 |
| 3 | India | 4395 | 9.0 |
| 4 | Germany | 1950 | 4.0 |
| 5 | United Kingdom | 2211 | 4.5 |
| 6 | Japan | 1758 | 3.6 |
| 7 | Spain | 1683 | 3.5 |
| 8 | Italy | 1654 | 3.4 |
| 9 | Australia | 1471 | 3.0 |
| 10 | France | 1396 | 2.9 |
| accumulated | 35,855 | 73.6 |
Table 2.
Most productive countries in Solar Energy research comparison.
| 2019–2020 | 1900–2018 | ||||
|---|---|---|---|---|---|
| Rank | Country | Number of Publications | % of Publications | Rank | % of Publications |
| 1 | China | 3517 | 34.2 | 2 | 18.5 |
| 2 | United States | 1270 | 12.4 | 1 | 19.4 |
| 3 | India | 1062 | 10.3 | 3 | 8.7 |
| 4 | United Kingdom | 541 | 5.3 | 4 | 4.3 |
| 5 | Iran | 405 | 3.9 | 16 | 1.8 |
| 6 | Australia | 373 | 3.6 | 10 | 2.9 |
| 7 | Spain | 367 | 3.6 | 8 | 3.4 |
| 8 | Germany | 348 | 3.4 | 5 | 4.2 |
| 9 | Turkey | 324 | 3.2 | 12 | 2.6 |
| 10 | Italy | 322 | 3.1 | 7 | 3.5 |
| - | accumulated | 8529 | 83.0 | - | 69.2 |
Table 3.
Number of recent keywords on Solar Energy research (2019–2020).
| Minimum Number of Occurrences | Number of Keywords |
|---|---|
| 1 | 30,895 |
| 5 | 2681 |
| 10 | 1330 |
| 25 | 483 |
| 50 | 221 |
| 100 | 111 |
| 500 | 14 |
Table 4.
Most common keywords from Solar Energy research in 2019–2020.
| Rank | Cluster #1 (Red) | Cluster #2 (Green) | Cluster #3 (Blue) |
|---|---|---|---|
| 1 | Water (793–4264) | Solar energy (2993–11,206) | Performance (1619–7464) |
| 2 | Photocatalysis (589–3128) | System (1109–4693) | Desalination (357–1726) |
| 3 | Nanoparticles (535–2658) | Photovoltaics (950–3460) | PCM (337–1415) |
| 4 | Hydrogen production (521–2766) | Energy (911–4051) | Heat transfer (298–1328) |
| 5 | Energy conversion (456–2199) | Design (817–3652) | Enhancement (255–1345) |
| 6 | Solar cells (393–1408) | Energy efficiency (747–3332) | Nanofluids (240–1251) |
| 7 | Graphene (366–1738) | Optimization (732–3608) | Thermal energy storage (233–1082) |
| 8 | Efficient (363–1845) | Renewable energy (721–2738) | Thermal performance (206–859) |
| 9 | TiO2 (353–1814) | Energy storage (525–2316) | Heat (187–909) |
| 10 | Degradation (323–1741) | Models (498–1875) | Parabolic trough collector (181–909) |
Publisher’s Note: MDPI stays neutral with regard to jurisdictional claims in published maps and institutional affiliations. |
© 2021 by the author. Licensee MDPI, Basel, Switzerland. This article is an open access article distributed under the terms and conditions of the Creative Commons Attribution (CC BY) license (http://creativecommons.org/licenses/by/4.0/).
Share and Cite
MDPI and ACS Style
Reyes-Belmonte, M.A. Quo Vadis Solar Energy Research? Appl. Sci. 2021, 11, 3015. https://doi.org/10.3390/app11073015
AMA Style
Reyes-Belmonte MA. Quo Vadis Solar Energy Research? Applied Sciences. 2021; 11(7):3015. https://doi.org/10.3390/app11073015
Chicago/Turabian StyleReyes-Belmonte, Miguel Angel. 2021. "Quo Vadis Solar Energy Research?" Applied Sciences 11, no. 7: 3015. https://doi.org/10.3390/app11073015
Note that from the first issue of 2016, this journal uses article numbers instead of page numbers. See further details here.