Article

A Serum Metabolomic Signature for the Detection and Grading of Bladder Cancer

1
Department of Medicine, Surgery and Dentistry, Scuola Medica Salernitana, University of Salerno, 84081 Baronissi, Italy
2
Theoreo srl, via Degli Ulivi 3, 84090 Montecorvino Pugliano, Italy
3
Hosmotic srl, via R. Bosco 178, 80069 Vico Equense, Italy
4
Department of Physics, University of Salerno, 84084 Fisciano, Italy
5
Istituto Sistemi Complessi—Consiglio Nazionale delle Ricerche, 80055 Rome, Italy
6
Department of Obstetrics and Gynecology, Section on Maternal-Fetal Medicine University of Tennessee College of Medicine, Chattanooga, TN 37403, USA
7
Department of Biology, Geology and Environmental Sciences, University of Tennessee at Chattanooga, Chattanooga, TN 37403, USA
8
Department of Chemistry and Physics, University of Tennessee at Chattanooga, Chattanooga, TN 37403, USA
9
Department of Urology, University Hospital “San Giovanni di Dio e Ruggi D’Aragona”, 84125 Salerno, Italy
10
Department of general surgery, Unit of Coloproctology, University of Naples “Federico II”, 80138 Naples, Italy
11
Department of Pathology, University Hospital “San Giovanni di Dio e Ruggi D’Aragona”, 84125 Salerno, Italy
*
Author to whom correspondence should be addressed.
These authors equally contributed.
Appl. Sci. 2021, 11(6), 2835; https://doi.org/10.3390/app11062835
Submission received: 19 February 2021 / Revised: 17 March 2021 / Accepted: 19 March 2021 / Published: 22 March 2021
(This article belongs to the Special Issue Towards a Systems Biology Approach)

Abstract

:

Featured Application

Here we describe a serum metabolomics signature of bladder cancer coupled with a robust ensemble machine learning algorithm able to effectively discriminate patients with and without bladder cancer. This signature, if further confirmed and validated on a larger cohort, could represent a reliable screening test for this disease. Moreover, the signature was able to discriminate high- and low-grade cancers. The results represent an important clinical contribution since the prognosis of these conditions strongly depends on early detection and grading.

Abstract

Bladder cancer has a high incidence and is marked by high morbidity and mortality. Early diagnosis is still challenging. The objective of this study was to create a metabolomics-based profile of bladder cancer in order to provide a novel approach for disease screening and stratification. Moreover, the study characterized the metabolic changes associated with the disease. Serum metabolomic profiles were obtained from 149 bladder cancer patients and 81 healthy controls. Different ensemble machine learning models were built in order to: (1) differentiate cancer patients from controls; (2) stratify cancer patients according to grading; (3) stratify patients according to cancer muscle invasiveness. Ensemble machine learning models were able to discriminate well between cancer patients and controls, between high grade (G3) and low grade (G1-2) cancers and between different degrees of muscle invasivity; ensemble model accuracies were ≥80%. Relevant metabolites, selected using the partial least square discriminant analysis (PLS-DA) algorithm, were included in a metabolite-set enrichment analysis, showing perturbations primarily associated with cell glucose metabolism. The metabolomic approach may be useful as a non-invasive screening tool for bladder cancer. Furthermore, metabolic pathway analysis can increase understanding of cancer pathophysiology. Studies conducted on larger cohorts, and including blind trials, are needed to validate results.

1. Introduction

Bladder cancer (BC) was the third most frequent cancer in Europe in 2018 (excluding skin cancers), with an estimated incidence in the same year of about 197,100 new cases and a mortality rate of 3.4% for both sexes. The incidence in men is 3–4 times higher than in women [1]. The highest incidence occurs in people over 60 years old [2]. In addition to age, other risk factors for the development of BC include cigarette smoking, chronic exposure to potential carcinogens (such as industrial chemicals: aromatic amines and nitrosamines), family history of concordant cancers [3,4], pelvic radiation, pharmacological therapy with cyclophosphamide and thiazolidinediones, chronic infections [5] and long-term consumption of arsenic-contaminated or chlorinated water [3,4].
Bladder cancer usually begins in transitional cells belonging to the urothelium, i.e., the inner lining of the bladder. This transitional cell carcinoma (TCC), or urothelial carcinoma, is the most frequent type [6]. Starting from the urothelium, the cancer can spread into the bladder wall and reach adjacent tissues and organs [7]. Based on the degree of invasion, BC is classified into NMIC (non-muscle-invasive cancer) which is confined to the mucosa and lamina propria of the bladder, and therefore does not invade the muscle (stages Tis, Ta, T1) and MIC (muscle-invasive cancer) which extends into the muscle (stage T2), into the perivescical fat layer (stage T3), adjacent tissues (stage T4), or ultimately metastasize to distant organs (stage M1) [6]. BC can also be classified according to the cellular morphology and differentiation: well-differentiated (G1), moderately differentiated (G2) and poorly differentiated (G3) tumor. Tumor grade is an important factor that can affect prognosis and treatment options because G1 and G2 (classified as low-grade tumors) show better prognosis and are less likely to become invasive, while G3 (high grade tumors) are more aggressive [6]. In most patients with BC (approximately 85%), the initial symptom of the disease is hematuria which is usually intermittent and painless. In a lower percentage of cases (approximately 20%), the symptomatology consists of bladder irritability: urination frequency, urgency, and dysuria [5]. In patients with more advanced stages, other symptoms may be flank pain secondary to lymphadenopathy, ureter obstruction, and less specific symptoms such as weight loss, fatigue, and anorexia [8]. About 80% of newly diagnosed cases are classified as NMIC. Compared to MIC, these tumors have a better prognosis and consequently a significantly higher 5-year survival rate (~90% for NMIC and <50% for MIC) [3,8]. However, patients with NMIC require a lifetime of follow-up by cystoscopy because the recurrence rate is very high. Approximately 50–70% of NMICs recur during the first two years after diagnosis with a 10–20% risk to progress invasively within 5 years [3,9]. Prognosis and treatment of BC depend on various factors such as: stage, grade, number and size of tumor(s), whether this is an initial tumor or a recurrence, patient age, and general health conditions. Generally, NMICs are treated locally by transurethral resection (TUR), often accompanied by intravesical therapy with chemotherapeutic agents or immunotherapy [9]. However, patients with MIC need a radical cystectomy, generally followed by fairly aggressive systemic therapies [10]. Nevertheless, the 5-year survival rate for MIC remains about 50–70% [10,11]. Biochemical differences between MIC and NMIC as well as among MICs, are hard to describe due to significant heterogeneity. Despite abundant studies describing these differences, it was not until 2020 that a molecular classification, based on transcriptomics profiling for MIC was proposed [12]. Herein, we report the results of a metabolomics-based profiling of bladder cancer to elucidate the metabolic changes generated by bladder cancer, stratifying the disease by stage and grade. We describe a potential non-invasive approach for BC screening and stratification.

2. Materials and Methods

2.1. Population and Study Design

A prospective, nested case-control, pilot study was conducted from June 2014 to May 2016 on a cohort of 230 subjects enrolled at the Department of Medicine “Scuola Medica Salernitana” of the University of Salerno. Patients undergoing Trans Urethral Resection of the Bladder (TURB) or cystoscopy with a histological evaluation of bladder tissue were enrolled in the study. One hundred and forty-nine patients were confirmed to be affected by BC. On the contrary, 81 subjects, for whom the histological evaluation excluded a diagnosis of BC, were considered as healthy controls.
Three different two-class ensemble machine learning (EML) models were built: one to discriminate all BC vs. controls (Model I), the second (Model II) to discriminate bladder cancer grade, i.e., high-grade (G3) (BCH) and low-grade (G1-G2) (BCL), the third to discriminate cancer muscle invasiveness (MIC vs. NMIC).
The study was approved by the ethics committee IBD “Azienda Ospedaliera Universitaria San Giovanni di Dio e Ruggi D’Aragona” (IRB No. 775-06/08/2014) and each participant signed an informed consent to indicate their acceptance to the study rules.

2.2. Data and Sample Collection

Demographic, anamnestic, and clinical characteristics were collected at enrollment for each patient included in the study and recorded on a dedicated database. Smoking habits were also recorded; subjects reporting a past smoking habit were considered as smokers. Subjects with oncological disease not related to the bladder, as well as subjects with infectious disease and/or liver or kidney failure, were excluded.
Ten milliliters of blood samples were collected before any surgical and/or pharmacological treatment by means of a red capped Vacutainer® tube. After clotting and centrifuging at 2500 rpm for 15 min, serum was collected and stored at −80 °C until metabolomic analysis.

2.3. Histopathological Analysis

Archival material of all the tumors in the present series were retrieved from the files of our institution. The H&E-stained sections of all cases were reviewed and the diagnoses were confirmed by two pathologists (ADA, AC). Where required, additional immunohistochemical studies were performed on additional 4-μm-thick sections following standard protocols [13].

2.4. Metabolome Analysis by GC-MS

Serum metabolites were extracted, purified, and derivatized using the MetaboPrep GC kit (Theoreo srl, Montecorvino Pugliano, Italy) as reported in Troisi et al. [14,15,16,17,18], prior to GC-MS analysis. Briefly, 50 µL of serum were pipetted into a microcentrifuge tube containing the extraction solution and the internal standard (2-isopropyl malic acid). The tubes were vortexed at 1250 rpm for 30 min; the solution was then centrifuged for 5 min at 16,000 rpm at 4 °C; 200 µL of resultant supernatant was transferred to a separate microcentrifuge tube containing a purification solution and subsequently vortexed at 1250 rpm for 30 s and then centrifuged for 5 min at 16,000 rpm at 4 °C. The supernatant (175 µL) was then transferred into a glass vial and frozen at −80 °C prior to being freeze-dried overnight. Derivatization of the metabolites in the freeze-dried samples was conducted in two steps: first 50 μL of methoxylamine hydrochloride in pyridine was added and vortexed at 1200 rpm for 90 min; secondly, 25 µL of the derivatization solution containing N,O-Bis(trimethylsilyl)trifluoroacetamide (BSTFA) and trimethylchlorosilane (TMCS) was added and the vials were vortexed again at 1200 rpm for another 90 min. The derivatized metabolites (75 µL) were transferred to a 100 µL vial insert to facilitate auto-sampler injection. Vials were centrifuged for 5 min at 16,000 rpm at 4 °C, before injection into GC-MS.
Two µL of derivatized samples was injected into the GCMS-2010SE (Shimadzu Corp., Kyoto, Japan). Chromatographic separation was achieved with helium as carrier gas flowing through a 30 m × 0.25 mm CP-Sil 8 CB fused silica capillary GC column with 1.00 µm film thickness (Agilent, J&W, Santa Clara, CA, USA). The initial oven temperature of 100 °C was held for 1 min and subsequently raised at 6 °C/min to 320 °C and held for 2.33 min. The injector temperature was 280 °C and the MS transfer line was held at 290 °C. The gas flow was set to a constant linear speed of 39 cm/s, and the split flow was set to 1:5. The mass spectrometer operated with electron impact ionization (70 eV) in full scan mode with a range of 35–600 m/z and a scanning speed of 3333 amu/sec and a solvent cut time of 5 min.
Samples were divided in batches, each one made up of 25 samples. Each individual batch was monitored using 4 controls: a solvent blank injection to monitor for carryover, an injection of a standard mix, an injection of a pooled sample solution, and a duplicate injection of a randomly selected sample in the batch. Two µL of hexane was used for the instrument blank, while the analytical standards mix contains a solution of 15 analytes (organic acids, sugars, amino acids, steroids and fatty acids) derivatized in the same way as the unknowns. The pooled sample contained 2 µL of each of 50 randomly selected derivatized unknowns while the duplicated injection was done using a randomly selected sample from the batch.
Each analytical batch was validated only if four conditions were met: the solvent blank did not generate any chromatographic peaks; the peak areas of the 15 analytes in the analytical standard (normalized by the internal standard area) were within 10% of the expected value; the standard deviation of peak area (normalized to the internal standard) for the 100 highest intensity peaks of the repeated injection were ≤15% of the respective signals in the original injection; and, the pooled sample must cluster with all other pooled samples within 5% of the total area using a partial least square discriminant analysis (PLS-DA) model built using all the samples analyzed.
Gas chromatography-mass spectrometry signals consistently found in at least 80% of the samples were considered. Chromatographic peaks that showed poor signal-to-noise ratio (and thus displayed poor mass spectral quality) were unable to be confidently identified and were not considered in the classification models. Mass spectral peak identification was performed setting the linear index difference max tolerance to 50 and the minimum matching for NIST library search to 85%. For statistical analysis, results were saved in a comma separated values file (.csv) and loaded into dedicated software.

2.5. Statistical Analysis

Clinical and anamnestic data distribution were analyzed using the Shapiro-Wilks test. Age was not-normally distributed. After several failed attempts to normalize the data, the p-value was determined using the Mann Whitney test. Percentages were compared using the χ2-test, an α-value of 0.05 was considered statistically significant. For bioinformatic metabolite analysis, the chromatographic data were collected in a table with one sample per row and one variable (metabolite) per column (dataset). Metabolite peak areas (normalized to internal standard) were log base-10 transformed followed by data scaling using the autoscaling process (mean-centered and divided by standard deviation of each variable).

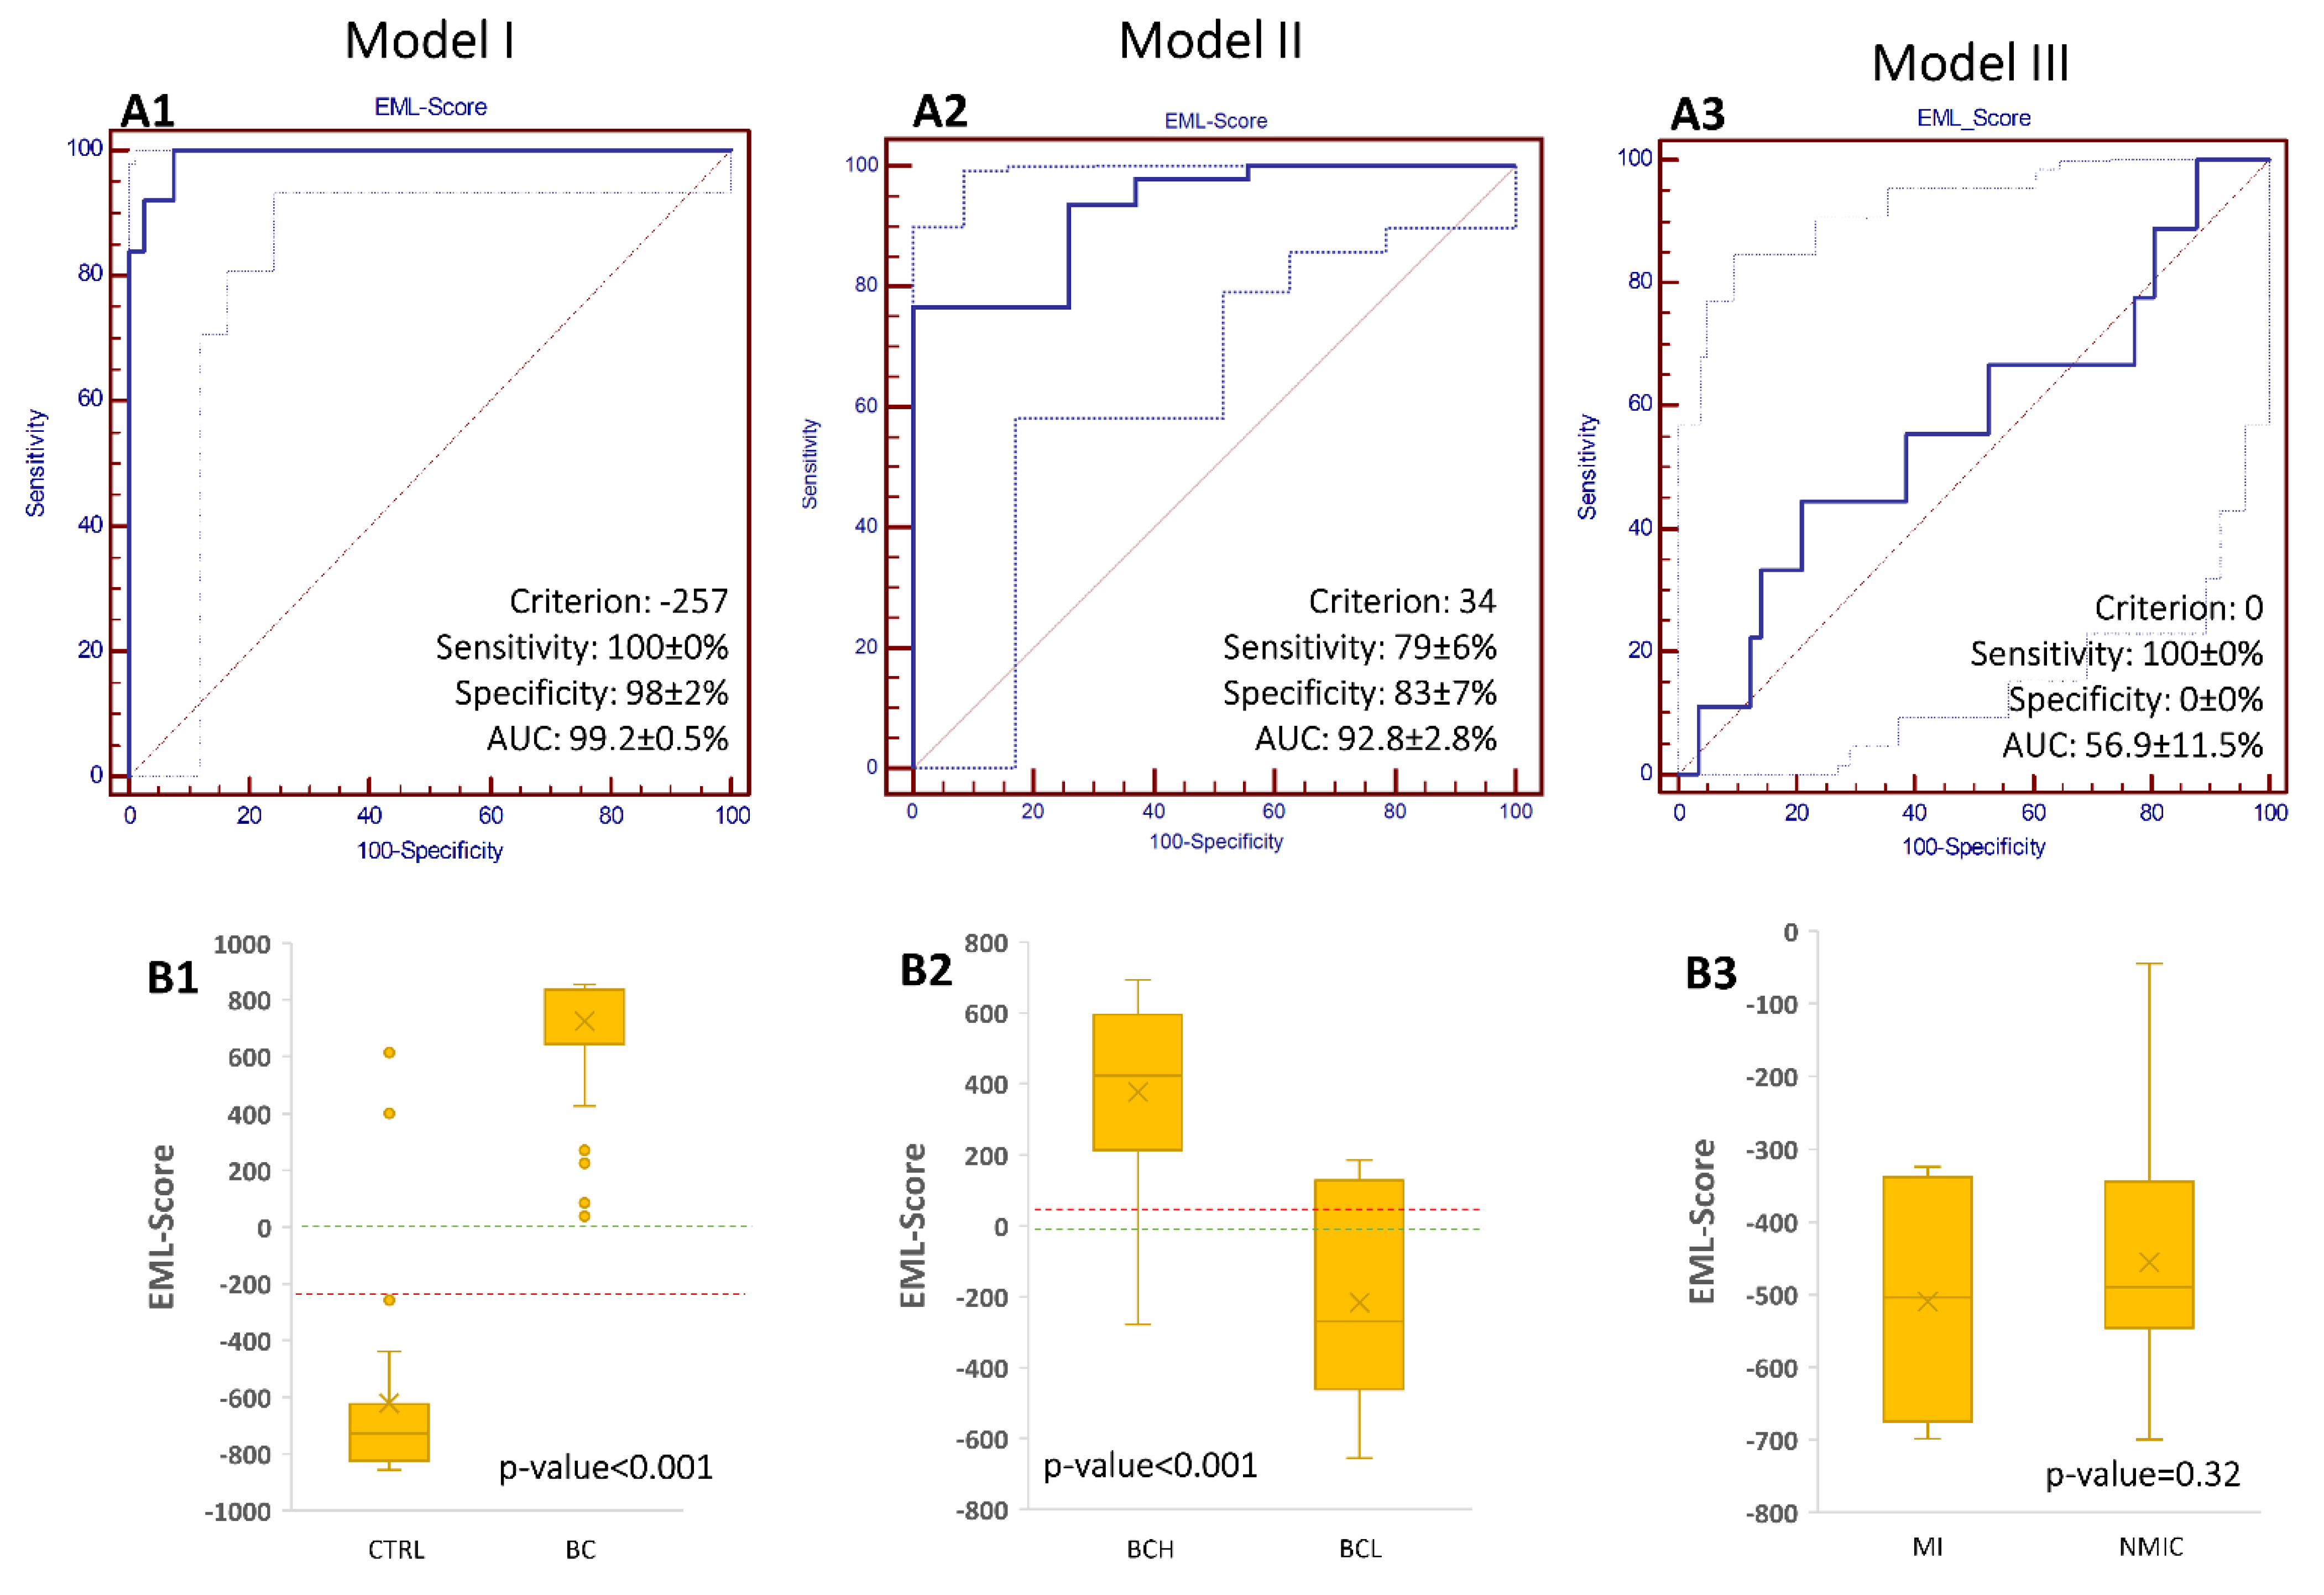
2.5.1. Classification Models

The transformed and scaled dataset containing the metabolomics results was randomly divided into two equal parts, using computer assisted randomization, such that each subset contained the same number of cases and controls. One set was used to train a given classification model and the other was used to evaluate the diagnostic performance of each model. Nine different classification models were built and optimized using the training dataset containing observations where class membership (e.g., case or control) was known a priori: Partial Least Square Discriminant Analysis (PLS-DA), Naive Bayes (NB), Decision Tree (DT), Random Forest (RF), k-nearest neighbor (k-NN), Artificial Neural Network (aNN), Support Vector Machine (SVM), Logistic Regression (LR), and Deep Learning (DL). Models were built according to Troisi et al. [14].
Next, the classification models were ensembled using a voting scheme weighted by the classification accuracy of each model. Ensemble learning algorithms were used to generate a set of classifiers that assigned a weighted vote of each model’s predictions. Ensembling of all models was performed using RapidMiner Studio version 9.4 (RapidMiner, Boston, MA, USA) while PLS-DA and the voting scheme was conducted using R (version 3.5.3) [19] and subsequently integrated in the data mining algorithm.
Class imbalance was managed by means of Metacost algorithm [20] according to Troisi et al. [16]. Metacost introduced a misclassification cost matrix coherent with the class size.

2.5.2. Ensemble Machine Learning Score (EML-Score)

For each classification model, the cross-validation accuracy was evaluated. For each sample and for each classification model, if possible, the classification confidence was also evaluated in terms of sample vs. centroid class distance. This criterion was also used to weight each sample assignment. From these parameters a model score was calculated by multiplying the classification accuracy by the classification distance compared to centroid. For the subjects classified as BC for model I, BCH for model II, and MIC for model III (the most clinically severe conditions), those scores were not transformed, while for each CTRL, BCL, and NMIC classification, those scores were multiplied by -1. Finally, an EML-score was calculated for each sample by summing all the individual classification model scores. An EML-score = 0 was considered as a cut-off value to account for situations in which the votes for and against a specific class assignment were equal. Furthermore, cut-off values were evaluated as the scores maximizing the Youden’s Index (sensitivity + specificity-1). Area under receiver operating characteristic curves (AUCROC) were calculated using these cut-off values.

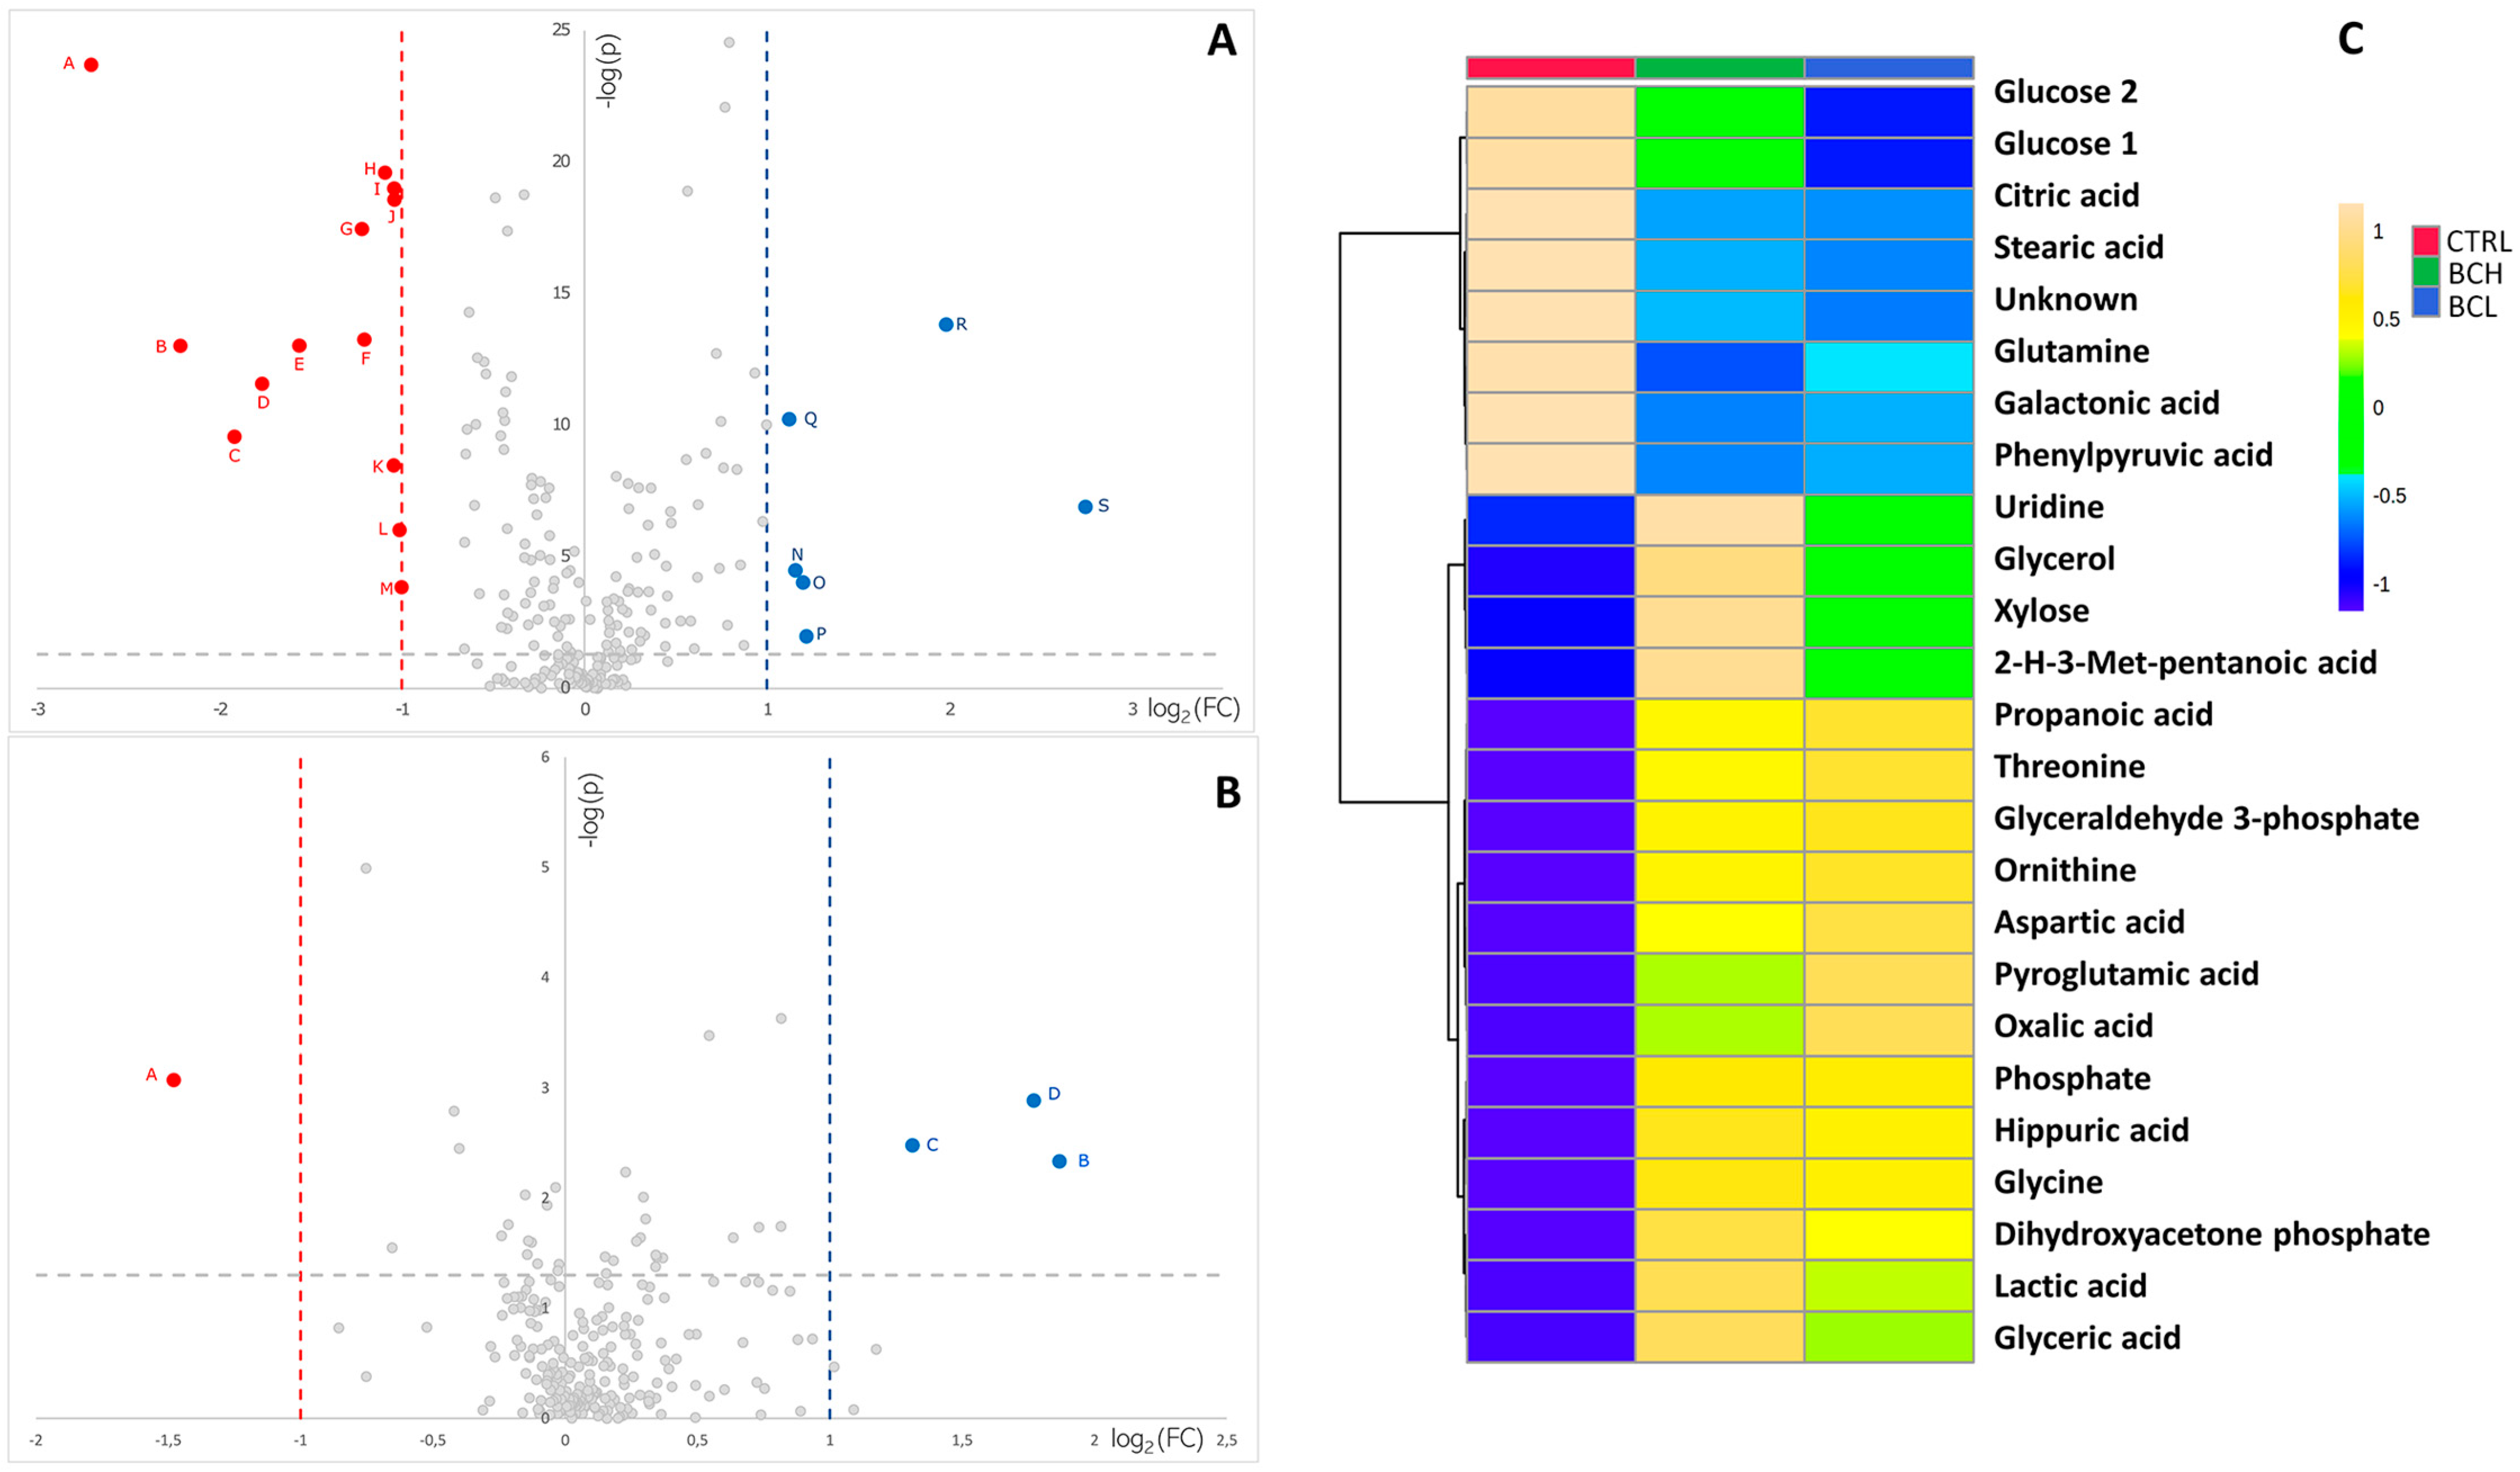
2.6. Relevant Metabolites

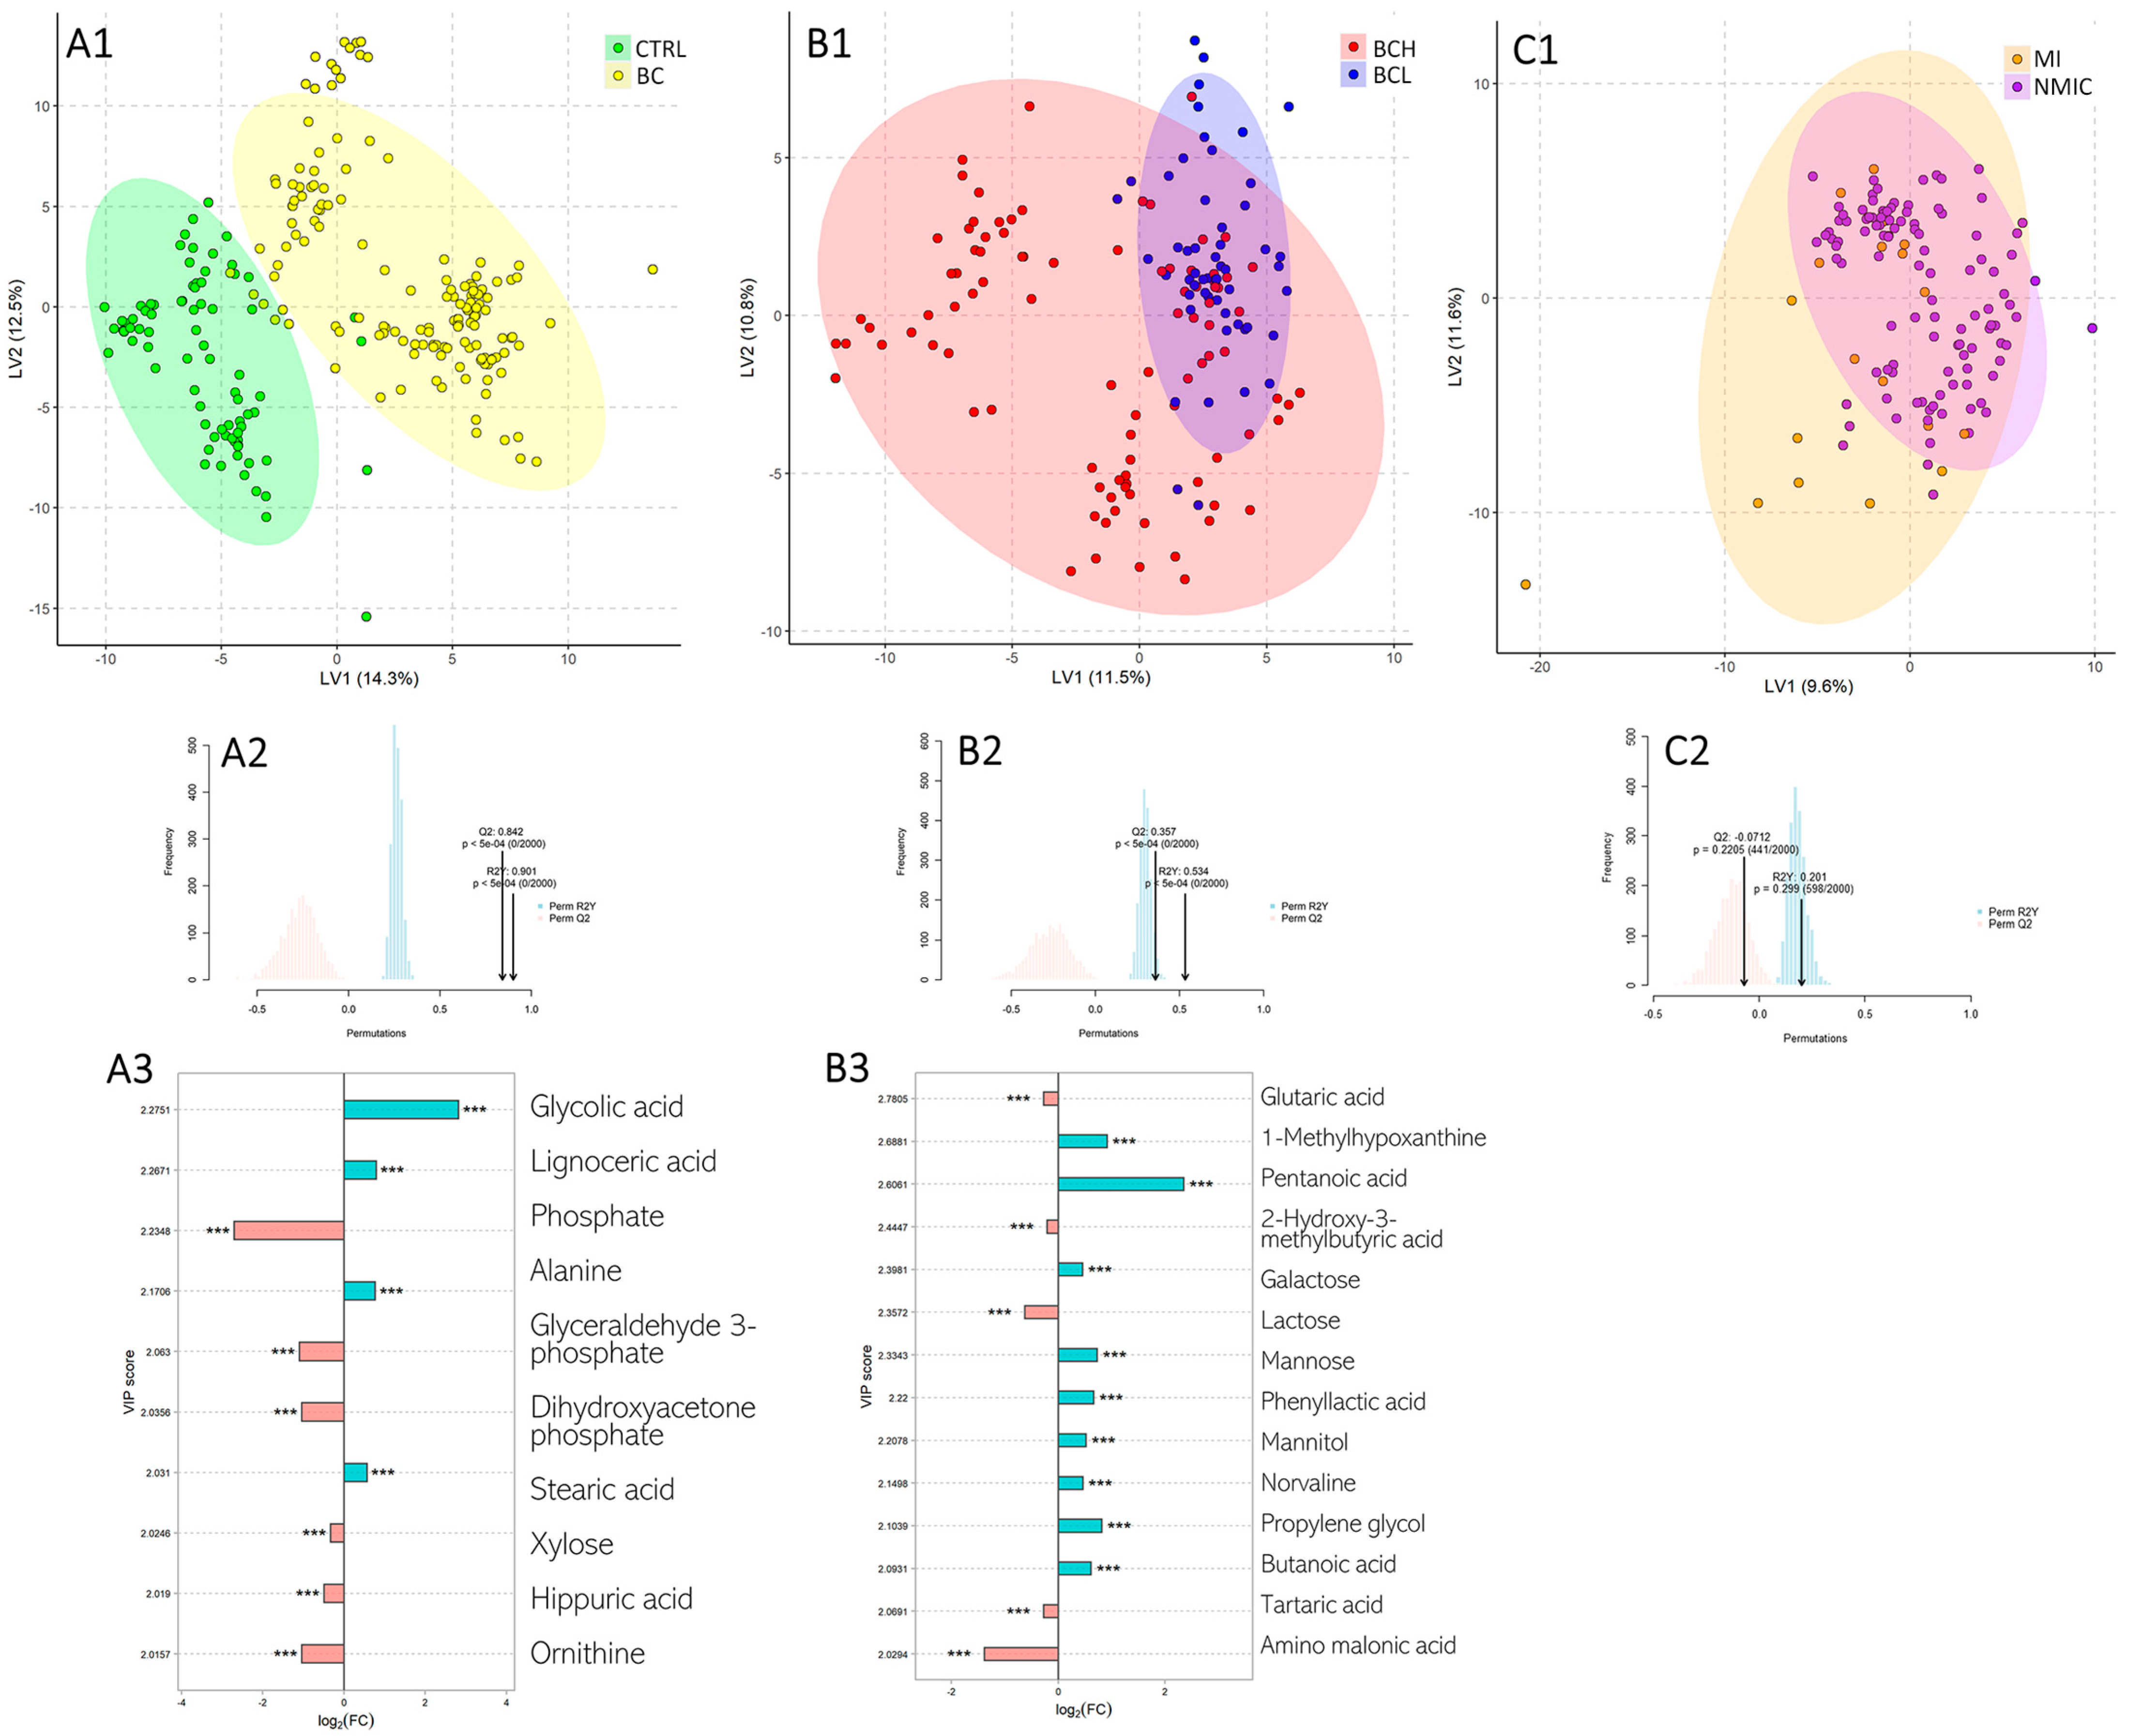
2.6.1. Variables Important in Projection (VIP)

PLS-DA models were also used to achieve a graphical representation of class separations. To investigate each metabolite’s relevance in class separation we used the variable importance in projection (VIP) scores that were calculated for each metabolite included in the PLS-DA model as a weighted sum of squares of PLS loadings, considering the amount of explained Y-variations in each dimension. The weights depended on the reduction of the sums of squares across the number of PLS components. The overall coefficient-based importance was calculated based on the average of the metabolite’s coefficients. A VIP-score cut-off ≥ 2.0 was chosen to select the metabolites that are most relevant for class separation. The statistical significance of class discrimination determined by PLS-DA was evaluated by a permutation test performed by randomly replacing the class label 2000 times [21]. Leave-p-out-cross-validation accuracy (with p = 7) was also used to investigate the model over-fitting [22].

2.6.2. Volcano Plot

Differences in metabolite peak areas between two conditions were also investigated by means of a volcano plot, obtained by plotting the negative log of the p-value on the y axis and the log2 of the fold change (FC) between the two conditions on the x axis. Thus, data points with low p-values (highly significant) appear toward the top of the plot and data points with higher FC values at the margins of the plot. The log2 of the FC was used so that changes in both directions appear equidistant from the center. Plotting points in this way resulted in two regions of interest on the plot: those points that are found toward the top that are also far to either the left- or right-hand sides. These represent values that display large magnitude FCs (hence being left or right of center) with the difference showing high statistical significance (hence being toward the top).
For each relevant metabolite (either VIP-score >2.0 or in one of the two relevant volcano plot zones), the Human Metabolome Database (HMDB) ID number was determined [23]. The metabolic pathways associated with these metabolites were analyzed using the MetScape application [24].

2.6.3. Genetic Algorithm

Metabolites were also evaluated in terms of their global ability to participate in the model training using a genetic algorithm (GA) approach according to Troisi et al. [25]. This algorithm mimics Darwinian forces of natural selection to optimize values of a function [26]. An initial set of potential metabolites was considered, and their corresponding classification performance using each of the 9 investigated classification models (called “fitness”) was calculated. According to the evolutive analogy, each solution represents an individual and the body of individuals could be considered as a population. The metabolite sets (individuals) which showed the best fitness values were randomly combined producing new generations. Combinations of individuals were subjected to crossover and random mutations. The process was repeated producing several new generations, subsequently achieving better performance with each generation. GA was built using RapidMiner version 9.4. GA-selected metabolites were represented by heatmap clustering the metabolites on the basis of their Minkowski distance using a Ward hierarchical approach [27].

3. Results

Results were obtained by analyzing serum samples from 230 subjects. Age and sex distribution was not statistically different between the three studied classes (healthy subjects [CTRL], high-grade [BCH], and low-grade [BCL] bladder cancer patients). On the contrary, current or past cigarette smoking was more frequent in bladder cancer (BCH and BCL) patients compared to controls. Moreover, muscle invasive cancer was correlated with more frequent high-grade cancer compared to low grade. The characteristics of the three classes of subjects are summarized in Table 1.
Statistical analysis revealed that 19 metabolites showed a statistically different fold change ≥ ±2 (Figure 1A) in CTRL vs. all BC patients. These metabolites are: phosphate, glycine, diethylene glycol, urea, oxalic acid, pyroglutamic acid, propanoic acid, glyceraldehyde-3-phosphate, dihydroxyacetone phosphate, ornithine, proline, glutamic acid, phenol, valine, phenylalanine, 1-methylhypoxanthine, arachidic acid, glutamine, and creatinine.
Analyzing only BC patients divided into high- and low-grade indicates that only 4 metabolites showed a statistically significant fold change ≥ ±2. These were: amino malonic acid, valine, proline, and pentanoic acid (Figure 1B). Moreover, Figure 1C reports the GA selected metabolites, showing a reduced abundance of glucose, citric, stearic, glutamic and phenylpyruvic acid in BC serum as well as an increased amount of propanoic, oxalic, and lactic acid, glyceraldehyde-3-phosphate, dihydroxyacetone phosphate, ornithine, and glycine (Figure 1C).
The PLS-DA scatter plots showing the graphical representation of the classifications are reported in Figure 2. PLS-DA classification models attempt to discriminate patients based on the presence or absence of BC (Figure 2A1), cancer grading (high [BCH] or low [BCL]) (Figure 2B1) and muscle invasiveness (non-muscle invasive cancer [NMIC] or muscle-invasive cancer [MIC]) (Figure 2C1).
Figure 2 (panels A2, B2, C2, and A3, B3) shows histograms related to the permutation test assessing the models’ significance and the metabolites showing a VIP-score higher than 2.0. According to the permutation test, only CTRL vs. BC and BCH vs. BCL PLS-DA models had a p-value < 0.05, while NMIC vs. MIC model resulted without statistical significance. Fitting the R2 value and its cross-validated homologue Q2 resulted, respectively, in 0.901 and 0.842 for CTRL vs. BC model, 0.534 and 0.357 for BCH vs. BCL model, 0.201 and −0.07 for NMIC vs. MIC model.
CTRL vs. BC classification resulted in 10 VIP signals, (Figure 2A3): glycolic acid, lignoceric acid, phosphate, alanine, glyceraldehyde-3-phosphate, dihydroxyacetone phosphate, stearic acid, xylose, hippuric acid and ornithine. Grading classification (BCH vs. BCL, Figure 2B3) resulted in 14 VIP metabolites: glutaric acid, 1-methylhypoxanthine, pentanoic acid, 2-hydroxy-3-methyl butyric acid, galactose, lactose, mannose, phenyllactic acid, mannitol, norvaline, propylene glycol, butanoic acid, tartaric acid, amino malonic acid. Because the permutation test was not statistically significant in the muscle invasiveness model, no VIP metabolites could be selected. All selected metabolite codes according to the Human Metabolome Data Base (HMDB) are reported in supplementary Table S1.
After sample separation in two equal parts, one was used to train each of 9 classification models and one to test them by evaluating the classification performances. These performances are reported in Table 2.
Model I (CTRL vs. BC) accuracy ranged from 87% to 100%, Model II (BCH vs. BCL) accuracy ranged from 63% to 100%, while model III (NMIC vs. MIC) accuracy ranged from 51% to 100%). ANN, k-NN, LR and DL showed the best accuracies among the individual models while the ensemble models showed 99%, 81% and 84% accuracy for model I, II and III, respectively. Sensitivity and specificity of the first two ensembled models (I and II) were balanced (100% and 99% for model I and 80% and 84% for model II), while ensemble model III showed a lack of specificity.
According to EML-score evaluation, EML-score = 0 was used as cut off to evaluate the diagnostic performance, as reported in Table 2. Moreover, Youden’s evaluations of the best cut off value [28] based on the test data subset were also performed for the three models. Figure 3 reported these cut off values, the ROC curves and the performance in terms of sensitivity, specificity, and accuracy of the EML models based on these cut offs. Again, Model III (NMIC vs. MIC) showed no statistical difference both in terms of ROC curve and in terms of EML-score value between the two classes.
Metabolites selected from the PLS-DA models and volcano plots were also used to perform a metabolite-set enrichment analysis (Figure 4).
Relevant metabolites from model I showed a complex interplay of several metabolic pathways: aminoacyl-tRNA biosynthesis; arginine biosynthesis; glutathione metabolism; nitrogen metabolism; glutamine and glutamate metabolism; alanine, aspartate and glutamate metabolism; phenylalanine metabolism; glyoxylate and dicarboxylate metabolism and arginine and proline metabolism. The full list of involved pathways is reported in supplementary Table S2. Metabolites from model II are relevant to galactose, amino sugar, and nucleotide sugar metabolism. The full pathway list is reported in Table S3.

4. Discussion

Here we report the diagnostic performance of three machine learning ensemble models derived from the statistical comparison of the serum metabolomic fingerprints of subjects with and without BC. Detailed comparison of many hundreds of serum metabolites illustrates biochemical differences in patients on the basis of presence or absence of BC and, among the BC cases, by grade (high grade vs. low grade), showing an accuracy of 99% and 80%, respectively. The same approach was not able to discriminate between patients based on muscle invasiveness of the cancer.
Results presented herein indicate that several serum metabolites and metabolic pathways are associated with BC. Analysis of the network of metabolic pathways that connect molecules, combined with a powerful machine learning algorithm, allows group separation and offers a new method to noninvasively screen for BC, as well as provide new biochemical insights based on the affected metabolomic pathways. The BC metabolome was characterized by lower levels of glucose, citric acid, and glutamine. On the contrary, lactic acid, dihydroxyacetone phosphate and glyceraldehyde 3-phosphate increased in BC patients. The resultant low glucose and high lactic acid due to cancer metabolism has been established since 1920 [29]. The Nobel laureate Otto Warburg was the first researcher who speculated about the advantages of anaerobic glycolysis for cancer due to the higher speed of this metabolism, and the low oxygen availability during rapid cancer growth [30]. Furthermore, relatively recent evidence indicates that bypassing the tricarboxylic acid cycle (TCA) is an efficient strategy for cancer cells which effectively mitigates ROS production and reduces cancer cell apoptosis [31].
Reduction of different glycolytic enzymes have been reported in tumors, including bladder cancer [32,33,34]. This results in unfettered energy production for tumor cells. Many cancer cells are able to subvert the feedback mechanisms that normally allosterically inhibit rate-controlling enzymes in glycolysis. In a normal cell, phosphofructokinase (PFK) is inhibited by ATP, limiting the glycolytic pathway when the cell is rich in energy. In cancer cells, high glucose concentrations increase the synthesis of fructose 2,6-bisphosphate from fructose 6-phosphate by 6-phosphofructo-2-kinase/fructose 2,6-bisphosphatases. Fructose 2,6-bisphosphate can override ATP-mediated PFK inhibition via the Warburg effect, whereby, increased expression of glucose transporters [35] as well as high activity of hexokinase [36] increases the concentration of fructose 2,6-bisphosphate which allosterically activates PFK. In addition, the specific PFK isozymes overexpressed in cancer cells are less sensitive to the ATP inhibition [37]. As a result of this poor ATP sensitivity, both dihydroxyacetone phosphate and 3-phopshoglyceraldeyde were up-regulated as reported in our metabolomics signature (Figure 5). Due to the Warburg effect, glycolysis does not proceed via the TCA, while pyruvate is shunted through lactate production aided by increasing lactate dehydrogenase (LDH) expression. LDH was considered a poor prognostic marker in BC because it reflects both high cytolysis levels and the high shunting rate of pyruvate [38].
These characteristic cancer biochemical pathways are represented by the serum metabolome described herein. Moreover, the elevated levels of phenylpyruvate and phenylacetate we report could be the result of the increased expression of LDH. The high reported levels of lactic acid in our metabolomics signature could also reflect a more sophisticated cancer metabolic pathway. Lactic acid could also affect the T-cells adjacent to the cancer. The activation of these cancer-associated immune cells depends on anaerobic glycolytic metabolism, leading to high production and excretion of lactic acid. The increased extracellular levels of lactic acid contrast that produced by the T-cells, in an against-gradient force [31,39,40] which slows the T-cell activation. Moreover, because lactic acid production increases in many hypoxic conditions, it promotes the IL-8-driven angiogenesis [41]. Neo-angiogenesis supports neoplasm growth by supplying cells with increased nutrients and oxygen.
Another Warburg-related effect illustrated by the BC serum metabolomic signature is the lower glutamine and citric acid levels in BC patients: indeed, it could be considered a “glutamine addiction” [42].
The conversion of pyruvate to lactate by LDH drastically decreases acetyl-CoA production that is crucial in cancer to produce the fatty acids needed to build the new cell membranes. For this reason, the bypass of the TCA is often not complete in many cancer cells. Indeed, pyruvate from glycolysis could enter in a truncated TCA cycle that ends as citrate which is shuttled from the mitochondria to the cytosol (see Figure 5). This is a survival strategy to ensure enough acetyl-CoA for fatty acid synthesis. This truncated TCA cycle results in a build-up of metabolites that need to be countered. In bladder cancer, as well in other cancers, glutamine solves this issue. Glutamine is converted to glutamate and then to a-ketoglutarate, a TCA intermediate [31]. DeBerardinis et al. [43] found, although glucose is the precursor for >90% of secreted lactate in cancer cells, oxidative conversion of glutamine accounts for as much as 40% of TCA cycle intermediates and 30% of the generated energy. This leads to a great glutamine consumption by cancer cells, which could explain the lower glutamine levels found in our BC patients.
Several studies have shown that different methods are able to identify the metabo-lomic profiles of BC from cell lines, tissues, urine or serum [44]. Of these, Zou et al. [45] developed a plasma pseudotargeted metabolomic method based on GC-MS-SIM to study the plasma metabolic profile of BC patients, wherein, they showed alterations in the pentose phosphate pathway (PPP) and nucleotide and fatty acid synthesis.
Loras et al. [46] examined changes in the urinary metabolome of NMIC patients before and after TURBT using liquid chromatography combined with time of flight mass spectrometry, revealing perturbed phenylalanine, arginine, proline, and tryptophan metabolisms as putative biomarkers of recurrence risk.
Urinary metabolic changes of BC patients were also studied using gas chromatography-mass spectrometry by Zhou et al. [47]. Although our study differed by biological matrix, a slightly older population, and no information about genetic background or food habits were reported, a few comparisons are appropriate. Metabolites 2-hydroxy-3-methyl pentanoic, aminomalonic, glyceric, glycolic, hippuric, and lactic acid as well as glycerol, glycine, phosphate, threonine, and xylose showed different mean concentrations in CTRL and BC patients in both studies. Conversely, aspartic, galactonic, glutamic, oxalic, stearic, and tartaric acid as well as creatinine, galactose, lactose, ornithine, phenylalanine, proline, uridine, and valine concentrations were significantly different between our CTRL and BC samples. This difference was not seen in the urinary signature reported by Zhou et al. [47]. Indi Kouznetsova et al. [48], compared urine samples from early stage BC patients versus late-stage BC patients. Alterations in galactose, starch, and sucrose metabolism appeared linked to early-stage, while changes in glycine, serine, threonine, arginine, proline, glycerophospholipid, and galactose metabolism seemed to be present in late-stage BC patients. Using these findings, they developed a machine-learning classification model, able to predict metabolite class with an accuracy of 82.54% and an area under precision-recall curve (PRC) of 0.84 on the training set.
A similar approach was performed by Shao et al. [49], who selected six putative bladder cancer markers by comparing the urinary metabolomic profiles of affected patients versus controls using UPLC-TOF-MS analysis. Basing on metabolomic profiles and the six marker candidates, a machine learning model, decision trees, was built, obtaining an accuracy of 76.60%, a sensitivity of 71.88%, and a specificity of 86.67% from an independent test.
The increased concentrations of phenol, diethylene and propylene glycol here reported in BC patients could be due to a higher exposure to these molecules or the metabolism of related pollutants. Additionally, the smoking habits of our enrolled cohort could, at least partially, explain this result.
Furthermore, the involvement of small chain fatty acids such as butyrate and propionate could be due to microbiome differences between BC and healthy controls [50]. Microbiomes play a key role in cancer development and promotion [51]. Specifically, the effects of the microbiome on the BC metabolome has been reported [52,53,54]. Oresta et al. [52] reported a significant difference in urine microbiota of patients with bladder cancer compared to healthy controls highlighting a dysbiosis involvement in tumor transformation. Moreover, they reported that BCL displayed a reduction in the abundance of Sphingobacteriaceae, Bifidobacteriaceae, and Enterobacteriaceae, while BCH showed decreased Bifidobacterium and Ruminococcus, which are known to protect from inflammation, and increased Corynebacterium, a potential opportunistic bacteria highlighting dysbiosis association with aggressive tumors.
Moreover, norvaline which is a microbial metabolite, produced especially by E. coli in low oxygen environmental [55], a common condition in rapid growth cancer, was found to be elevated in BCH patients.
To date, there are no standard screening evaluations for BC and only symptomatic subjects undergo further investigation, including urine cytology, pelvic ultrasonography, office endoscopic and biopsy [56]. Urine cytology shows high sensitivity (greater than 90%) for BCH, although negative findings do not exclude malignancy. Moreover, renal calculi and urinary tract infections can lead to false-positive results [57].
The reported ensemble classification model for the differentiation of symptomatic (with hematuria) but otherwise healthy patients from BC patients has shown good diagnostic performance. Moreover, the serum metabolic trajectory of investigated BC patients supports a consistent Warburg effect on these cells, aiding researchers investigating glycolysis inhibiting drugs [31].
Ensemble approaches to machine learning in cancer diagnosis were also investigated by Onan [58]. Six ensemble methods were studied (Bagging, Dagging, Ada Boost, Multi Boost, Decorate, and Random Subspace) within 14 ML algorithms for automatic detection of breast cancer using features computed from digitized images of fine needle aspirate (FNA) of a breast mass. Results illustrate that ensemble learning improved the global predictive performance compared to the single classifiers.
Due to the pilot nature of our study, the classification performances of the single and EML models cannot be considered definitive. Both a higher number of enrolled patients and a blind evaluation of BC negative patients are two pivotal steps to fully validate the proposed metabolomics signature and bioinformatic method. On this premise, the EML we propose could represent a strength of our study because it is a reliable, accurate, and specific alternative to single classification models for dealing with dataset dimension variations and class imbalances [59]. Furthermore, EML can efficiently be implemented in high-performance computer architectures such as parallel and multithreaded computers [60].
Compared to other methods of BC screening, our serum metabolome approach has great potential because of the non-invasiveness and demonstrated accuracy. Limitations of the study include the small sample size and the known diagnosis of all subjects (which was necessary to train and test the accuracy of our models). Larger, blind validation studies should be performed to confirm our preliminary data.

5. Conclusions

Our pilot study has identified a complex network of serum metabolites that significantly correlate with the presence of bladder cancer. This signature seems to be strictly related to the Warburg effect and demonstrates good performance to identify patients with BC and to differentiate between high- and low-grade cancers. Larger studies, including clinical double-blinded trials, and screening of the healthy population, are needed to confirm our preliminary results.

Supplementary Materials

The following are available online at https://www.mdpi.com/2076-3417/11/6/2835/s1. Table S1: Metabolite selected as relevant from VIP-score criterion (>2.0) volcano plot (FC > 1 or <−1 and p-value <0.05) and Genetic algorithm in both Models I and II. Table S2: Metabolite-set Enrichment Pathways analysis results derived from the metabolites selected by VIP-score and Volcano plot in CTRL vs. KB comparison (Model I). Table S3: Metabolite-set Enrichment Pathways analysis results derived from the metabolites selected by VIP-score and Volcano plot in KBL vs. KBH comparison (Model II).

Author Contributions

Conceptualization, J.T., A.C. (Angelo Colucci), G.S. (Giovanni Scala) and V.A.; methodology, S.R. S.S. G.S. (Gianmarco Silvestre); formal analysis, P.C., J.T. and A.C. (Angelo Colucci); investigation, A.C. (Angelo Colucci), F.M. (Francesco Maiorino), M.F., F.M. (Federica Mastella), A.C. (Alfonso Califano), G.S. (Giammarco Silvestre), A.C. (Alessandro Caputo) and A.D.; resources, J.T. and G.S. (Giovanni Scala); data curation, J.T., P.C., S.R. and S.S.; writing—original draft preparation, J.T., A.L.; writing—review and editing, V.A., P.C., S.R. and S.S.; visualization, J.T. and A.L.; supervision, V.A., A.D. and A.C. (Angelo Colucci); project administration, G.S. (Giovanni Scala); funding acquisition, G.S. (Giovanni Scala). All authors have read and agreed to the published version of the manuscript.

Funding

This project was funded by POR Campania FESR 2014/2020—Project “Campania Oncoterapie” grant n. B61G18000470007.

Institutional Review Board Statement

The study was conducted according to the guidelines of the Declaration of Helsinki, and approved by the Institutional Review Board of Azienda Ospedaliera Universitaria San Giovanni di Dio e Ruggi D’Aragona (protocol code 775, 6 August 2014).

Informed Consent Statement

Informed consent was obtained from all subjects involved in the study.

Data Availability Statement

The data that support the findings of this study are available from the corresponding author, upon reasonable request.

Conflicts of Interest

J.T. and G.S. (Giovanni Scala) are employed in companies (Theoreo Srl and Hosmotic Srl, respectively) dealing with the development and market of diagnostic tests based on the metabolomics. All the other authors have no conflict of interest.

References

  1. Ferlay, J.; Colombet, M.; Soerjomataram, I.; Dyba, T.; Randi, G.; Bettio, M.; Gavin, A.; Visser, O.; Bray, F. Cancer Incidence and Mortality Patterns in Europe: Estimates for 40 Countries and 25 Major Cancers in 2018. Eur. J. Cancer 2018, 103, 356–387. [Google Scholar] [CrossRef]
  2. Bladder Cancer: Diagnosis and Management of Bladder Cancer. BJU Int. 2017, 120, 755–765. [CrossRef] [Green Version]
  3. Burger, M.; Catto, J.W.F.; Dalbagni, G.; Grossman, H.B.; Herr, H.; Karakiewicz, P.; Kassouf, W.; Kiemeney, L.A.; La Vecchia, C.; Shariat, S.; et al. Epidemiology and Risk Factors of Urothelial Bladder Cancer. Eur. Urol. 2013, 63, 234–241. [Google Scholar] [CrossRef]
  4. Daneshmand, S. Epidemiology and Risk Factors of Urothelial (Transitional Cell) Carcinoma of the Bladder. UpToDate. 2016. Available online: http://www.uptodate.com/contents/epidemiology-and-risk-factors-of-urothelial-transitional-cell-carcinoma-of-the-bladder (accessed on 6 July 2017).
  5. Abraham, J.; Gulley, J.L.; Allegra, C.J. The Bethesda Handbook of Clinical Oncology; Lippincott Williams & Wilkins: Philadelphia, PA, USA, 2012. [Google Scholar]
  6. Redondo-Gonzalez, E.; de Castro, L.N.; Moreno-Sierra, J.; Maestro de las Casas, M.L.; Vera-Gonzalez, V.; Ferrari, D.G.; Corchado, J.M. Bladder Carcinoma Data with Clinical Risk Factors and Molecular Markers: A Cluster Analysis. BioMed Res. Int. 2015, 2015, 1–14. [Google Scholar] [CrossRef] [PubMed] [Green Version]
  7. El Mohsen, M.; Shelbaia, A.; El, S.G. Sequential Chemoimmunotherapy Using Mitomycin Followed by Bacillus Calmette-Guerin (MCC+ BCG) versus Single-Agent Immunotherapy (BCG) for Recurrent Superficial Bladder Tumors. UroToday Int. J. 2010, 3. [Google Scholar] [CrossRef]
  8. Park, J.C.; Citrin, D.E.; Agarwal, P.K.; Apolo, A.B. Multimodal Management of Muscle Invasive Bladder Cancer. Curr. Probl. Cancer 2014, 38, 80–108. [Google Scholar] [CrossRef] [Green Version]
  9. Yokomizo, A.; Kanimoto, Y.; Okamura, T.; Ozono, S.; Koga, H.; Iwamura, M.; Tanaka, H.; Takahashi, S.; Tsushima, T.; Kanayama, H.; et al. Randomized Controlled Study of the Efficacy, Safety and Quality of Life with Low Dose Bacillus Calmette-Guérin Instillation Therapy for Nonmuscle Invasive Bladder Cancer. J. Urol. 2016, 195, 41–46. [Google Scholar] [CrossRef]
  10. Stein, J.P.; Lieskovsky, G.; Cote, R.; Groshen, S.; Feng, A.-C.; Boyd, S.; Skinner, E.; Bochner, B.; Thangathurai, D.; Mikhail, M.; et al. Radical Cystectomy in the Treatment of Invasive Bladder Cancer: Long-Term Results in 1054 Patients. J. Clin. Oncol. 2001, 19, 666–675. [Google Scholar] [CrossRef] [PubMed]
  11. Grossman, H.B.; Natale, R.B.; Tangen, C.M.; Speights, V.O.; Vogelzang, N.J.; Trump, D.L.; deVere White, R.W.; Sarosdy, M.F.; Wood, D.P., Jr.; Raghavan, D. Neoadjuvant Chemotherapy plus Cystectomy Compared with Cystectomy Alone for Locally Advanced Bladder Cancer. N. Engl. J. Med. 2003, 349, 859–866. [Google Scholar] [CrossRef] [PubMed]
  12. Kamoun, A.; de Reyniès, A.; Allory, Y.; Sjödahl, G.; Robertson, A.G.; Seiler, R.; Hoadley, K.A.; Groeneveld, C.S.; Al-Ahmadie, H.; Choi, W.; et al. A Consensus Molecular Classification of Muscle-Invasive Bladder Cancer. Eur. Urol. 2020, 77, 420–433. [Google Scholar] [CrossRef] [PubMed]
  13. Caputo, A.; D’Antonio, A.; Memoli, D.; Sabbatino, F.; Altieri, V.; Zeppa, P. Ki67 in Gleason Pattern 3 as a Marker of the Presence of Higher-Grade Prostate Cancer. Appl. Immunohistochem. Mol. Morphol. 2021, 29, 112–117. [Google Scholar] [CrossRef]
  14. Troisi, J.; Sarno, L.; Landolfi, A.; Scala, G.; Martinelli, P.; Venturella, R.; Di Cello, A.; Zullo, F.; Guida, M. Metabolomic Signature of Endometrial Cancer. J. Proteome Res. 2018, 17, 804–812. [Google Scholar] [CrossRef] [PubMed]
  15. Troisi, J.; Sarno, L.; Martinelli, P.; Di Carlo, C.; Landolfi, A.; Scala, G.; Rinaldi, M.; D’Alessandro, P.; Ciccone, C.; Guida, M. A Metabolomics-Based Approach for Non-Invasive Diagnosis of Chromosomal Anomalies. Metabolomics 2017, 13, 140. [Google Scholar] [CrossRef]
  16. Troisi, J.; Landolfi, A.; Sarno, L.; Richards, S.; Symes, S.; Adair, D.; Ciccone, C.; Scala, G.; Martinelli, P.; Guida, M. A Metabolomics-Based Approach for Non-Invasive Screening of Fetal Central Nervous System Anomalies. Metabolomics 2018, 14, 77. [Google Scholar] [CrossRef]
  17. Troisi, J.; Raffone, A.; Travaglino, A.; Belli, G.; Belli, C.; Anand, S.; Giugliano, L.; Cavallo, P.; Scala, G.; Symes, S.; et al. Development and Validation of a Serum Metabolomic Signature for Endometrial Cancer Screening in Postmenopausal Women. JAMA Netw. Open 2020, 3, e2018327. [Google Scholar] [CrossRef] [PubMed]
  18. Troisi, J.; Cavallo, P.; Richards, S.; Symes, S.; Colucci, A.; Sarno, L.; Landolfi, A.; Scala, G.; Adair, D.; Ciccone, C.; et al. Non-Invasive Screening for Congenital Heart Defects Using a Serum Metabolomics Approach. Prenat. Diagn. 2021. [Google Scholar] [CrossRef] [PubMed]
  19. R Development CORE TEAM, R. R: A Language and Environment for Statistical Computing; R Foundation for Statistical Computing: Vienna, Austria, 2008. [Google Scholar]
  20. Domingos, P. MetaCost: A General Method for Making Classifiers Cost-Sensitive. In Proceedings of the 5th ACM SIGKDD International Conference on Knowledge Discovery and Data Mining, San Diego, CA, USA, 15–18 August 1999; pp. 155–164. [Google Scholar]
  21. Rubingh, C.M.; Bijlsma, S.; Derks, E.P.P.A.; Bobeldijk, I.; Verheij, E.R.; Kochhar, S.; Smilde, A.K. Assessing the Performance of Statistical Validation Tools for Megavariate Metabolomics Data. Metabolomics 2006, 2, 53–61. [Google Scholar] [CrossRef] [Green Version]
  22. Westerhuis, J.A.; Hoefsloot, H.C.J.; Smit, S.; Vis, D.J.; Smilde, A.K.; van Velzen, E.J.J.; van Duijnhoven, J.P.M.; van Dorsten, F.A. Assessment of PLSDA Cross Validation. Metabolomics 2008, 4, 81–89. [Google Scholar] [CrossRef] [Green Version]
  23. Wishart, D.S.; Feunang, Y.D.; Marcu, A.; Guo, A.C.; Liang, K.; Vazquez-Fresno, R.; Sajed, T.; Johnson, D.; Li, C.; Karu, N.; et al. HMDB 4.0: The Human Metabolome Database for 2018. Nucleic Acids Res. 2018, 46, D608–D617. [Google Scholar] [CrossRef] [PubMed]
  24. Karnovsky, A.; Weymouth, T.; Hull, T.; Tarcea, V.G.; Scardoni, G.; Laudanna, C.; Sartor, M.A.; Stringer, K.A.; Jagadish, H.V.; Burant, C.; et al. Metscape 2 Bioinformatics Tool for the Analysis and Visualization of Metabolomics and Gene Expression Data. Bioinformatics 2012, 28, 373–380. [Google Scholar] [CrossRef] [Green Version]
  25. Monteleone, P.; Monteleone, A.M.; Troisi, J.; Dalle Grave, R.; Corrivetti, G.; Calugi, S.; Scala, G.; Patriciello, G.; Zanetti, A.; Maj, M. Metabolomics Signatures of Acutely Ill and Short-Term Weight Recovered Women with Anorexia Nervosa. Mol. Psychiatry 2019. [Google Scholar] [CrossRef] [PubMed]
  26. Mitchell, M. An Introduction to Genetic Algorithms; MIT Press: Cambridge, MA, USA, 1998. [Google Scholar]
  27. Ward, J.H., Jr. Hierarchical Grouping to Optimize an Objective Function. J. Am. Stat. Assoc. 1963, 58, 236–244. [Google Scholar] [CrossRef]
  28. Fluss, R.; Faraggi, D.; Reiser, B. Estimation of the Youden Index and Its Associated Cutoff Point. Biom. J. 2005, 47, 458–472. [Google Scholar] [CrossRef] [Green Version]
  29. Hsu, P.P.; Sabatini, D.M. Cancer Cell Metabolism: Warburg and Beyond. Cell 2008, 134, 703–707. [Google Scholar] [CrossRef] [Green Version]
  30. Warburg, O.H. Über Den Stoffwechsel Der Tumoren: Arbeiten Aus Dem Kaiser Wilhelm-Institut Für Biologie, Berlin-Dahlem; Kaiser-Wilhelm-Institut für Biologie/Julius Springer: Berlin, Germany, 1926. [Google Scholar]
  31. Coller, H.A. Is Cancer a Metabolic Disease? Am. J. Pathol. 2014, 184, 4–17. [Google Scholar] [CrossRef] [Green Version]
  32. Massari, F.; Ciccarese, C.; Santoni, M.; Iacovelli, R.; Mazzucchelli, R.; Piva, F.; Scarpelli, M.; Berardi, R.; Tortora, G.; Lopez-Beltran, A.; et al. Metabolic Phenotype of Bladder Cancer. Cancer Treat. Rev. 2016, 45, 46–57. [Google Scholar] [CrossRef]
  33. Afonso, J.; Santos, L.L.; Longatto-Filho, A.; Baltazar, F. Competitive Glucose Metabolism as a Target to Boost Bladder Cancer Immunotherapy. Nat. Rev. Urol. 2020, 17, 77–106. [Google Scholar] [CrossRef]
  34. Altenberg, B.; Greulich, K.O. Genes of Glycolysis Are Ubiquitously Overexpressed in 24 Cancer Classes. Genomics 2004, 84, 1014–1020. [Google Scholar] [CrossRef]
  35. Medina, R.A.; Owen, G.I. Glucose Transporters: Expression, Regulation and Cancer. Biol. Res. 2002, 35, 9–26. [Google Scholar] [CrossRef] [PubMed]
  36. Marín-Hernández, A.; Rodríguez-Enríquez, S.; Vital-González, P.A.; Flores-Rodríguez, F.L.; Macías-Silva, M.; Sosa-Garrocho, M.; Moreno-Sánchez, R. Determining and Understanding the Control of Glycolysis in Fast-Growth Tumor Cells. FEBS J. 2006, 273, 1975–1988. [Google Scholar] [CrossRef]
  37. Vora, S.; Halper, J.P.; Knowles, D.M. Alterations in the Activity and Isozymic Profile off Human Phosphofructokinase during Malignant Transformation in Vivo and in Vitro: Transformation- and Progression-Linked Discriminants off Malignancy. Cancer Res. 1985, 45, 2993–3001. [Google Scholar]
  38. Wu, M.; Lin, P.; Xu, L.; Yu, Z.; Chen, Q.; Gu, H.; Liu, C. Prognostic Role of Serum Lactate Dehydrogenase in Patients With Urothelial Carcinoma: A Systematic Review and Meta-Analysis. Front. Oncol. 2020, 10, 677. [Google Scholar] [CrossRef]
  39. Mendler, A.N.; Hu, B.; Prinz, P.U.; Kreutz, M.; Gottfried, E.; Noessner, E. Tumor Lactic Acidosis Suppresses CTL Function by Inhibition of P38 and JNK/c-Jun Activation. Int. J. Cancer 2012, 131, 633–640. [Google Scholar] [CrossRef]
  40. Fischer, K.; Hoffmann, P.; Voelkl, S.; Meidenbauer, N.; Ammer, J.; Edinger, M.; Gottfried, E.; Schwarz, S.; Rothe, G.; Hoves, S.; et al. Inhibitory Effect of Tumor Cell-Derived Lactic Acid on Human T Cells. Blood 2007, 109, 3812–3819. [Google Scholar] [CrossRef] [PubMed]
  41. Végran, F.; Boidot, R.; Michiels, C.; Sonveaux, P.; Feron, O. Lactate Influx through the Endothelial Cell Monocarboxylate Transporter MCT1 Supports an NF-ΚB/IL-8 Pathway That Drives Tumor Angiogenesis. Cancer Res. 2011, 71, 2550–2560. [Google Scholar] [CrossRef] [Green Version]
  42. Wise, D.R.; Thompson, C.B. Glutamine Addiction: A New Therapeutic Target in Cancer. Trends Biochem. Sci. 2010, 35, 427–433. [Google Scholar] [CrossRef] [Green Version]
  43. DeBerardinis, R.J.; Thompson, C.B. Cellular Metabolism and Disease: What Do Metabolic Outliers Teach Us? Cell 2012, 148, 1132–1144. [Google Scholar] [CrossRef] [Green Version]
  44. Amara, C.S.; Vantaku, V.; Lotan, Y.; Putluri, N. Recent Advances in the Metabolomic Study of Bladder Cancer. Expert Rev. Proteom. 2019, 16, 315–324. [Google Scholar] [CrossRef]
  45. Zhou, Y.; Song, R.; Zhang, Z.; Lu, X.; Zeng, Z.; Hu, C.; Liu, X.; Li, Y.; Hou, J.; Sun, Y.; et al. The Development of Plasma Pseudotargeted GC-MS Metabolic Profiling and Its Application in Bladder Cancer. Anal. Bioanal. Chem. 2016, 408, 6741–6749. [Google Scholar] [CrossRef]
  46. Loras, A.; Trassierra, M.; Sanjuan-Herráez, D.; Martínez-Bisbal, M.C.; Castell, J.V.; Quintás, G.; Ruiz-Cerdá, J.L. Bladder Cancer Recurrence Surveillance by Urine Metabolomics Analysis. Sci. Rep. 2018, 8, 9172. [Google Scholar] [CrossRef] [Green Version]
  47. Zhou, Y.; Song, R.; Ma, C.; Zhou, L.; Liu, X.; Yin, P.; Zhang, Z.; Sun, Y.; Xu, C.; Lu, X.; et al. Discovery and Validation of Potential Urinary Biomarkers for Bladder Cancer Diagnosis Using a Pseudotargeted GC-MS Metabolomics Method. Oncotarget 2017, 8, 20719–20728. [Google Scholar] [CrossRef] [PubMed] [Green Version]
  48. Kouznetsova, V.L.; Kim, E.; Romm, E.L.; Zhu, A.; Tsigelny, I.F. Recognition of Early and Late Stages of Bladder Cancer Using Metabolites and Machine Learning. Metabolomics 2019, 15, 94. [Google Scholar] [CrossRef]
  49. Shao, C.-H.; Chen, C.-L.; Lin, J.-Y.; Chen, C.-J.; Fu, S.-H.; Chen, Y.-T.; Chang, Y.-S.; Yu, J.-S.; Tsui, K.-H.; Juo, C.-G.; et al. Metabolite Marker Discovery for the Detection of Bladder Cancer by Comparative Metabolomics. Oncotarget 2017, 8, 38802–38810. [Google Scholar] [CrossRef] [PubMed] [Green Version]
  50. Den Besten, G.; van Eunen, K.; Groen, A.K.; Venema, K.; Reijngoud, D.-J.; Bakker, B.M. The Role of Short-Chain Fatty Acids in the Interplay between Diet, Gut Microbiota, and Host Energy Metabolism. J. Lipid Res. 2013, 54, 2325–2340. [Google Scholar] [CrossRef] [PubMed] [Green Version]
  51. Gunjur, A. Cancer and the Microbiome. Lancet Oncol. 2020, 21, 888. [Google Scholar] [CrossRef]
  52. Oresta, B.; Hurle, R.; Lazzeri, M.; Frego, N.; Saita, A.; Faccani, C.; Fasulo, V.; Casale, P.; Pozzi, C.; Guazzoni, G.F.; et al. Characterization of the Urinary Microbiota in Bladder Cancer Patients. J. Clin. Oncol. 2020, 38, 535. [Google Scholar] [CrossRef]
  53. Cimadamore, A.; Santoni, M.; Massari, F.; Gasparrini, S.; Cheng, L.; Lopez-Beltran, A.; Montironi, R.; Scarpelli, M. Microbiome and Cancers, With Focus on Genitourinary Tumors. Front. Oncol. 2019, 9, 178. [Google Scholar] [CrossRef]
  54. Bučević Popović, V.; Šitum, M.; Chow, C.-E.T.; Chan, L.S.; Roje, B.; Terzić, J. The Urinary Microbiome Associated with Bladder Cancer. Sci. Rep. 2018, 8, 12157. [Google Scholar] [CrossRef] [Green Version]
  55. Soini, J.; Falschlehner, C.; Liedert, C.; Bernhardt, J.; Vuoristo, J.; Neubauer, P. Norvaline Is Accumulated after a Down-Shift of Oxygen in Escherichia Coli W3110. Microb. Cell Factories 2008, 7, 30. [Google Scholar] [CrossRef] [Green Version]
  56. DeGeorge, K.C.; Holt, H.R.; Hodges, S.C. Bladder Cancer: Diagnosis and Treatment. Am. Fam. Physician 2017, 96, 507–514. [Google Scholar]
  57. Witjes, J.A.; Compérat, E.; Cowan, N.C.; De Santis, M.; Gakis, G.; Lebret, T.; Ribal, M.J.; Van der Heijden, A.G.; Sherif, A. EAU Guidelines on Muscle-Invasive and Metastatic Bladder Cancer: Summary of the 2013 Guidelines. Eur. Urol. 2014, 65, 778–792. [Google Scholar] [CrossRef] [PubMed]
  58. Onan, A. On the Performance of Ensemble Learning for Automated Diagnosis of Breast Cancer. In Artificial Intelligence Perspectives and Applications, Proceedings of the 4th Computer Science On-line Conference 2015 (CSOC2015), Online, 27–30 April 2015; Silhavy, R., Senkerik, R., Oplatkova, Z.K., Prokopova, Z., Silhavy, P., Eds.; Springer: Cham, Switzerland, 2015; pp. 119–129. [Google Scholar]
  59. Elrahman, S.M.A.; Abraham, A. A Review of Class Imbalance Problem. J. Netw. Innov. Comput. 2013, 1, 332–340. [Google Scholar]
  60. Wilk, T.; Wozniak, M. Complexity and Multithreaded Implementation Analysis of One Class-Classifiers Fuzzy Combiner. In Proceedings of the 6th International Conference on Hybrid Artificial Intelligent Systems—Volume Part II, Wroclaw, Poland, 23–25 May 2011; pp. 237–244. [Google Scholar]
Figure 1. (A) Volcano plot comparing metabolite signals in healthy subjects (CTRL) and bladder cancer patients (BC): A. phosphate, B. glycine, C. diethylene glycol, D. urea, E. oxalic acid, F. pyroglutamic acid, G. propanoic acid, H. glyceraldehyde-3-phosphate, I. dihydroxyacetone phosphate, J. ornithine, K. proline, L. glutamic acid M. phenol, N. valine, O. phenylalanine, P.1-methylhypoxanthine, Q. arachidic acid, R. glutamine, S. creatinine; (B) Volcano plot comparing metabolite signals in high-grade (BCH) and low-grade (BCL) BC patients: A. amino malonic acid, B. valine, C. proline, D. pentanoic acid; (C) Heatmap of the metabolites selected by the genetic algorithm (Glucose 1 and Glucose 2 represent two different derivatization products obtained by the sylanization process).
Applsci 11 02835 g001
Figure 2. Partial least square discriminant analysis (PLS-DA) models score plot used to classify (panel A) healthy and bladder cancer subjects; (panel B) bladder cancer patients according to their grade (high-grade BCH, or low grade BCL); and (panel C) bladder cancer patients according to the muscle invasiveness (non-muscle invasive NMIC, or muscle invasive MIC). The percentage of explained variance was reported in parentheses on each axis. Row 1 reports the PLS-DA score plot, while row 2 shows the histogram of the permutation test results in terms of R2 and Q2. Row 3 reports the metabolites having a VIP-score ≥ 2.0. In A3, the blue bars represent metabolites increased in CTRL, while the red bars represent the metabolites decreased in CTRL with respect to BC. In B3, the blue bars represent the metabolites increased in BCH, while the red bars represent the metabolites decreased in BCH with respect to the BCL. *** indicates statistically significant (p < 0.001).
Applsci 11 02835 g002
Figure 3. Ensemble machine learning (EML) models discriminating healthy and bladder cancer subjects (Model I); bladder cancer patients according to their grade (high-grade BCH, or low grade BCL) (Model II) and bladder cancer patients according to the muscle invasiveness (non-muscle invasive NMIC, or muscle invasive MIC) (Model II). Panel (A) reports the Receiver Operating Characteristic (ROC) curves obtained using the cut-off evaluated by means of the Youden’s Index (red line in B1). Panel (B) reported the EML-scores among the studied classes.
Applsci 11 02835 g003
Figure 4. Metabolic systems map summarizing results of the metabolite-set enrichment pathways analysis. (A) Model I relevant metabolites; (B) Model II relevant metabolites. Only pathways with a p-value < 0.05 were described in the figure. Full lists of the pathways were reported in Tables S2 and S3.
Applsci 11 02835 g004
Figure 5. Metabolic representation of Warburg-related modifications in a typical bladder cell which could explain the metabolic perturbations observed in the analyzed serum samples. Blu lines represent reactions generally slower in cancer cells, while red lines reaction generally faster. Orange squares indicated metabolite increased in our bladder cancer cohort, while purple squares indicated metabolites showing lower concentrations in bladder cancer patients. Abbreviations: GLUT = Glucose Transporter; MCT = Monocarboxylate transporter; DHAP = Dihydroxyacetone phosphate; GAP = Glyceraldehyde-3-phosphate.
Applsci 11 02835 g005
Table 1. Enrolled subject characteristics.
Low Grade Bladder Cancer (BCL) (n = 55)High Grade Bladder Cancer (BCH) (n = 94)Control
(n = 81)
Age (years) 168.4 (64.0–73.0)/46–8773.3 (69.0–79.0)/49–8867.3 (58.0–73.0)/47–87
Men46 (83.6%)81 (86.2%)67 (82.7%)
Women9 (16.4%)13 (13.8%)14 (17.3%)
Non muscle invasive cancer (NMIC)55 (100%)
(46 pTa; 9 pT1) 3
69 (73.4%) §
(27 pTa; 42 pT1)
NA 2
Muscle invasive cancer (MIC)026 (26.6%)NA
Smokers33 (60.0%) *56 (59.6%) *20 (24.7%)
No-Smokers22 (40.0%) *38 (40.4) *61 (75.3%)
1 Means (Interquartile Range)/Min-Max. 2 NA: Not Applicable. 3 pTa: biopsy proven noninvasive papillary carcinoma; pT1: biopsy proven tumor spreader to the connective tissue. * Indicates statistical differences (p < 0.05) compared to controls subjects. § Indicates statistical differences (p < 0.05) comparing low- and high-grade bladder cancer patients.
Table 2. Diagnostic performance: Presence of Bladder Cancer (Model I), Grading (Low-grade vs. High-grade) (Model II) and muscle invasivity (non-muscle invasive vs. muscle invasive) (Model III) of each classification model and the respective ensembles.
S 1SpPPVNPVPLRNLRA
Model IDecision Tree0.97 ± 0.010.96 ± 0.020.98 ± 0.010.95 ± 0.0426.280.030.97
PLS-DA1.00 ± 0.000.96 ± 0.020.98 ± 0.011.00 ± 0.0027.000.000.99
Naïve Bayes0.81 ± 0.030.99 ± 0.010.99 ± 0.010.74 ± 0.0465.780.190.87
Random Forest0.97 ± 0.010.98 ± 0.020.99 ± 0.010.95 ± 0.0239.410.030.97
k-NN1.00 ± 0.001.00 ± 0.001.00 ± 0.001.00 ± 0.00ND0.001.00
aNN1.00 ± 0.000.99 ± 0.010.99 ± 0.011.00 ± 0.0181.000.001.00
Logistic Regression1.00 ± 0.001.00 ± 0.001.00 ± 0.001.00 ± 0.00ND0.001.00
SVM1.00 ± 0.000.98 ± 0.020.99 ± 0.011.00 ± 0.0040.500.000.99
Deep Learning1.00 ± 0.000.99 ± 0.010.99 ± 0.011.00 ± 0.0181.000.001.00
Ensemble1.00 ± 0.000.98 ± 0.020.99 ± 0.011.00 ± 0.0040.500.000.99
Model IIDecision Tree0.94 ± 0.030.85 ± 0.050.92 ± 0.030.89 ± 0.046.440.070.91
PLS-DA0.64 ± 0.050.89 ± 0.040.91 ± 0.040.60 ± 0.055.960.410.73
Naïve Bayes0.46 ± 0.050.93 ± 0.040.91 ± 0.040.50 ± 0.056.290.590.63
Random Forest0.98 ± 0.010.56 ± 0.070.79 ± 0.040.94 ± 0.042.240.040.83
k-NN1.00 ± 0.001.00 ± 0.001.00 ± 0.001.00 ± 0.00ND0.001.00
aNN0.99 ± 0.010.35 ± 0.060.72 ± 0.040.95 ± 0.051.510.030.75
Logistic Regression1.00 ± 0.001.00 ± 0.001.00 ± 0.001.00 ± 0.00ND0.001.00
SVM0.98 ± 0.010.27 ± 0.060.70 ± 0.040.88 ± 0.081.350.080.72
Deep Learning0.86 ± 0.040.80 ± 0.050.88 ± 0.030.77 ± 0.064.310.170.84
Ensemble0.79 ± 0.060.83 ± 0.070.87 ± 0.050.73 ± 0.084.560.260.80
Model IIIDecision Tree1.00 ± 0.000.20 ± 0.130.93 ± 0.031.00 ± 0.001.250.000.94
PLS-DA0.51 ± 0.050.50 ± 0.110.86 ± 0.040.15 ± 0.041.030.970.51
Naïve Bayes0.49 ± 0.050.90 ± 0.070.97 ± 0.020.24 ± 0.054.910.570.55
Random Forest1.00 ± 0.000.00 ± 0.000.85 ± 0.03ND1.00ND0.85
k-NN1.00 ± 0.001.00 ± 0.001.00 ± 0.001.00 ± 0.00ND0.001.00
aNN1.00 ± 0.000.30 ± 0.100.89 ± 0.031.00 ± 0.001.430.000.90
Logistic Regression1.00 ± 0.001.00 ± 0.001.00 ± 0.001.00 ± 0.00ND0.001.00
SVM1.00 ± 0.000.10 ± 0.070.86 ± 0.031.00 ± 0.001.110.000.87
Deep Learning1.00 ± 0.000.50 ± 0.110.92 ± 0.021.00 ± 0.002.000.000.93
Ensemble1.00 ± 0.000.00 ± 0.000.85 ± 0.03ND1.00ND0.85
1 S: Sensitivity; Sp: Specificity; PPV: Positive Prognostic Value; NPV: Negative Prognostic Value; PLR: Positive Likelihood Ratio; NLR: Negative Likelihood Ratio; A: Accuracy; PLS-DA: Partial Least Square Discriminant Analysis; k-NN: k-nearest neighbors; aNN: Artificial Neuronal Net; SVM: Support Vector Machine; ND: Not Determinable.
Publisher’s Note: MDPI stays neutral with regard to jurisdictional claims in published maps and institutional affiliations.

