Article

Application of Quality Function Deployment for Product Design Concept Selection

School of Industrial Management, Korea University of Technology and Education (KOREATECH), Cheonan City 31253, Korea
*
Author to whom correspondence should be addressed.
Appl. Sci. 2021, 11(6), 2681; https://doi.org/10.3390/app11062681
Submission received: 15 February 2021 / Revised: 8 March 2021 / Accepted: 11 March 2021 / Published: 17 March 2021
(This article belongs to the Special Issue Smart Resilient Manufacturing)

Abstract

:

Featured Application

The applicability of the proposed approach is illustrated through a case study of new design concept selection for the evaporator in automotive air conditioning systems. We suggest that proposed approach may be used in any other B2B industries where the task of new design concept selection is defined.

Abstract

For business-to-business (B2B) companies, selecting new product concepts is vital to new product development (NPD), since it significantly contributes to the ultimate success and reputation of the product in terms of quality and function. The research problem is defining the best solution of new product’s design concept selection within high competition and resources’ limitation by mathematical approaches. The main objective of this study is developing an integrated analytical approach, combining quality function deployment (QFD) and analytic hierarchy process (AHP) approach, and data envelopment analysis (DEA) to enhance the effectiveness of design product decisions. The proposed approach focuses on mathematical methods to comprehensively evaluate and strategically select the best new product concept while considering the features of the B2B product and the available information during concept selection. The best new concept is selected by the combined scores derived from the concept competitiveness (quality function deployment—analytic hierarchy process) and the design development efficiency (data envelopment analysis). Finally, the design alternatives are classified into four categories by quadrant analysis for design concept management. The benefit of this approach—combining three mathematical models together for the best concept’s solution.

1. Introduction

Firms develop new products in order to remain competitive and expand their market share. Thus, according to Kahraman et al. new product development (NPD) is a vital function and critical process to remain competitive in the highly competitive environment [1]. Additionally, Akao [2] tells that as the selected design concept highly contributes the success of the final product and directly affects the following development stages, new concept selection is one of the most important decision-making activities during NPD. Geng et al. confirms that despite of its importance, concept selection is difficult because it requires complex multi criteria decision making (MCDM) with many factors, ranging from customer needs to constraints of the enterprise [3].
Bhutta (2013) selected and reviewed 154 journal articles on product design concept selection and evaluation for the period 1986–2012 [4]. The methods used were individual, including total cost approach, multiple attribute utility theory, total cost of ownership (TCO), AHP, data envelopment analysis, and mathematical programing techniques. Among them, TCO was the most prevalent approach, followed by AHP. Because of this finding, Bhutta and Huq (2012) compared TCO and AHP comprehensively [4]. They revealed that AHP can provide a more robust tool for decision makers to select and evaluate customer’s requirements for product design with respect to qualitative and quantitative criteria, instead of cost data only considered in TCO.
Ho et al. (2019) selected and reviewed 70 journal articles on product design concept selection and evaluation for the period 2000–2018 [5]. Several approaches have been proposed for product design concept selection, such as using AHP, analytic network process (ANP), case-based reasoning (CBR), data envelopment analysis (DEA), fuzzy set theory, genetic algorithm (GA), mathematical programing, simple multi-attribute rating technique (SMART), and their integrations.
For business-to-business (B2B) products, design concept selection directly contributes to the final quality of the product and the company business reputation—this is the opinion of Brennan [6]. B2B products have unique characteristics which are different from business-to-customer (B2C) products. B2B products have long-term relationships with fewer but larger buyers that have high demands for products with quality, price, as well as function that meet definite customer requirements (CR).
In this study, we focus on methods to comprehensively evaluate and select new design concepts from the perspective of B2B products. We propose a hybrid approach with two evaluation factors, concept competitiveness (Vcomp) and design development efficiency (Veff) on the basis of CR. Concept competitiveness represents the product’s relative strong points in functional performance and market price. We apply the integrated approach with quality function deployment (QFD) and analytic hierarchy process (AHP) to evaluate the concept competitiveness (Vcomp). On the other hand, as the quality and productivity are completely depending on the design concept, it is necessary to assess each design concept’s relative level in terms of efficiency of input and output. Design development efficiency (Veff) represents the relative efficiency among the new concepts. We adopt data envelopment analysis (DEA) to assess the Veff. We combine these evaluation results and the combined score as the final score for each new design alternative.
Recently, the combined AHP–QFD approach has been applied to many areas, including higher education, for example Köksal and Eğitman in 1998; Lam and Zhao in 1998; Partovi and Corredoira in 2012 tell that for the best knowledge of the authors, this approach has not yet been applied for product design concept selection problem [7,8,9,10,11,12,13,14,15,16,17,18,19,20].
The main problem of NPD process nowadays—how to minimize all efforts and resources and create excellent product in highly competitive market environment? In this way NPD concept selection is the main part of innovative strategy, so most of industrial companies and manufactures try to be focused on this issue. Different methods and approaches of product concept’s selection process requires a lot of time and resources and it becomes problem for those companies which do not have time or enough investment. That’s why new concepts and decisions in this area are highly welcomed.
The remaining structure of this paper is organized as follows. In Section 2, we provide a background and literature review of the new B2B product concept selection framework proposed in this study. Section 3 illustrates and explains the overall procedure and research methods of the framework; also, the proposed method is applied to a case study. In Section 4, we present results and interpretation of them. Finally, Section 5 discusses the results and Section 6 discusses conclusions of this study.

2. Literature Review

Concept development consists of a series of divergent and convergent steps. While divergent steps generate various concept alternatives, convergent steps handle how to evaluate and select the best new concepts. This convergent process is defined as ‘concept selection’ or ‘design concept evaluation’ by Cor [21]. In divergent steps, any potential concepts are generated after considering CR and designer intentions. The QFD approach, which was discussed by Chan et al., is beneficial tools in this step because it interprets CR into engineering specification (ES) [22]. QFD is a customer-oriented approach to improve quality in NPD as well as ensure that the customer is engaged throughout the product’s specification by Tontini [23]. In this study, we apply QFD to generate design concepts and use AHP to evaluate the concept competitiveness.
There is much existing research on concept selection. The literature review of Okudan and Tauhid classified the concept selection methods into six categories: (a) decision matrices methods, (b) AHP models, (c) uncertainty modeling, (d) economic models, (e) optimization concepts, and (f) heuristics [24]. In detail, Pugh in 1991; Fung, Chen and Tang in 2017 tell that while decision matrices methods can provide useful insight into qualitative preference over the alternatives, it is not able to compare relative importance of criteria [25,26]. The strong point of AHP method is that it can evaluate the relative importance by the pair-wise comparison by Marsh, Slocum and Otto [27]; and Mullens, Armacost and Nippani [28]. Uncertainty modeling method allows for uncertainties in the concept selection process. Lee et al. state that fussy logic is one of the popular tools adopted for uncertainty modeling [29]; and Thurston confirms that economic models use a utility function rather than discrete ratings or fuzzy methods [30]. However, the drawback of this method is not to accommodate coupled decisions. De Felice suggested that optimization concept uses the numerical techniques to identify optimal solution [31]. However, this method is difficult and complicated due to the complexity to understand and the utility of the advanced mathematics. The last heuristics method uses the genetic algorithms (GA)—Buonanno and Marvis confirm it [32]. This approach makes the designer view the trade-off between performances and has the merits when searching much large decision space. However, due to the tremendous calculation, the burden on designer is much high and it is also essential to have a high-speed computer. In the recent research, Zhu et al. (2015) proposed the integrated analytic hierarchy process (AHP) and compromise ranking method (VIKOR) for design concept evaluation [33]. They illustrate the six design concepts of the lithography tools. Salhieh and Al-Harris (2014) suggested the integrated approach using data envelopment analysis (DEA) and conjoint analysis (CA) [34]. They used the development burdens as the input criteria and the customer perceived value as the output criteria which conducted by conjoint analysis. They ranked the design concepts by DEA scores and selected the final design concept. They applied this approach to twelve design concepts of smartphone.
Starting from 1980, Saaty [35,36,37] suggested that the AHP is a multi-criteria decision-making framework using hierarchical relationships among the decision levels. Later in 2011, Talib, Rahman, and Qureshi confirmed that this is a powerful method for solving complicated and unstructured problems that may have interactions and correlations among different objectives and goals [38]. The AHP has two models, the pair-wise comparison method (relative measurement) and the rating method (absolute measurement). In the pair-wise comparison method, the main logic is to assess the relative priorities between two criteria, and this helps decision makers improve their understanding of complicated decisions by dividing the problems into a hierarchical structure. On the other hand, Yu and Jang suggested the rating method defines a set of intensity levels as a base to assess the performance of the alternatives in terms of each criterion [39]. In this study, we apply the AHP rating method to assess concept competitiveness and the AHP pair-wise comparison method to calculate the weighted value of the combined scores by reflecting experts’ group opinions.
DEA is a methodology to measure efficiency with multiple inputs and outputs. Jeon, Kim, and Lee states it is a non-parametric approach that does not require assumptions about the functional form of a production function and a priori information on the importance of inputs and outputs [40]. Andersen and Petersen (2013) developed the super efficiency model [41] to improve upon the two limitations of the DEA-CCR by Charnes, Cooper, and Rhodes [42,43] and the DEA-BCC by Banker, Charnes, and Cooper [44,45] models. The first limitation is that these models cannot rank all of the decision-making units (DMUs). Since these models do not calculate an efficiency score greater than one, they score all efficient DMUs equal to one—discussed by Kwong [15] and Chuang [9]. The second limitation is that these models do not indicate the DMUs that require improvement. The basic concept of the super efficiency model is to calculate the relative difference among the efficiency frontiers depending on the existence of DMUs. Chakraborty et al. [46,47] suggested there are two types of super-DEA models, a radial model and a non-radial model. For the radial model, infeasibility can occur depending on the data structure without considering slacks. Infeasibility issues are critical in calculating efficiency. To solve this infeasibility, Li et al. (2019) suggested using a non-radial model, i.e., slacks-based measure of efficiency model (super-SBM) [48]. In this study, we apply a super-SBM to evaluate the design development efficiency and rank all design alternatives without infeasibility. We want to summarize all these approaches and define their advantages and limitations in use (Table 1).
We notice from table above that each separate method has advantages and disadvantages in practical case; so, it is necessary to develop new method, which may combine all these approaches and reduce limitations.

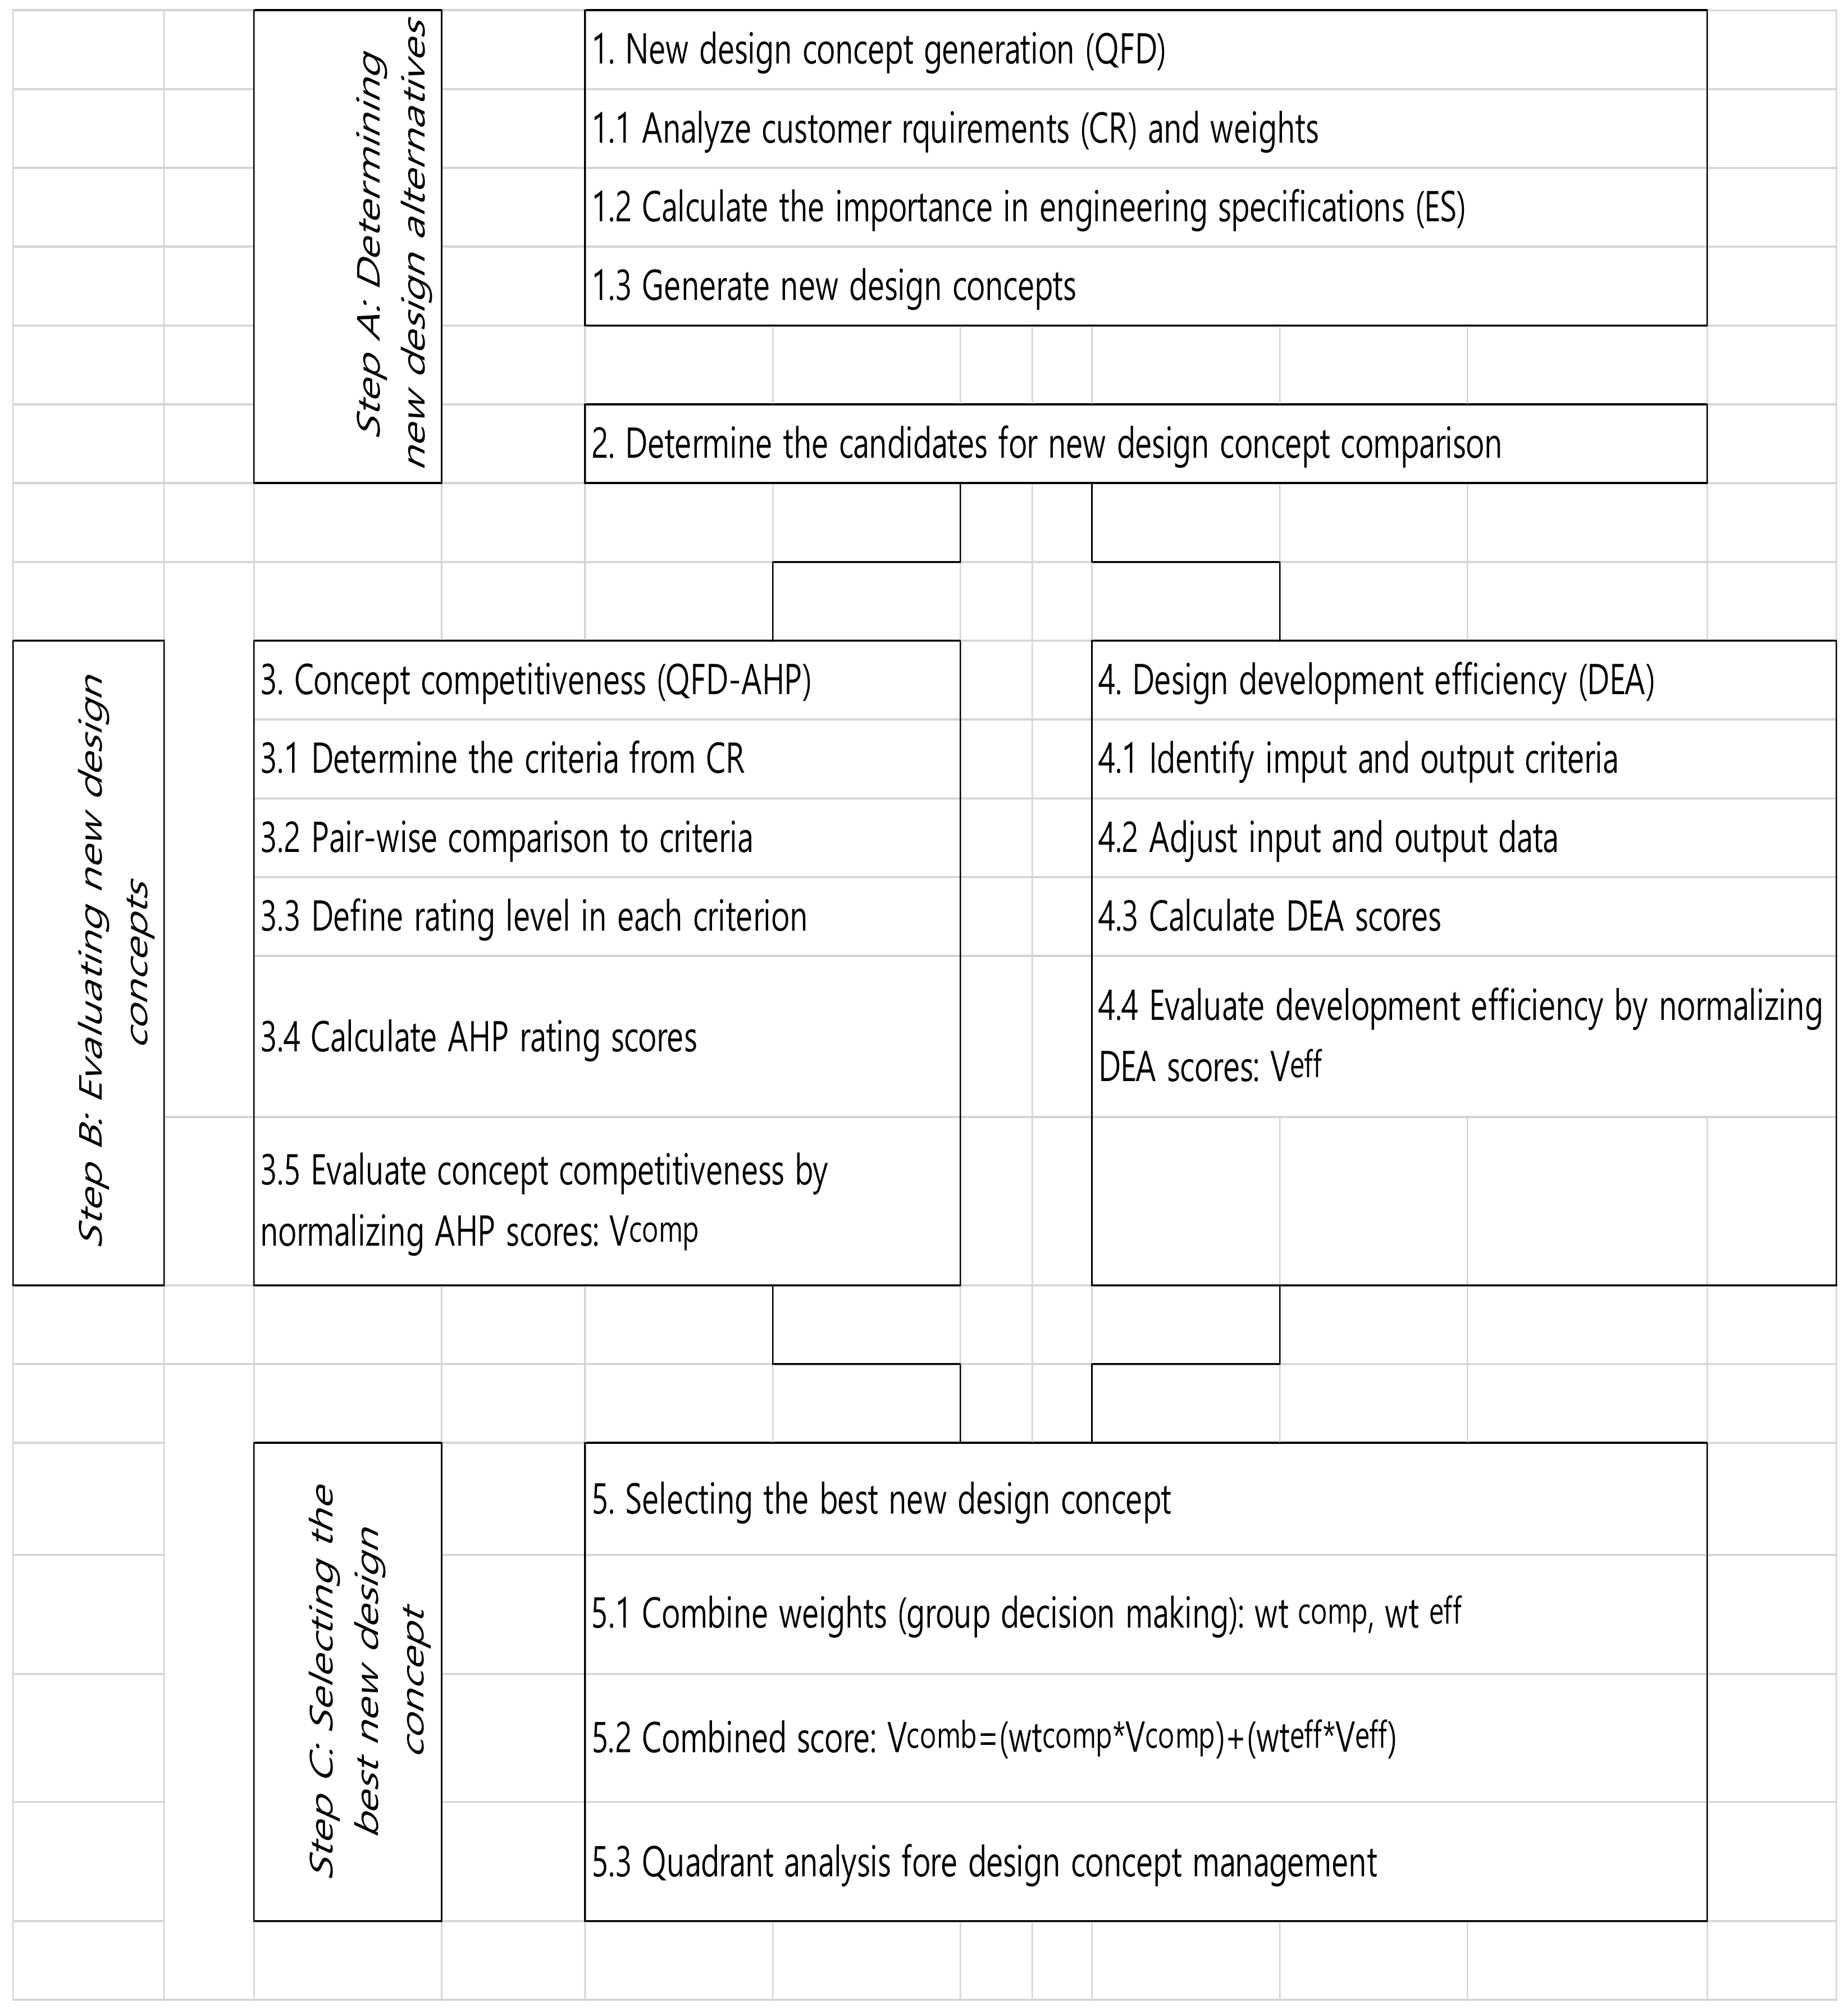
3. Materials and Methods

In this study, we propose a new method to help B2B product enterprises evaluate and select new product concepts based on CR.
During the first step we should prepare research model and choose appropriate criteria and evaluation indicators for our survey. The proposed product concept selection approach using combined AHP and QFD can be described in the following steps:
(a)
AHP pairwise comparison.
Construct a pairwise comparison matrix A (Equation (1)),
A = a 11 a 12 a 1 n a 21 a 22 a 2 n a n 1 a n 2 a n n
where n denotes the number of elements (customer requirements in product 1), and aij refers to the comparison of element i to element j with respect to each criterion (product design). The 9-point scale can be used to decide on which element is more important and by how much.
(b)
AHP synthetisation.
Divide each entry (aij) in each column of matrix A by its column total. The matrix now becomes a normalized pairwise comparison matrix (Equation (2)),
A = a 11 i R a i 1 a 12 i R a i 2 a 1 n i R a i n a 21 i R a i 1 a 22 i R a i 2 a 2 n i R a i n a n 1 i R a i 1 a n 2 i R a i 2 a n n i R a i n
where R denotes the set of customer requirements, that is, R = {1, 2, …, n}.
(c)
Compute the average of the entries in each row of matrix A′ to yield column vector (Equation (3)),
C = C 1 k 1 C n k 1 = a 11 i R a i 1 + a 12 i R a i 2 + + a 1 n i R a i n n a n 1 i R a i 1 + a n 2 i R a i 2 + + a n n i R a i n n
where C i k 1 denotes the relationship weightings between customer requirement i and its corresponding design k.
(d)
AHP consistency verification
Multiply each entry in column i of matrix A by C i k 1 . Then, divide the summation of values in row i by C i k 1 to yield another column vector (Equation (4)),
C ¯ = C ¯ 1 k 1 C ¯ n k 1 = C 1 k 1 a 11 + C 2 k 1 a 12 + + C n k 1 a 1 n C 1 k 1 C 1 k 1 a n 1 + C 2 k 1 a n 2 + + C n k 1 a n n C n k 1
where C ¯ refers to a weighted sum vector.
(e)
Compute the averages of values in vector C ¯ to yield the maximum eigenvalue of matrix A (Equation (5)),
λ m a x = i R C ¯ 1 k 1 n
(f)
Compute the consistency ratio (Equation (6)),
C I = λ m a x n n 1
where RI(n) is a random index of which the value is dependent on the value of n. If CR is greater than 0.10, then go to step (a). Otherwise, go to step (g).
(g)
Compute the importance rating of each stakeholder requirement
where S denotes the set of company stakeholders, that is, S = {1, 2, …, m}, and pk denotes the proportion of customers k.
After calculating the final assessment scores, we conduct a quadrant analysis to categorize the new design concepts into four groups. We analyse the relative position of each design concept versus the current design through quadrant analysis. Figure 1 depicts the detailed procedures of the proposed framework.
  • Step A: Determining new design alternatives
In this step, we apply the traditional QFD method to select the ES from CR and demonstrate the relative importance. These selected specifications and their relative importance can be crucial for designers to generate new design concepts. Then, we determine the candidates for design concept selection. This QFD analysis is also linked to the next evaluation step.
  • Step B: Evaluating new design concepts
In the second step, we assess the relative concept competitiveness and design development efficiency of the new design concept versus the current design concept. We suggest an integrated analysis with QFD and AHP for concept competitiveness. The AHP scores (Vcomp) represent a relative concept competitiveness among the candidates. As shown in Figure 1, first, we determine the evaluation criteria which correspond to the CR in the QFD. Second, we conduct a pair-wise comparison of the criteria to decide the weighted values. Third, the relative competitiveness levels of the new design concept versus the current design concept are determined in advance. We calculate the concept competitiveness scores by multiplying the weighted values and rating scores and then normalize these scores by dividing each original score by the AHP score of the current design concept. Furthermore, the super-SBM scores (Veff) represent the relative design development efficiency. We identify the input and output criteria to evaluate the efficiency in advance. Then, we gather the quantitative and qualitative data and adjust the direction of the data. Thus, we calculate DEA scores through the super-SBM and then normalize the scores by dividing each original score by DEA score of the current design concept.
  • Step C: Selecting the best new design concept
In the last step, we calculate the combined scores for B2B firms to determine the best design concept. We conduct group decision making using an AHP pair-wise comparison between the concept competitiveness and the development efficiency to determine weighted values (wtcomp,wteff). From the combined scores, we rank the design concepts and select the best one. Then, we carry out the quadrant analysis to recognize the relative position of new concepts versus the current design concept. This step completes the proposed method.

4. Results

For illustration of the proposed method, we apply it to a case study of an automotive air conditioning system (A/C system), as depicted in Figure 2. The aim of an A/C system is to generate cool air for the driver’s convenience and comfort.
The A/C system consists of four major components, compressor, condenser, and thermal expansion valve (TXV) and evaporator. The A/C system uses refrigerant, such as R134a, in the circulation system. The refrigerant can absorb and release energy when it changes phases between liquid and gas. The compressor makes the refrigerant a pressurized gas under high pressure. Through the heat-exchange in the condenser, the refrigerant changes to a cooled compressed liquid under high pressure. A thermal expansion valve (TXV) makes the refrigerant become a cold mixture of liquid and vapor under low pressure. The evaporator is located on the passenger side and is a heat-exchanging component which absorbs surrounding heat to cool the atmosphere. The cooled air is forced into the passenger side by an electric motor. An automotive A/C system is typically B2B product of which buyers request perfect quality, good function and competitive price for a large purchasing volume.

4.1. Results of New Design Concept Generation (QFD)

For this case study, the B2B product supplier has maintained a long-term relationship with customers. The developers have attended a regular meeting with customers to exchange opinions and create a new design concept for new vehicles. These B2B product developers clearly recognize the CR. Table 2 shows the result of the QFD analysis about the evaporator in the A/C system. The customer requests a smaller size, silent operation, and good operational efficiency with low weight and low price. The customer considers the low price (customer weight = 5) to be the most important CR. Further, we selected nine ES following interviews with the product designers. We calculated the relative importance by considering the correlation between the CR and the ES. The number of tubes is the most important ES.
We conducted interviews with designers and marketers to determine the candidates for the new design concept. As shown in Table 3, we selected five new product concepts with two competitor’s designs and the current design as a reference.

4.2. Results of Evaluating Concept Competitiveness by the QFD-AHP

To evaluate the concept competitiveness, we considered multiple criteria in advance. Specifically, we selected five key criteria which represent the CR in the QFD: heat-exchange performance (kcal/h), air pressure drops (mmAg), refrigerant pressure drops (kgf/cm2), weight, and cost. As depicted in Figure 3 by Limperich, Braun, Schmitz, and Prölß [49], air travels through the core and refrigerant passes through several holes in the tubes to exchange the heat between the hot air and the cold refrigerant.
The heat-exchange performance (HEX) measures how much energy (kcal) has been exchanged during one hour. If we increase the HEX using the same size, we can reduce the size of the product. The air pressure drops (dP air) means the pressure difference between the inlet and outlet of the evaporator. If the dP air increases, air flow decreases which makes noise. The refrigerant pressure drops (dP ref) represents the pressure difference between the inlet and outlet of the tubes. As dP ref increases, the efficiency of the A/C system decreases. The weight of the component is a critical factor and is highly related to the fuel efficiency of the vehicle. The cost, which refers to the numerous expenses required to produce the product, is also crucial for buyers and directly affects market price. After selecting five criteria, we conducted a pair-wise comparison to determine the weighted value of each criterion.
We used a nine-point Likert scale to evaluate concept competitiveness as shown in Table 3. We developed the rating levels through interviewing the firm’s internal experts. Value t in Equation (7) represents the relative result compared to the current product design. The Vcurrent denotes the current product design’s value and Vnew denotes the new design concept’s value. For example, cost decreases, the cost competitiveness increases. If the new concept’s cost is five percent (t = −5) less than the current design, we rate the new concept equal to 7. To calculate the value t, we used the bench test results of the current design and competitors. As we did not have actual components of the new concepts, we adopted the estimated results from product designers. The costs were estimated by cost estimators under the same calculation toolkit.
t = 100 × (Vnew − Vcurrent)/Vcurrent
We calculated the concept competitiveness scores by multiplying the rating scores by the weighted values. Then, we normalized the scores by dividing each original score by the current product’s score. Table 4 details the results and rankings of the design concept competitiveness scores (Vcomp) as well as results from QFD analysis. As shown in Table 4, the cost (0.419) is the most important criterion among the five criteria, concept A is the most competitive design, competitor X is ranked last, and the current design concept is ranked sixth among the eight concepts (Table A1 in Appendix A).

4.3. Results of Evaluating the Design Development Efficiency by the Super-SBM

To evaluate the design development efficiency, multiple input and output criteria were considered. Selecting criteria is quite subjective as there is no specific rule for the selection of inputs and outputs—presented by Ramanathan [50]. We must consider the characteristics of the B2B product with clear requirements, such as high demand for quality and price. Furthermore, since concept selection is conducted in the first stage of NPD, it is difficult to have sufficient information for decision making. Due to this restricted information, an expert opinion from the organization can be the most reliable factor in decision making. We also considered internal burdens which require resources to accomplish the new design’s competitiveness. We determined three the input criteria and five criteria for the concept competitiveness evaluation. The three input criteria are the quality control burden, manufacturing burden, and development cost burden. In detail, the quality control burden refers to how difficult quality is to control without a defect. The manufacturing burden is related to how difficult the new concept is to produce. Lastly, the development cost burden represents how much budget is required to develop the new design.
According to these three inputs and five outputs, we assessed the relative design development efficiency among the candidates. We applied super-SBM-input oriented-constant return to scale (super-SBM-I-C) model using DEA-Solver software. First, we collected the input data and output data. For the input data, we adopted a nine-point Likert scale to estimate the three burdens as depicted in Table 4. In order to evaluate the relative burdens versus the current design, we set the middle score equal to the current design concept. We survey functional experts with more than 10 years of experiences.
We then corrected for the direction of the output criteria. For example, as the value of HEX increases, the efficiency also increases. However, dP air, dP ref, weight, and cost, values decrease, the efficiency increases. To compensate for this value direction, we use the reciprocal number of these outputs and adjusted the reciprocal number by multiplying by 100 or 10,000 as appropriate. Multiplying the same number to each value in a criterion does not make difference in the super-SBM score. As shown in Table 5, we calculated the DEA score using the adjusted data and normalized the DEA scores by dividing each by the current design’s DEA score to assess the relative design development efficiency (Veff). As shown in Table 5, concept B was ranked first. The current product design was ranked fifth, and concept E was ranked last.
So, for the product concept’s evaluation we chose 2 competitive products, proposed 5 different concepts, submitted input and output criteria and got a result. For further survey Concept B is the best one as it took 1st rank position.

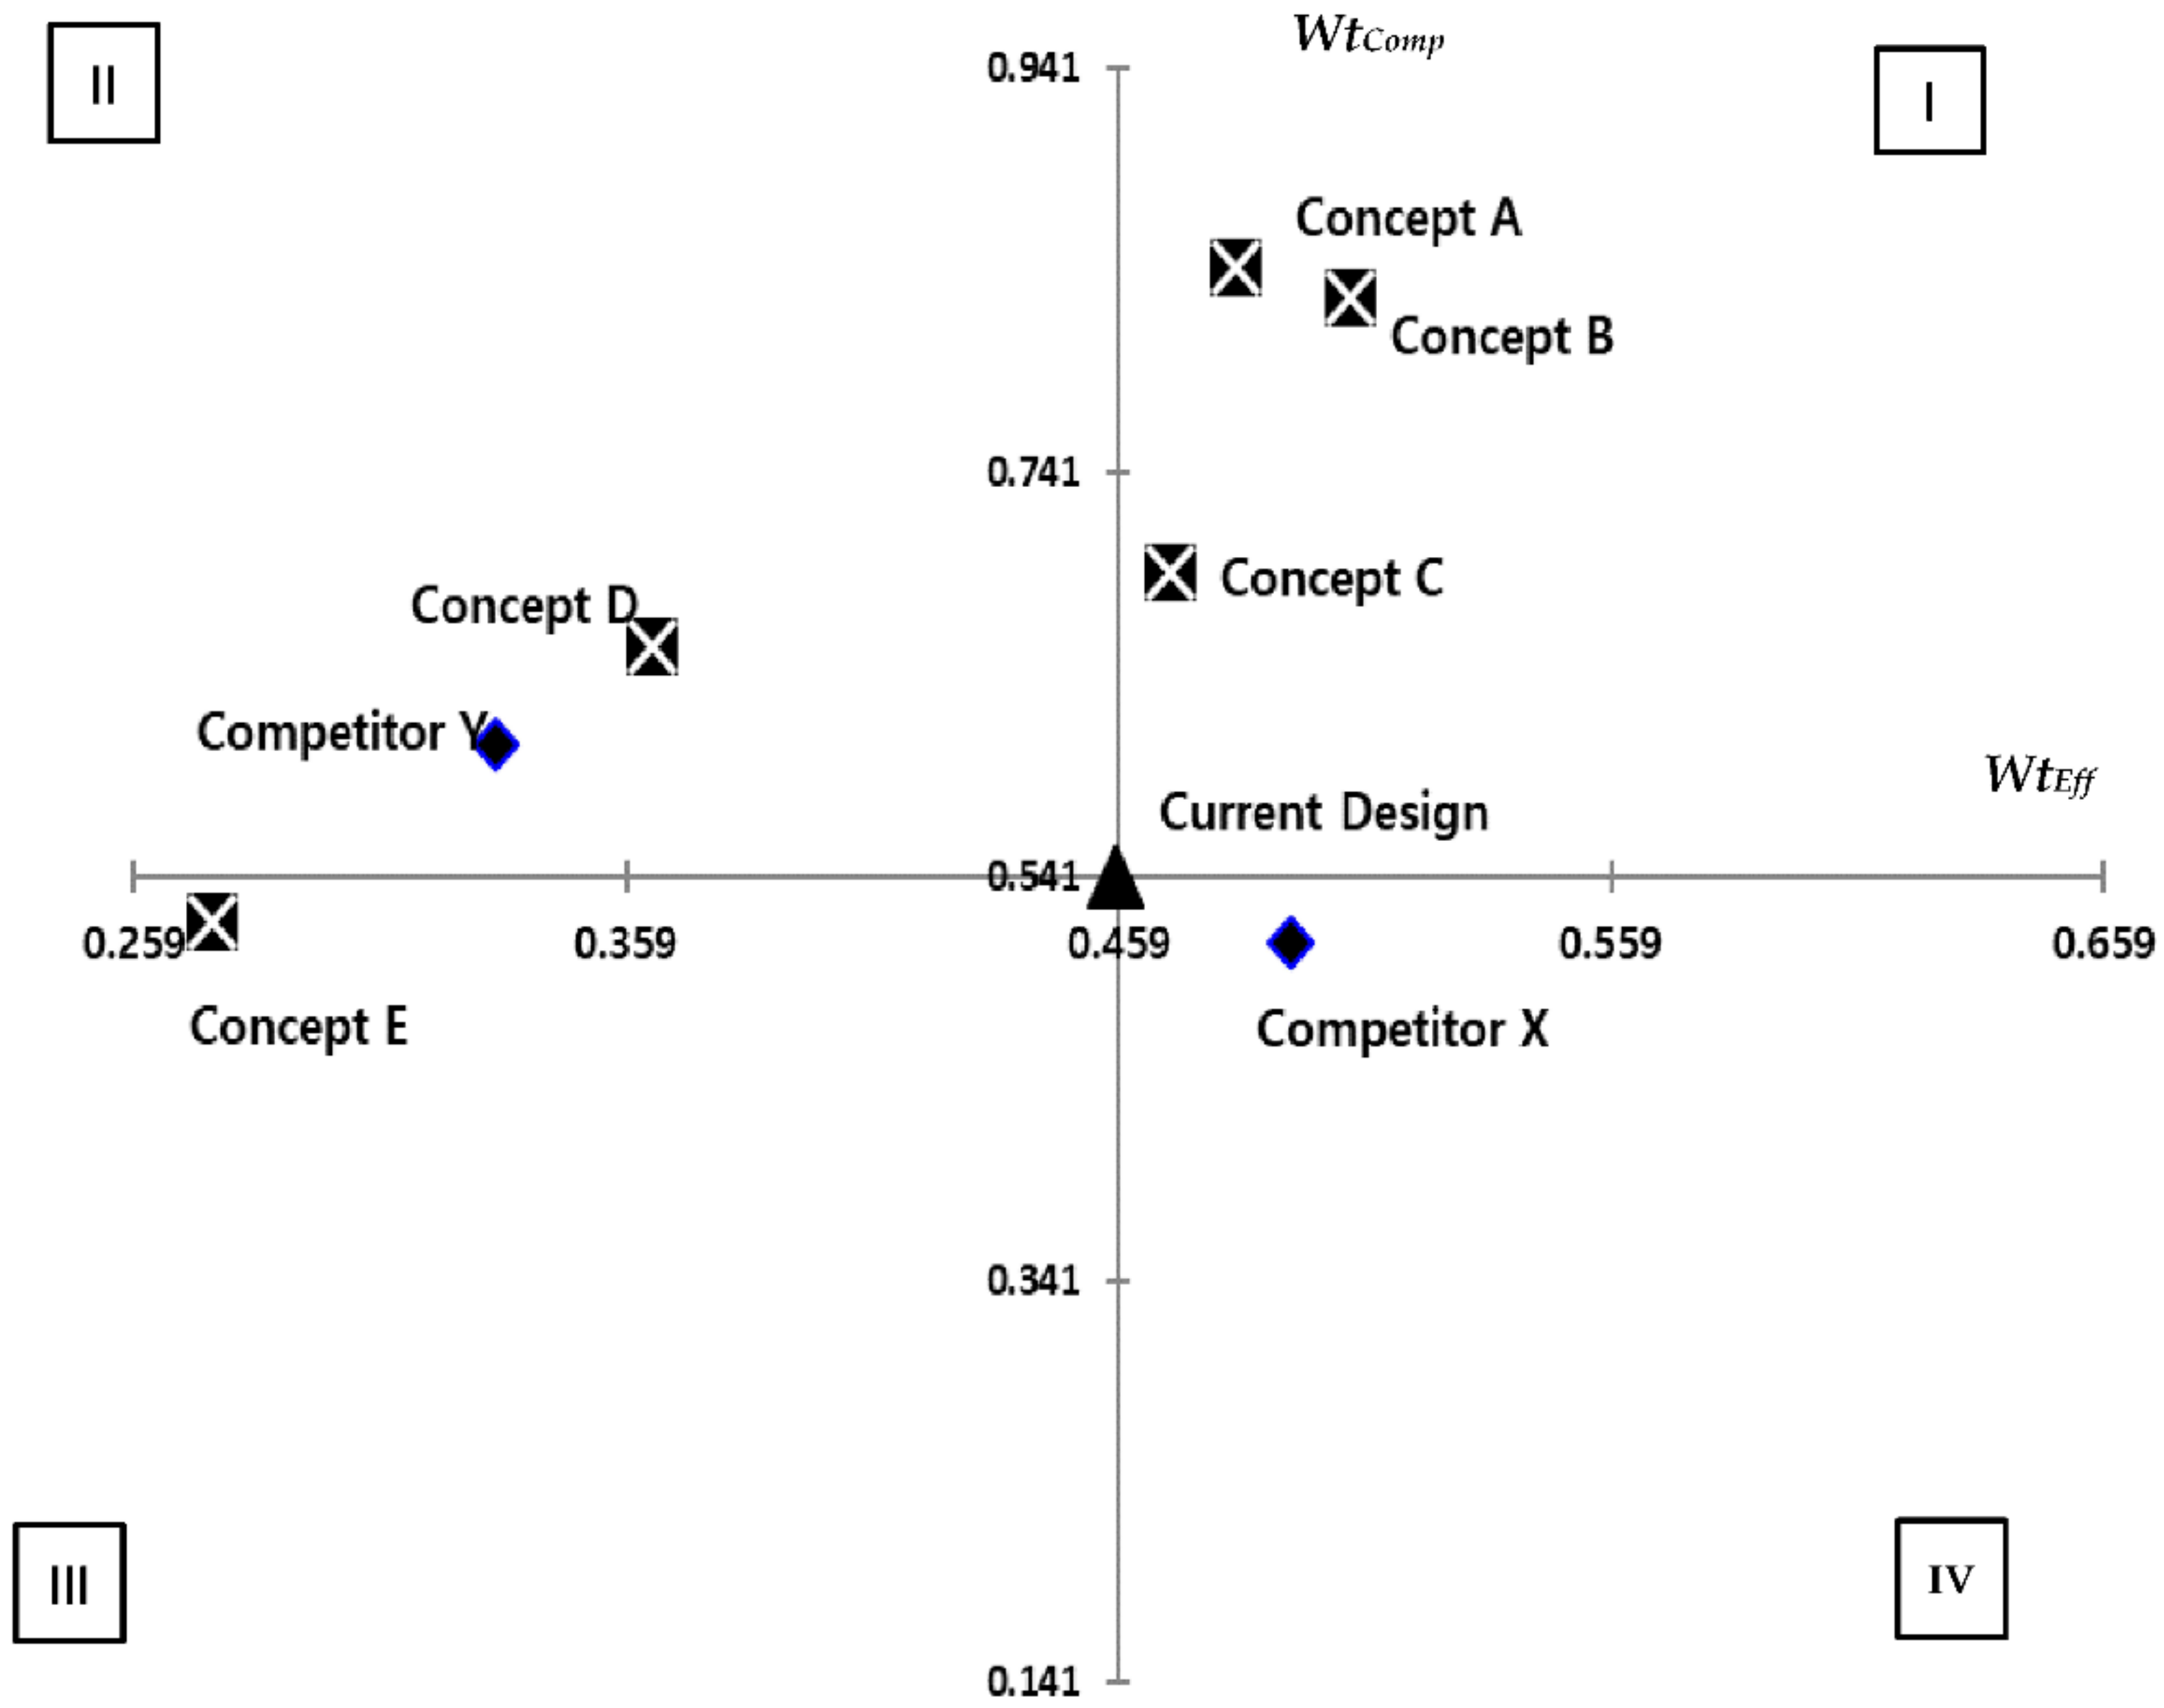
4.4. Results of Selecting the Best New Design Concept

In this step, we selected the best design concept and analysed the design concept’s relative position versus the current design concept. To determine the weighted values between the Vcomp and Veff, we applied group decision making using an AHP pair-wise comparison. We surveyed the priorities between concept competitiveness and development efficiency with ten internal experts. From the pair-wise comparison with the geometric mean of these rating scores, we determined the wtcomp and wteff.
The combined scores (Vcomb) are the final evaluation results for each design concept. Firms can use the Vcomb to select the best design concept. Table 6 shows the combined scores (Vcomb) and rankings. The expert group evaluated that concept competitiveness (0.541) is more important than design development efficiency (0.459). The Vcomb is the sum of the weighted competitiveness (WtComp) and the weighted efficiency (WtEff). The average WtComp is 0.649 and the average WtEff is 0.423. The overall average of the combined scores is 1.072.
As shown in Table 6, concept B was ranked first with 1.334 and concept E was ranked last with 0.793. Thus, we selected concept B as the best new concept. In addition, we conducted a quadrant analysis to separate the new design concepts into four categories. As represented in Figure 4, the vertical axis denotes the WtComp such that a design concept with a WtComp score higher than the current design’s WtComp (equal to 0.541) is located above the horizontal axis. The horizontal axis denotes the WtEff such that a design concept with a WtEff score higher than the current design’s WtEff (equal to 0.459) is located to the right of the vertical axis.
As shown in Figure 4, concept A, B, and C are in quadrant I since they have higher concept competitiveness and development efficiency than the current product design. Therefore, these three new design concepts are candidates for the final design concept. Concept D and competitor Y are in quadrant II since they have higher concept competitiveness than the current design but lower design development efficiency. If process innovations for these new concepts reduce the development efficiency, these concepts can move to quadrant I. Concept E is in quadrant III, and is clearly inferior to the current design. Thus, we can remove this from the potential designs. Finally, competitor X is in quadrant IV since it has higher development efficiency than the current design, but lower concept competitiveness. From this hybrid approach, we selected concept B as the best design concept since it was ranked first.
Case study results show that AHP is best applied in a situation where structuring, measurement, and/or synthesis are required. Additionally, AHP can also be applied to a group decision where judgments made by all the individuals in a group are combined. Some areas in which the AHP has been successfully employed include resource allocation, forecasting, total quality management, business process re-engineering, quality function deployment, quality control and the balanced scorecard. On other hand, DEA has been widely used for measuring relative performance of universities and schools in educational sectors since its introduction in 1978; banks, mutual funds, and stock markets in the financial sector, and the like. The method has continued to gain widespread acceptance as a management tool, so authors show results of its application together with AHP. So, by eliminating flaws and taking advantage of each methodology’s specific characteristics in identifying and solving a problem, the new integrated AHP/DEA model appears to be a more logical and sensible solution in multi-criteria decision-making (MCDM) problem. The combination of different models helps to reduce uncertainty risks during decision making process and get more relevant results.

5. Discussion

Avkiran and Rowlands discussed in their research work sustainable development of new product requires mentioning some important things [51]. First of all, the concept design of new product is one of the major parts of NPD process. It affects customization results; therefore, it is necessary to understand whether three approaches which are discussed in this research may help new product be more market oriented.
For the second, the development of a new product is the development of original products; or the improvement of products and their modernization; or the creation of new product brands by organizing their own R&D. Hsiao S.W. confirms that the process of developing a new product consists of eight stages:
Generation of ideas;
Selection of ideas;
Concept development and verification;
Marketing strategy development;
Business analysis;
Product development;
Trial marketing;
Commercial production [52].
QFD, AHP and DEA approaches help developers and project managers to generate and select idea; develop concept; but how do they influence on marketing strategy and customization efforts? We have to discuss possible ways of QFD, AHP and DEA approaches implementation in customization area.
Lin et al. [52] and Murillo-Zamorano [53] state that product development is essential in developing a new product as well as improving the existing product [54]. The conceptual design is the most crucial stage in product development. In general, conceptual design is comprises of manufacturing process, design concept and material selection. Design concept provides several designs on the product hence helps in summarizing as well as following the customer needs. During this concept design, material selection can be made simultaneously depending on the requirements, as discussed by Kaoru [55]. Lin et al. identified that QFD is a tool to interpret the customer voice into engineering specifications [56], whereas multi criteria decision making (MCDM) enables designers to decide on the best design and material for the product. Rizwan states that both QFD and MCDM implementation ensure the successfulness of product development [57].
The attribute of the goods is understood as its property, element or characteristic of functioning, important for the consumer. We understand the attribute of the product as a significant feature of the product, which determines its perception by the consumer as suitable for it. An attribute area is not all the attributes of a product, but only important one for the consumer. Attributes in the psychology of consumption are the starting points to which attribution occurs. If we suggest that attribution of any features is characteristic of the attribution of a person, then, for the attribution of goods as a simpler formation, attribution is characteristic only in the plane “satisfied—not satisfied”, in other words “it is my product/it is not mine” [58]. On the basis of an attribute, properties such as importance, uniqueness, necessity, etc. are attributed to the product. Attribution in consumption is closely associated with associations, myths (in the interpretation adopted in PR), and image.
In previous research authors stated that the quality of a product as a measure of its utility reflects the aggregate characteristics that can meet the needs of society. The consumer value of a product is determined by how well it is due to its properties to satisfy the specific needs of a person. You can portray a specific product and a specific human need in the form of circles, and the use value of the product in the form of the degree of their combination. The Figure 5 shows that product A does not satisfy need X, product B satisfies it partially, and product C completely. In this case, the goods B has the highest consumer value, i.e., high customer loyalty.
New product concept should be included in product policy. Product policy is a marketing activity related to the planning and implementation of a set of measures; and strategies for the formation of competitive advantages and the creation of such characteristics of a product that make it constantly valuable to the consumer and, thus, satisfy one or another of its needs, ensuring the corresponding profit to the enterprise.
Product policy accumulates in a single complex marketing management of the product life cycle, its consumer value, brand strategy, the development of the “novelty”.
So, we expect in future research that combining three approaches (QFD, AHP and DEA) may help to achieve full customers’ satisfactions. For example, the QFD processes are performed by applying the design information embodied in the relation matrix, called the house of quality (HOQ).
In general, the design information contained in the HOQ is integrated to further determine the importance of DRs and their achievement degrees in order to optimally satisfy customer satisfaction. To do this, a normalization process is usually applied by QFD researchers and practitioners. In the literature, the normalization model proposed by Wasserman [58] has been widely adopted. Based on Lyman’s normalization concept [59], this model is developed by incorporating the correlations among DRs (Equation (8)), formulated as:
R i j = k = 1   n R i k Y k j j = 1 n k = 1 n R i k Y k j
From the vector space concept, where Ykj denotes the technical correlation between DRk and DRj. In the above equation, RJk indicates the relational intensity between CRi and DRk, which is measured based on a 3-point scale, such as 1-3-9 or 1-5-9, for describing the weak-moderate-strong relationship. Although Wasserman’s normalization model has been widely adopted, it has some weaknesses. For example, it assumes that customer requirements are mutually independent. However, this may not be true in practice. More importantly, this model may generate a relational intensity for a pair of CRs and DRs that does not exist in the original design information. The model may thus produce unreasonable outcomes.
Identifying such weaknesses in Wasserman’s normalization model, Chen and Chen [60] proposed the following modified normalization model (Equation (9)):
R i j n o r m = k = 1   n Y k j R i j j = 1 n ( k = 1 n Y k j ) R i j
where R i j n o r m denotes the normalized relationship between CRi and DRj. Applying the above modified normalization model to integrate design information, the unreasonable outcomes from Wasserman’s model can be avoided. Furthermore, considering the possibility that some CRs are correlated, Chen and Chen [60] also proposed the following normalization model to integrate CRs, similar to that in (Equation (9)), in determining the normalized weights of CRs (Equation (10)):
d i n o r m = l = 1   m Β i l d i i = 1 m ( l = 1 m Β i l ) d i  
where Β i l denotes the correlation between CRi and CRl and di is the importance of CRi. It is noted that the normalized weight d i n o r m in (Equation (10)) is reduced to di when CRs are mutually independent; that is l = 1 m Β i l = 1 .
This discussion may help us to investigate more effective impact of AHP, QFD and DEA cooperation om customer’s satisfaction.

6. Conclusions

The requirements of the market are essential information for suppliers to determine new product concepts. Additionally, as B2B product is highly linked with ultimate products in terms of quality, performance and price, it is crucial for B2B supplier to clearly understand customer requirement and to develop competitive product in price and quality. In this study, we suggest a novel hybrid method by combining concept competitiveness and design development efficiency to assist B2B product suppliers in selecting the best new design concept. We applied a QFD approach to generate new design alternatives, and used this analysis to evaluate concept competitiveness. We adopted an AHP rating method to assess concept competitiveness and a super-SBM to calculate the design development efficiency. We selected the best new design concept through the combined score of WtComp and WtEff. Finally, we classified these concepts into four categories for design concept management.
We applied this proposed method to a case study of evaporators in an automotive A/C system. From the illustrated results, concept A ranked first in concept competitiveness and concept B ranked first in design development efficiency. On the other hand, competitor X and concept E ranked last in competitiveness and efficiency, respectively. Thus, concept B was selected as the best design concept with the highest combined score. From the quadrant analysis, concept A, B, and C belonged in quadrant I, which is the potential selection group with relative higher concept competitiveness and design development efficiency than the current design.
This study has numerous implications. First, this study proposes the linked approach between divergent step and convergent step by applying integrated QFD–AHP. It helps decision-maker to make sense from customer requirement to design priority at the same time. Second, this proposed method is a hybrid approach with both QFD–AHP and DEA, considering concept competitiveness and design development efficiency. Third, this study evaluates each concept versus a current design. This approach helps decision-maker to clearly understand its relative level. Fourth, this study shows how to practically classify new concepts for concept management after selection. With this proposed method, B2B product suppliers can practically and quickly obtain reliable results for concept selection during NPD.
The major limitation or drawback of proposed integrated approach is due to AHP. It may be time-consuming in reaching consensus. Decision makers have to compare each cluster in the same level in a pairwise fashion based on their own experience and knowledge. For instance, every two criteria in the second level are compared at each time with respect to the goal, whereas every two sub-factors of the same criteria in the third level are compared at a time with respect to the corresponding criterion. If it is found that the consistency ratio exceeds the limit, the decision makers have to review and revise the pairwise comparisons again [61].
Similar approach could be principally adopted in other decision-making scenarios for effective product management, including third-party R&D service provider evaluation and selection, quality center and manufacturing location evaluation and selection, product design performance measurement, and so on. However, this calls for thorough research as both frameworks and criteria for decision-making are likely to vary widely depending on the context.

Author Contributions

J.H.L. and S.C.P. created the conceptualization; J.H.L. designed the methodology; O.A.S. carried out the investigation; J.H.L. and S.C.P. did the analyses, validation, and data curation; O.A.S. and S.C.P. wrote the paper, and O.A.S. contributed to reviewing and editing all sections; J.H.L. supervised the work. All authors have read and agreed to the published version of the manuscript.

Funding

This research was funded by Education and Research promotion program in 2021 from Korea University of Technology and Education (KOREATECH).

Institutional Review Board Statement

Not applicable.

Informed Consent Statement

Not applicable.

Conflicts of Interest

The authors declare no conflict of interest.

Appendix A

Table A1. Concept competitiveness scores and rankings from the QFD–AHP model.
Quality Function Deployment (QFD)Analytic Hierarchy Process (AHP)
Engineering Specifications (1,3,5)Design Concept Evaluation
Customer
weights (1,3,5)
Number of componentsProduct
width
Product
height
Product
thickness
Number
of tube
Unit tube
volume
NRPHUnit fin
volume
FPDMAHP criteriaAHP
weighted value
Current designCompetitor XCompetitor YConcept AConcept BConcept CConcept DConcept E
Customer requirements Smaller size maintaining the same heat-exchange.3155531333HEX0.29454976884
Silent operation and no noise.1 1 5dP air0.06751832763
Good operational efficiency.1 1 35 dP ref0.04759189628
Low weight for fuel efficiency.33 33 3 Weight0.17353489243
Low price531113 3Cost0.41956499766
Raw score272120213315141829
Relative weights14%11%10%11%17%8%7%9%15%
Unitpcsmmmmmmpcscm3holescm3pcsAHP
Design conceptsCurrent design110282295356013.3750.267 5.000
Competitor X14830823444869.4534.975 4.699
Competitor Y14927629541785.21947.576 5.595
Concept A118317234356810.3738.267 7.790
Concept B21231722535689.8736.567 7.649
Concept C106282295386013.31054.576 6.382
Concept D14927629541787.51447.576 6.053
Concept E14530823444869.4634.970 4.787
Vcomp1.0000.9401.1191.5581.5301.2761.2110.957
Ranks68512347

References

  1. Kahraman, C.; Büyüközkan, G.; Ateş, N. A Two-Phase Multi-Attribute Decision-Making Approach for New Product Introduction. Inf. Sci. 2017, 177, 1567–1582. [Google Scholar] [CrossRef]
  2. Akao, Y. Quality Function Deployment (c): Integrating Customer Requirements into Product Design; Taylor & Francis: London, UK, 1990; pp. 67–136. [Google Scholar]
  3. Geng, X.; Chu, X.; Zhang, Z. A new integrated design concept evaluation approach based on vague sets. Expert Syst. Appl. 2010, 37, 6629–6638. [Google Scholar] [CrossRef]
  4. Bhutta, K.S.; Huq, F. Supplier selection problem: A comparison of the total cost of ownership and analytic hierarchy process approaches. Supply Chain Manag. Int. J. 2002, 7, 126–135. [Google Scholar] [CrossRef]
  5. Ho, W. Integrated analytic hierarchy process and its applications—A literature review. Eur. J. Oper. Res. 2008, 186, 211–228. [Google Scholar] [CrossRef]
  6. Brennan, R. Business-to-Business Marketing. In Encyclopedia of Social Network Analysis and Mining; Springer: Berlin/Heidelberg, Germany, 2014; pp. 83–86. [Google Scholar]
  7. Köksal, G.; Eğitman, A. Planning and design of industrial engineering education quality. Comput. Ind. Eng. 1998, 35, 639–642. [Google Scholar] [CrossRef]
  8. Lam, K.; Zhao, X. An application of quality function deployment to improve the quality of teaching. Int. J. Qual. Reliab. Manag. 1998, 15, 389–413. [Google Scholar] [CrossRef]
  9. Chuang, P.T. Combining the analytic hierarchy process and quality function deployment for a location decision from a re-quirement perspective. Int. J. Adv. Manuf. Technol. 2011, 18, 842–849. [Google Scholar] [CrossRef]
  10. Partovi, F.Y. An analytic model for locating facilities strategically. Omega 2006, 34, 41–55. [Google Scholar] [CrossRef]
  11. Wang, H.; Xie, M.; Goh, T.N. A comparative study of the prioritization matrix method and the analytic hierarchy process technique in quality function deployment. Total Qual. Manag. 1998, 9, 421–430. [Google Scholar] [CrossRef]
  12. Partovi, F.Y. A quality function deployment approach to strategic capital budgeting. Eng. Econ. 1999, 44, 239–260. [Google Scholar] [CrossRef]
  13. Zakarian, A.; Kusiak, A. Forming teams: An analytic approach. IIEE Trans. 2010, 31, 85–97. [Google Scholar] [CrossRef] [Green Version]
  14. Hsiao, S.-W. Concurrent design method for developing a new product. Int. J. Ind. Ergon. 2002, 29, 41–55. [Google Scholar] [CrossRef]
  15. Kwong, C.K.; Bai, H. A fuzzy AHP approach to the determination of importance weights of customer requirements in quality function deployment. J. Intell. Manuf. 2002, 13, 367–377. [Google Scholar] [CrossRef]
  16. Myint, S. A framework of an intelligent quality function deployment (IQFD) for discrete assembly environment. Comput. Ind. Eng. 2003, 45, 269–283. [Google Scholar] [CrossRef]
  17. Bhattacharya, A.; Mukherjee, S.K. Integrating AHP with QFD for robot selection under requirement perspective. Int. J. Prod. Res. 2005, 43, 3671–3685. [Google Scholar] [CrossRef]
  18. Hanumaiah, N.; Ravi, B.; Mukherjee, N. Rapid hard tooling process selection using QFD-AHP methodology. J. Manuf. Technol. Manag. 2006, 17, 332–350. [Google Scholar] [CrossRef]
  19. Partovi, F.Y.; Epperly, J.M. A quality function deployment approach to task organization in peacekeeping force design. SocioEcon. Plan. Sci. 1999, 33, 131–149. [Google Scholar] [CrossRef]
  20. Partovi, F.Y.; Corredoira, R.A. Quality function deployment for the good of soccer. Eur. J. Oper. Res. 2019, 137, 642–656. [Google Scholar] [CrossRef]
  21. Cor, P.M. QFD not just a tool but a way of quality management. Int. J. Prod. Econ. 2001, 69, 151–159. [Google Scholar]
  22. B2B Market Characteristics-Comparison B2B Market to B2C Market. Available online: https://marketing-insider.eu/b2b-market-characteristics/ (accessed on 22 April 2020).
  23. Liu, Y.-C.; Chakrabarti, A.; Bligh, T. Towards an ‘ideal’ approach for concept generation. Des. Stud. 2003, 24, 341–355. [Google Scholar] [CrossRef]
  24. Chan, L.-K.; Wu, M.-L. A systematic approach to quality function deployment with a full illustrative example. Omega 2005, 33, 119–139. [Google Scholar] [CrossRef]
  25. Tontini, G. Integrating the Kano Model and QFD for Designing New Products. Total Qual. Manag. Bus. Excel. 2007, 18, 599–612. [Google Scholar] [CrossRef]
  26. Okudan, G.E.; Tauhid, S. Concept selection methods—A literature review from 1980 to 2008. Int. J. Des. Eng. 2008, 1, 243. [Google Scholar] [CrossRef]
  27. Pugh, S. Total Design: Integrated Methods for Successful Product Engineering. Engineering Technology and Design; Addison-Wesley: Boston, MA, USA, 1991; p. 78. [Google Scholar]
  28. Fung, R.Y.K.; Chen, Y.; Tang, J. A quality-engineering-based approach for conceptual product design. Int. J. Adv. Manuf. Technol. 2007, 32, 1064–1073. [Google Scholar] [CrossRef]
  29. Marsh, E.R.; Slocum, A.H.; Otto, K.N. Hierarchical Decision Making in Machine Design; Technical Report; MIT Precision Engineering Research Center: Cambridge, MA, USA, 1993; pp. 243–276. [Google Scholar]
  30. Mullens, M.A.; Armacost, R.L.; Nippani, R. A Two-Stage Approach to Concept Selection Using the Analytic Hierarchy Process. Int. J. Ind. Eng. 2015, 2, 199–208. [Google Scholar]
  31. Lee, W.; Lau, H.; Liu, Z.-Z.; Tam, S. A fuzzy analytic hierarchy process approach in modular product design. Expert Syst. 2001, 18, 32–42. [Google Scholar] [CrossRef]
  32. Thurston, D.L. A formal method for subjective design evaluation with multiple attributes. Res. Eng. Des. 1991, 3, 105–122. [Google Scholar] [CrossRef]
  33. De Felice, F. An integrated method of rough set. Int. J. Eng. Sci. Technol. 2020, 2, 25–38. [Google Scholar]
  34. Buonanno, M.A.; Mavris, D.N. A new method for aircraft concept selection using multi-criteria interactive genetic algorithms. In Proceedings of the 43rd AIAA Aerospace Sciences Meeting and Exhibit, Reno, NV, USA, 10–15 January 2005. [Google Scholar]
  35. Zhu, G.-N.; Hu, J.; Qi, J.; Gu, C.-C.; Peng, Y.-H. An integrated AHP and VIKOR for design concept evaluation based on rough number. Adv. Eng. Inform. 2015, 29, 408–418. [Google Scholar] [CrossRef]
  36. Salhieh, S.M.; Al-Harris, M.Y. New product concept selection: An integrated approach using data envelopment analysis (DEA) and conjoint analysis (CA). Int. J. Eng. Technol. 2014, 3, 44–55. [Google Scholar] [CrossRef] [Green Version]
  37. Saaty, T.L. The Analytic Hierarchy Process: Planning, Priority Setting, Resource Allocation; Advanced Book Program; McGraw-Hill: New York, NY, USA, 1980; pp. 456–476. [Google Scholar]
  38. Saaty, T.L. Decision Making with Independence and Feedback: The Analytic Network Process; RWS Publications: Pittsburgh, PA, USA, 2011; p. 67. [Google Scholar]
  39. Saaty, T. Theory and Applications of the Analytic Network Process: Decision Making with Benefits, Opportunities, Costs, and Risks; RWS Publications: Pittsburgh, PA, USA, 2015; p. 456. [Google Scholar]
  40. Talib, F.; Rahman, Z.; Qureshi, M. Prioritising the practices of total quality management: An analytic hierarchy process analysis for the service industries. Total Qual. Manag. Bus. Excel. 2011, 22, 1331–1351. [Google Scholar] [CrossRef]
  41. Yu, P.; Lee, J.H. A hybrid approach using two-level SOM and combined AHP rating and AHP/DEA-AR method for selecting optimal promising emerging technology. Expert Syst. Appl. 2013, 40, 300–314. [Google Scholar] [CrossRef]
  42. Jeon, J.; Kim, C.; Lee, H. Measuring efficiency of total productive maintenance (TPM): A three-stage data envelopment analysis (DEA) approach. Total Qual. Manag. Bus. Excel. 2011, 22, 911–924. [Google Scholar] [CrossRef]
  43. Andersen, P.; Petersen, N.C. A Procedure for Ranking Efficient Units in Data Envelopment Analysis. Manag. Sci. 1993, 39, 1261–1264. [Google Scholar] [CrossRef]
  44. Charnes, A.; Cooper, W.W.; Rhodes, E. Measuring the efficiency of decision making units. Eur. J. Oper. Res. 1978, 2, 429–444. [Google Scholar] [CrossRef]
  45. Cooper, W.W.; Seiford, L.M.; Tone, K.; Zhu, J. Some models and measures for evaluating performances with DEA: Past accomplishments and future prospects. J. Prod. Anal. 2007, 28, 151–163. [Google Scholar] [CrossRef]
  46. Banker, R.D.; Charnes, A.; Cooper, W.W. Some Models for Estimating Technical and Scale Inefficiencies in Data Envelopment Analysis. Manag. Sci. 1984, 30, 1078–1092. [Google Scholar] [CrossRef] [Green Version]
  47. Chakraborty, T.; Ghosh, T.; Dan, P.K. Application of analytic hierarchy process and heuristic algorithm in solving vendor selection problem. Bus. Intell. J. 2011, 4, 167–177. [Google Scholar]
  48. Li, Y.; Tang, J.; Luo, X.; Xu, J. An integrated method of rough set, Kano’s model and AHP for rating customer requirements’ final importance. Expert Syst. Appl. 2009, 36, 7045–7053. [Google Scholar] [CrossRef]
  49. Limperich, D.; Braun, M.; Schmitz, G.; Prölß, K. System Simulation of Automotive Refrigeration Cycles. In Proceedings of the Fourth International Modelica Conference, Hamburg, Germany, 7–8 March 2005; pp. 193–199. [Google Scholar]
  50. Ramanathan, R. Evaluating the comparative performance of countries of the Middle East and North Africa: A DEA application. SocioEcon. Plan. Sci. 2006, 40, 156–167. [Google Scholar] [CrossRef]
  51. Avkiran, N.K.; Rowlands, T. How to better identify the true managerial performance: State of the art using DEA. Omega 2008, 36, 317–324. [Google Scholar] [CrossRef] [Green Version]
  52. Lin, M.-C.; Wang, C.-C.; Chen, M.-S.; Chang, C.A. Using AHP and TOPSIS approaches in customer-driven product design process. Comput. Ind. 2008, 59, 17–31. [Google Scholar] [CrossRef]
  53. Murillo-Zamorano, L.R. Economic Efficiency and Frontier Techniques. J. Econ. Surv. 2004, 18, 33–77. [Google Scholar] [CrossRef] [Green Version]
  54. Tone, K. A slacks-based measure of efficiency in data envelopment analysis. Eur. J. Oper. Res. 2001, 130, 498–509. [Google Scholar] [CrossRef] [Green Version]
  55. Lin, C.Y.; Gupta, S.; Okudan, G.E. An Improved Concept Selection Approach for Design Decision-Making. In Proceedings of the Industrial Engineering Research Conference, Vancouver, BC, Canada, 21 April 2018; pp. 78–89. [Google Scholar]
  56. Ullah, R.; Zhou, D.Q.; Zhou, P. Design Concept Evaluation and Selection: A Decision Making Approach. Appl. Mech. Mater. 2012, 155, 1122–1126. [Google Scholar] [CrossRef]
  57. Lee, J.H.; Shvetsova, O.A. The Impact of VR Application on Student’s Competency Development: A Comparative Study of Regular and VR Engineering Classes with Similar Competency Scopes. Sustainability 2019, 11, 2221. [Google Scholar] [CrossRef] [Green Version]
  58. Wasserman, G.S. On how to prioritize design requirements during the qfd planning process. IIEE Trans. 1993, 25, 59–65. [Google Scholar] [CrossRef]
  59. Lyman, D. Deployment normalization. In Proceedings of the Transactions from the 2nd Symposium on Quality Function Deployment, Automotive Division of the American Society for Quality Control, Dearborn, MI, USA, 2 March 1990; pp. 307–315. [Google Scholar]
  60. Chen, L.-H.; Chen, C.-N. Normalisation models for prioritising design requirements for quality function deployment processes. Int. J. Prod. Res. 2013, 52, 299–313. [Google Scholar] [CrossRef]
  61. Lee, S.; Shvetsova, O. Optimization of the Technology Transfer Process using Gantt Charts and Critical Path Analysis Flow Diagrams: Case Study of the Korean Automobile Industry. Processes 2019, 7, 917. [Google Scholar] [CrossRef] [Green Version]
Figure 1. Framework of the proposed method. Source: made by authors.
Applsci 11 02681 g001
Figure 2. Circulation of refrigerant in the automotive A/C system. Source: made by authors.
Applsci 11 02681 g002
Figure 3. Evaporator picture (left) and schematic of fluid flow (middle, right). Source: Limperich, Braun, Schmitz and Prölß. System Simulation of Automotive Refrigeration Cycles. Proceedings of the Fourth International Modelica Conference, Hamburg–Harburg, 2015, pp. 193–99 [49].
Applsci 11 02681 g003
Figure 4. Quadrant analysis for design concept management.
Applsci 11 02681 g004
Figure 5. Three degrees of customer’s satisfaction.
Applsci 11 02681 g005
Table 1. Definition and application of product concept’s development process.
Field of ApplicationAdvantages and Disadvantages (Limitations)
QFDProduct design+ A systematic way of obtaining information and presenting it,
Manufacturing+ Good strategic driver for the design process and production process,
Short-term/Long-term decisions- Requires the Right Organizational Environment,
- Less Adaptable to Changing Demand
AHPAny area of decisions+ Wide application area,
Some former and successive studies+ Uses both the linguistic assessments and numerical values for the alternative selection problem,
Long-term decisions- The computational requirement is tremendous even for a small problem,
DEACalculation the relative efficiencies of a group of decision-making units+ Not assuming a particular functional form/shape for the frontier,
Benchmarking in operations management+ Can be used as hybrid method, this allows a best-practice relationship between multiple outputs and multiple inputs to be estimated,
Short-term decisions (problem-oriented)- Difficult for use,
- Requires secondary data
Source: author’s survey.
Table 2. Quality function deployment (QFD) for the air conditioning system (A/C system) evaporator.
Engineering Specifications (1,3,5)
Customer Weights (1,3,5)Number of ComponentsProduct WidthProduct HeightProduct ThicknessNumber of TubesUnit Tube VolumeNRPH (a)Unit Fin VolumeFPDM (b)
Customer requirementsSmaller size maintaining the same heat-exchange.3155531333
Silent operation and no noise.1 1 5
Good operational efficiency.1 1 35
Low weight for fuel efficiency.33 33 3
Low price531113 3
Raw score272120213315141829
Relative weights14%11%10%11%17%8%7%9%15%
Unitpcsmmmmmmpcscm3holescm3pcs
Current design110282295356013.3750.267
Competitor X14830823444869.4534.975
Competitor Y14927629541785.21947.576
Note: (a) the number of refrigerant path holes in a tube (NRPH). (b) the number of fin per dm (FPDM).
Table 3. Rating levels to evaluate concept competitiveness.
LevelsHEXdP AirdP RefWeightCost
96 < t ≤ 8−24 ≤ t < −18−32 ≤ t < −24−12 ≤ t < −9−16 ≤ t < −12
84 < t ≤ 6−18 ≤ t < −12−24 ≤ t < −16−9 ≤ t < −6−12 ≤ t < −8
72 < t ≤ 4−12 ≤ t < −6−16 ≤ t < −8−6 ≤ t < −3−8 ≤ t < −4
60 < t ≤ 2−6 ≤ t < 0−8 ≤ t < 0−3 ≤ t < 0−4 ≤ t < 0
5Current designCurrent designCurrent designCurrent designCurrent design
4−2 ≤ t < 00 < t ≤ 60 < t ≤ 80 < t ≤ 30 < t ≤ 4
3−4 ≤ t < −26 < t ≤ 128 < t ≤ 163 < t ≤ 64 < t ≤ 8
2−6 ≤ t < −412 < t ≤ 1816 < t ≤ 246 < t ≤ 98 < t ≤ 12
1−8 ≤ t < −618 < t ≤ 2424 < t ≤ 329 < t ≤ 1212 < t ≤ 16
Table 4. Nine-point scales to assess the inputs to design development efficiency.
Quality Control Burden (QCB)Manufacturing Burden (MFGB)Development Cost Burden (DCB)
9Extremely more demanding than current design9Extremely more difficult than current design9Extremely more costly than current design
7More demanding than current design7More difficult than current design7More costly than current design
5Equal to current design5Equal to current design5Equal to current design
3Less demanding than current design3Easier than current design3Less costly than current design
1Extremely less demanding than current design1Extremely easier than current design1Extremely less costly than current design
2,4,6,8Intermediate values between the two adjacent judgment2,4,6,8Intermediate values between the two adjacent judgment2,4,6,8Intermediate values between the two adjacent judgment
Source: made by authors.
Table 5. Design development efficiency scores and rankings.
Input CriteriaOutput CriteriaResult
QCBMFGBDCBHEXRdP air (a)RdP ref (b)RW (c)RC (d)DEAVeffRank
Current design555429210.8271.9238.5147.3681.0331.0005
Competitor X53542588.9292.7328.0657.6611.1131.0772
Competitor Y768460812.3461.4848.4327.1270.7490.7257
Concept A44544249.8412.4559.2688.4021.0871.0523
Concept B43643759.2092.5699.5598.5181.1401.1031
Concept C546448211.7322.0197.8467.6861.0571.0234
Concept D666447311.4681.5808.3717.4160.8210.7946
Concept E67842329.8812.2908.2377.4480.6190.5998
Mean5.34.86.1439310.5292.1318.5377.7030.9530.922
Stdev1.01.41.21211.1680.4280.5480.4670.1830.177
Note: (a) RdP air denotes the reciprocal of the dP air value and multiply 100. (b) RdP ref denotes the reciprocal of the dP ref value. (c) RW denotes the reciprocal of the weight and multiplied by 10,000. (d) RC denotes the reciprocal of the cost and multiply 100. Source: made by authors.
Table 6. Combined scores and quadrant analysis results.
Concept CompetitivenessDevelopment EfficiencyCombined Score
VcompWtCompRankVeffWtEffRankVcombRankQuadrant
(Combined weights) (0.541) (0.459)
Current design1.0000.54161.0000.45951.0006Origin
Competitor X0.9400.50981.0770.49421.0035IV
Competitor Y1.1190.60650.7250.33370.9387II
Concept A1.5580.84311.0520.48331.3262I
Concept B1.5300.82821.1030.50611.3341I
Concept C1.2760.69131.0230.46941.1603I
Concept D1.2110.65540.7940.36461.0204II
Concept E0.9570.51870.5990.27580.7938III
Mean 0.649 0.423 1.072
Stdev 0.123 0.081 0.177
Source: made by authors.
Publisher’s Note: MDPI stays neutral with regard to jurisdictional claims in published maps and institutional affiliations.

