
Benchmarking Numerical Methods for Impact and Cratering Applications

 , , and
Abstract
:1. Introduction
2. Computational Methods
2.1. FLAG—Hydrodynamics Approach
2.2. HOSS—Finite-Discrete Element Method
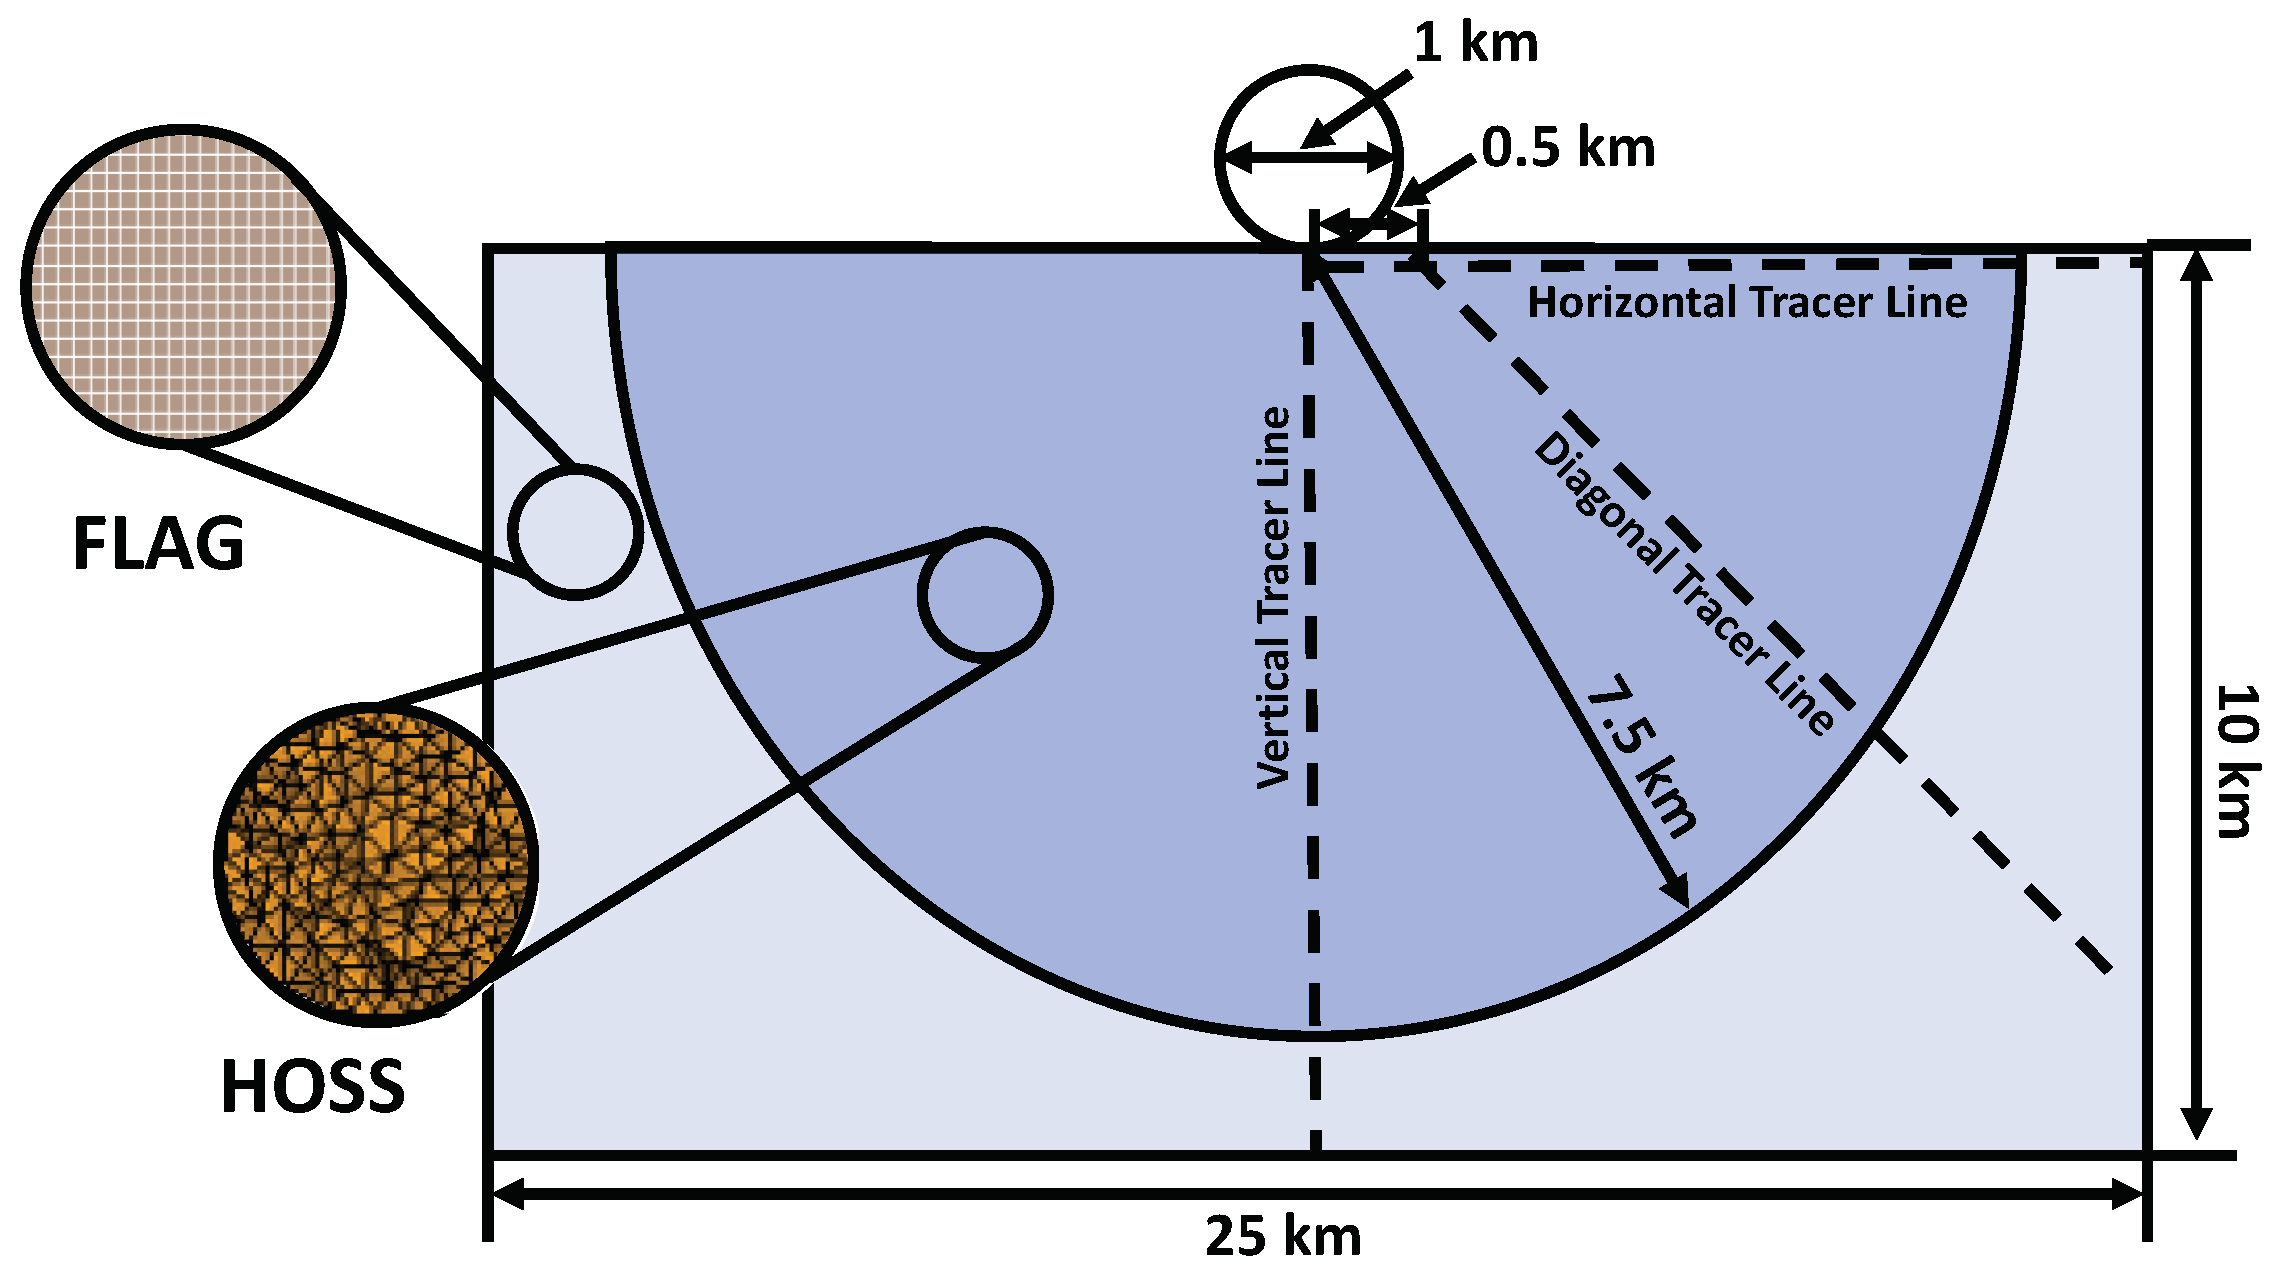
3. Code Verification Problem
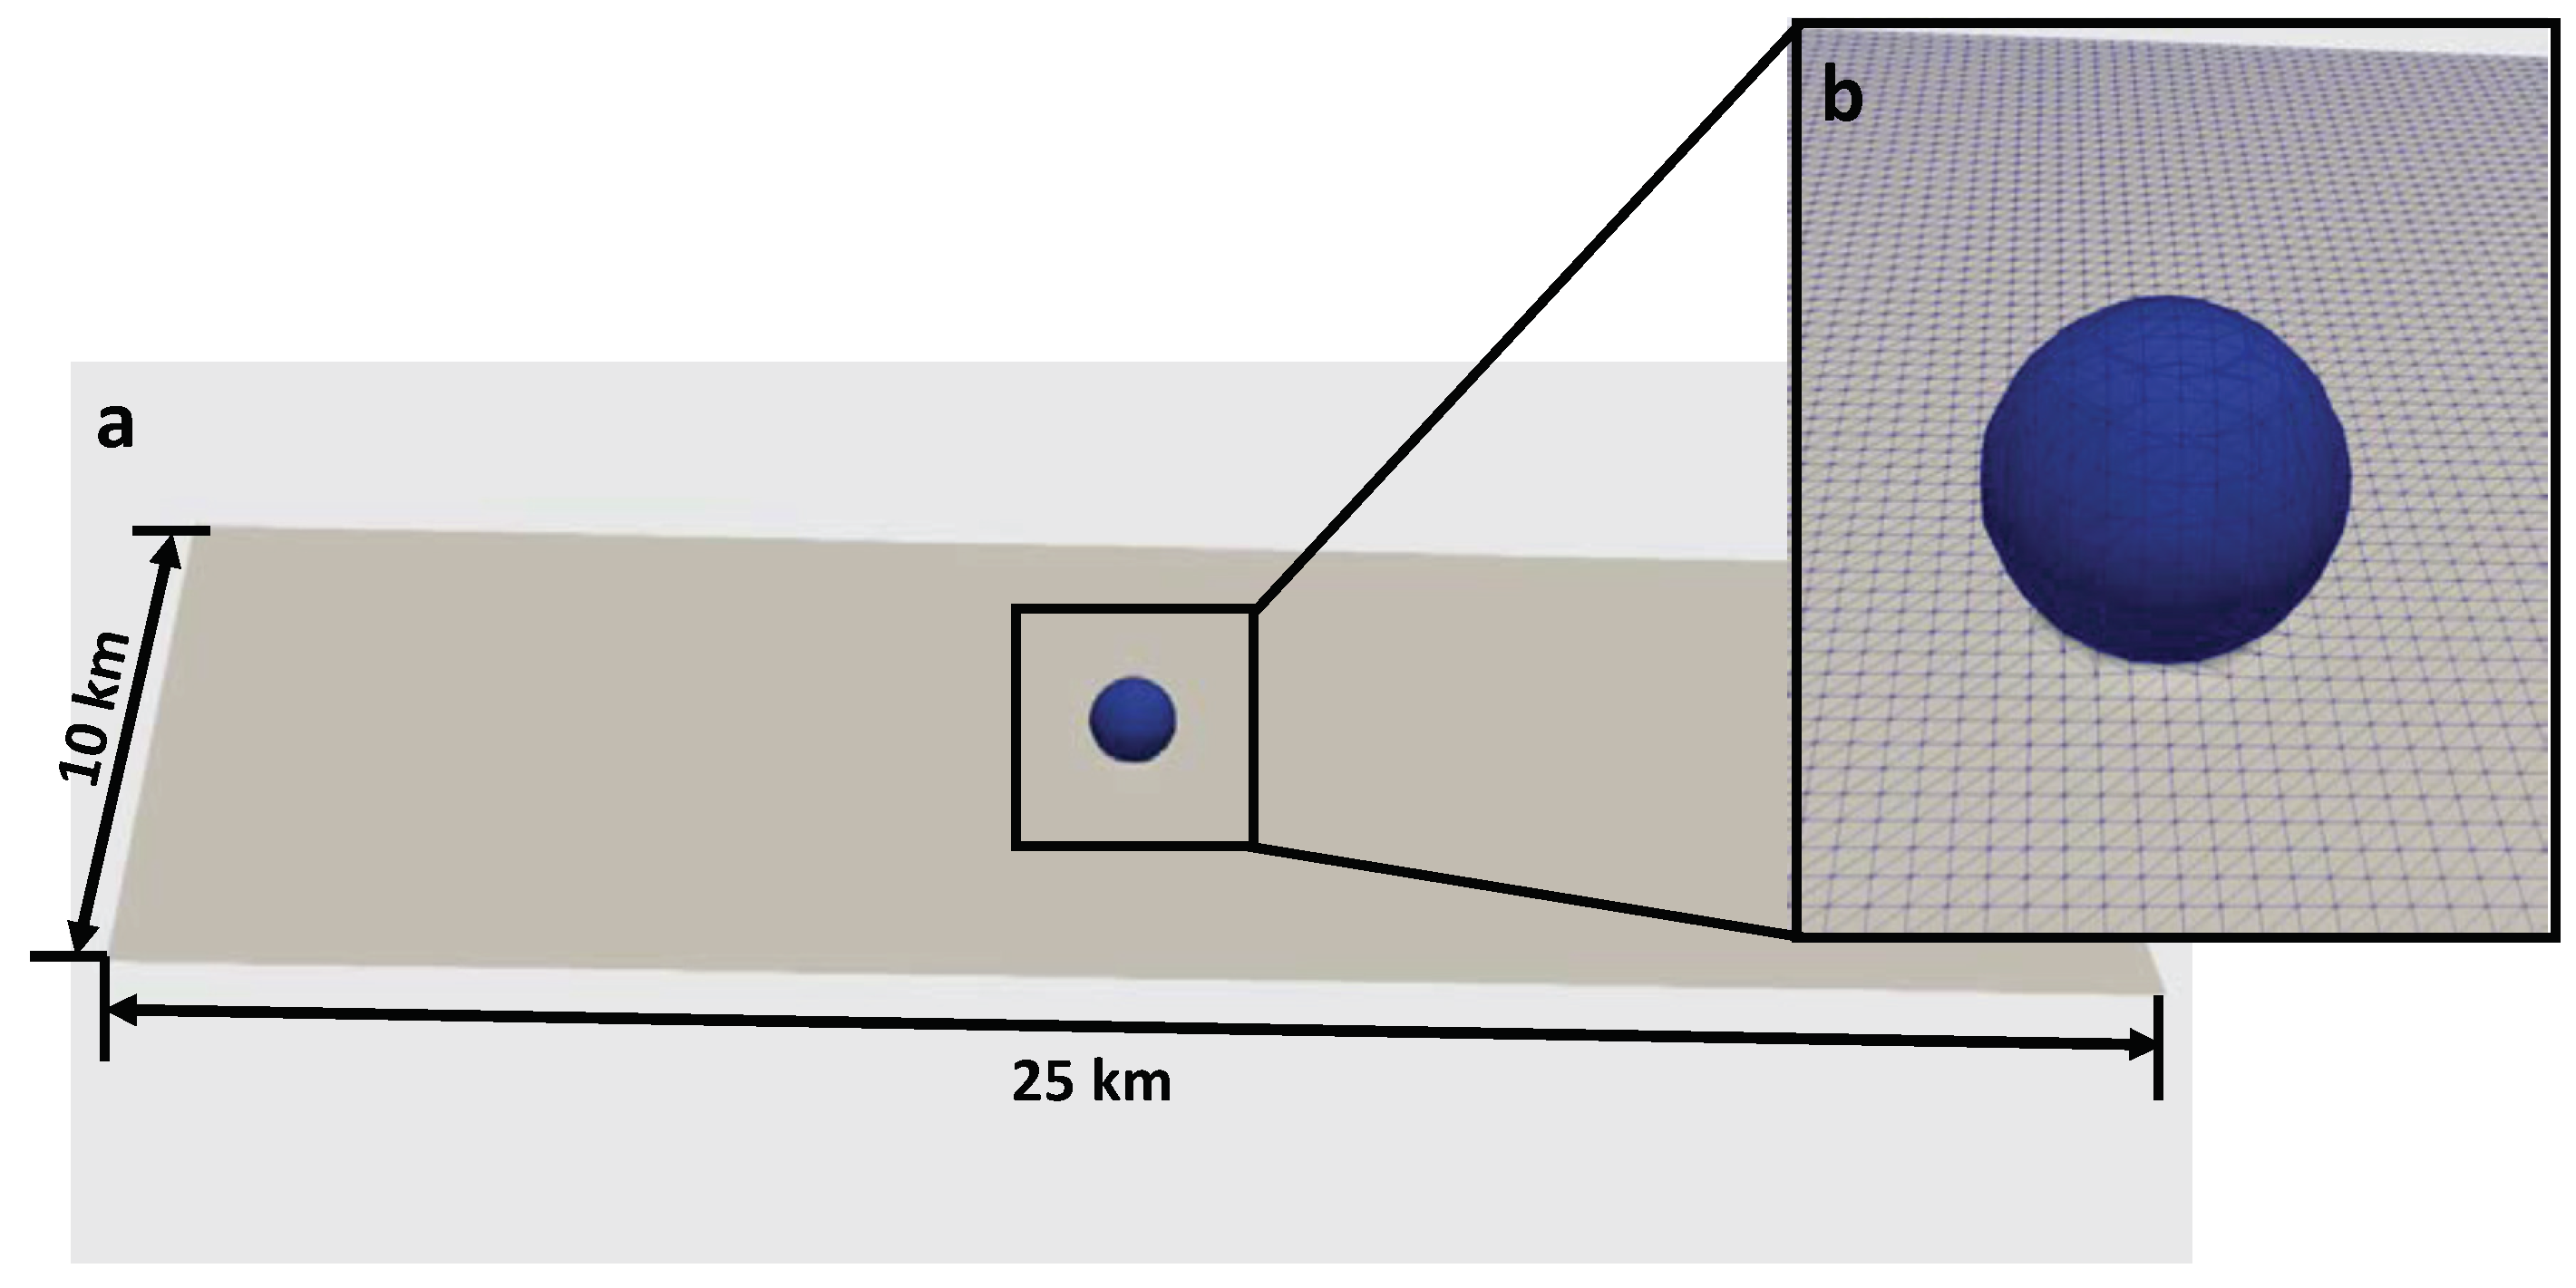
3.1. FLAG Setup
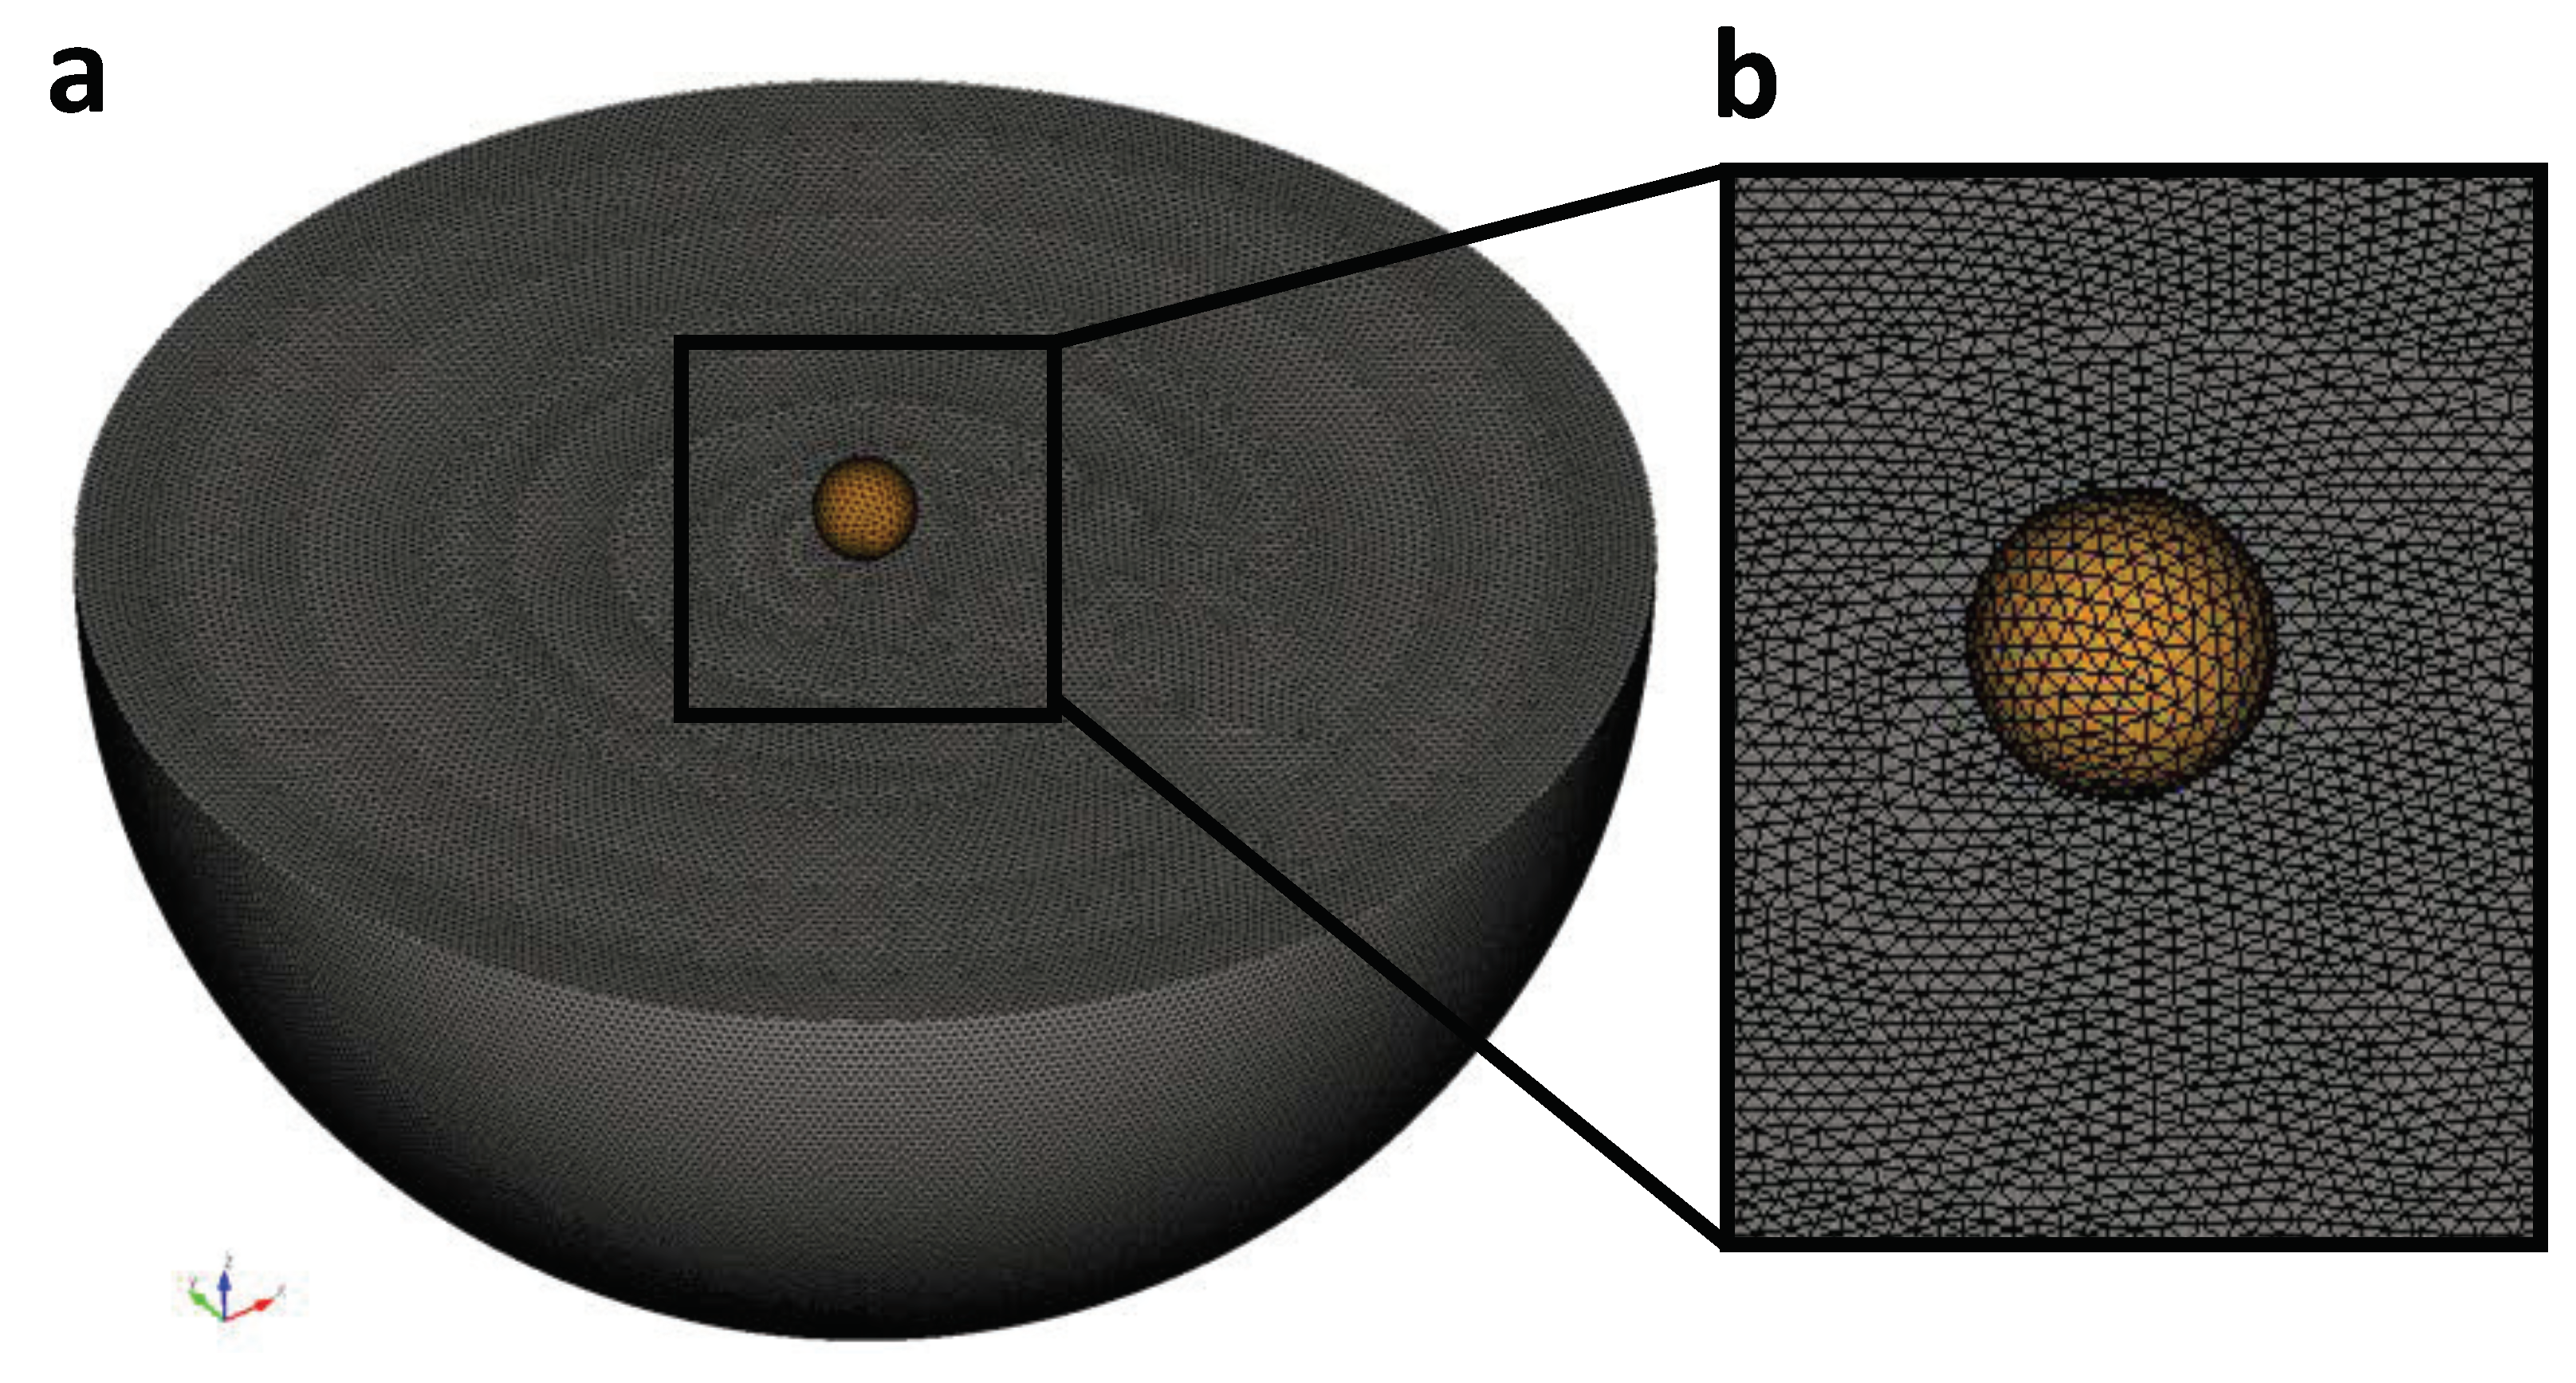
3.2. HOSS Setup
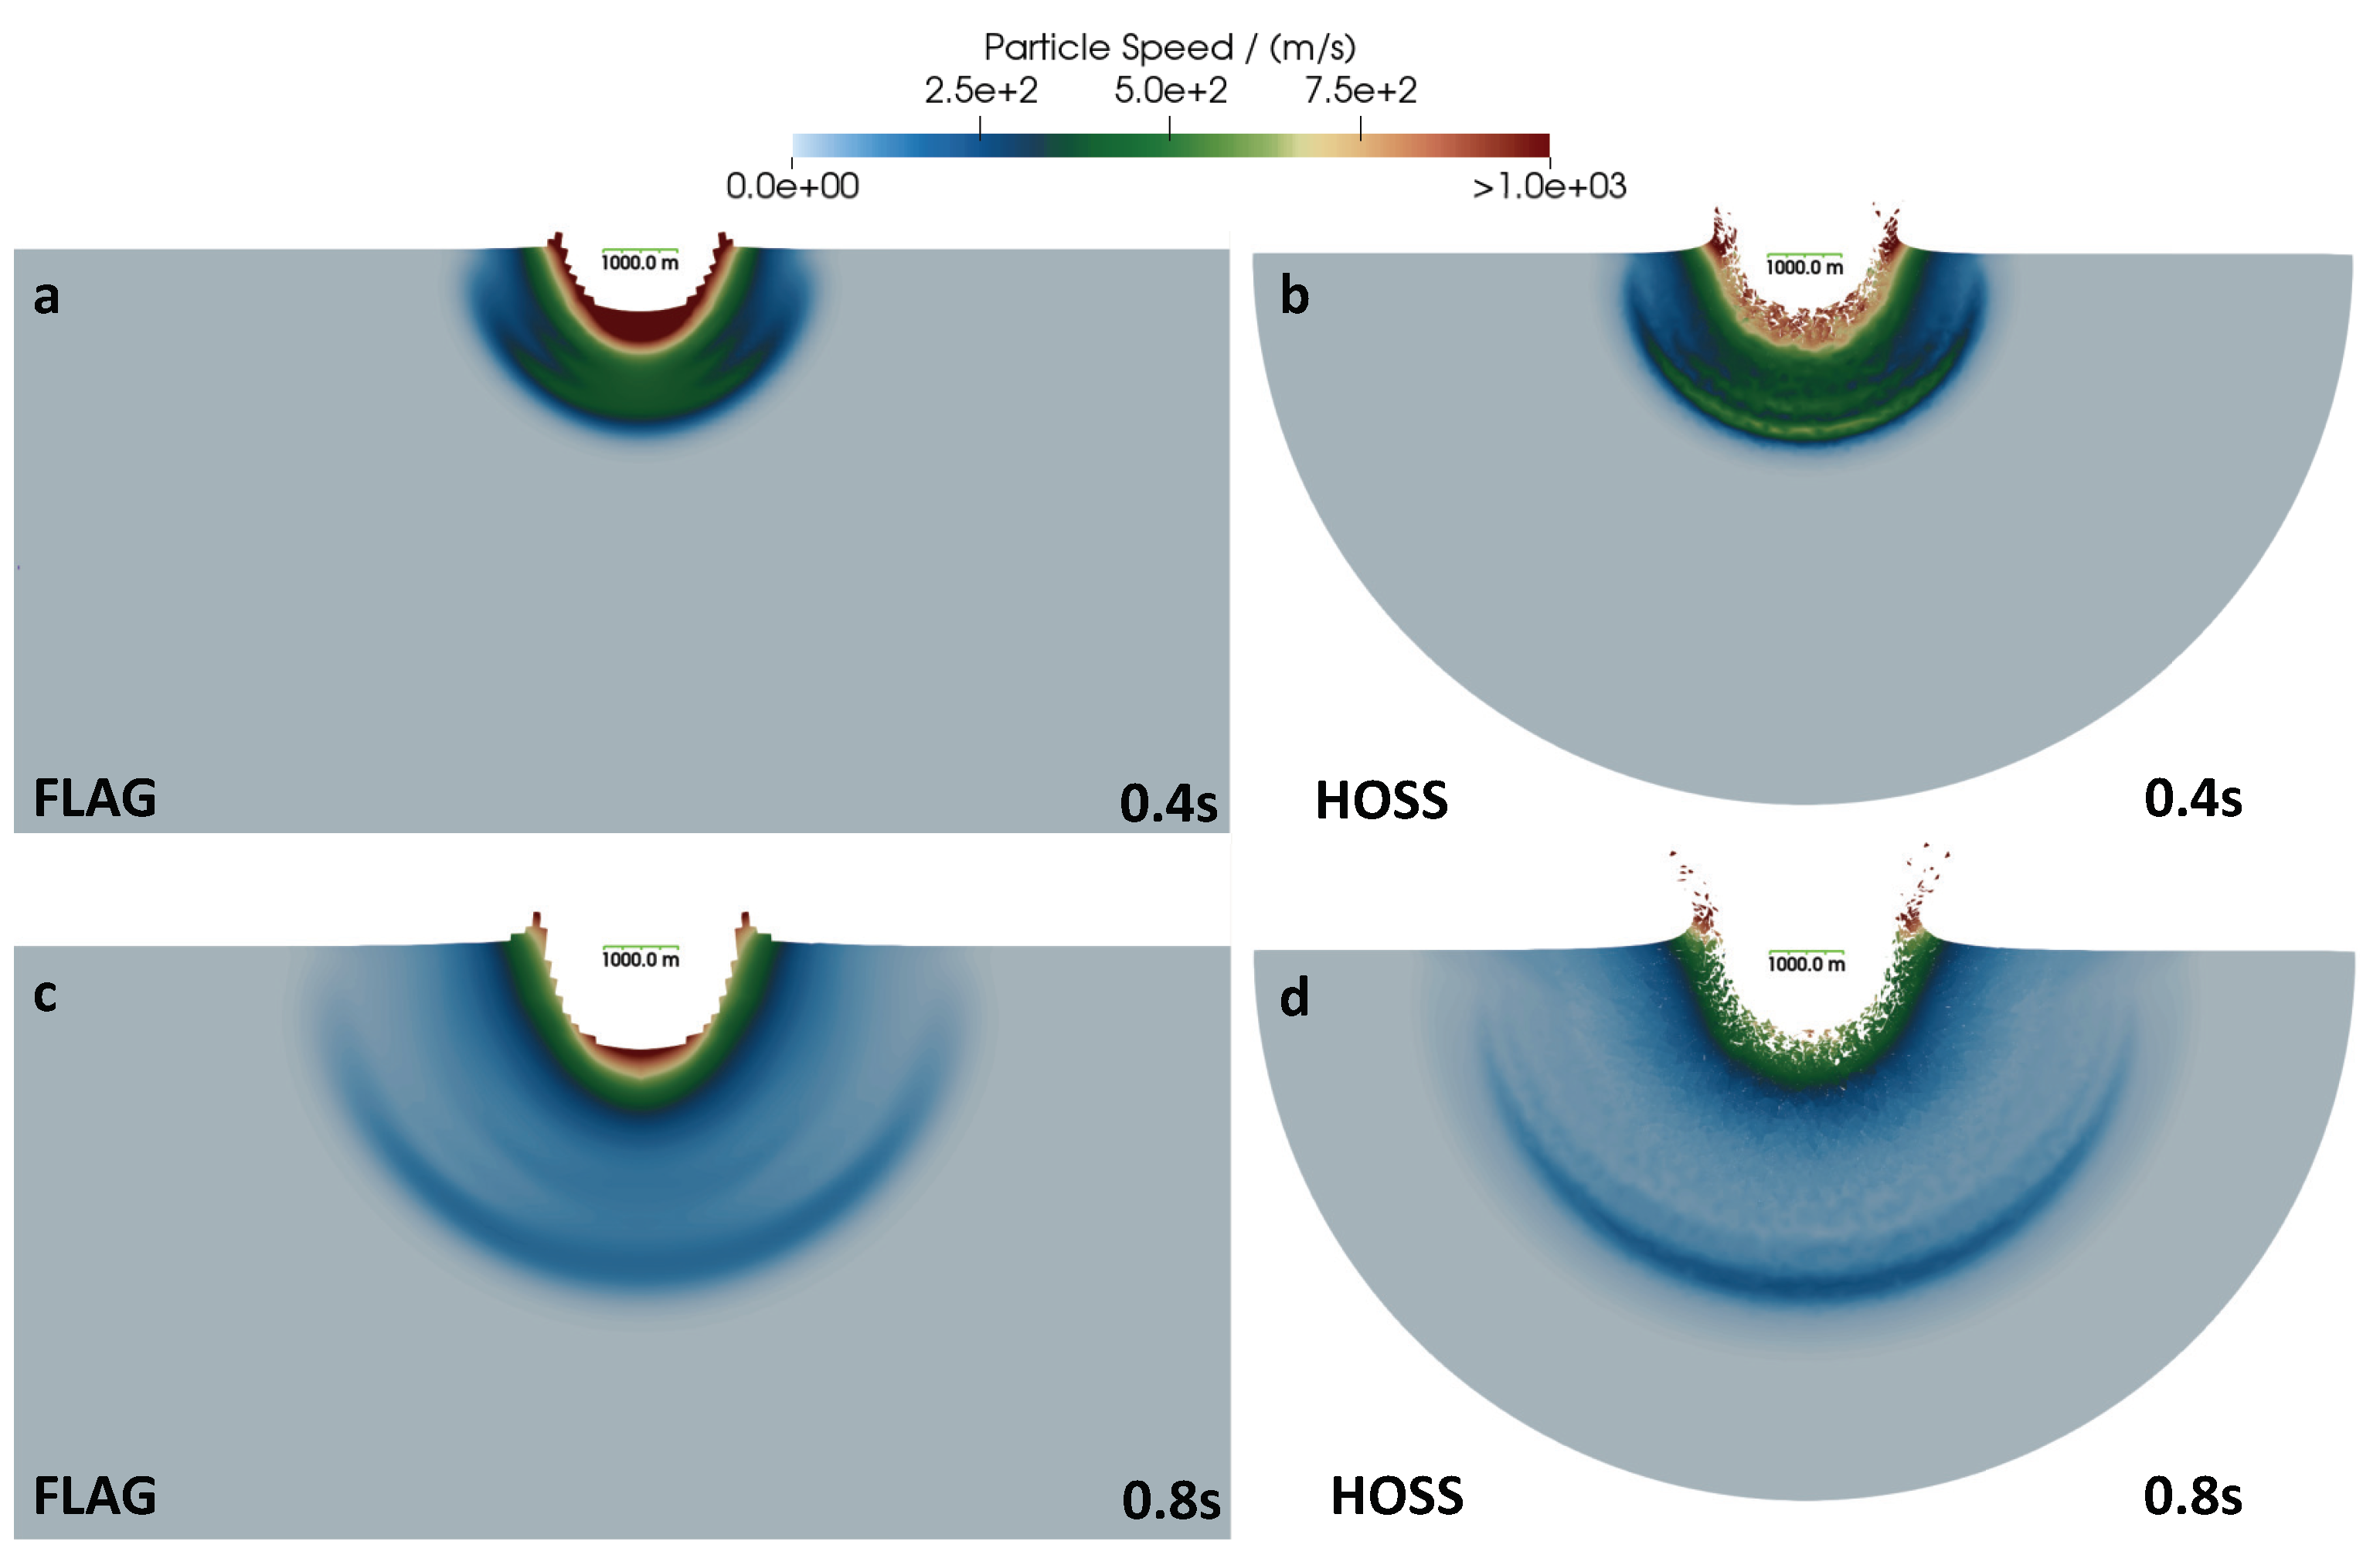
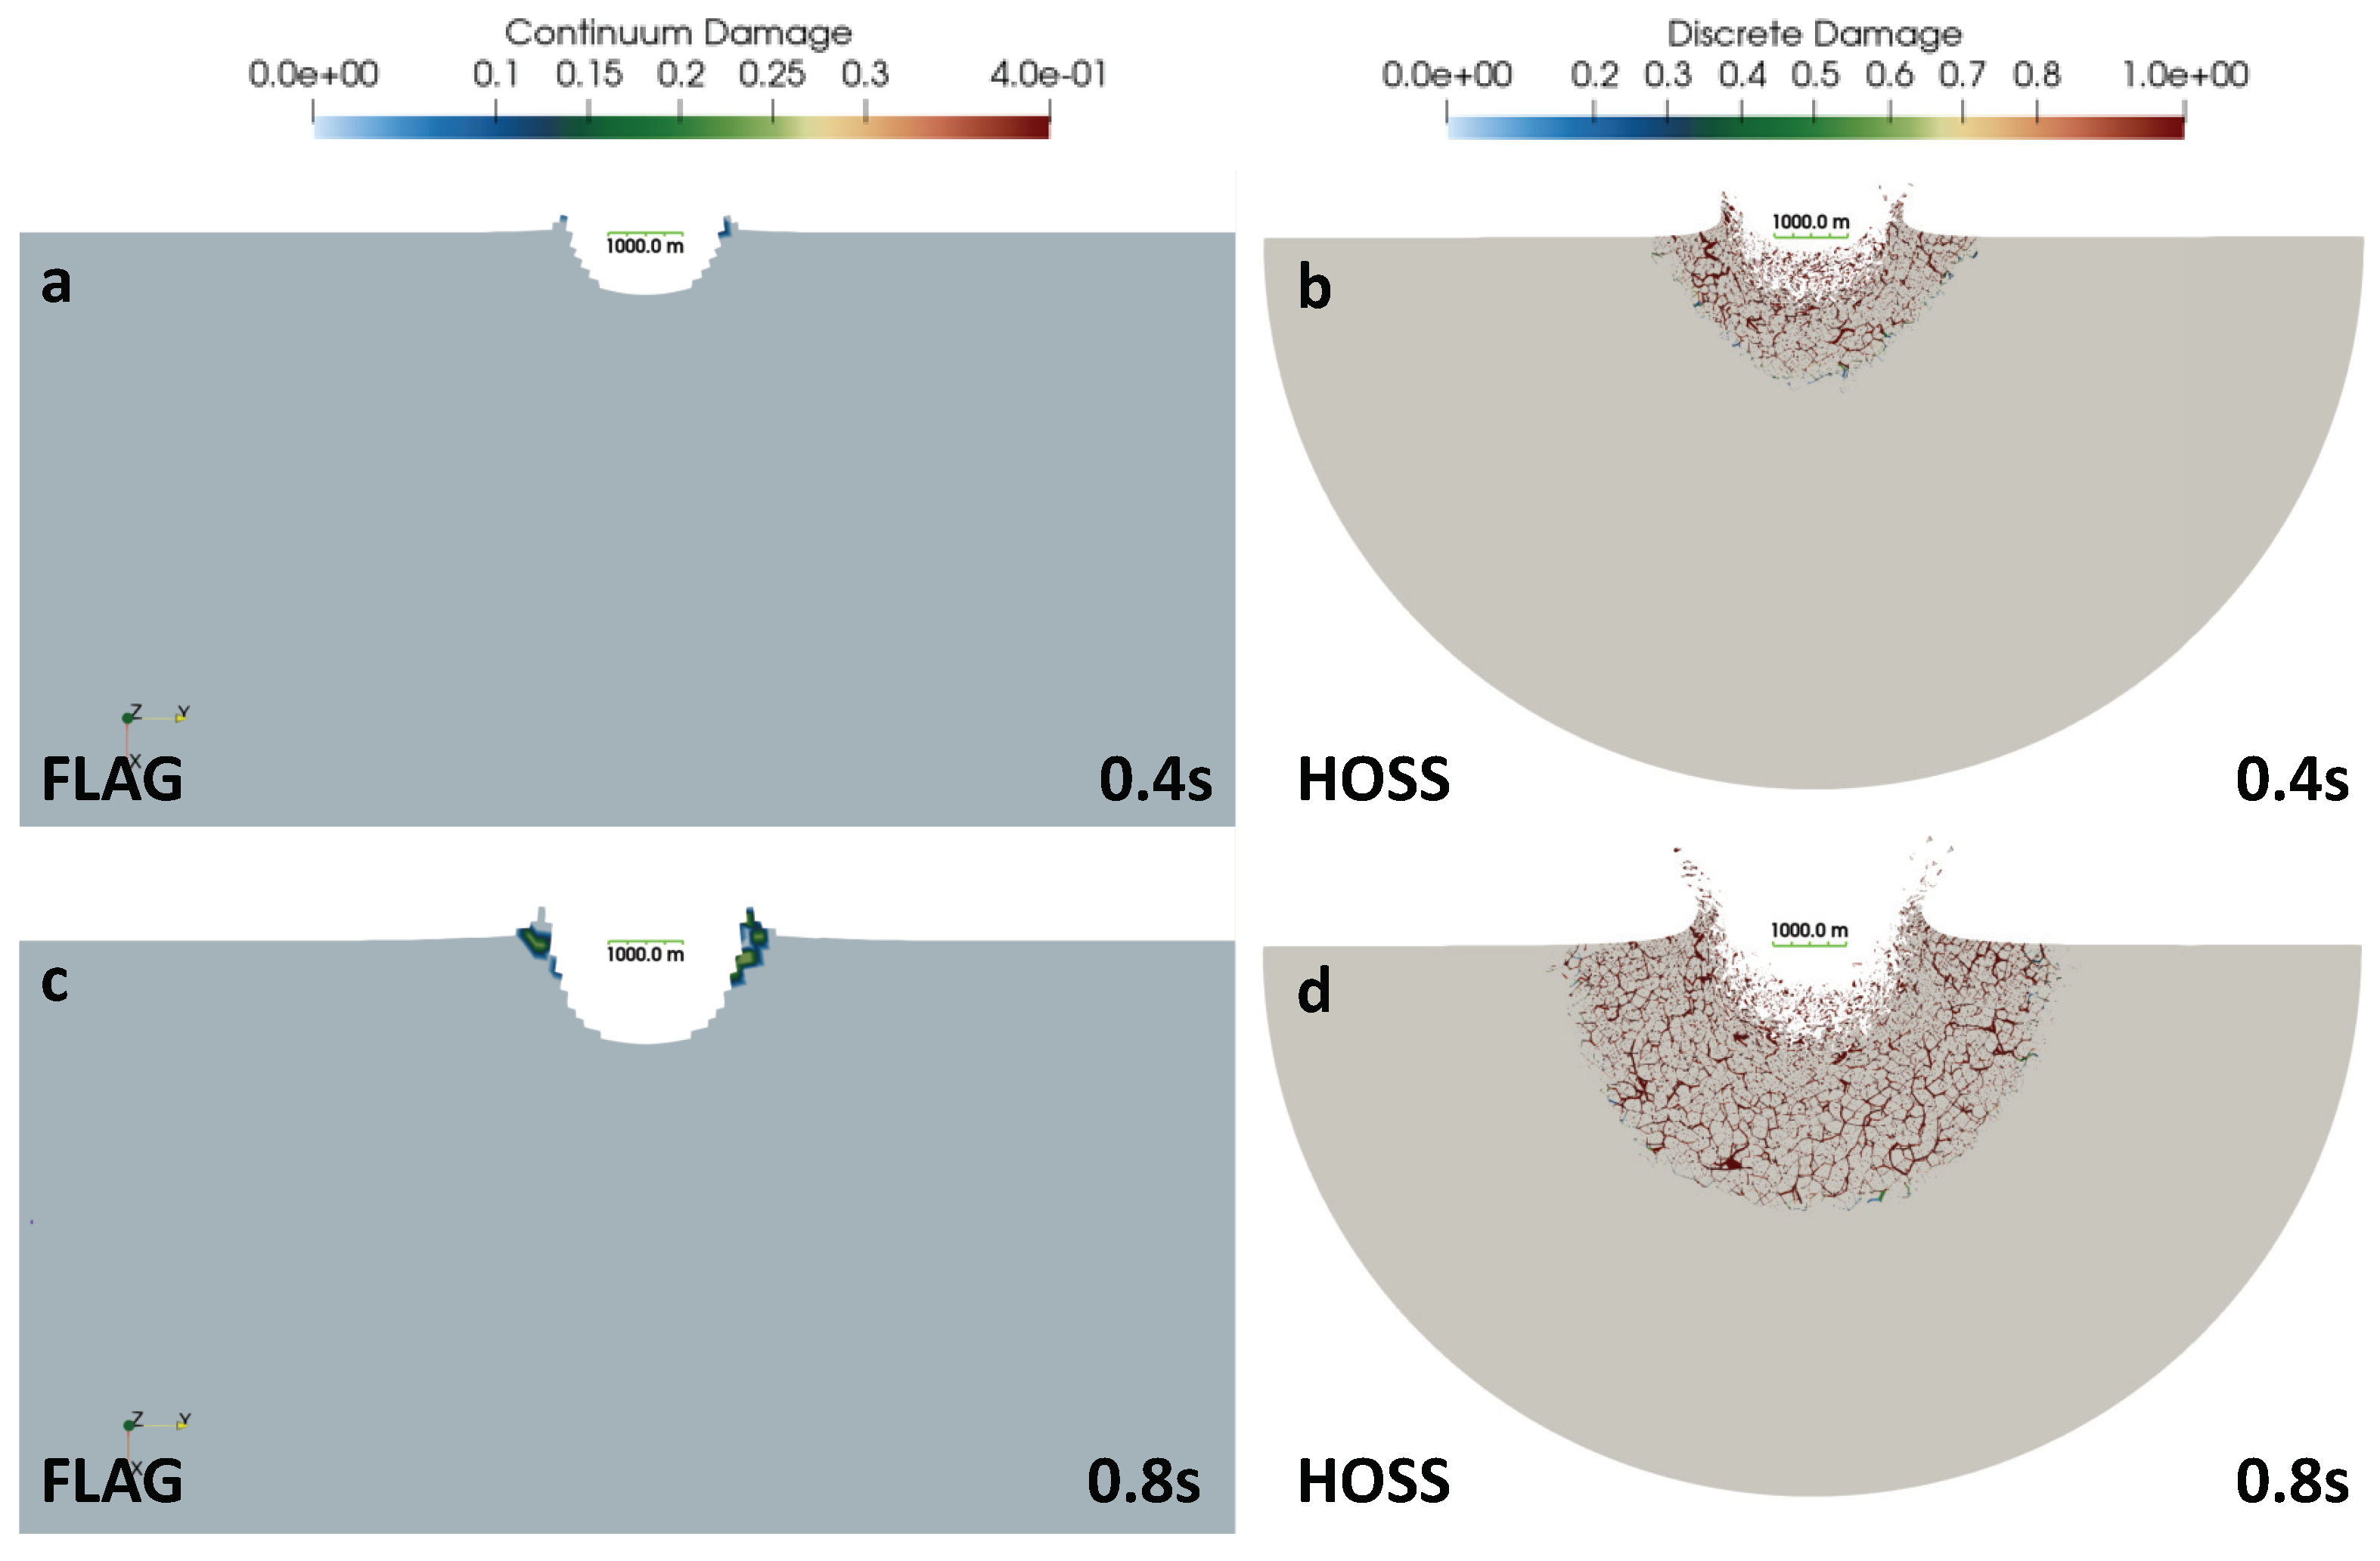
4. Results and Discussion
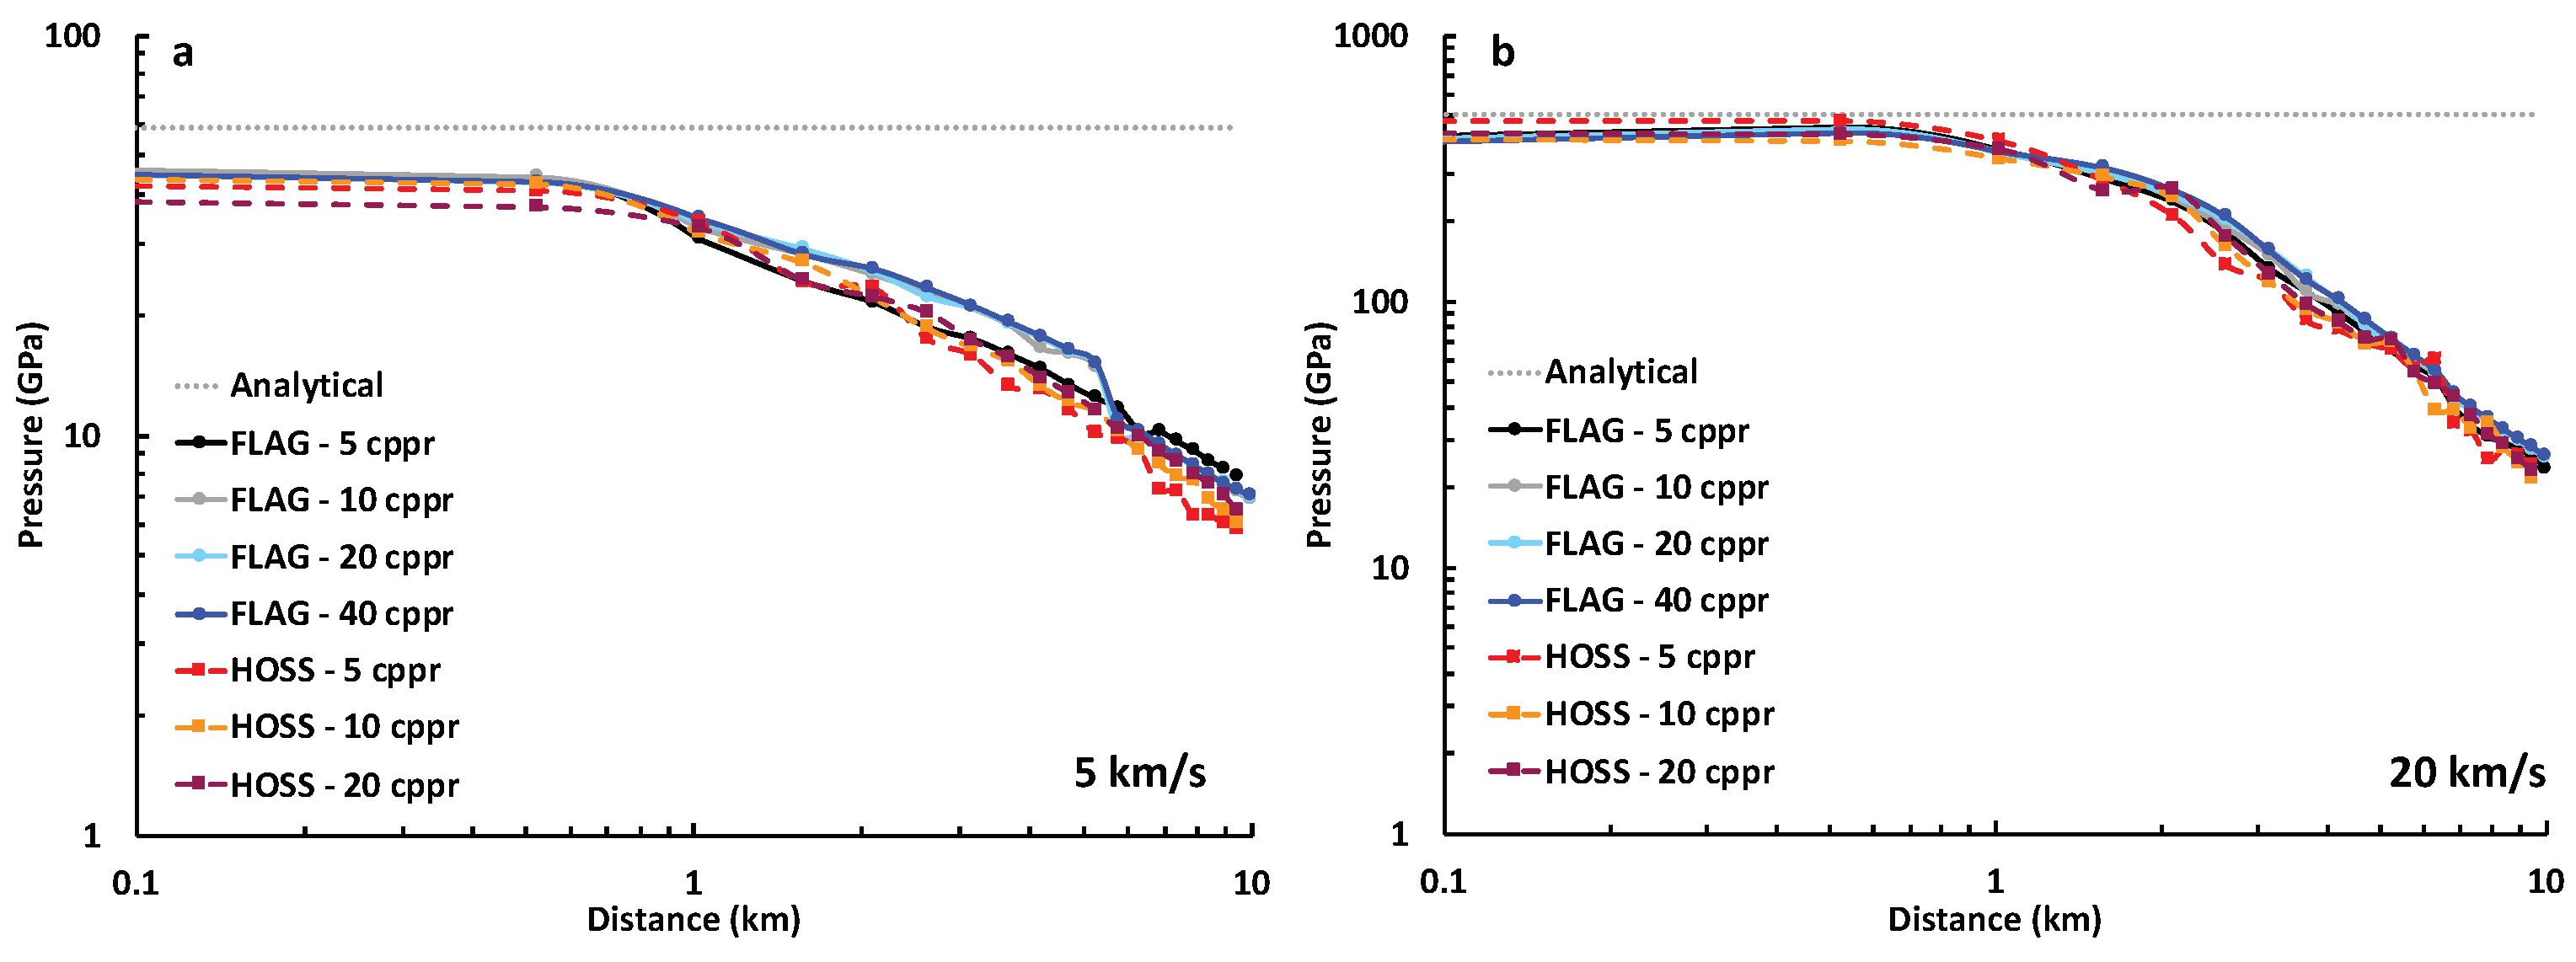
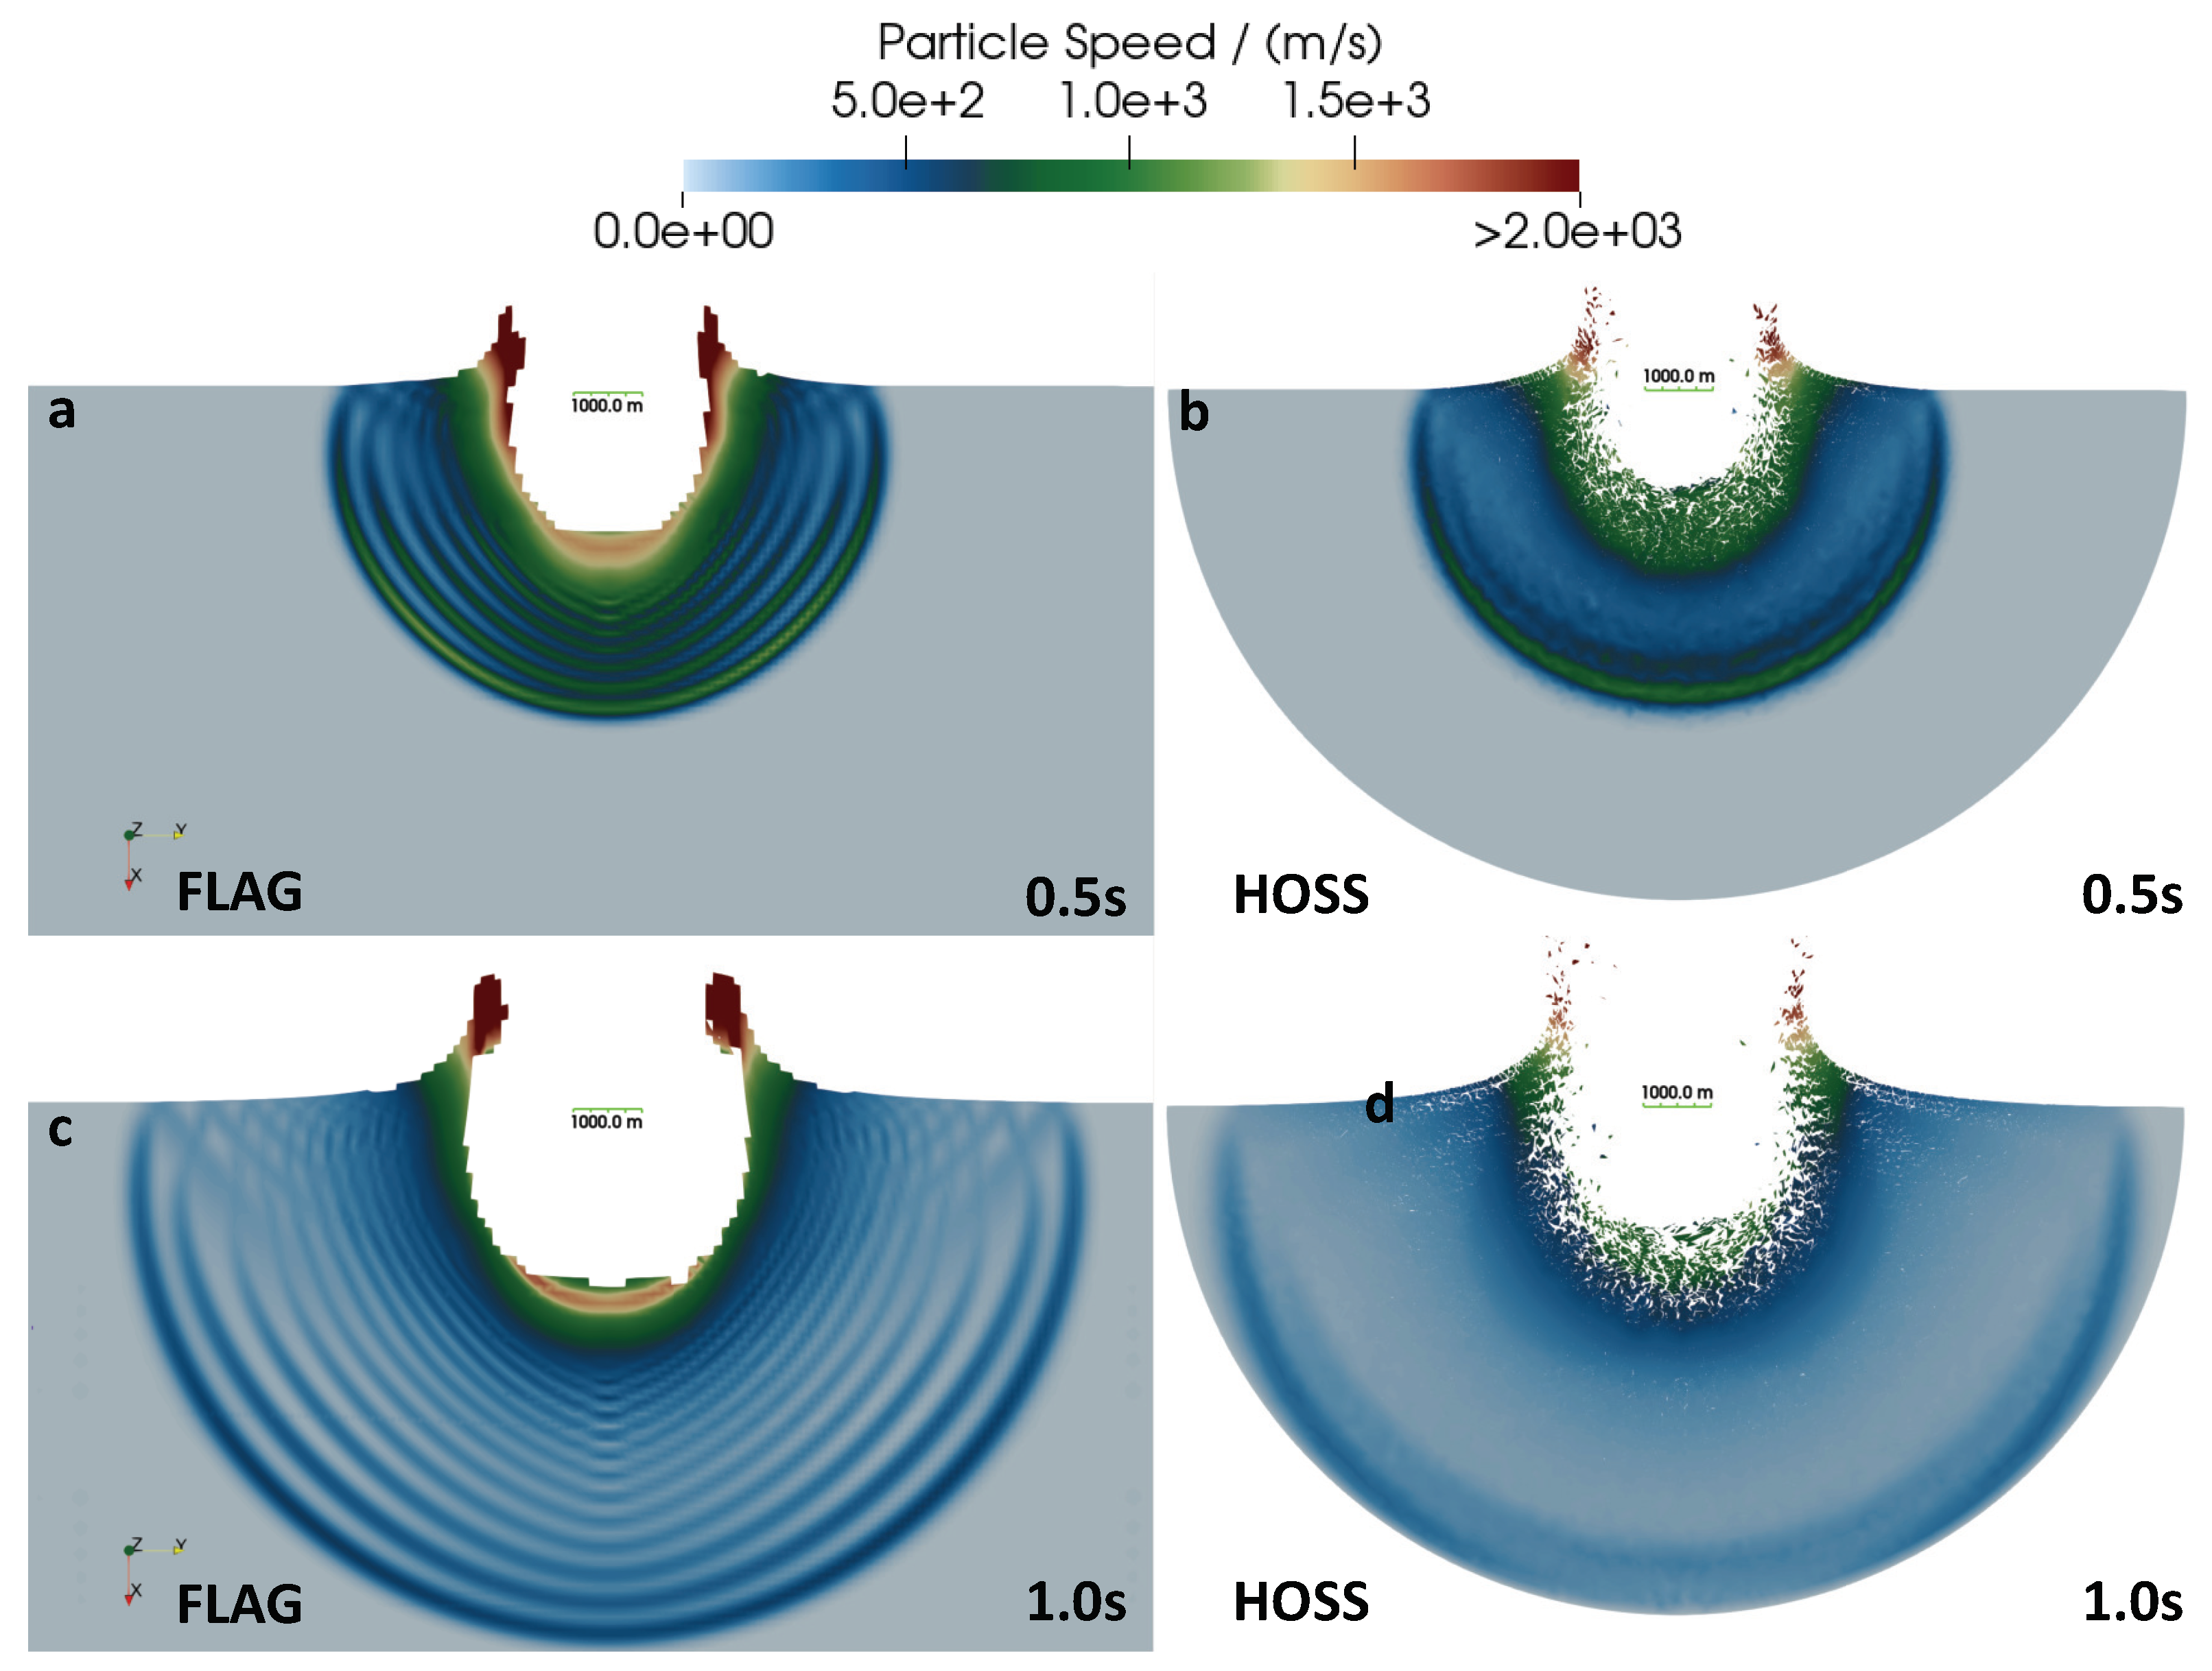
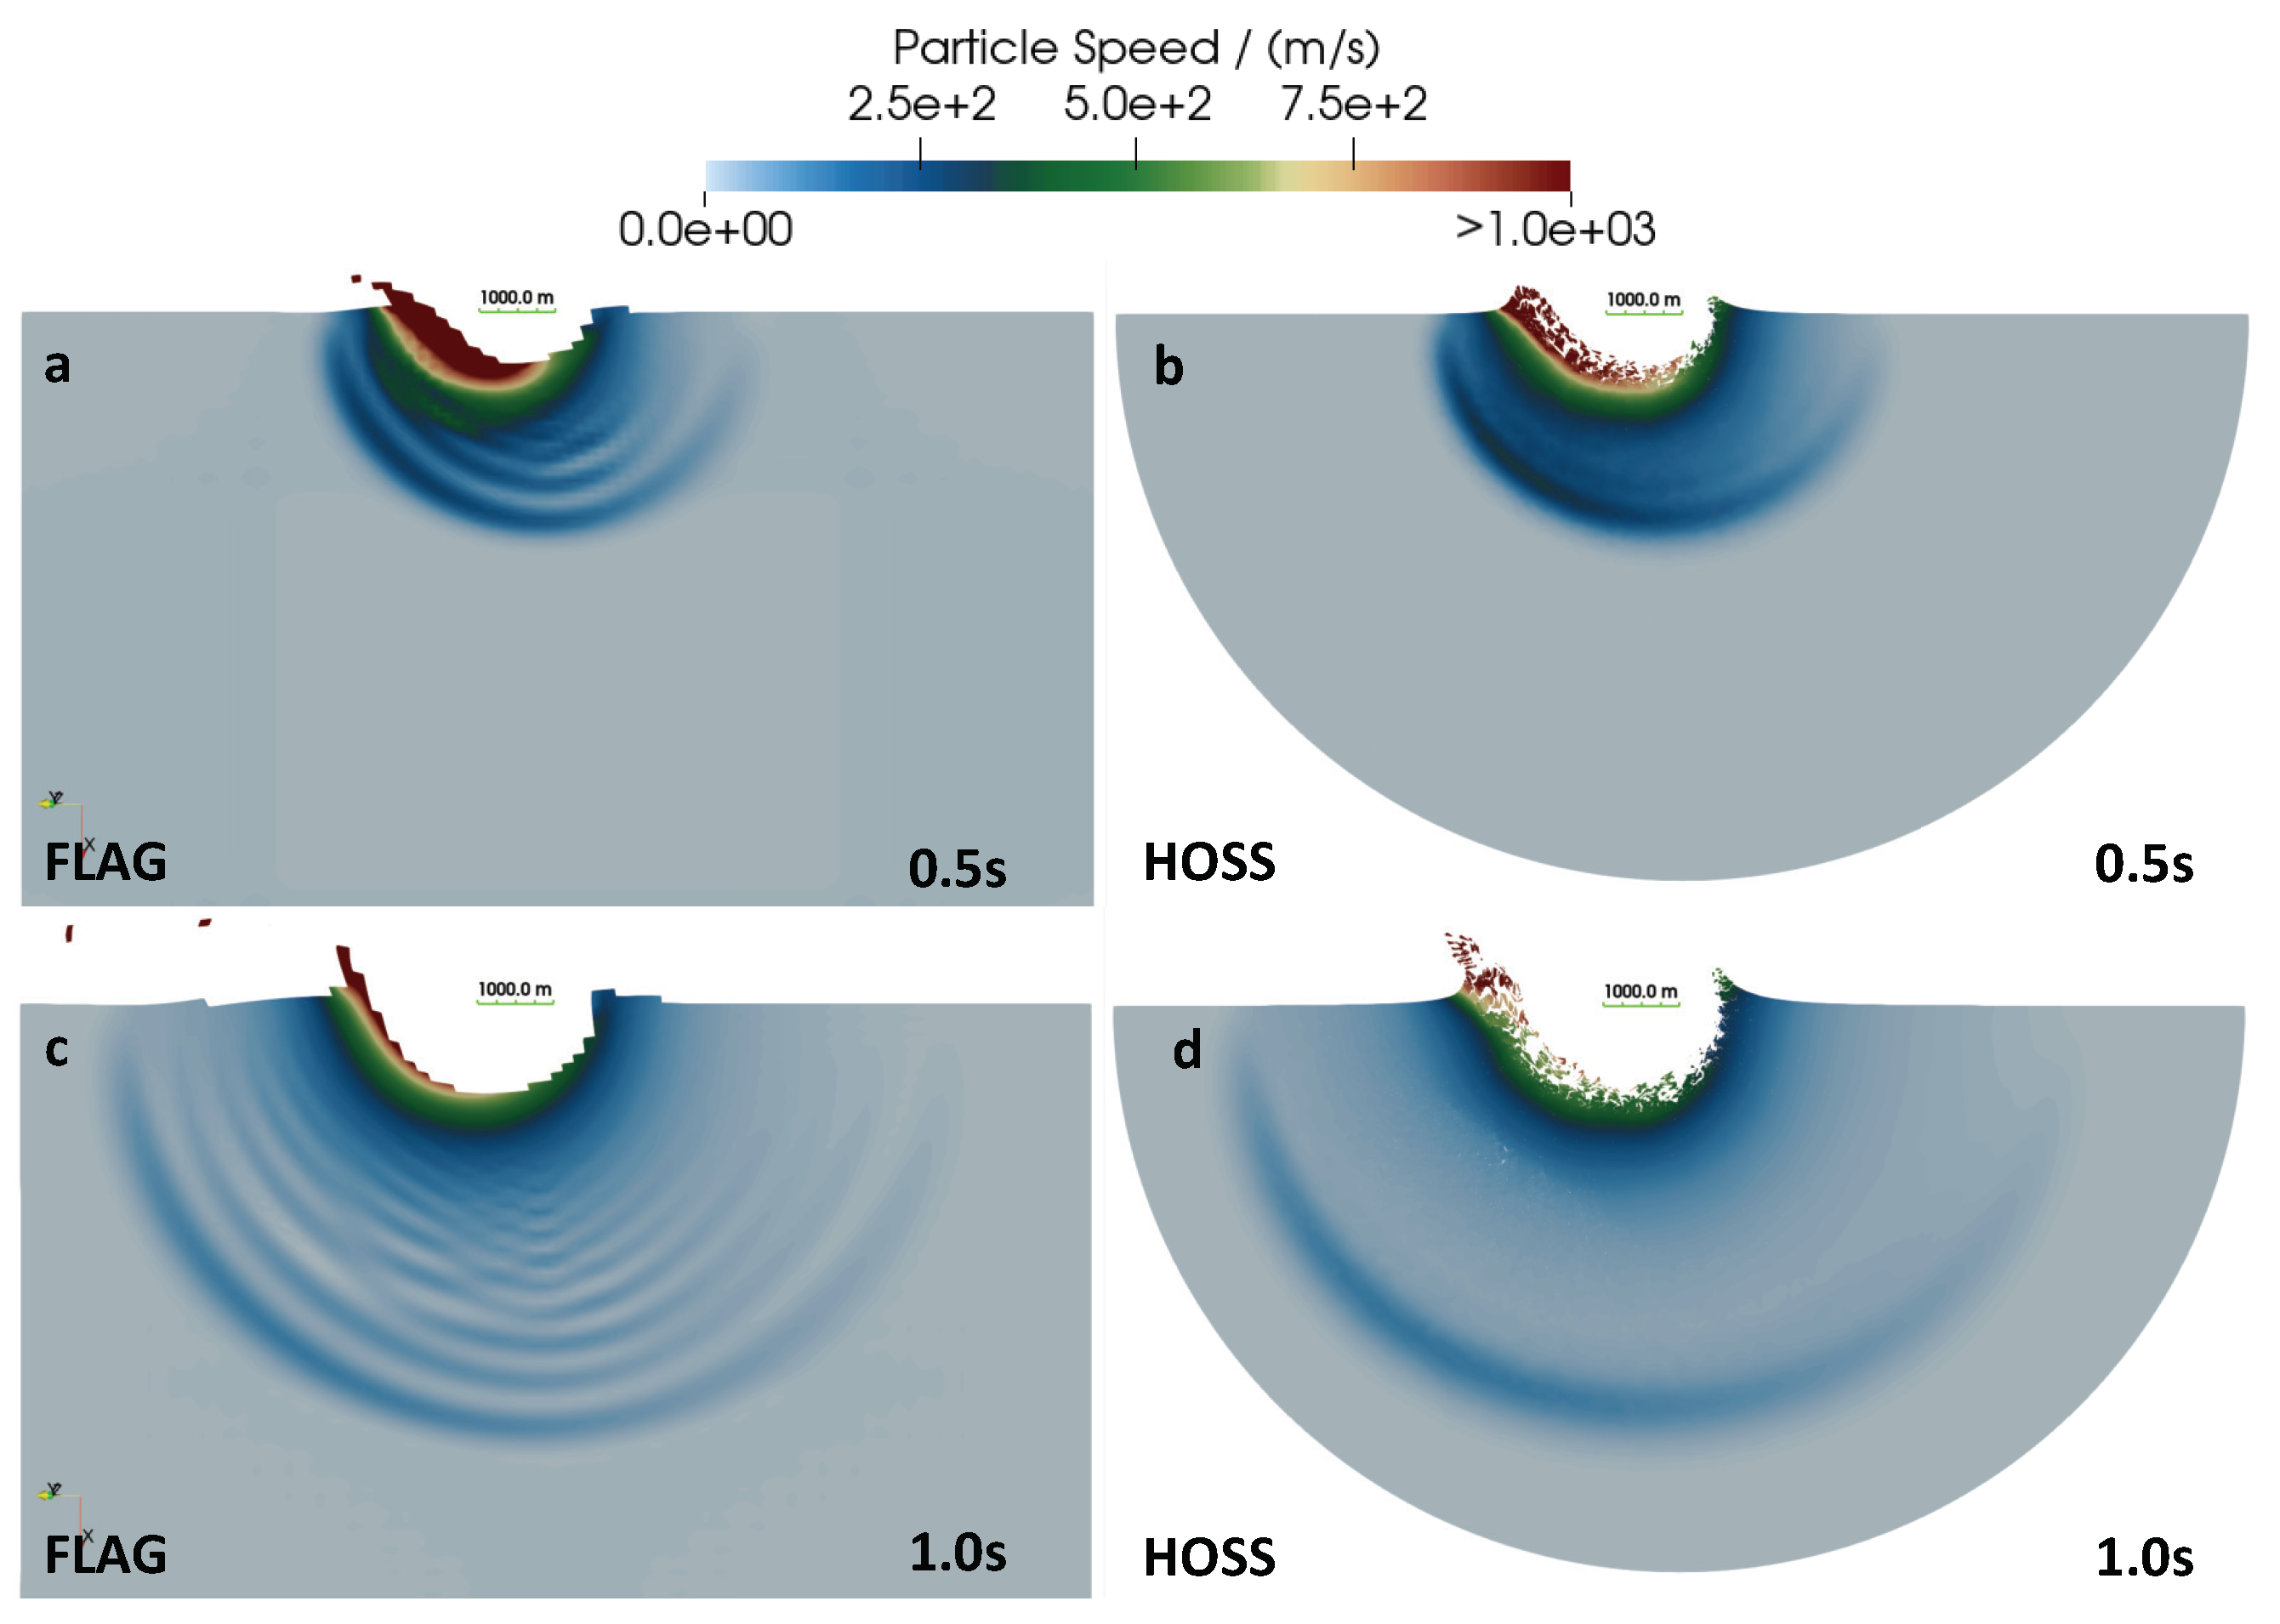
4.1. 2D Mesh Resolution Study
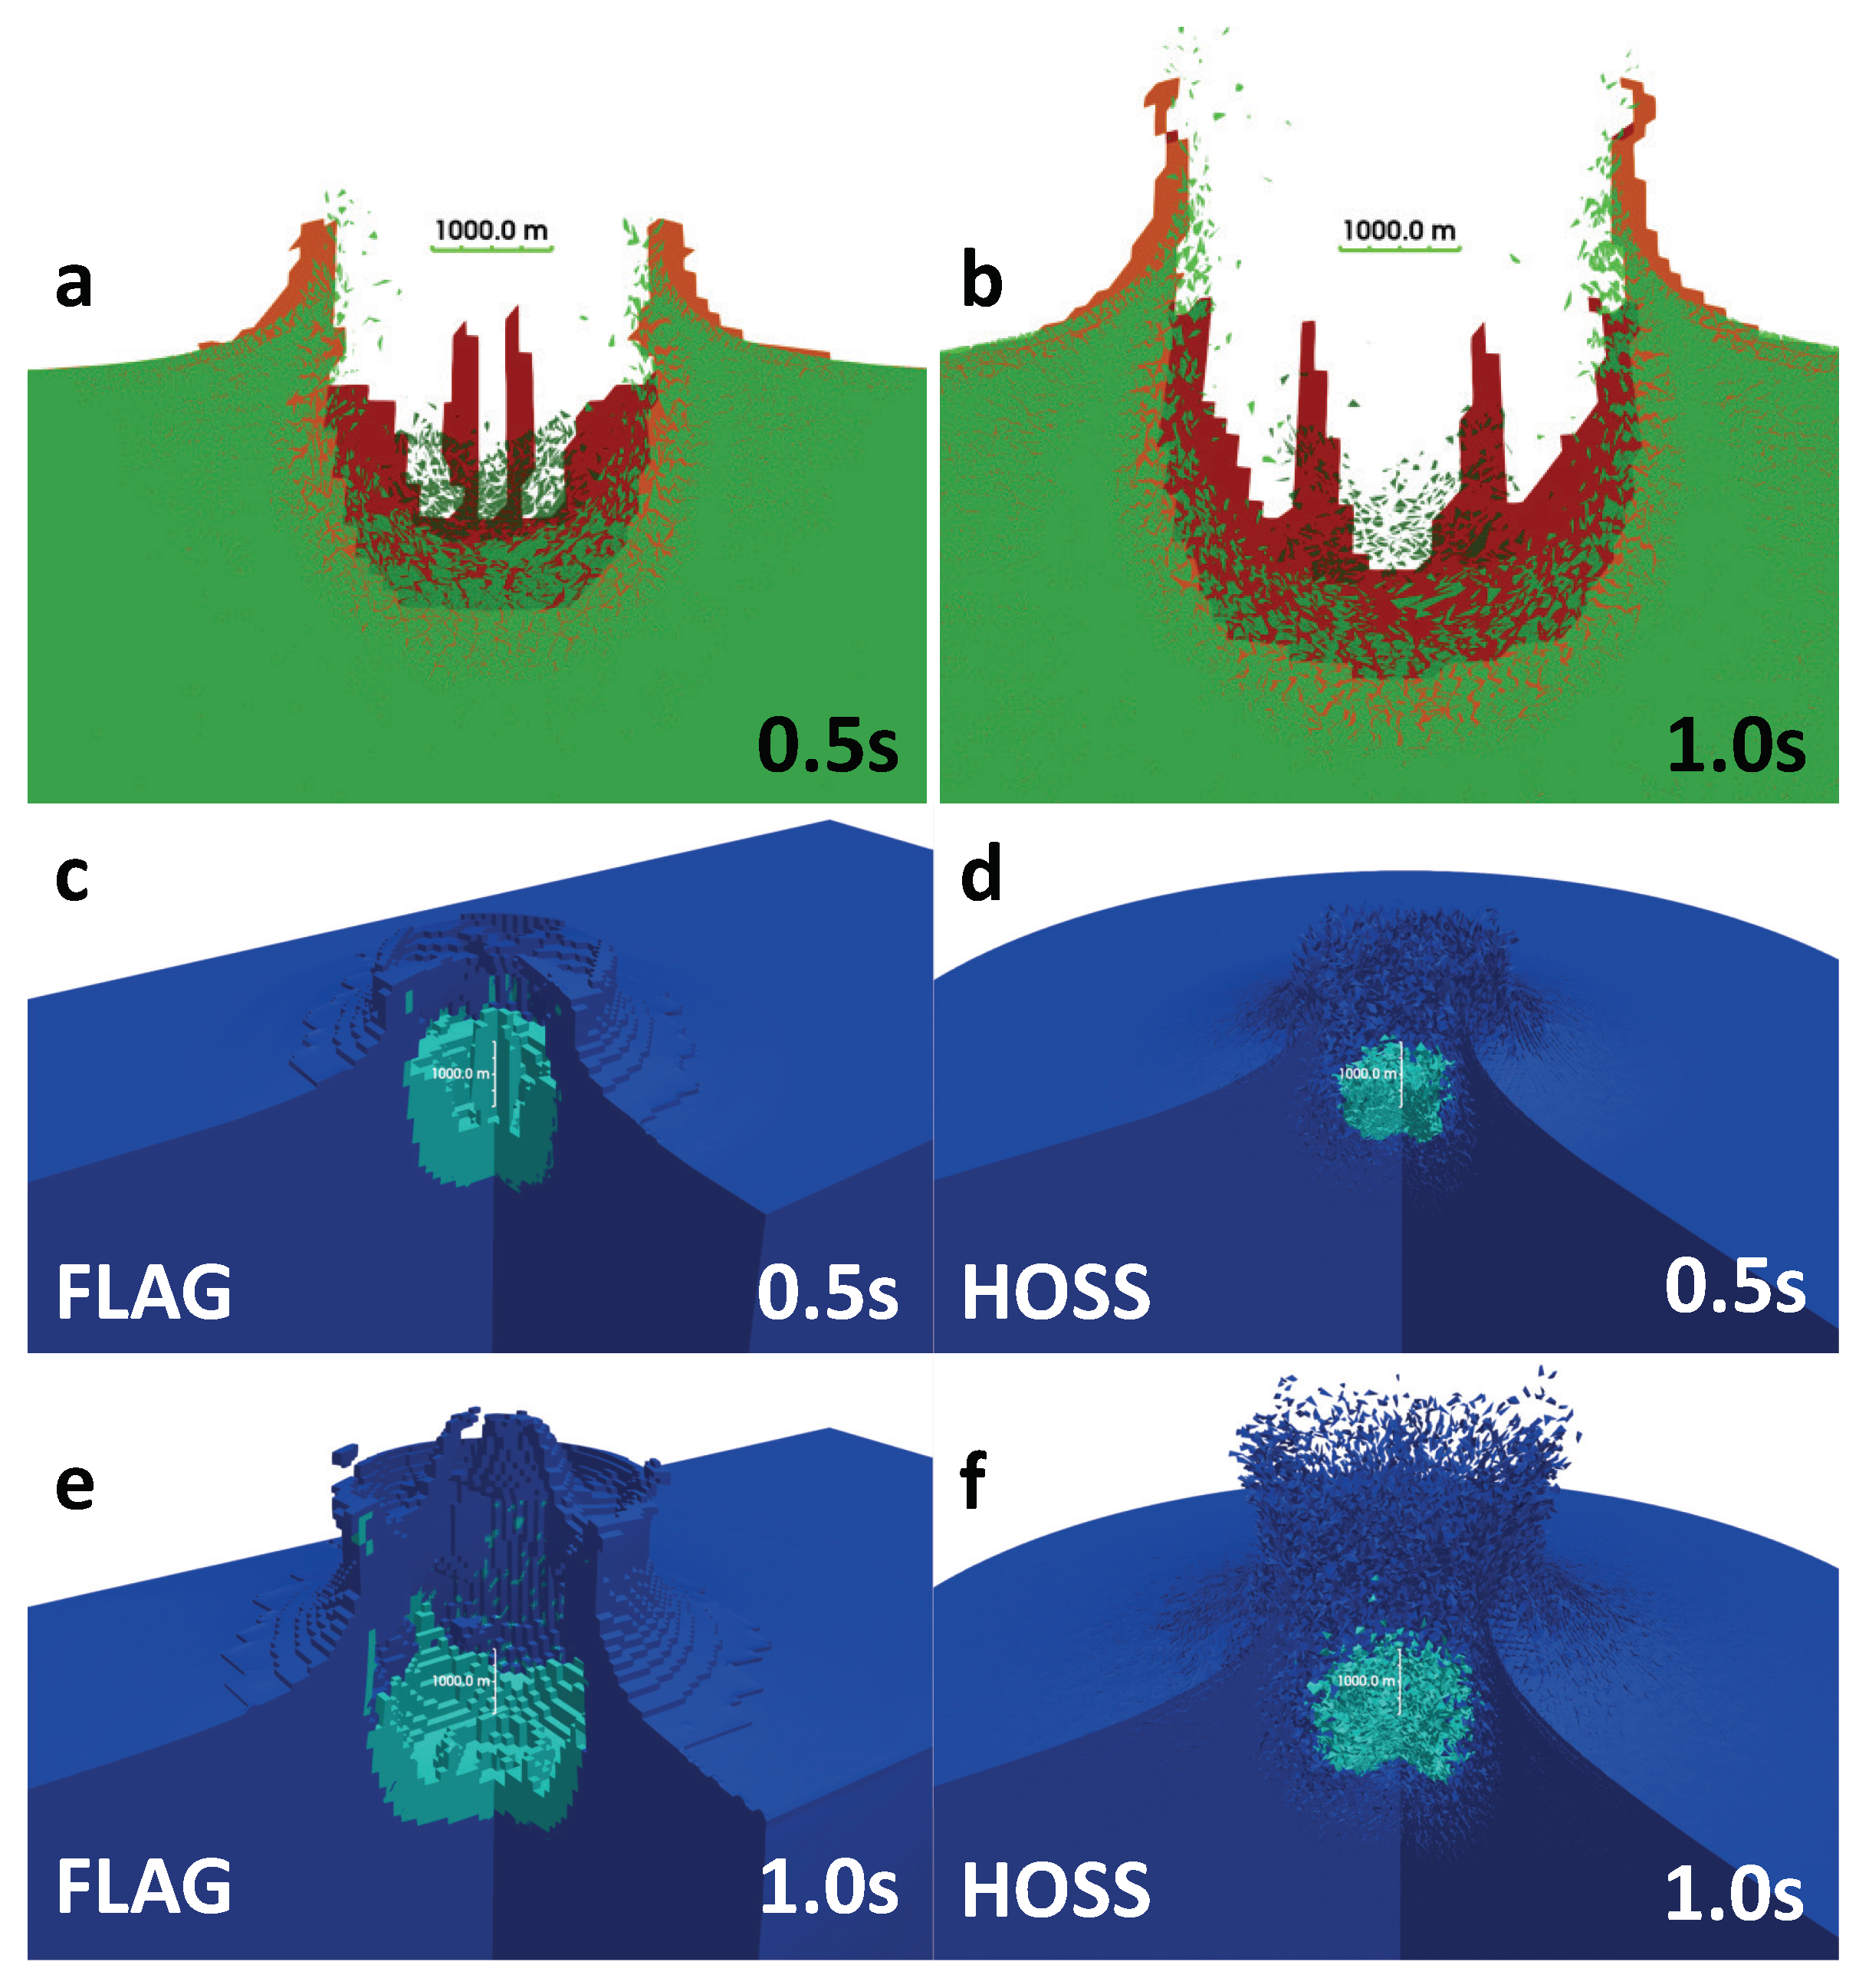
4.2. 3D Impact Cratering Simulations
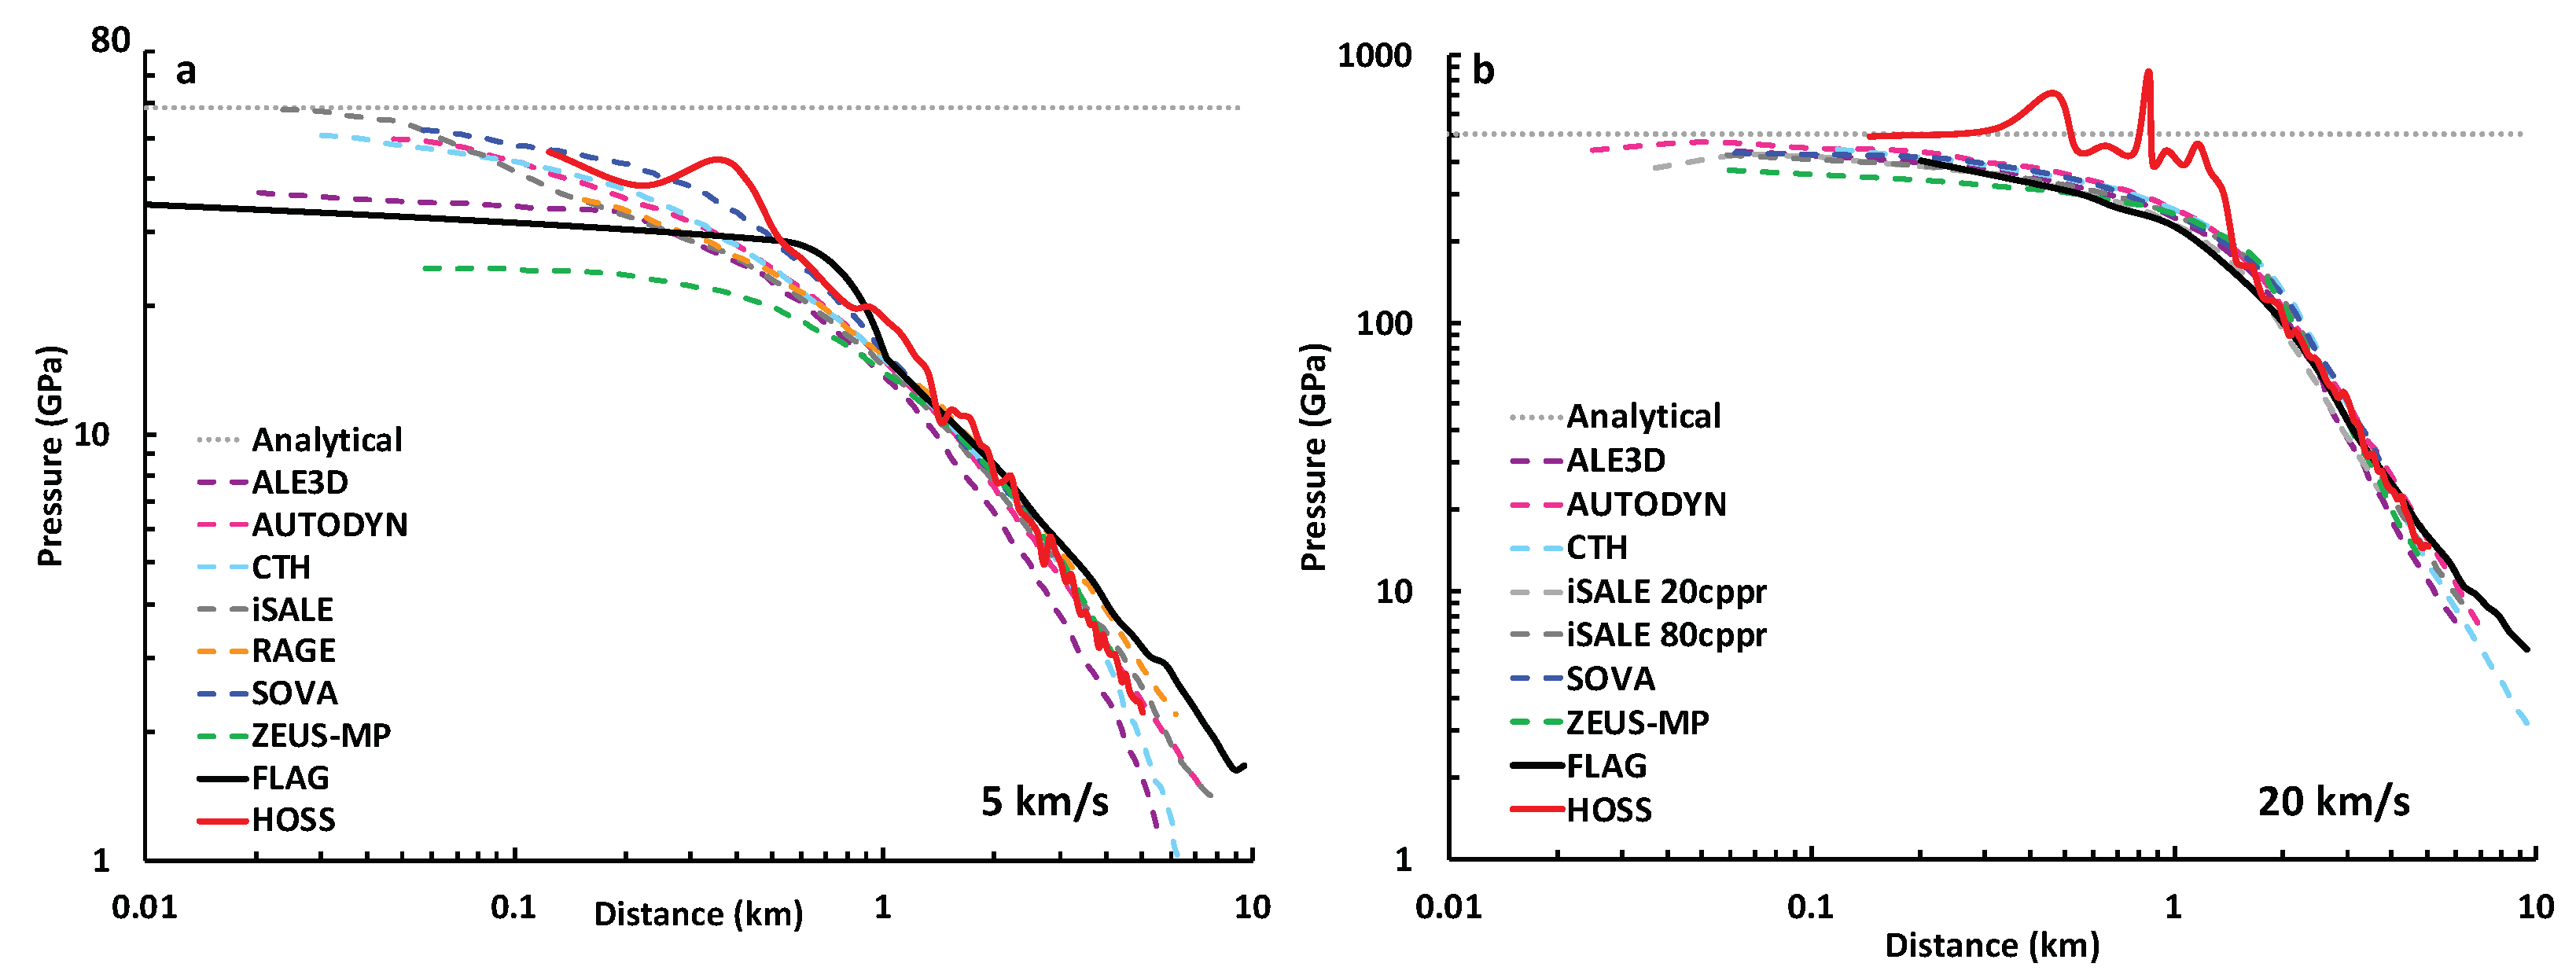
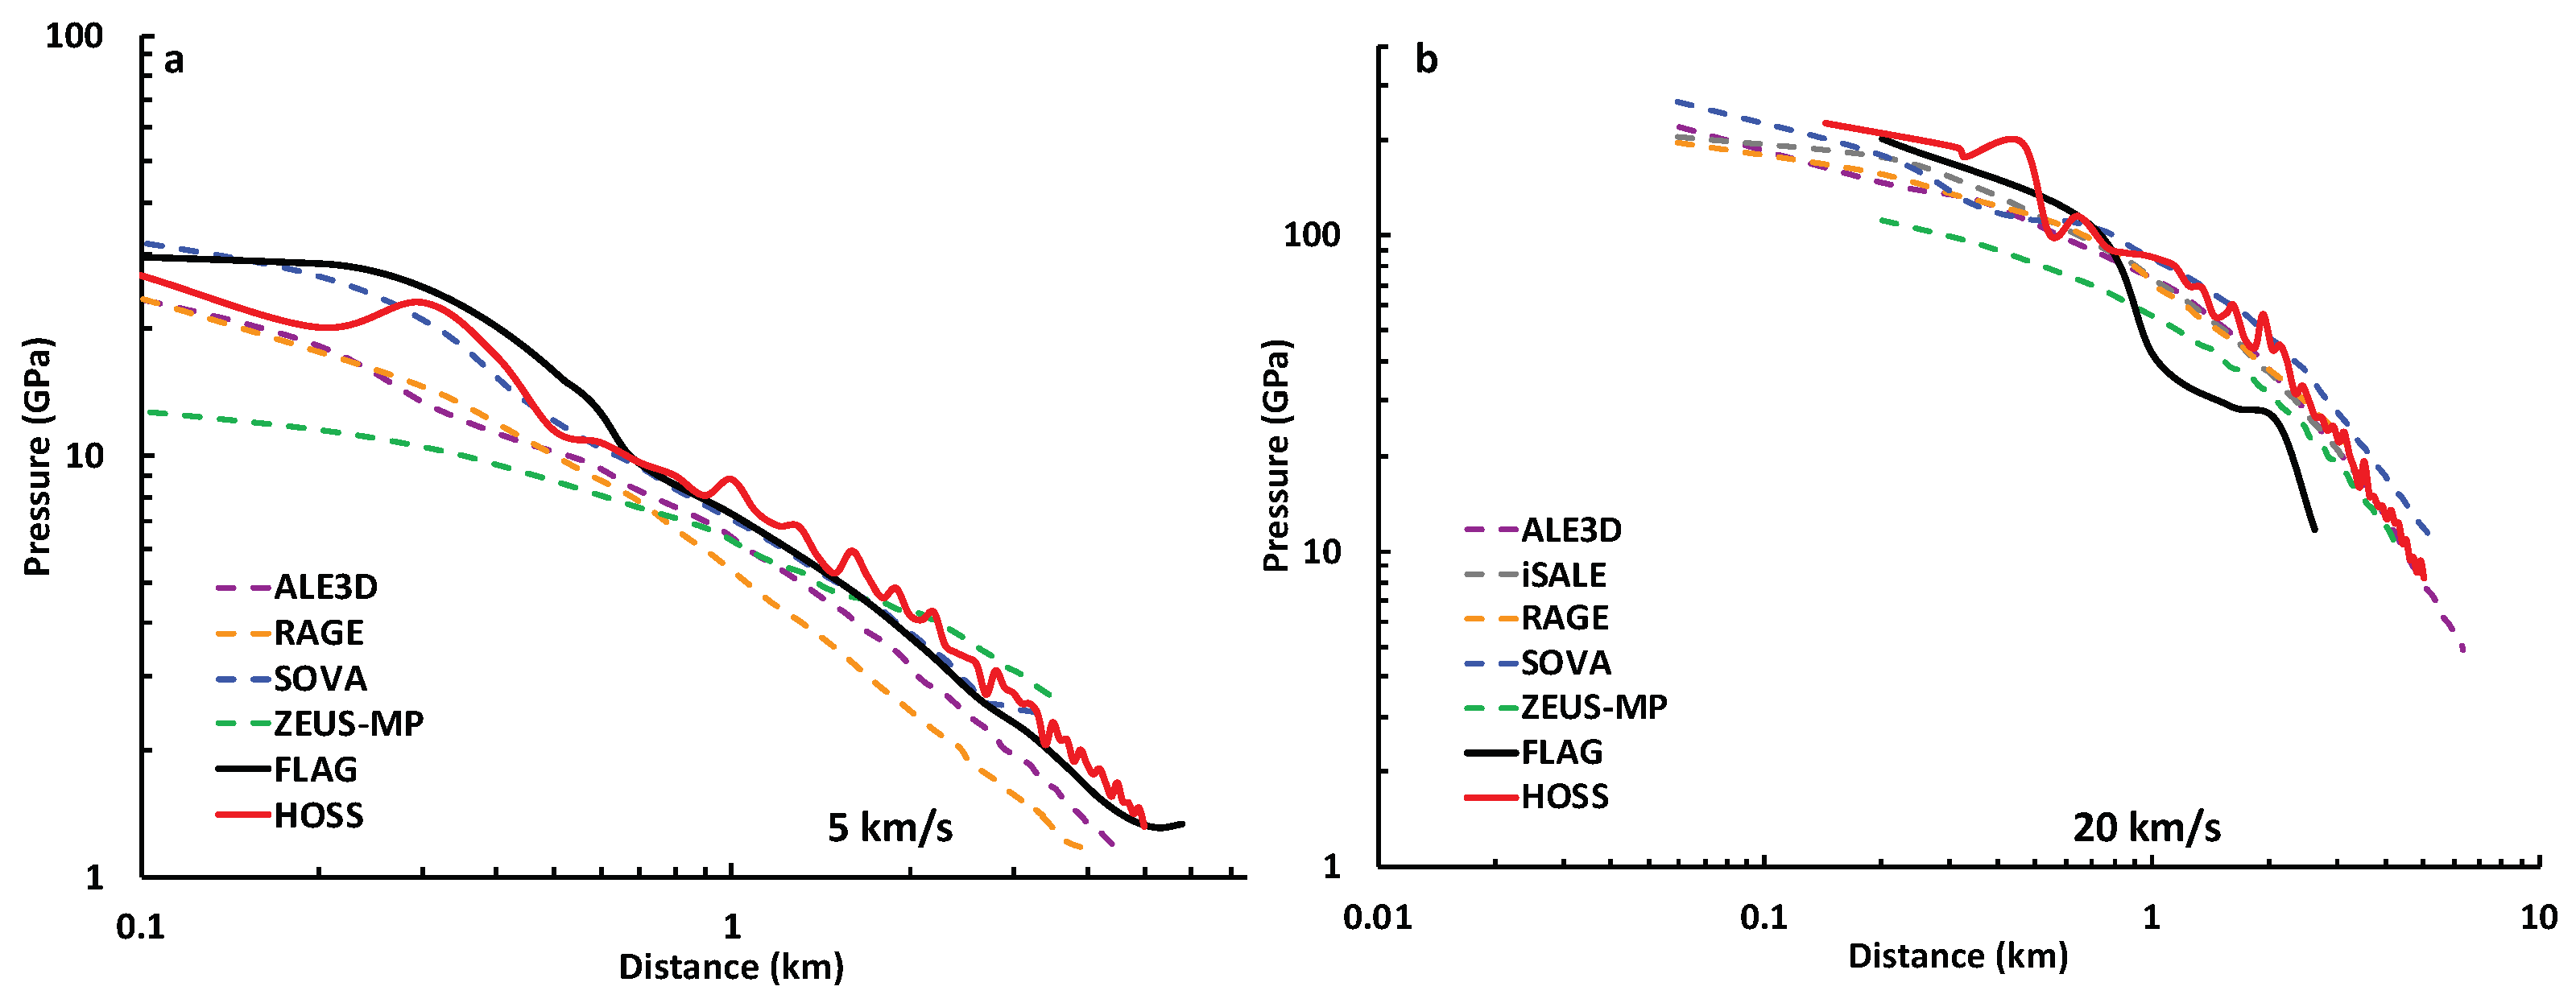
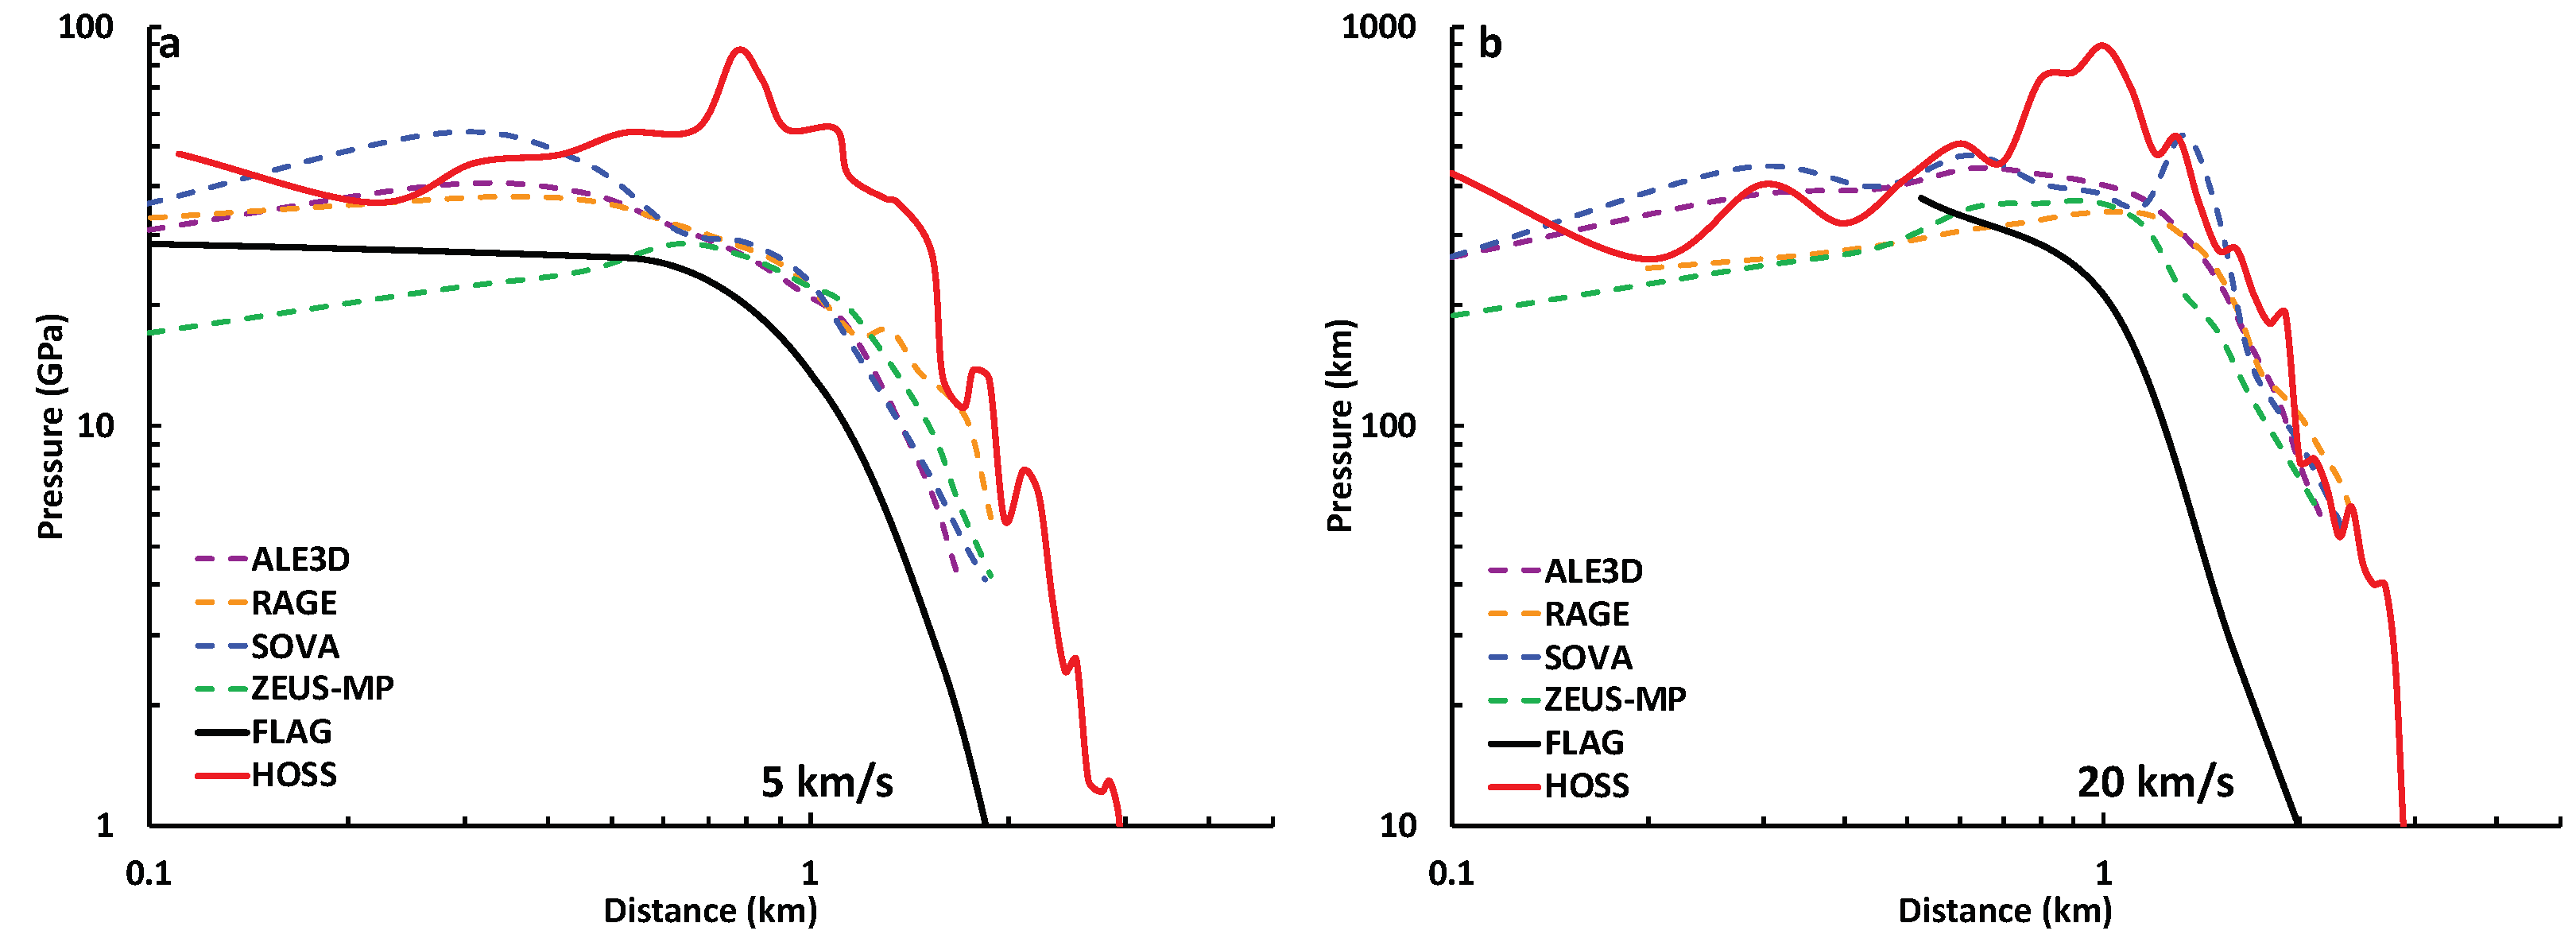
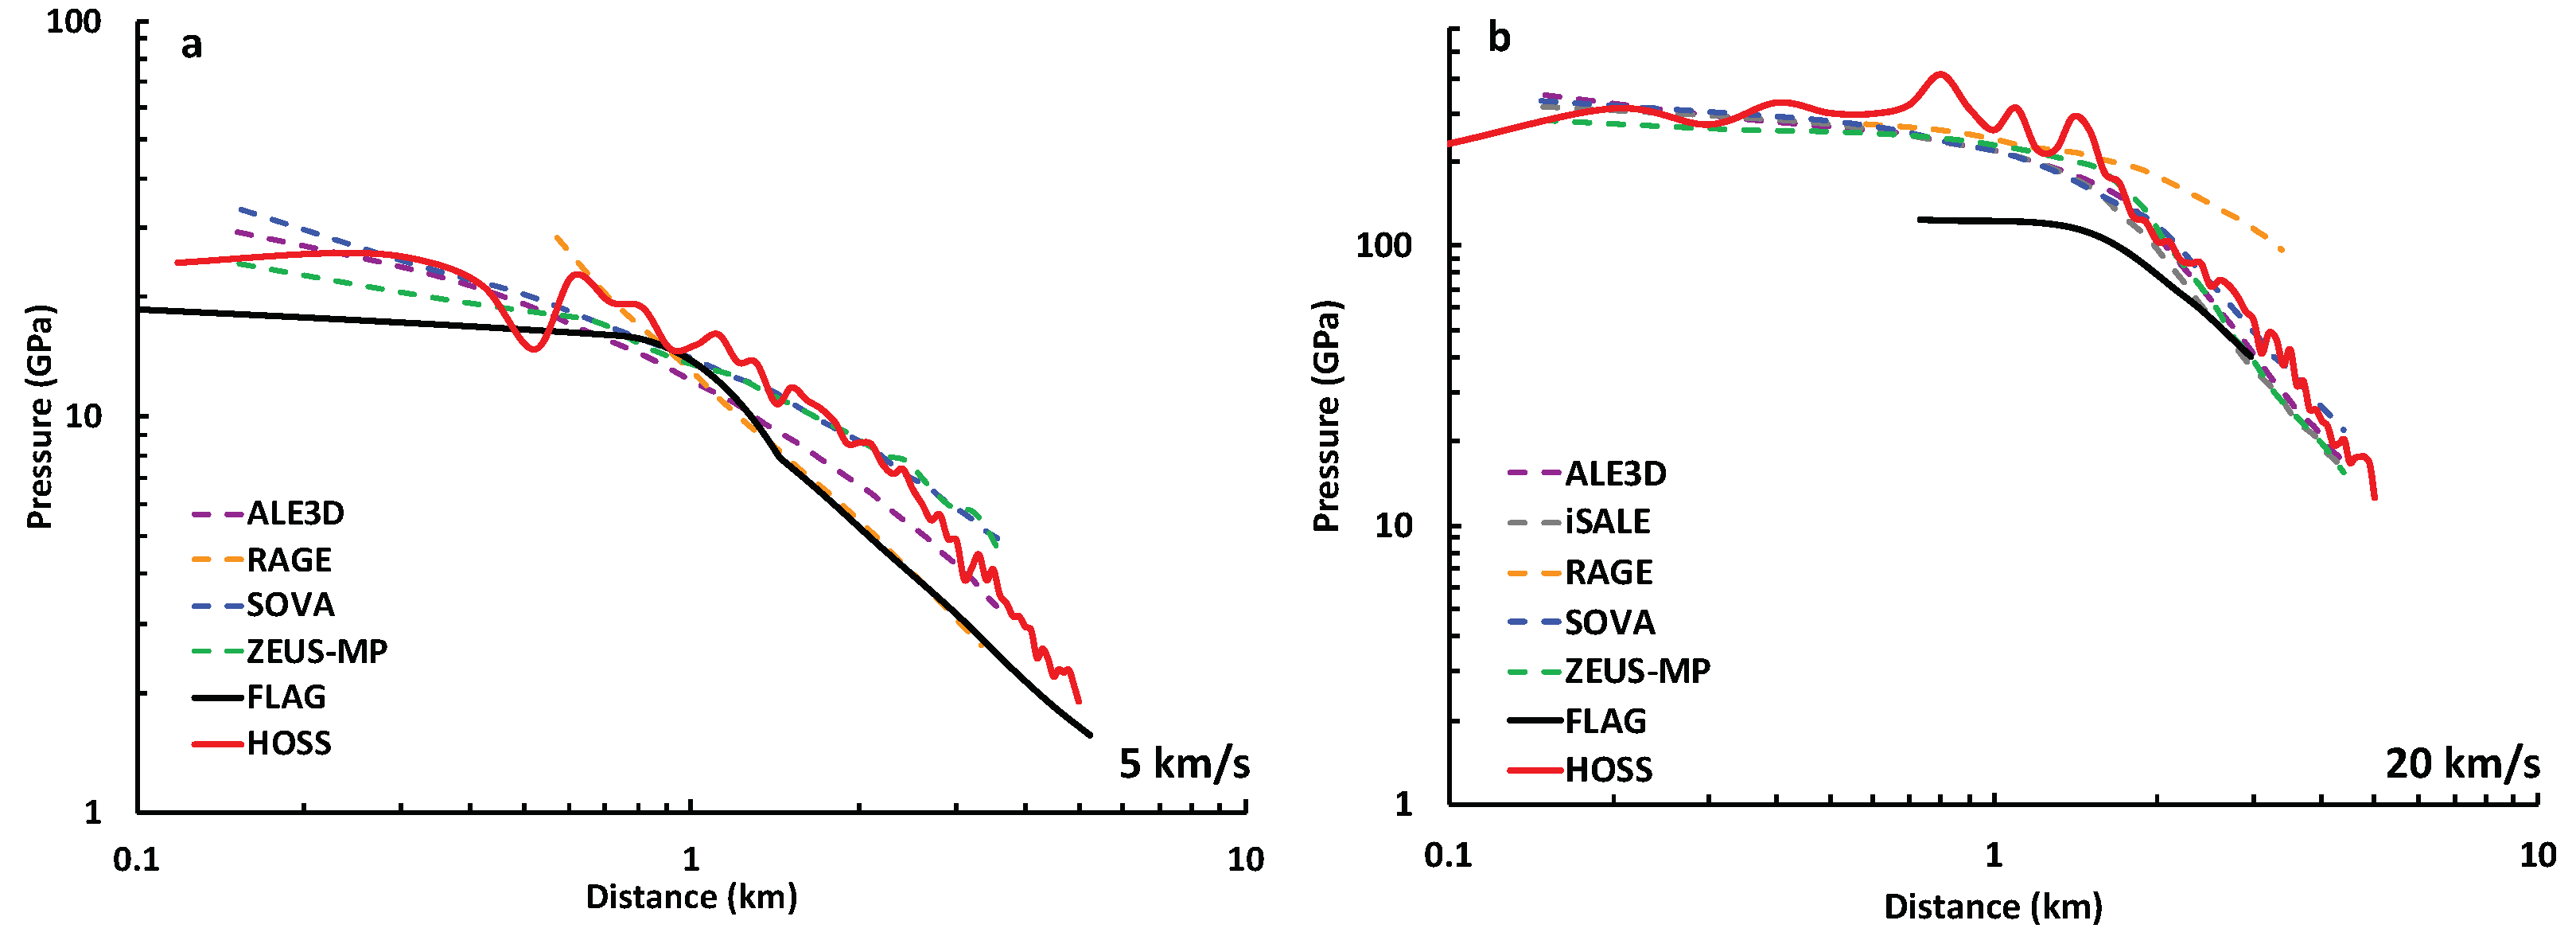
4.3. Benchmarking against Other Hydrocodes
4.4. Implications for Modeling Fracture
5. Conclusions
Author Contributions
Funding
Institutional Review Board Statement
Informed Consent Statement
Data Availability Statement
Acknowledgments
Conflicts of Interest
Abbreviations
| 2D | two-dimensional |
| 3D | three-dimensional |
| Al | aluminum |
| ALE | arbitrary Lagrangian Eulerian |
| cppr | cells per projectile radius |
| DEM | discrete-element method |
| EOS | equation of state |
| FDEM | finite-discrete element method |
| FEM | finite-element method |
| FLAG | Free LAGrange |
| HOSS | Hybrid Optimization Software Suite |
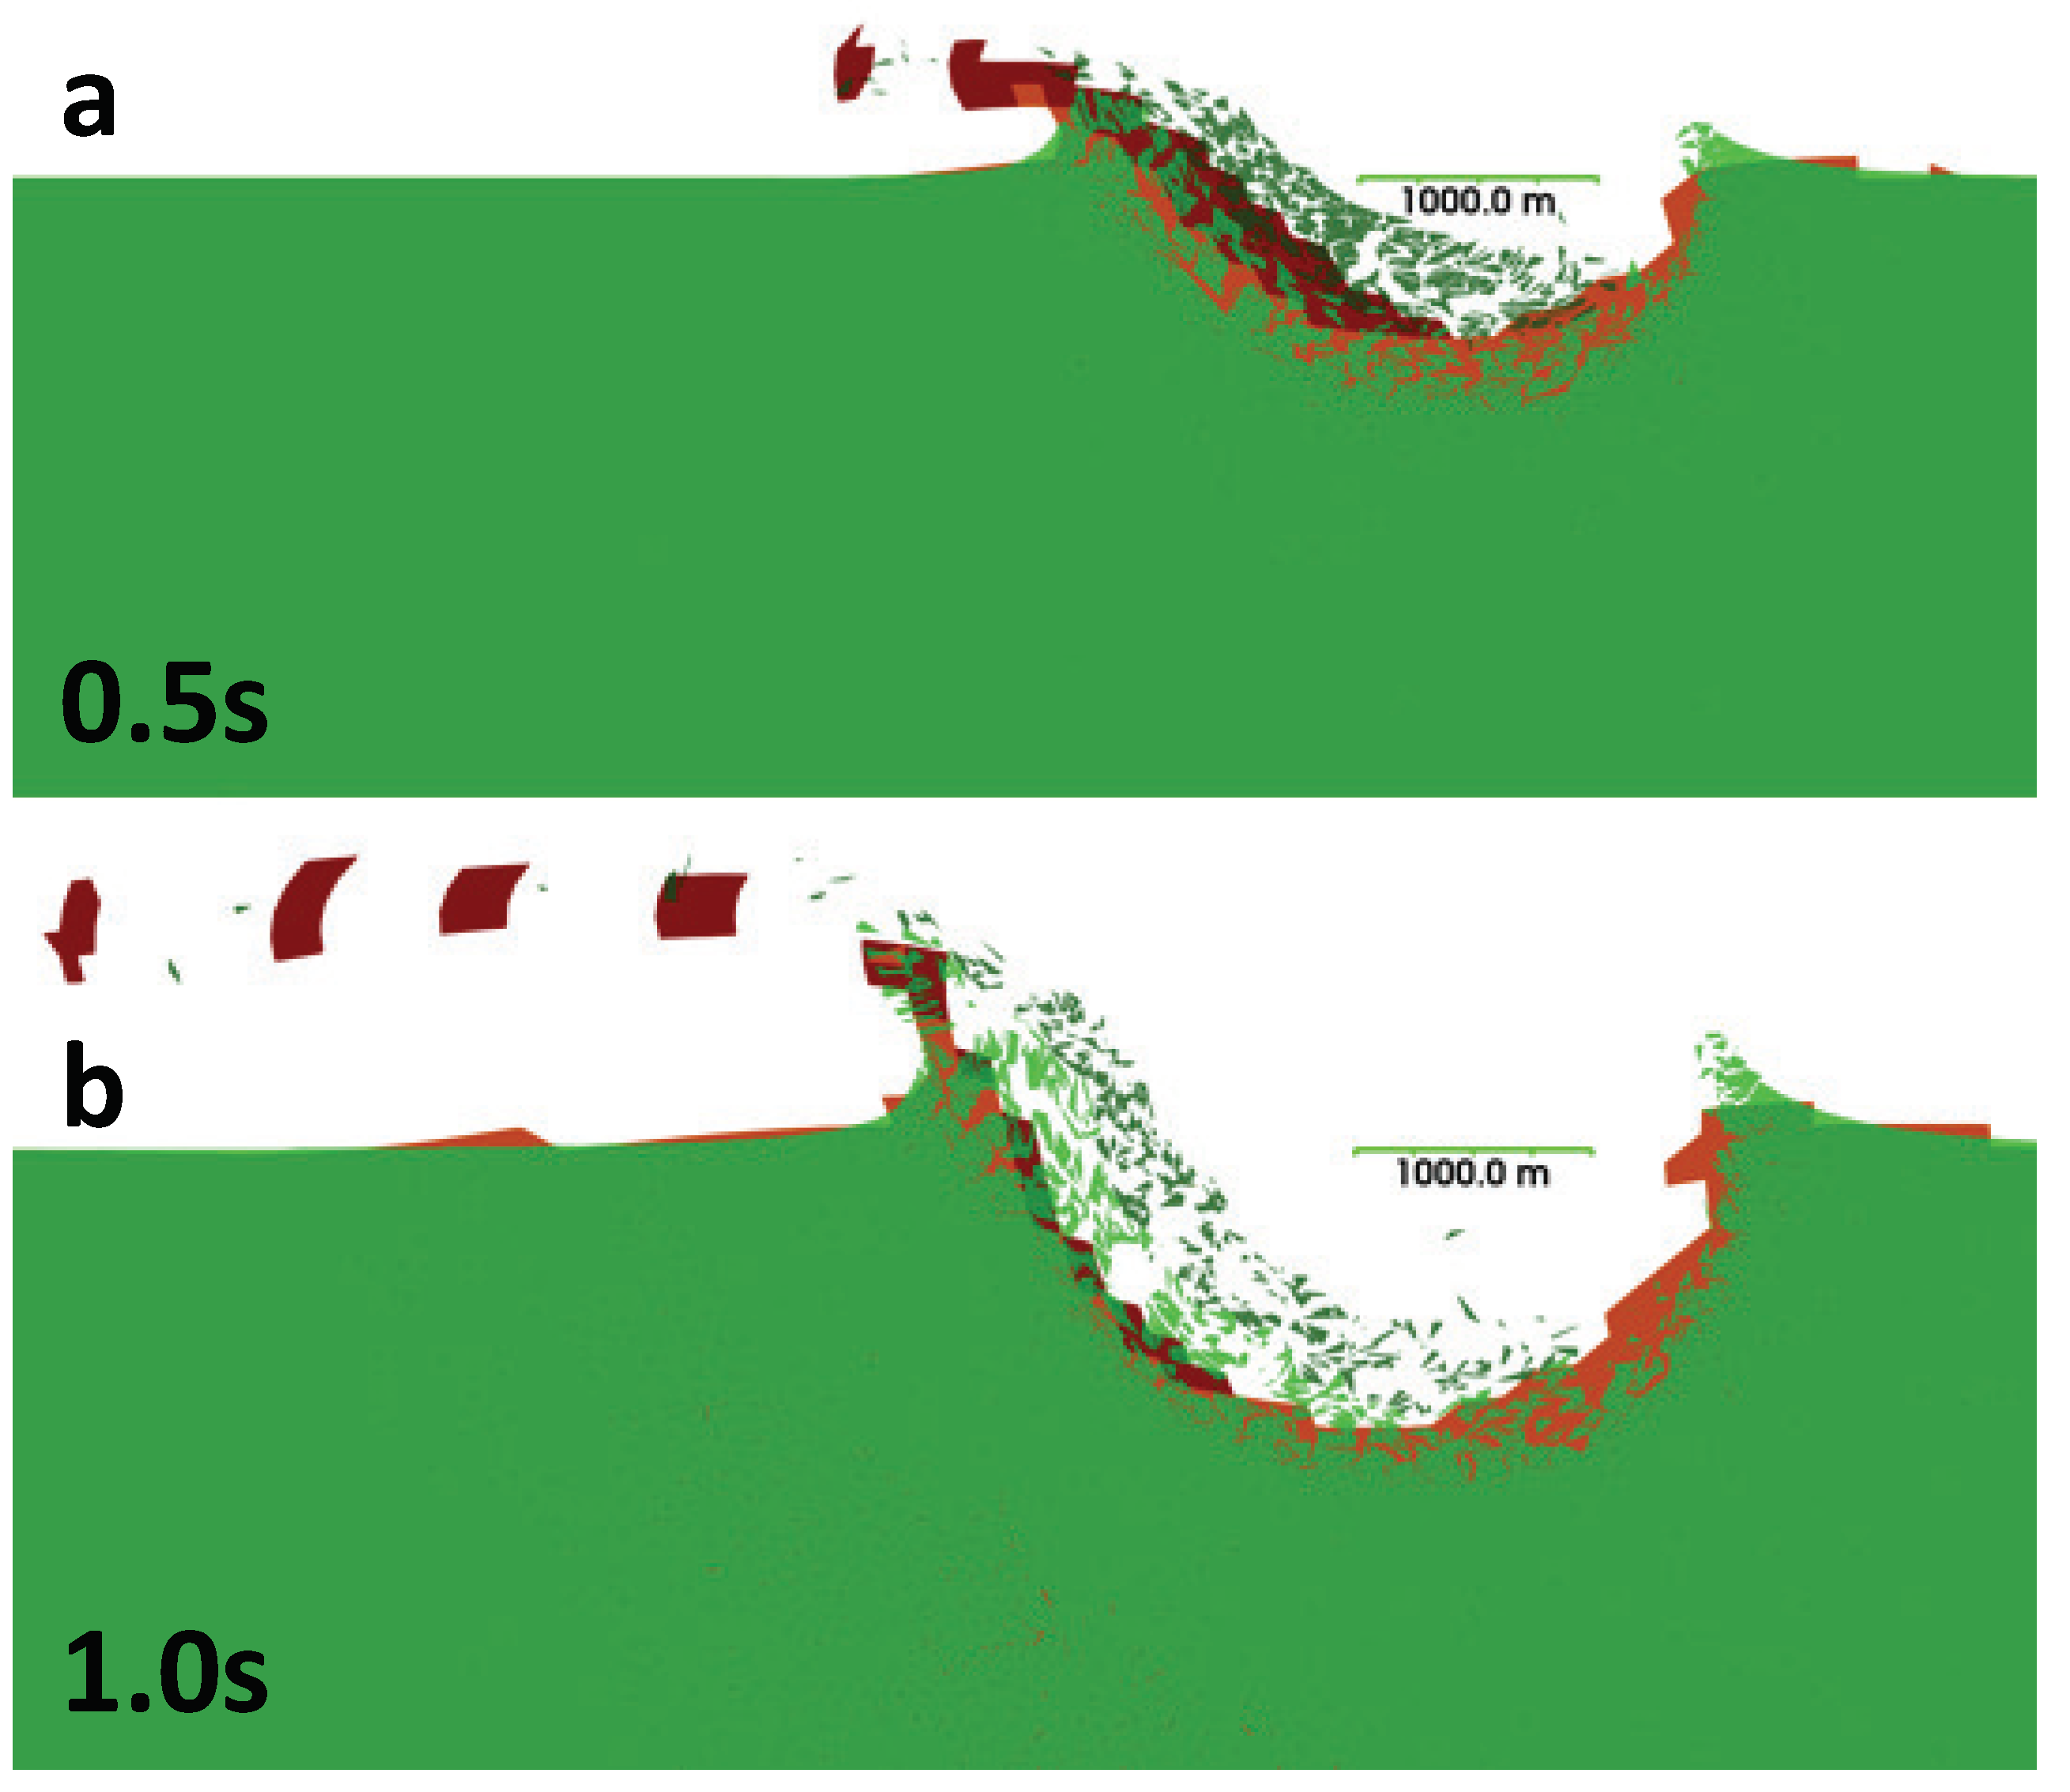
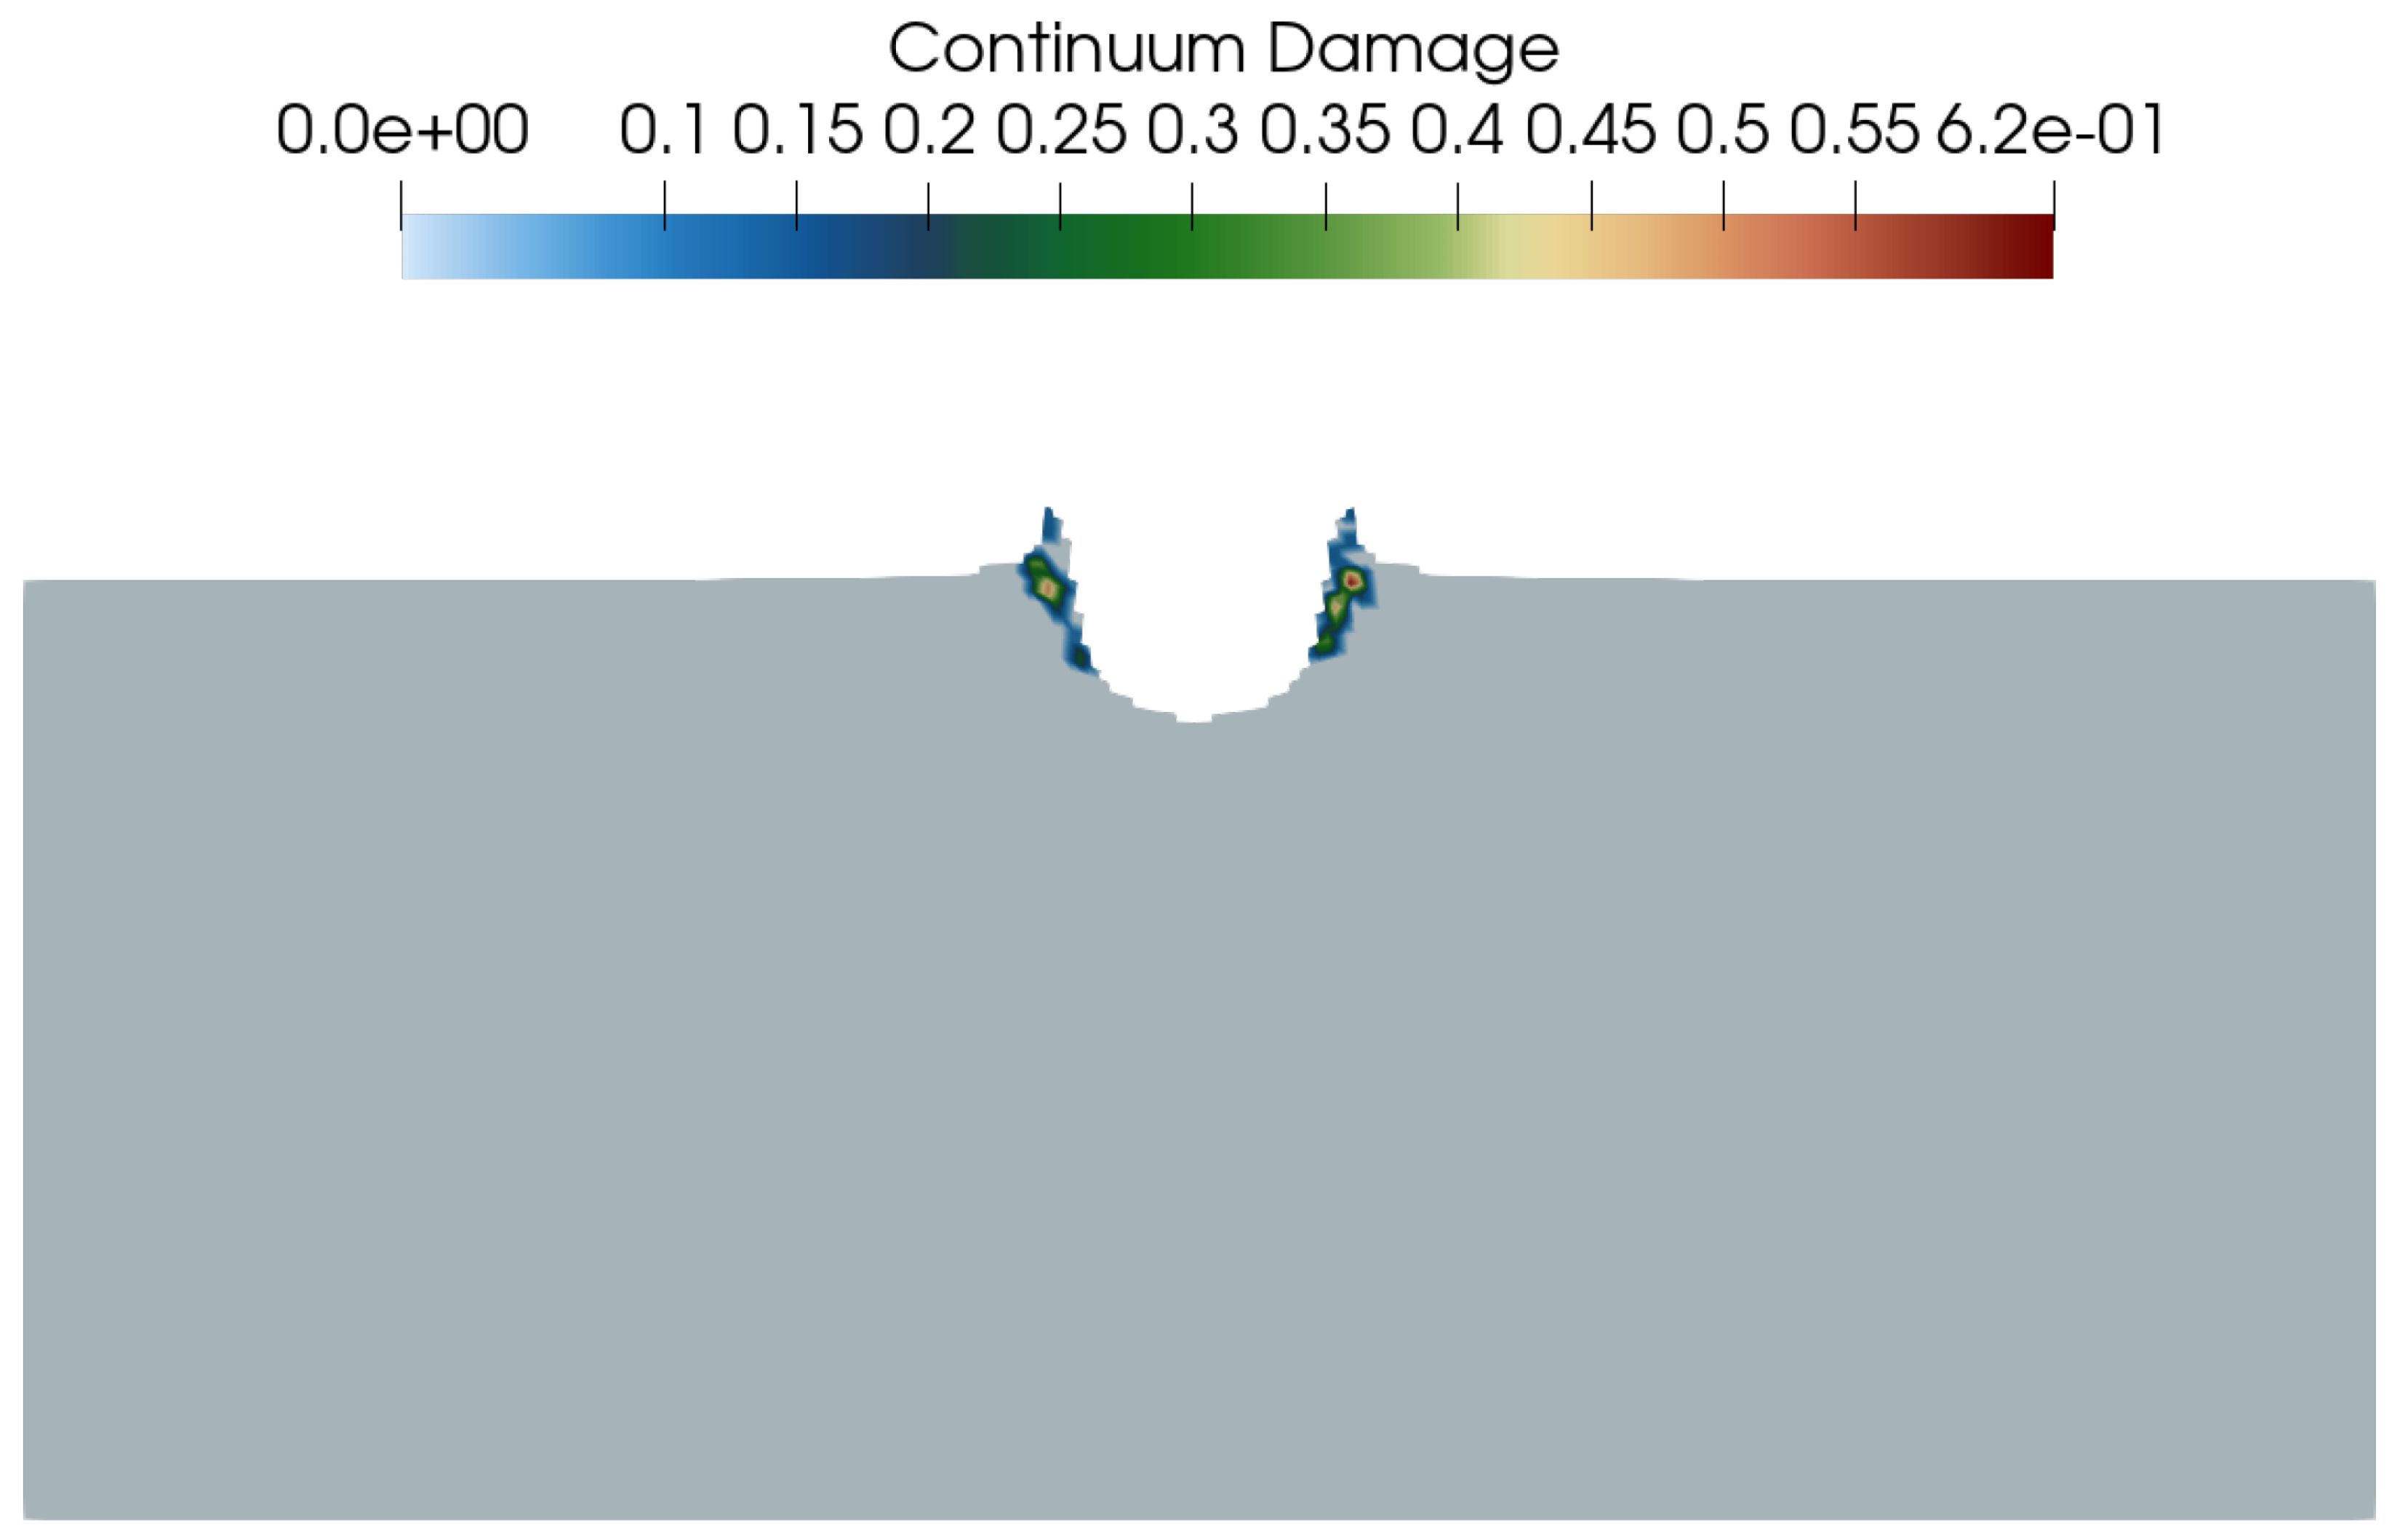
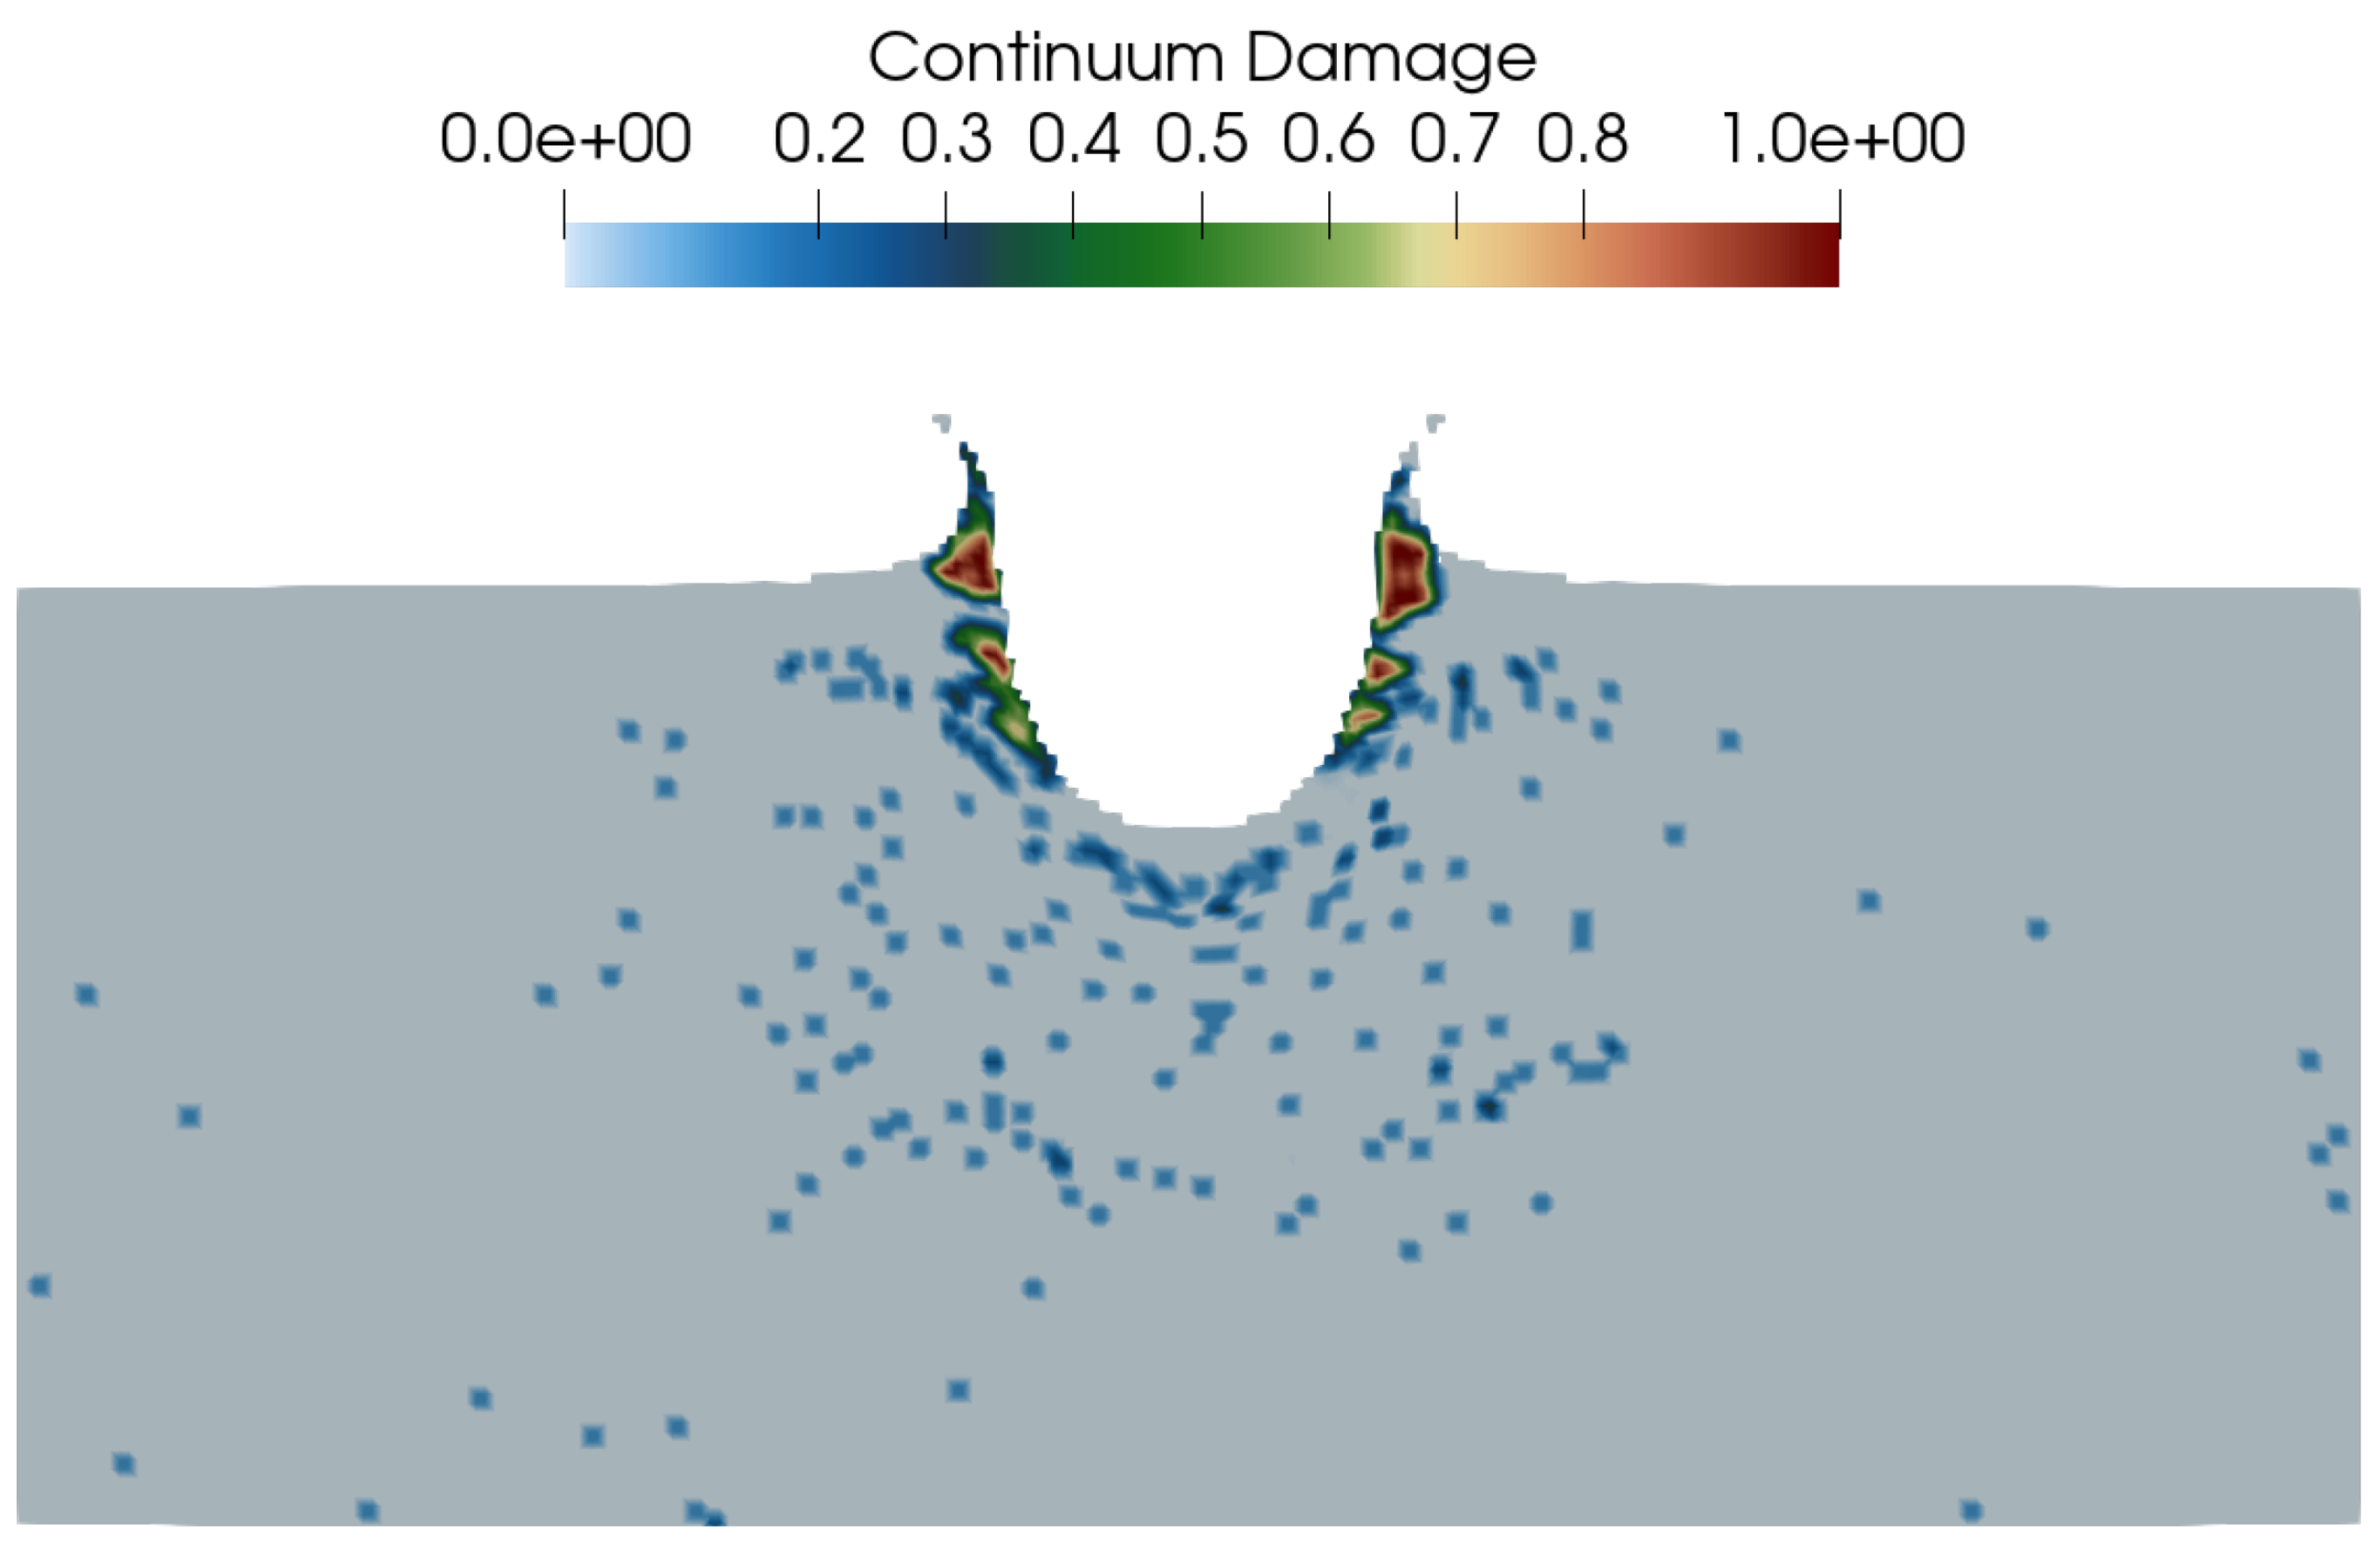
Appendix A. FLAG Damage Figures


References
- Melosh, H.J. Planetary Surface Processes; Cambridge University Press: Cambridge, UK, 2011; Volume 13. [Google Scholar]
- Melosh, H.J. Impact Cratering: A Geologic Process; Research supported by NASA; Oxford Monographs on Geology and Geophysics, No. 11; Oxford University: New York, NY, USA, 1989; Volume 11, 253p. [Google Scholar]
- Meyers, M.A. Dynamic Behavior of Materials; John Wiley & Sons: New York City, NY, USA, 1994. [Google Scholar]
- Caldwell, W.K.; Hunter, A.; Plesko, C.S.; Wirkus, S. Verification and Validation of the FLAG Hydrocode for Impact Cratering Simulations. J. Verif. Valid. Uncertain. Quantif. 2018, 3, 031004. [Google Scholar] [CrossRef]
- Pierazzo, E.; Artemieva, N.; Asphaug, E.; Baldwin, E.; Cazamias, J.; Coker, R.; Collins, G.; Crawford, D.; Davison, T.; Elbeshausen, D.; et al. Validation of numerical codes for impact and explosion cratering: Impacts on strengthless and metal targets. Meteorit. Planet. Sci. 2008, 43, 1917–1938. [Google Scholar] [CrossRef] [Green Version]
- Caldwell, W.K.; Hunter, A.; Plesko, C.S.; Wirkus, S. Understanding Asteroid 16 Psyche’s composition through 3D impact crater modeling. Icarus 2020, 351, 113962. [Google Scholar] [CrossRef]
- Sherburn, J.A.; Horstemeyer, M.F. Hydrodynamic modeling of impact craters in ice. Int. J. Impact Eng. 2010, 37, 27–36. [Google Scholar] [CrossRef] [Green Version]
- Suetsugu, R.; Tanaka, H.; Kobayashi, H.; Genda, H. Collisional disruption of planetesimals in the gravity regime with iSALE code: Comparison with SPH code for purely hydrodynamic bodies. Icarus 2018, 314, 121–132. [Google Scholar] [CrossRef] [Green Version]
- Pierazzo, E.; Collins, G. A Brief Introduction to Hydrocode Modeling of Impact Cratering. In Cratering in Marine Environments and on Ice; Springer: Berlin/Heidelberg, Germany, 2004; pp. 323–340. [Google Scholar] [CrossRef]
- Euser, B.; Rougier, E.; Lei, Z.; Knight, E.E.; Frash, L.P.; Carey, J.W.; Viswanathan, H.; Munjiza, A. Simulation of Fracture Coalescence in Granite via the Combined Finite–Discrete Element Method. Rock Mech. Rock Eng. 2019, 52, 3213–3227. [Google Scholar] [CrossRef] [Green Version]
- Okubo, K.; Rougier, E.; Lei, Z.; Bhat, H.S. Modeling earthquakes with off-fault damage using the combined finite-discrete element method. Comput. Part. Mech. 2020, 7, 1057–1072. [Google Scholar] [CrossRef]
- Fukuda, D.; Mohammadnejad, M.; Liu, H.; Zhang, Q.; Zhao, J.; Dehkhoda, S.; Chan, A.; Kodama, J.; Fujii, Y. Development of a 3D Hybrid Finite-Discrete Element Simulator Based on GPGPU-Parallelized Computation for Modelling Rock Fracturing Under Quasi-Static and Dynamic Loading Conditions. Rock Mech. Rock Eng. 2020, 53, 1079–1112. [Google Scholar] [CrossRef]
- Anderson, C.E., Jr. An overview of the theory of hydrocodes. Int. J. Impact Eng. 1987, 5, 33–59. [Google Scholar] [CrossRef]
- Johnson, W.E.; Anderson, C.E., Jr. History and application of hydrocodes in hypervelocity impact. Int. J. Impact Eng. 1987, 5, 423–439. [Google Scholar] [CrossRef]
- Collins, G.S. An Introduction to Hydrocode Modeling; Applied Modelling and Computation Group, Imperial College London: London, UK, 2002; pp. 2–11. [Google Scholar]
- Benson, D.J. Computational methods in Lagrangian and Eulerian hydrocodes. Comput. Methods Appl. Mech. Eng. 1992, 99, 235–394. [Google Scholar] [CrossRef]
- Burton, D.; Morgan, N.; Charest, M.; Kenamond, M.; Fung, J. Compatible, energy conserving, bounds preserving remap of hydrodynamic fields for an extended ALE scheme. J. Comput. Phys. 2018, 355, 492–533. [Google Scholar] [CrossRef]
- Munjiza, A. Discrete Elements in Transient Dynamics of Fractured Media. Ph.D. Thesis, Swansea University, Swansea, UK, 1992. [Google Scholar]
- Munjiza, A.; Owen, D.; Bicanic, N. A combined finite-discrete element method in transient dynamics of fracturing solids. Eng. Comput. 1995, 12, 145–174. [Google Scholar] [CrossRef]
- Munjiza, A. The Combined Finite-Discrete Element Method; John Wiley & Sons: Hoboken, NJ, USA, 2004. [Google Scholar] [CrossRef]
- Munjiza, A.; Rougier, E.; Knight, E.E. Large Strain Finite Element Method: A Practical Course; John Wiley & Sons: Hoboken, NJ, USA, 2015. [Google Scholar]
- Munjiza, A.; Knight, E.E.; Rougier, E. Computational Mechanics of Discontinua; John Wiley & Sons: Hoboken, NJ, USA, 2011. [Google Scholar] [CrossRef]
- Aliabadi, M. Fracture of Rock, 1st ed.; Computational Mechanics; WIT Press: Southampton, UK, 1999. [Google Scholar]
- Rougier, E.; Munjiza, A.; Lei, Z.; Chau, V.T.; Knight, E.E.; Hunter, A.; Srinivasan, G. The combined plastic and discrete fracture deformation framework for finite-discrete element methods. Int. J. Numer. Methods Eng. 2020, 121, 1020–1035. [Google Scholar] [CrossRef]
- Munjiza, A.; Andrews, K.R.F. Penalty function method for combined finite–discrete element systems comprising large number of separate bodies. Int. J. Numer. Methods Eng. 2000, 49, 1377–1396. [Google Scholar] [CrossRef]
- Munjiza, A.; Rougier, E.; John, N.W.M. MR linear contact detection algorithm. Int. J. Numer. Methods Eng. 2006, 66, 46–71. [Google Scholar] [CrossRef]
- Rougier, E.; Munjiza, A. MRCK_3D contact detection algorithm. In Proceedings of the 5th International Conference on Discrete Element Methods, London, UK, 25–26 August 2010; Queen Mary, University of London: London, UK, 2010; pp. 37–45. [Google Scholar]
- Knight, E.E.; Rougier, E.; Lei, Z.; Euser, B.; Chau, V.; Boyce, S.H.; Gao, K.; Okubo, K.; Froment, M. HOSS: An implementation of the combined finite-discrete element method. Comput. Part. Mech. 2020, 7, 765–787. [Google Scholar] [CrossRef]
- Boyce, S.H.S.; Knight, E.E.; Rougier, E.; Lei, Z.; Euser, B. HOSS –The Hybrid Optimization Software Suite. 2021. Available online: www.lanl.gov/hoss (accessed on 30 January 2021).
- Burton, D. Connectivity Structures and Differencing Techniques For Staggered-Grid Free-Lagrange Hydroynamics; Technical Report UCRL-JC-110555; Lawrence Livermore National Laboratory: Livermore, CA, USA, 1992. [Google Scholar]
- Burton, D. Multidimensional Discretization of Conservation Laws for Unstructured Polyhedral Grids; Technical Report UCRL-JC-118306; Lawrence Livermore National Laboratory: Livermore, CA, USA, 1994. [Google Scholar]
- Burton, D. Consistent Finite-Volume Discretization of Hydrodynamic Conservation Laws for Unstructured Grids; Technical Report UCRL-JC-118788; Lawrence Livermore National Laboratory: Livermore, CA, USA, 1994. [Google Scholar]
- Hill, J.L. User’s Manual for FLAG Version 3.6.0. The Lagrangian Applications Project; LA-CP-17-20057; Los Alamos National Laboratory: Livermore, CA, USA, 2017. [Google Scholar]
- Fung, J.; Harrison, A.K.; Chitanvis, S.; Margulies, J. Ejecta source and transport modeling in the FLAG hydrocode. Comput. Fluids 2013, 83, 177–186. [Google Scholar] [CrossRef]
- Larkin, K.; Hunter, A.; Abdelkefi, A. Comparative investigations of multi-fidelity modeling on performance of electrostatically-actuated cracked micro-beams. Int. J. Mech. Sci. 2021, 192, 106139. [Google Scholar] [CrossRef]
- Larkin, K.; Rougier, E.; Chau, V.T.; Srinivasan, G.; Abdelkefi, A.; Hunter, A. Scale bridging damage model for quasi-brittle metals informed with crack evolution statistics. J. Mech. Phys. Solids 2020, 138, 103921. [Google Scholar] [CrossRef]
- Godinez, H.C.; Rougier, E.; Osthus, D.; Lei, Z.; Knight, E.; Srinivasan, G. Fourier amplitude sensitivity test applied to dynamic combined finite-discrete element methods–based simulations. Int. J. Numer. Anal. Methods Geomech. 2019, 43, 30–44. [Google Scholar] [CrossRef] [Green Version]
- Osthus, D.; Godinez, H.C.; Rougier, E.; Srinivasan, G. Calibrating the stress-time curve of a combined finite-discrete element method to a Split Hopkinson Pressure Bar experiment. Int. J. Rock Mech. Min. Sci. 2018, 106, 278–288. [Google Scholar] [CrossRef]
- Munjiza, A.; Andrews, K.; White, J. Combined single and smeared crack model in combined finite-discrete element analysis. Int. J. Numer. Methods Eng. 1999, 44, 41–57. [Google Scholar] [CrossRef]
- Carey, J.W.; Lei, Z.; Rougier, E.; Mori, H.; Viswanathan, H. Fracture-permeability behavior of shale. J. Unconv. Oil Gas Resour. 2015, 11, 27–43. [Google Scholar] [CrossRef]
- Gao, K.; Guyer, R.; Rougier, E.; Ren, C.X.; Johnson, P.A. From Stress Chains to Acoustic Emission. Phys. Rev. Lett. 2019, 123, 048003. [Google Scholar] [CrossRef] [PubMed] [Green Version]
- Klinger, Y.; Okubo, K.; Vallage, A.; Champenois, J.; Delorme, A.; Rougier, E.; Lei, Z.; Knight, E.E.; Munjiza, A.; Satriano, C.; et al. Earthquake Damage Patterns Resolve Complex Rupture Processes. Geophys. Res. Lett. 2018, 45, 10279–10287. [Google Scholar] [CrossRef] [Green Version]
- Okubo, K.; Bhat, H.S.; Rougier, E.; Marty, S.; Schubnel, A.; Lei, Z.; Knight, E.E.; Klinger, Y. Dynamics, Radiation, and Overall Energy Budget of Earthquake Rupture With Coseismic Off-Fault Damage. J. Geophys. Res. Solid Earth 2019, 124, 11771–11801. [Google Scholar] [CrossRef] [Green Version]
- Rougier, E.; Knight, E.; Broome, S.; Sussman, A.; Munjiza, A. Validation of a three-dimensional Finite-Discrete Element Method using experimental results of the Split Hopkinson Pressure Bar test. Int. J. Rock Mech. Min. Sci. 2014, 70, 101–108. [Google Scholar] [CrossRef]
- Chau, V.; Rougier, E.; Lei, Z.; Knight, E.E.; Gao, K.; Hunter, A.; Srinivasan, G.; Viswanathan, H. Numerical analysis of flyer plate experiments in granite via the combined finite–discrete element method. Comput. Part. Mech. 2020, 7, 1005–1016. [Google Scholar] [CrossRef]
- Froment, M.; Rougier, E.; Larmat, C.; Lei, Z.; Euser, B.; Kedar, S.; Richardson, J.E.; Kawamura, T.; Lognonné, P. Lagrangian-based Simulations of Hypervelocity Impact Experiments on Mars Regolith Proxy. Geophys. Res. Lett. 2020, 47, e2020GL087393. [Google Scholar] [CrossRef]
- Lyon, S.P.; Johnson, J.D. SESAME: The Los Alamos National Laboratory Equation of State Database; Technical Report; LA-UR-92-3407; Los Alamos National Laboratory: Livermore, CA, USA, 1992. [Google Scholar]
- Margolin, L. A centered artificial viscosity for cells with large aspect ratio. NASA STI/Recon Tech. Rep. N 1988, 89, 13748. [Google Scholar]
- Tillotson, J.H. Metallic Equations of State for Hypervelocity Impact; Technical Report; General Atomics: San Diego, CA, USA, 1962. [Google Scholar]
- O’Keefe, J.D.; Ahrens, T.J. Cometary and Meteorite Swarm Impact on Planetary Surfaces. J. Geophys. Res. Solid Earth 1982, 87, 6668–6680. [Google Scholar] [CrossRef] [Green Version]
- Robertson, D.K.; Gisler, G.R. Near and far-field hazards of asteroid impacts in oceans. Acta Astronaut. 2019, 156, 262–277. [Google Scholar] [CrossRef]
- Saito, T.; Kaiho, K.; Abe, A.; Katayama, M.; Takayama, K. Hypervelocity impact of asteroid/comet on the oceanic crust of the earth. Int. J. Impact Eng. 2008, 35, 1770–1777. [Google Scholar] [CrossRef]
- Boslough, M.; Jennings, B.; Carvey, B.; Fogleman, W. FEMA Asteroid Impact Tabletop Exercise Simulations. Procedia Eng. 2015, 103, 43–51. [Google Scholar] [CrossRef] [Green Version]
- Stickle, A.; Atchison, J.; Barnouin, O.; Cheng, A.; Crawford, D.; Ernst, C.; Fletcher, Z.; Rivkin, A. Modeling Momentum Transfer from Kinetic Impacts: Implications for Redirecting Asteroids. Procedia Eng. 2015, 103, 577–584. [Google Scholar] [CrossRef] [Green Version]
- Amsden, A.; Ruppel, H.; Hirt, C. SALE: A Simplified ALE Computer Program for Fluid Flow at All Speeds; Technical Report; Los Alamos Scientific Lab.: Livermore, CA, USA, 1980. [Google Scholar]
- Ivanov, B.; Deniem, D.; Neukum, G. Implementation of dynamic strength models into 2D hydrocodes: Applications for atmospheric breakup and impact cratering. Int. J. Impact Eng. 1997, 20, 411–430. [Google Scholar] [CrossRef]
- Gittings, M.; Weaver, R.; Clover, M.; Betlach, T.; Byrne, N.; Coker, R.; Dendy, E.; Hueckstaedt, R.; New, K.; Oakes, W.R.; et al. The RAGE radiation-hydrodynamic code. Comput. Sci. Discov. 2008, 1, 015005. [Google Scholar] [CrossRef] [Green Version]
- Shuvalov, V. Multi-dimensional hydrodynamic code SOVA for interfacial flows: Application to the thermal layer effect. Shock Waves 1999, 9, 381–390. [Google Scholar] [CrossRef]
- Benz, W.; Asphaug, E. Simulations of brittle solids using smooth particle hydrodynamics. Comput. Phys. Commun. 1995, 87, 253–265. [Google Scholar] [CrossRef]
- Hayes, J.C.; Norman, M.L.; Fiedler, R.A.; Bordner, J.O.; Li, P.S.; Clark, S.E.; Mac Low, M.M. Simulating Radiating and Magnetized Flows in Multiple Dimensions with ZEUS-MP. Astrophys. J. Suppl. Ser. 2006, 165, 188. [Google Scholar] [CrossRef] [Green Version]
- Johnson, G.R.; Cook, W.H. Fracture characteristics of three metals subjected to various strains, strain rates, temperatures and pressures. Eng. Fract. Mech. 1985, 21, 31–48. [Google Scholar] [CrossRef]
- Steinberg, D.J. Equation of State and Strength Properties of Selected Materials; Technical Report UCRL-MA-106439; Lawrence Livermore National Laboratory: Livermore, CA, USA, 1996. [Google Scholar]


| Parameter | Description [49,50] | Value | Units |
|---|---|---|---|
| Density | 2700 | kg m−3 | |
| a | Tillotson parameter | 0.5 | – |
| b | Tillotson parameter | 1.63 | – |
| A | Bulk modulus | 75.2 | GPa |
| B | Tillotson parameter | 65 | GPa |
| Tillotson parameter | 5 | MJ kg−1 | |
| Tillotson parameter | 5 | – | |
| Tillotson parameter | 5 | – | |
| Energy of incipient vaporization | 3.0 | MJ kg−1 | |
| Energy of complete vaporization | 13.9 | MJ kg−1 |
| Normal—5 km/s | 45°—5 km/s | Normal—20 km/s | 45°—20 km/s | ||
|---|---|---|---|---|---|
| Number of cores | 1961 | 1961 | 1961 | 1961 | |
| HOSS | Run time (hr:min) | 32:00 | 32:00 | 32:00 | 32:00 |
| Simulated time (s) | 1.07 | 1.07 | 1.07 | 1.07 | |
| Number of cores | 360 | 360 | 360 | 360 | |
| FLAG | Run time (hr:min) | 02:27 | 03:34 | 01:48 | 01:58 |
| Simulated time (s) | 3.00 | 1.10 | 2.06 | 0.29 |
| Maximum Pressure | 1D Analytic Solution | Pierazzo et al. [5] Mean * | FLAG | HOSS |
|---|---|---|---|---|
| 5 km/s—point of impact | 58.725 GPa | – | 59.58 GPa | 52.66 GPa |
| Relative Error | – | – | 1.46 % | −10.33 % |
| 5 km/s—200 m into target | 58.725 GPa | 40.4 GPa | 55.77 GPa | 54.85 GPa |
| Relative Error | – | −31.2 % | −5.03 % | −6.59 % |
| 20 km/s—point of impact | 506.25 GPa | – | 492.63 GPa | 438.96 GPa |
| Relative Error | – | – | −2.69 % | −13.29 % |
| 20 km/s—685 m into target | 506.25 GPa | 379.0 GPa | 407.99 GPa | 393.24 GPa |
| Relative Error | – | −25.14 % | −19.41 % | −22.32 % |
Publisher’s Note: MDPI stays neutral with regard to jurisdictional claims in published maps and institutional affiliations. |
© 2021 by the authors. Licensee MDPI, Basel, Switzerland. This article is an open access article distributed under the terms and conditions of the Creative Commons Attribution (CC BY) license (http://creativecommons.org/licenses/by/4.0/).
Share and Cite
Caldwell, W.K.; Euser, B.; Plesko, C.S.; Larmat, C.; Lei, Z.; Knight, E.E.; Rougier, E.; Hunter, A. Benchmarking Numerical Methods for Impact and Cratering Applications. Appl. Sci. 2021, 11, 2504. https://doi.org/10.3390/app11062504
Caldwell WK, Euser B, Plesko CS, Larmat C, Lei Z, Knight EE, Rougier E, Hunter A. Benchmarking Numerical Methods for Impact and Cratering Applications. Applied Sciences. 2021; 11(6):2504. https://doi.org/10.3390/app11062504
Chicago/Turabian StyleCaldwell, Wendy K., Bryan Euser, Catherine S. Plesko, Carene Larmat, Zhou Lei, Earl E. Knight, Esteban Rougier, and Abigail Hunter. 2021. "Benchmarking Numerical Methods for Impact and Cratering Applications" Applied Sciences 11, no. 6: 2504. https://doi.org/10.3390/app11062504