Article

Low Radiation Dose Implications in Obese Abdominal Computed Tomography Imaging

by
Abdulaziz A. Qurashi
1,*,
Louise A. Rainford
2,
Fahad H. Alhazmi
1,
Khalid M. Alshamrani
3,4,
Abdelmoneim Sulieman
5,
Walaa M. Alsharif
1,
Sultan A. Alshoabi
1,
Moawia B. Gameraddin
1,
Khalid M. Aloufi
1,
Shrooq T. Aldahery
6 and
Shane J. Foley
2
1
Diagnostic Radiology Technology, College of Applied Medical Sciences, Taibah University, Al-Madinah 12512, Saudi Arabia
2
Radiography & Diagnostic Imaging, School of Medicine, University College Dublin, Belfield, 4 Dublin, Ireland
3
College of Applied Medical Sciences, King Saud bin Abdulaziz University for Health Sciences, Jeddah 21423, Saudi Arabia
4
King Abdullah International Medical Research Center, Jeddah 21423, Saudi Arabia
5
Department of Radiology and Medical Imaging, College of Applied Medical Sciences, Prince Sattam bin Abdulaziz University, P.O. Box 422, Alkharj 11942, Saudi Arabia
6
Applied Radiologic Technology, College of Applied Medical Sciences, University of Jeddah, Jeddah 21512, Saudi Arabia
*
Author to whom correspondence should be addressed.
Appl. Sci. 2021, 11(6), 2456; https://doi.org/10.3390/app11062456
Submission received: 14 February 2021 / Revised: 3 March 2021 / Accepted: 5 March 2021 / Published: 10 March 2021
(This article belongs to the Special Issue Applications to Biophysics and Medical Physics)

Abstract

:

Featured Application

This study’s results provide evidence for dose reductions of up to 60% in obese patients using a low-dose protocol with iterative reconstruction, whereby the benefits greatly outweigh the radiogenic risks from computed tomography (CT) procedures.

Abstract

The aim of this study was to evaluate the implications of low radiation dose in abdominal computed tomography (CT) when combined with noise reduction filters and to see if this approach can overcome the challenges that arise while scanning obese patients. Anthropomorphic phantoms layered with and without 3-cm-thick circumferential animal fat packs to simulate different sized patients were scanned using a 128-slice multidetector CT (MDCT) scanner. Abdominal protocols (n = 12) were applied using various tube currents (150, 200, 250, and 300 mA) and tube voltages (100, 120, and 140 kVp). MOSFET dosimeters measured the internal organ dose. All images were reconstructed with filtered back projection (FBP) and different iterative reconstruction (IR) strengths (SAFIRE 3, SAFIRE 4, and SAFIRE 5) techniques and objective noise was measured within three regions of interests (ROIs) at the level of L4–L5. Organ doses varied from 0.34–56.2 mGy; the colon received the highest doses for both phantom sizes. Compared to the normal-weighted phantom, the obese phantom was associated with an approximately 20% decrease in effective dose. The 100 kVp procedure resulted in a 40% lower effective dose (p < 0.05) compared to at 120 kVp and the associated noise increase was improved by increasing the IR (5) use, which resulted in a 60% noise reduction compared to when using FBP (p < 0.05). When combined with iterative reconstruction, the low-kVp approach is feasible for obese patients in order to optimize radiation dose and maintain objective image quality.

1. Introduction

The prevalence of obese patients undergoing computed tomography (CT) continues to increase. Bariatric imaging is associated with both technical limitations and potentially compromised image quality in CT [1,2,3,4], as increased radiation output is required to compensate for the additional absorption of the X-ray beams and the reduction of signals reaching the CT detector. However, this results in higher patient doses, depending on patient shape, size, and composition [5]. Given that CT does not carry an image quality penalty for overexposures, CT personnel should stop erring on the side of lower than necessary noise levels for obese patients, which comes at the price of higher dose level [6,7]. Indeed, the optimal image quality level for CT examinations with different clinical indications (i.e., the level at which diagnostic images can reliably be produced using the lowest dose level) should be tailored for individual patients and also for relevant groups (e.g., pediatric or obese patients).
CT scanning techniques must always aim for optimum image quality at the lowest possible radiation exposure to patients. CT personnel are fundamentally responsible for controlling exposure parameters influencing radiation dose [8]. Modifying these parameters can influence image quality, thus causing higher noise levels, which can affect the low-contrast detection ability [9]. The challenge is to identify the acceptable image quality that allows the clinical question to be answered, which has not been done yet for obese patients undergoing abdominal CT [9,10]. The patients’ effective dose for abdominal CT might exceed 100 mSv, which would increase the cancer risk to 1 cancer case per 200 abdominal CT procedures [1]. Therefore, development of a CT dose reduction protocol is recommended to avoid unnecessary radiation risk.
In this study, abdominal CT protocols were investigated because this area of the body is typically the most prone to compromised image quality due to patient girth. Therefore, an anthropomorphic phantom was used to manipulate the scanning parameters. Both the image quality and radiation doses were measured and the information obtained was used to help optimize scanning protocols for clinical use.

2. Materials and Methods

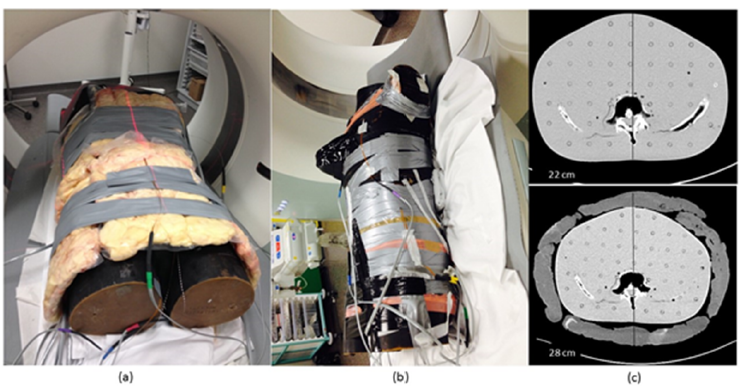
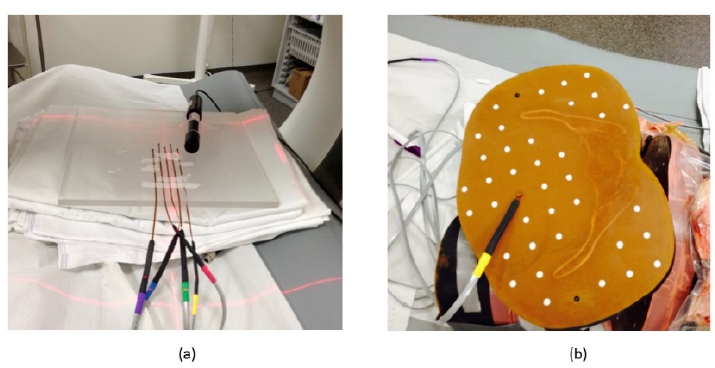
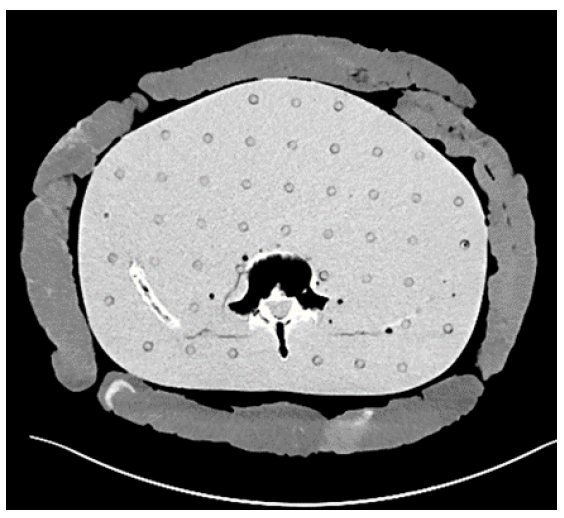
2.1. Phantom Preparation

Organ doses and image quality were assessed using male adult anthropomorphic phantoms (RANDO, Alderson Research Laboratories, Stamford, CT, USA). To define the patient size classifications (i.e., normal-weighted and obese) for the anthropomorphic phantom, demographic (age, gender) and anatomical (weight (kg), height (m), body mass index (BMI)) data were retrospectively collected from medical records of 177 patients after obtaining institutional ethical approval. On each CT scan, the anterior–posterior (AP) abdominal diameter was measured using the level of the upper pole of the right kidney as a landmark. Data analysis showed that obese (BMI ≥ 30 kg m−2), overweight (BMI: 25–29.9 kg m−2), and normal-weighted (BMI: 18.5–24.9 kg m−2) patients’ AP diameters were 28 cm ± 4.2, 24 cm ± 2.4, and 22 cm ± 2.9, respectively.
Two phantom structures were then built to simulate normal-weighted (i.e., AP diameter = 22 cm) and obese (i.e., AP diameter = 28 cm) phantoms using beef fat. Each fat layer was vacuum packed. Single circumferential animal (beef) fat packs measuring 3 cm in thickness forming a subcutaneous fat layer were used to mimic obese patients. The layers were adherently attached to the abdominal area (Figure 1).
Additionally, the CT attenuation property of the applied fat was checked to ensure it had similar Hounsfield unit (HU) values to that of human adipose fat. The fat was scanned several times using different tube potential (kVp) settings of 100 and 120 kVp, with a fixed tube current (mA) of 150. The HU values (−89 and −88, respectively) were within the typical human fat attenuation range, as shown by CT images (−195 to −45 HU) [11].

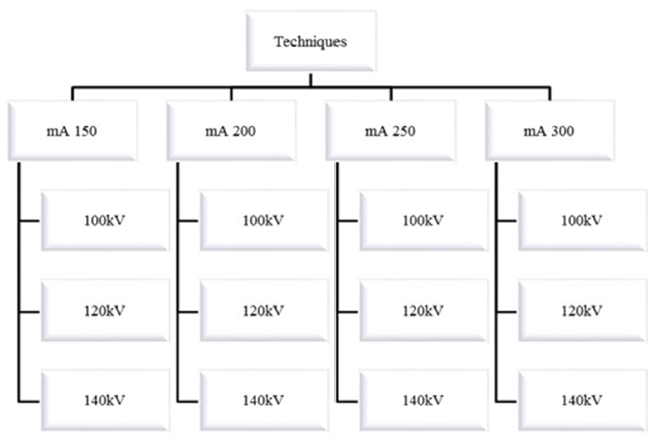
2.2. Scanning Protocol

The phantoms were scanned using a 128-section CT instrument (Siemens Healthineers, Forchheim, Germany). The CT scanner undergoes frequent quality control testing by a qualified medical physicist. As per international guidelines, computed tomography dose index (CTDI) in air was shown to be acceptable [12]. Different tube currents and tube potentials were used for both phantom conditions (Figure 2).
The manual adjustment of the mA and kVp selections was done according to the previous survey conducted in 21 clinical centers by Qurashi et al [13]. The resultant data were then reconstructed using iterative reconstruction (Sinogram affirmed iterative reconstruction (SAFIRE)) with different strengths (SAFIRE 3, SAFIRE 4, and SAFIRE 5), as well as standard filtered back projection (FBP). Thus, every protocol involved four image reconstruction sets. All other parameters were the same (Table 1).

2.3. Dosimetry

Abdominal organ and skin dosing procedures were performed using a metal oxide semiconductor field effect transistor (MOSFET) system (model TN–RD–60, Thomson-Nielsen) with high-sensitivity radiology dosimeters (TN–1002RD, Thomson-Nielsen). Calibration of the dosimeters was carried out at 120 kVp alongside a Radcal® ionization chamber (model 9095, Radcal, Monrovia, CA, USA) on a calibration jig on the CT table (Figure 3). The jig allows convenient positioning at the isocenter of the beam, thereby allowing a reproducible calibration procedure.
In order to compute the calibration factor (mV/cGy), the MOSFET readings (mV) and the dose delivered (cGy) were used. Tube voltages other than 120 kVp were not used because MOSFET has been shown to be energy-independent [14].
Twelve detectors were inserted into different organ locations for every scan performed (Table 2). On the outward most surfaces of the phantoms, two dosimeters were positioned posteriorly and anteriorly to measure skin doses. To account for the doses absorbed by female breast tissue, a female breast phantom was placed on the thoracic area and was stabilized with nylon screws. The organs where doses were measured have the highest radiosensitivity in the scanned area as per the International Commission on Radiological Protection (ICRP) publication 103 (2007) [15].
Delivered dose metrics, including dose length product (DLP), volume CT dose index (CTDIvol), and tube current (mA) values, were collected at the end of each scan. Each protocoled exam was performed three times in order to average the MOSFET dose measurements, as well as the delivered dose metrics. Additionally, the effective dose in milliSievert (mSv) was calculated by multiplying each individual organ by its ICRP tissue-weighting factor and adding all organ doses together.

2.4. Objective Analysis of CT Image Quality

Image quality was objectively assessed using a dedicated workstation (Leonardo, Siemens Healthineers, Forchheim, Germany) by analyzing transverse 5-mm-thick reconstructed images. Noise values in standard deviations (SDs) were used as objective measures of CT image quality. Measurements were performed by drawing a 30 mm2 region of interest centrally and peripherally at level L3–L4 on three slices consecutively to avoid misreading of the measurements that could be caused by beam hardening (Figure 4). Signal-to-noise ratio (SNR) values were determined by dividing HU values in the 30 mm2 diameter region of interest by SDs.
−SNR = HU/SD

2.5. Statistical Analysis

All analyses were performed with the SPSS statistical package (IBM SPSS Statistics (version 24)). Initial descriptive statistics (means and standard deviations) were generated for organ doses. Data (i.e., radiation dose and noise variables) distribution normality was examined using the Kolmogorov–Smirnov test. To compare between protocols in terms of objective noise, SNR, and radiation dose measurements, Mann–Whitney U and Kruskal-Wallis tests were used. Statistical tests were conducted at a significance level of 0.05.

3. Results

3.1. Radiation Dose

The organ dose results show that spleen, kidneys, liver, colon, and stomach received the highest dose among all protocols, whereas the lowest dose was received by female breast tissue. The obese condition resulted in an approximate 20% dose reduction in effective and mean organ dose when compared to the normal-weighted condition, without reaching a statistically significant difference, except for in the spine, spleen, and stomach (Table 3 and Table 4). Increasing the tube current by 50 intervals resulted in an increase in organ and effective doses for both phantom conditions, as shown in Table 3 and Table 4. A statistically significant difference was seen when mA was increased from 150 to 250 and 300 for both phantom conditions. Significant reductions in CTDIvol (mGy), DLP(mGy·cm), and effective dose were seen when the tube potential was reduced from 120 to 100 kVp (approximately 40%) and an approximately 56% reduction was seen when the 140 kVp strength was reduced to 100 (p < 0.05). The impacts of using different kVp strengths on abdominal organ doses are shown in Table 3.

3.2. CT Objective Image Quality Assessment

The objective noise measurements performed on the 96 generated datasets from both obese and normal-weighted were evaluated. Comparing the noise levels measured across all protocols, reconstruction options, and kVp selections between the normal-weighted and the obese conditions showed that the noise levels for the latter were always significantly higher (p < 0.05) (Figure 5a,b). As the tube current was increased, a gradual improvement in noise levels was noticed for both phantom simulations. However, when the tube current was increased by 100%, a significant reduction in noise was seen. For the matched tube current and potential selections, comparing FBP with iterative reconstruction values showed noise reductions of 40%, 50%, and 60% for strengths SAFIRE 3, SAFIRE 4, and SAFIRE 5, respectively (p < 0.05). For the matched tube current, significant noise increases were shown when the tube voltage was reduced from 140kVp to 120kVp and 100kVp (p < 0.05). Similarly, the SNR measured for the 120 kVp protocol was higher (24%) than for the 100 kVp protocol, without reaching a statistically significant difference when FBP was used. However, when iterative reconstruction was used, the 100 kVp setting showed significant improvement in SNR and noise levels compared to the 120 kVp setting (p < 0.05) (Figure 5 and Figure 6).

4. Discussion

Our study showed that adding 6 cm of fat tissue to the anthropomorphic phantom caused up to 20% lower organ and effective doses when the same exposure settings were applied. Such a finding was expected due to the fat shielding, which attenuates the photons before reaching the internal organs. Given that no evidence currently attests to the radiosensitivity of fat, our findings could be positive for obese patients [16]. Therefore, using DLP values to estimate effective patient doses may not be as accurate as the actual absorbed doses measured in the organs [17].
Given the introduction of iterative algorithms that facilitate noise reductions for low-dose scans, the use of scanning techniques delivering relatively higher radiation doses for obese patients may not be justified any longer. Indeed, the use of this software can permit the use of low-dose scans that allow for dose reduction while maintaining diagnostic images for abdominal CT scans. This study showed that the abdominal protocol for the obese phantom at 100 kVp and with iterative reconstruction results in a 77.7% increase in SNR (at SAFIRE5) compared to at 120 kVp and with FBP for the matched tube current selection. This improvement in SNR is associated with up to 40% lower radiation dose. Furthermore, it is worth noting the scale of the individual mean values shown in Figure 5, which would seem to be in the diagnostic range, although no recommendation has been issued for an acceptable level of image noise for abdominal CT.
The presence of internal fat can be beneficial for obese patients due to the potential improvement in natural contrast between organs. Hence, relatively higher noise can be acceptable, which facilitates the use of lower radiation doses. Although there is no widely accepted threshold for noise in the abdomen, the noise level values measured for obese patients in this study were all below 15 SD, which would likely be an acceptable level for most clinical indications. Therefore, radiographers should be careful not to aim for higher than necessary values for specific clinical indications.
The deterioration in image quality for obese patients with low-dose protocols with FBP results from poorer image noise caused by increased photon absorption and scattering [1,18,19]. The use of IR, on the other hand, can cause noise reduction, which could be an alternative to the use of higher kVp of at least 120 and up to 140 when scanning patients of larger size to improve image noise at the price of higher dosage, as recommended by different studies [9,20,21]. However, this approach was used without an IR algorithm, which allows further dose and noise reductions while maintaining diagnostic acceptability, which has been proven in abdominal CT scans of obese patients [6]. Furthermore, lower kVps have the advantage of improving the contrast resolution of image [22].
For all abdominal organs, higher doses were received by the normal-weighted phantom when compared to the obese phantom, without reaching a statistical difference due to less attenuation of the beam. In a similar study, a significant dose increase was delivered to the overweight simulated phantom when higher image quality was requested by CT users by reducing the noise index by about 20% (15–12.5 H) [23]. This finding is in parallel to the difference in dosage seen in this study when the mA value selections were increased from 150 to 300 for the obese phantom. DLP and organ doses were increased by almost two-fold, which was expected. However, noise values were only reduced by 25–30% due to the inversely proportional relationship to the square root of change of the tube current. For instance, a 100% increase of the tube current will improve the image noise by approximately 40% [24].
Regardless of the reduced radiation dose, in this study, it was still unknown if such a difference was clinically detectable or significant, especially when IR was used for abdominal CT studies for obese patients when compared to FBP, even with low-dose scans. Our findings showed up to a 40% dose reduction with a comparable noise level for the obese condition when IR was used for the protocol at 100 kVp compared to the protocols using 120 kVp and FBP for the matched tube current values. These findings are similar to both clinical and phantom studies, which have reported image noise reductions with IR techniques for CT scanning of obese patients [25,26,27]. Additionally, it has been shown in a prior study by Ziegler et al. that different iterative reconstruction techniques can achieve comparable noise levels with up to nine-fold reductions in radiation dose [1,28]. Indeed, IR application in this study has shown its usefulness in improving image quality with constant dosage or for dose optimization with constant image quality.
The limitations of this study stem from the subjective evaluation of image quality in our phantom, which was not possible owing to the absence of abdominal organs (Figure 4). Another limitation is the use of noise only as an image quality metric, particularly with IR algorithms and the subsequent noise texture consideration.
Additionally, the experiments were carried out on a CT scanner from a single manufacturer. Image quality differences among CT studies due to the use of different manufacturer protocols is anticipated owing to the variations in delivered dose, image reconstruction, iterative reconstruction types, and exposure parameter modulation methods [29,30]. Our simulation of obese individuals was limited due to difficulties in covering all obesity classifications.
The animal fat used in our simulation was a useful and accurate surrogate for subcutaneous fat and is useful for optimization studies. The advantage of using such fat tissue is its affordable price and easy manipulation using the layering approach as compared to other phantom simulation approaches, such as using a fat ring of epoxy resin material, whereby covering the whole abdomen and pelvis is technically unfeasible due to the curved nature of the phantom at the lower abdominal level [31].

5. Conclusions

The relatively low tube voltage technique with the use of iterative reconstruction is viable and beneficial for larger patients undergoing abdominal CT, especially in terms of radiation dose reduction. This study showed that abdominal CT performed at 100 kVp results in significant radiation dose reduction. The SNR and noise level were significantly improved when iterative reconstruction was used. Hence, the advantages of using the low-dose protocol with iterative reconstruction greatly outweigh the disadvantage of using high-dose techniques with filtered back projection. Further research should be conducted to examine the diagnostic value of the low-kVp technique with iterative reconstruction in assessing obese patients undergoing abdominal CT.

Author Contributions

Conceptualization, A.A.Q., F.H.A., K.M.A. (Khalid M. Alshamrani), A.S., W.M.A., S.A.A., and S.J.F.; data curation, L.A.R., K.M.A. (Khalid M. Alshamrani), M.B.G., K.M.A. (Khalid M. Aloufi), and S.T.A.; formal analysis, A.A.Q., L.A.R., A.S., W.M.A., S.T.A., and S.J.F.; investigation, F.H.A., A.S., S.A.A., and S.T.A.; methodology, A.A.Q.; L.A.R., A.S., W.M.A., M.B.G., K.M.A. (Khalid M. Aloufi), and S.T.A.; project administration, A.A.Q., L.A.R., F.H.A., K.M.A. (Khalid M. Aloufi), and S.J.F.; resources, K.M.A. (Khalid M. Alshamrani), S.A.A., M.B.G., and S.T.A.; software, K.M.A. (Khalid M. Alshamrani), W.M.A., and S.J.F.; supervision, A.A.Q. and S.A.A.; visualization, K.M.A. (Khalid M. Alshamrani); writing—original draft, A.A.Q., F.H.A., M.B.G., and K.M.A. (Khalid M. Aloufi); writing—review and editing, L.A.R., A.S., and S.J.F. All authors have read and agreed to the published version of the manuscript.

Funding

This research received no external funding.

Institutional Review Board Statement

Not applicable.

Informed Consent Statement

Not applicable.

Data Availability Statement

Data available on request.

Acknowledgments

We thank Bandar Almotairi for his support and encouragement.

Conflicts of Interest

The authors declare no conflict of interest.

References

  1. Sulieman, A.; Adam, H.; Elnour, A.; Tamam, N.; Alhaili, A.; Alkhorayef, M.; Alghamdi, S.; Khandaker, M.U.; Bradley, D.A. Patient radiation dose reduction using a commercial iterative reconstruction technique package. Radiat. Phys. Chem. 2021, 178, 108996. [Google Scholar] [CrossRef]
  2. Schindera, S.T.; Nelson, R.C.; Lee, E.R.; Delong, D.M.; Ngyen, G.; Toncheva, G.; Yoshizumi, T.T. Abdominal Multislice CT for Obese Patients: Effect on Image Quality and Radiation Dose in a Phantom Study. Acad. Radiol. 2007, 14, 486–494. [Google Scholar] [CrossRef] [PubMed]
  3. Konkol, M.; Sniatała, K.; Sniatała, P.; Wilk, S.; Baczynska, B.; Milecki, P. Computer Tools to Analyze Lung CT Changes after Radiotherapy. Appl. Sci. 2021, 11, 1582. [Google Scholar] [CrossRef]
  4. Manabe, K.; Asami, Y.; Yamada, T.; Sugimori, H. Improvement in the Convolutional Neural Network for Computed Tomography Images. Appl. Sci. 2021, 11, 1505. [Google Scholar] [CrossRef]
  5. Bamberg, F.; Marcus, R.; Petersilka, M.; Nikolaou, K.; Becker, C.; Reiser, M.; Johnson, T. Challenges for computed tomography of overweight patients. Der Radiol. 2011, 51, 366–371. [Google Scholar] [CrossRef] [PubMed]
  6. Desai, G.S.; Uppot, R.N.; Elaine, W.Y.; Kambadakone, A.R.; Sahani, D.V. Impact of iterative reconstruction on image quality and radiation dose in multidetector CT of large body size adults. Eur. Radiol. 2012, 22, 1631–1640. [Google Scholar] [CrossRef] [PubMed]
  7. Lewis, M. Radiation dose issues in multi-slice CT scanning. ImPACT Technol. Update 2005, 3, 1–4. [Google Scholar]
  8. Zarb, F.; Mcentee, M.F.; Rainford, L. CT radiation dose and image quality optimization using a porcine model. Radiol. Technol. 2013, 85, 127–136. [Google Scholar] [PubMed]
  9. Higaki, T.; Nakamura, Y.; Fukumoto, W.; Honda, Y.; Tatsugami, F.; Awai, K. Clinical application of radiation dose reduction at abdominal CT. Eur. J. Radiol. 2019, 111, 68–75. [Google Scholar] [CrossRef] [PubMed]
  10. Forbrig, R.; Ingrisch, M.; Stahl, R.; Winter, K.S.; Reiser, M.; Trumm, C.G. Radiation dose and image quality of high-pitch emergency abdominal CT in obese patients using third-generation dual-source CT (DSCT). Sci. Rep. 2019, 9, 1–10. [Google Scholar] [CrossRef] [PubMed]
  11. Maurovich-Horvat, P.; Massaro, J.; Fox, C.S.; Moselewski, F.; O’Donnell, C.J.; Hoffmann, U. Comparison of anthropometric, area- and volume-based assessment of abdominal subcutaneous and visceral adipose tissue volumes using multi-detector computed tomography. Int. J. Obes. 2007, 31, 500–506. [Google Scholar] [CrossRef] [Green Version]
  12. Mccollough, C.; Edyvean, S.; Cody, D.; Geise, R.; Gould, B. AAPM Report No. 96: The Measurement, Reporting, and Management of Radiation dose in CT—Report of AAPM Task Group 23 of the Diagnostic Imaging Council CT Committee. American Association of Physicists in Medicine Website. 2008. Available online: http://www.aapm.org/pubs/reports/RPT96.pdf (accessed on 25 January 2021).
  13. Qurashi, A.; Rainford, L.; Ajlan, A.; Khashoggi, K.; Ashkar, L.; AL-Raddadi, M.; AL-Ghamdi, M.; AL-Thobaiti, M.; Foley, S. Optimal abdominal CT protocol for obese patients. Radiography 2018, 24, e1–e12. [Google Scholar] [CrossRef] [PubMed]
  14. Kumar, A.S.; Singh, I.R.R.; Sharma, S.; Ravindran, B.P. Performance characteristics of mobile MOSFET dosimeter for kilovoltage X-rays used in image guided radiotherapy. J. Med. Phys. 2015, 40, 123–128. [Google Scholar]
  15. ICRP 2007. The 2007 Recommendations of the International Commission on Radiological Protection. Ann. ICRP 2007, 37, 1–332. [Google Scholar]
  16. ICRP 2012. ICRP Statement on Tissue Reactions/Early and Late Effects of Radiation in Normal Tissues and Organs—Threshold Doses for Tissue Reactions in a Radiation Protection Context. Ann. ICRP 2012, 41, 1–322. [Google Scholar] [CrossRef] [PubMed]
  17. Huda, W.; Ogden, K.M.; Khorasani, M.R. Converting Dose-Length Product to Effective Dose at CT. Radiology 2008, 248, 995–1003. [Google Scholar] [CrossRef]
  18. Wang, R.; Schoepf, U.J.; Wu, R.; Reddy, R.P.; Zhang, C.; Yu, W.; Liu, Y.; Zhang, Z. Image quality and radiation dose of low dose coronary CT angiography in obese patients: Sinogram affirmed iterative reconstruction versus filtered back projection. Eur. J. Radiol. 2012, 81, 3141–3145. [Google Scholar] [CrossRef]
  19. Sulieman, A.; Adam, H.; Mahmoud, M.Z.; Hamid, O.; Alkhorayef, M.; Bradley, D. Radiogenic risk assessment for abdominal vascular computed tomography angiography. Radiat. Phys. Chem. 2020, 168, 1–5. [Google Scholar] [CrossRef]
  20. Uppot, R.N.; Sahani, D.V.; Hahn, P.F.; Gervais, D.; Mueller, P.R. Impact of obesity on medical imaging and image-guided intervention. Am. J. Roentgenol. 2007, 188, 433–440. [Google Scholar] [CrossRef]
  21. Ding, A.; Mille, M.M.; Liu, T.; Caracappa, P.F.; Xu, X.G. Extension of RPI-adult male and female computational phantoms to obese patients and a Monte Carlo study of the effect on CT imaging dose. Phys. Med. Biol. 2012, 57, 2441–2459. [Google Scholar] [CrossRef] [Green Version]
  22. Marin, D.; Nelson, R.C.; Schindera, S.T.; Richard, S.; Youngblood, R.S.; Yoshizumi, T.T.; Samei, E. Low-tube-voltage, high-tube-current multidetector abdominal CT: Improved image quality and decreased radiation dose with adaptive statistical iterative reconstruction algorithm--initial clinical experience. Radiology 2010, 254, 145–153. [Google Scholar] [CrossRef]
  23. Schabel, C.; Fenchel, M.; Schmidt, B.; Flohr, T.G.; Wuerslin, C.; Thomas, C.; Korn, A.; Tsiflikas, I.; Claussen, C.D.; Heuschmid, M. Clinical evaluation and potential radiation dose reduction of the novel sinogram-affirmed iterative reconstruction technique (SAFIRE) in abdominal computed tomography angiography. Acad. Radiol. 2013, 20, 165–172. [Google Scholar] [CrossRef] [PubMed]
  24. Maldjian, P.D.; Goldman, A.R. Reducing radiation dose in body CT: A primer on dose metrics and key CT technical parameters. Am. J. Roentgenol. 2013, 200, 741–747. [Google Scholar] [CrossRef]
  25. Gariani, J.; Martin, S.P.; Botsikas, D.; Becker, C.D.; Montet, X. Evaluating the effect of increased pitch, iterative reconstruction and dual source CT on dose reduction and image quality. Br. J. Radiol. 2018, 91, 20170443. [Google Scholar] [CrossRef] [Green Version]
  26. Zhang, H.; Ma, Y.; Lyu, J.; Yang, Y.; Yuan, W.; Song, Z. Low kVp and low concentration contrast agent with iterative reconstruction of computed tomography (CT) coronary angiography: A preliminary study. Med. Sci. Monit. 2017, 23, 5005–5010. [Google Scholar] [CrossRef] [Green Version]
  27. Berlin, S.C.; Weinert, D.M.; Vasavada, P.S.; Martinez-rios, C.; Parikh, R.A.; Wien, M.A.; Jordan, D.W.; Novak, R.D. Successful dose reduction using reduced tube voltage with hybrid iterative reconstruction in pediatric abdominal CT. Am. J. Roentgenol. 2015, 205, 392–393. [Google Scholar] [CrossRef] [PubMed]
  28. Ziegler, A.; Köhler, T.; Proksa, R. Noise and resolution in images reconstructed with FBP and OSC algorithms for CT. Med. Phys. 2007, 34, 585–598. [Google Scholar] [CrossRef] [PubMed]
  29. Mckenney, S.E.; Seibert, J.A.; Lamba, R.; Boone, J.M. Methods for CT automatic exposure control protocol translation between scanner platforms. J. Am. Coll. Radiol. 2014, 11, 285–291. [Google Scholar] [CrossRef] [Green Version]
  30. Sulieman, A.; Tammam, N.; Alzimami, K.; Elnour, A.M.; Babikir, E.; Alfuraih, A. Dose reduction in chest CT examination. Radiat. Prot. Dosim. 2015, 165, 185–189. [Google Scholar] [CrossRef]
  31. Schindera, S.T.; Nelson, R.C.; Toth, T.L.; Nguyen, G.T.; Toncheva, G.I.; Delong, D.M.; Yoshizumi, T.T. Effect of patient size on radiation dose for abdominal MDCT with automatic tube current modulation: Phantom study. AJR Am. J. Roentgenol. 2008, 190, W100–W105. [Google Scholar] [CrossRef]
Figure 1. RANDO anthropomorphic phantom (a) with and (b) without fat layers and MOSFET dosimeters in situ. (c) Axial CT image for the phantoms, showing the AP diameter measurements for normal-weighted (22 cm) and obese (28 cm) phantoms.
Applsci 11 02456 g001
Figure 2. Schematic diagram demonstrating the 12 abdominal CT protocols used per each phantom setting.
Applsci 11 02456 g002
Figure 3. (a) MOSFET calibration with Radcal and (b) MOSFET detector insertion.
Applsci 11 02456 g003
Figure 4. Axial CT image for noise and signal-to-noise ratio (SNR) measurements demonstrating region of interest (ROI) placement.
Applsci 11 02456 g004
Figure 5. (a). Mean noise values ± SDs for both phantoms (normal-weighted and obese) across the kVp applied selections (b). Mean noise values ± SDs for both phantoms (normal-weighted and obese) across the applied reconstruction types.
Applsci 11 02456 g005
Figure 6. Mean signal to noise ratio (SNR) values for obese phantoms (at 200 mA) across the applied tube voltages selections and different reconstruction types.
Applsci 11 02456 g006
Table 1. Constant scanning parameters for abdominal CT used to scan the phantom.
ParametersValues
Scan rangeLung bases to symphysis pubis
Detector Collimation (mm)128 × 0.6
Slice thickness (mm)5
Rotation Time (s)0.5
Pitch0.6
KernelMedium smooth
WindowWindow width: 350, window center: 50
Table 2. The organs and their locations used for MOSFET insertion.
OrgansLevel of MOSFET Insertion
Red bone marrow (spine)(T12) slice 22
Lungs(T8–T9) slice 17
Breasts(T7–T8) slice 16
Transverse colon(L3–L4) slice 28
Stomach(T12) slice 22
Ovaries(S2–S3)
Spleen(T12) slice 22
Kidneys(L1–L2) slice 23
Liver(T11–T12) slice 22
Bladder(S2–S3)
Gonads(S2–S3)
SkinUmbilicus
Table 3. Mean organ doses expressed in milliGray(mGy) ± standard deviations.
mA150200250300
Phantom SizeNormal-WeightedObeseNormal-WeightedObeseNormal-WeightedObeseNormal-WeightedObese
OrgankVp
Mid-lung100
120
140
0.67 ± 0.220.57 ± 0.120.67 ± 0.140.61 ± 0.130.98 ± 0.300.95 ± 0.230.76 ± 0.150.84 ± 0.05
0.81 ± 0.070.93 ± 0.071.01 ± 0.231.23 ± 0.421.56 ± 0.051.11 ± 0.111.48 ± 0.451.72 ± 0.04
1.57 ± 0.241.37 ± 0.431.55 ± 0.131.78 ± 0.132.05 ± 0.482.67 ± 0.332.29 ± 0.202.62 ± 1.02
Spine100
120
140
9.70 ± 0.786.71 ± 0.5713.13 ± 1.537.90 ± 0.4416 ± 0.799.03 ± 0.9220.76 ± 0.4011.43 ± 0.40
17.40 ± 0.179.86 ± 0.3121.70 ± 0.5014.50 ± 0.4326.86 ± 0.0517.10 ± 0.4531.73 ± 0.4020.23 ± 0.40
23.76 ± 0.8014.80 ± 0.8730.63 ± 0.5519.66 ± 1.0637.16 ± 1.4724.50 ± 0.8846.20 ± 0.8729.23 ± 0.85
Stomach100
120
140
8.87 ± 1.248.15 ± 0.6613.20 ± 1.119.88 ± 1.0716.56 ± 1.0412.40 ± 1.2420.20 ± 0.7914.36 ± 0.35
16.86 ± 0.5512.60 ± 0.4320.76 ± 1.2716.43 ± 1.3426.63 ± 0.4520.56 ± 0.7330.83 ± 1.8024.43 ± 0.65
21.76 ± 0.1517.40 ± 0.6530.43 ± 1.2323.96 ± 0.8535.30 ± 0.7830.50 ± 0.9545.16 ± 1.6035.90 ± 1.67
Liver100
120
140
11.50 ± 1.38.99 ± 0.6014.06 ± 0.4910.63 ± 0.4017.56 ± 0.9615 ± 0.3421.43 ± 0.4016.56 ± 0.66
18.23 ± 0.9813.23 ± 0.4922.43 ± 0.0518.53 ± 0.5827.20 ± 0.6024.10 ± 1.8533.76 ± 226.33 ± 1.84
24.43 ± 2.4320.30 ± 0.5030.76 ± 1.0227.43 ± 1.3840.73 ± 0.5835.36 ± 0.3747.40 ± 1.6341.43 ± 3.10
Spleen100
120
140
13.50 ± 1.678.99 ± 0.1016.83 ± 1.4513.10 ± 0.8820.76 ± 1.8514.50 ± 0.5024.23 ± 0.7718.70 ± 1.03
21.13 ± 0.8715 ± 0.4026.46 ± 1.1619.26 ± 0.5833 ± 3.4524.40 ± 0.8137.73 ± 2.3129.56 ± 0.37
28.53 ± 1.8121.96 ± 2.1037.53 ± 3.0928.26 ± 0.5743.33 ± 1.9136.73 ± 1.0556.20 ± 4.3441 ± 0.87
Kidney100
120
140
9.28 ± 0.587.83 ± 0.1313.26 ± 0.9711 ± 0.2616.13 ± 0.3713.10 ± 0.3619.96 ± 1.4116.26 ± 0.37
16.26 ± 0.4113.43 ± 0.2023.10 ± 1.3017.46 ± 0.5525.96 ± 122.50 ± 0.6031.10 ± 0.5526.16 ± 1.76
23.20 ± 1.0319.53 ± 1.1031.90 ± 1.3126.06 ± 0.8538.76 ± 2.0432.53 ± 0.6146.43 ± 1.5537.70 ± 1.20
Colon100
120
140
10.83 ± 0.239.37 ± 0.8914.50 ± 0.3411.83 ± 0.2517.96 ± 0.9514.70 ± 0.5520.53 ± 1.2816.76 ± 0.75
19.43 ± 0.5613.86 ± 0.0523.23 ± 0.7019.56 ± 0.9229.06 ± 1.1024.46 ± 0.3735.76 ± 1.5528.60 ± 1.99
24.63 ± 1.1521.60 ± 0.6233.23 ± 0.9827.56 ± 0.5841.90 ± 1.5534.93 ± 1.4547.83 ± 2.5342.26 ± 1.02
Ovary100
120
140
6.17 ± 0.184.71 ± 0.427.75 ± 0.106.47 ± 0.1010.06 ± 0.768.42 ± 0.7312.23 ± 0.559.58 ± 0.40
10.49 ± 0.608.25 ± 0.1812.73 ± 0.7510.90 ± 0.8817.93 ± 1.0613.66 ± 0.9521.96 ± 1.1315.13 ± 0.60
15.53 ± 1.3012.43 ± 0.5619.66 ± 0.3215.80 ± 1.3224.93 ± 0.1520.23 ± 0.6629 ± 1.9923.10 ± 1.31
Heart100
120
140
6.27 ± 0.304.71 ± 0.136.51 ± 0.516.59 ± 0.308.26 ± 0.737.97 ± 0.3310.35 ± 1.1610.76 ±0.25
10.76 ± 1.198.56 ± 0.6210.51 ± 0.8610.56 ± 0.4913.23 ± 0.4113.66 ± 1.4515.66 ± 0.6516.33 ± 1.30
10.83 ± 0.2513.06 ± 0.8015.06 ± 0.9515.80 ± 0.6019.56 ± 0.6420.60 ± 1.7623.16 ± 0.7325.26 ± 1.50
Female Breast100
120
140
0.21 ± 0.110.53 ± 0.050.59 ± 0.240.48 ± 0.240.67 ± 0.370.71 ± 0.200.70 ± 0.260.70 ± 0.15
0.37 ± 0.300.93 ± 0.160.92 ± 0.370.68 ± 0.180.98 ± 0.221.17 ± 0.270.95 ± 0.231.27 ± 0.20
1.35 ± 0.180.76 ± 0.331.08 ± 0.071.28 ± 0.331.59 ± 0.321.46 ± 0.361.78 ± 0.271.72 ± 0.44
Skin Anterior100
120
140
8.91 ± 1.517.63 ± 1.1810.53 ± 1.6910.03 ± 1.3315.20 ± 1.4910.96 ± 0.2517.56 ± 2.8216.46 ± 0.77
15.36 ± 1.5512.93 ± 0.7517.43 ± 2.4513.93 ± 1.0423 ± 2.6817.90 ± 2.5527.66 ± 1.2521.70 ± 2.69
18.93 ± 1.7016.10 ± 2.8826.73 ± 2.3122.16 ± 1.6833 ± 3.3728.43 ± 4.3136.10 ± 3.3630.10 ± 3.98
Skin Posterior100
120
140
7.21 ± 0.646.39 ± 1.0110.03 ± 0.058.43 ± 0.4911.80 ± 0.559.91 ± 0.7915.36 ± 1.7011.86 ± 0.64
12 ± 1.3010.93 ± 0.1516.26 ± 1.5516.50 ± 0.7918.76 ±1.4117.16 ± 1.4223.56 ± 2.5422.40 ± 1
16.16 ± 1.4315.86 ± 1.4520.60 ± 1.4419.66 ± 1.0627.20 ± 0.6025 ± 2.8934.30 ± 1.6031.40 ± 3.20
Gonads (Male)100
120
140
0.80 ± 0.291.37 ± 0.241.18 ± 0.061.60 ± 0.501.32 ± 0.241.99 ± 0.111.75 ± 0.272.34 ± 0.22
1.65 ± 0.142.28 ± 0.371.99 ± 0.363.38 ± 0.572.59 ± 0.423.97 ± 0.172.89 ± 0.203.95 ± 1.66
2.20 ± 0.403.46 ± 0.442.87 ± 0.304.51 ± 0.243.99 ± 0.475.43 ± 0.464.82 ± 0.706.46 ± 0.34
Table 4. Effective dose in millisievert (mSv), dose length product (DLP) in milliGray-Centimeter (mGy·cm), and volume CT dose index (CTDIvol) in milliGray (mGy) values for both phantoms (normal-weighted and obese).
ProtocolPhantom SizeEffective Dose (mSv)DLP (mGy·cm)CTDIvol (mGy)
150 mA, 100 kVpNormal weight8.63218.675.91
Obese6.89
150 mA, 120 kVpNormal weight14.90376.6610.18
Obese11.11
150 mA, 140 kVpNormal weight19.88571.2815.44
Obese16.39
200 mA, 100 kVpNormal weight11.37291.937.89
Obese9.03
200 mA, 120 kVpNormal weight18.47497.2813.44
Obese14.80
200 mA, 140 kVpNormal weight26.39761.8320.59
Obese21.43
250 mA, 100 kVpNormal weight14.13363.349.82
Obese10.98
250 mA, 120 kVpNormal-weighted23.02621.9716.81
Obese18.55
250 mA, 140 kVpNormal weight32.31949.0525.65
Obese27.28
300 mA, 100 kVpNormal weight17.09436.6011.80
Obese13.25
300 mA, 120 kVpNormal weight27.29746.6620.18
Obese21.76
300 mA, 140 kVpNormal weight39.251139.6030.80
Obese31.94
Publisher’s Note: MDPI stays neutral with regard to jurisdictional claims in published maps and institutional affiliations.

