
A Study of Correction to the Point Cloud Distortion Based on MEMS LiDAR System

Abstract
:1. Introduction
2. Methods
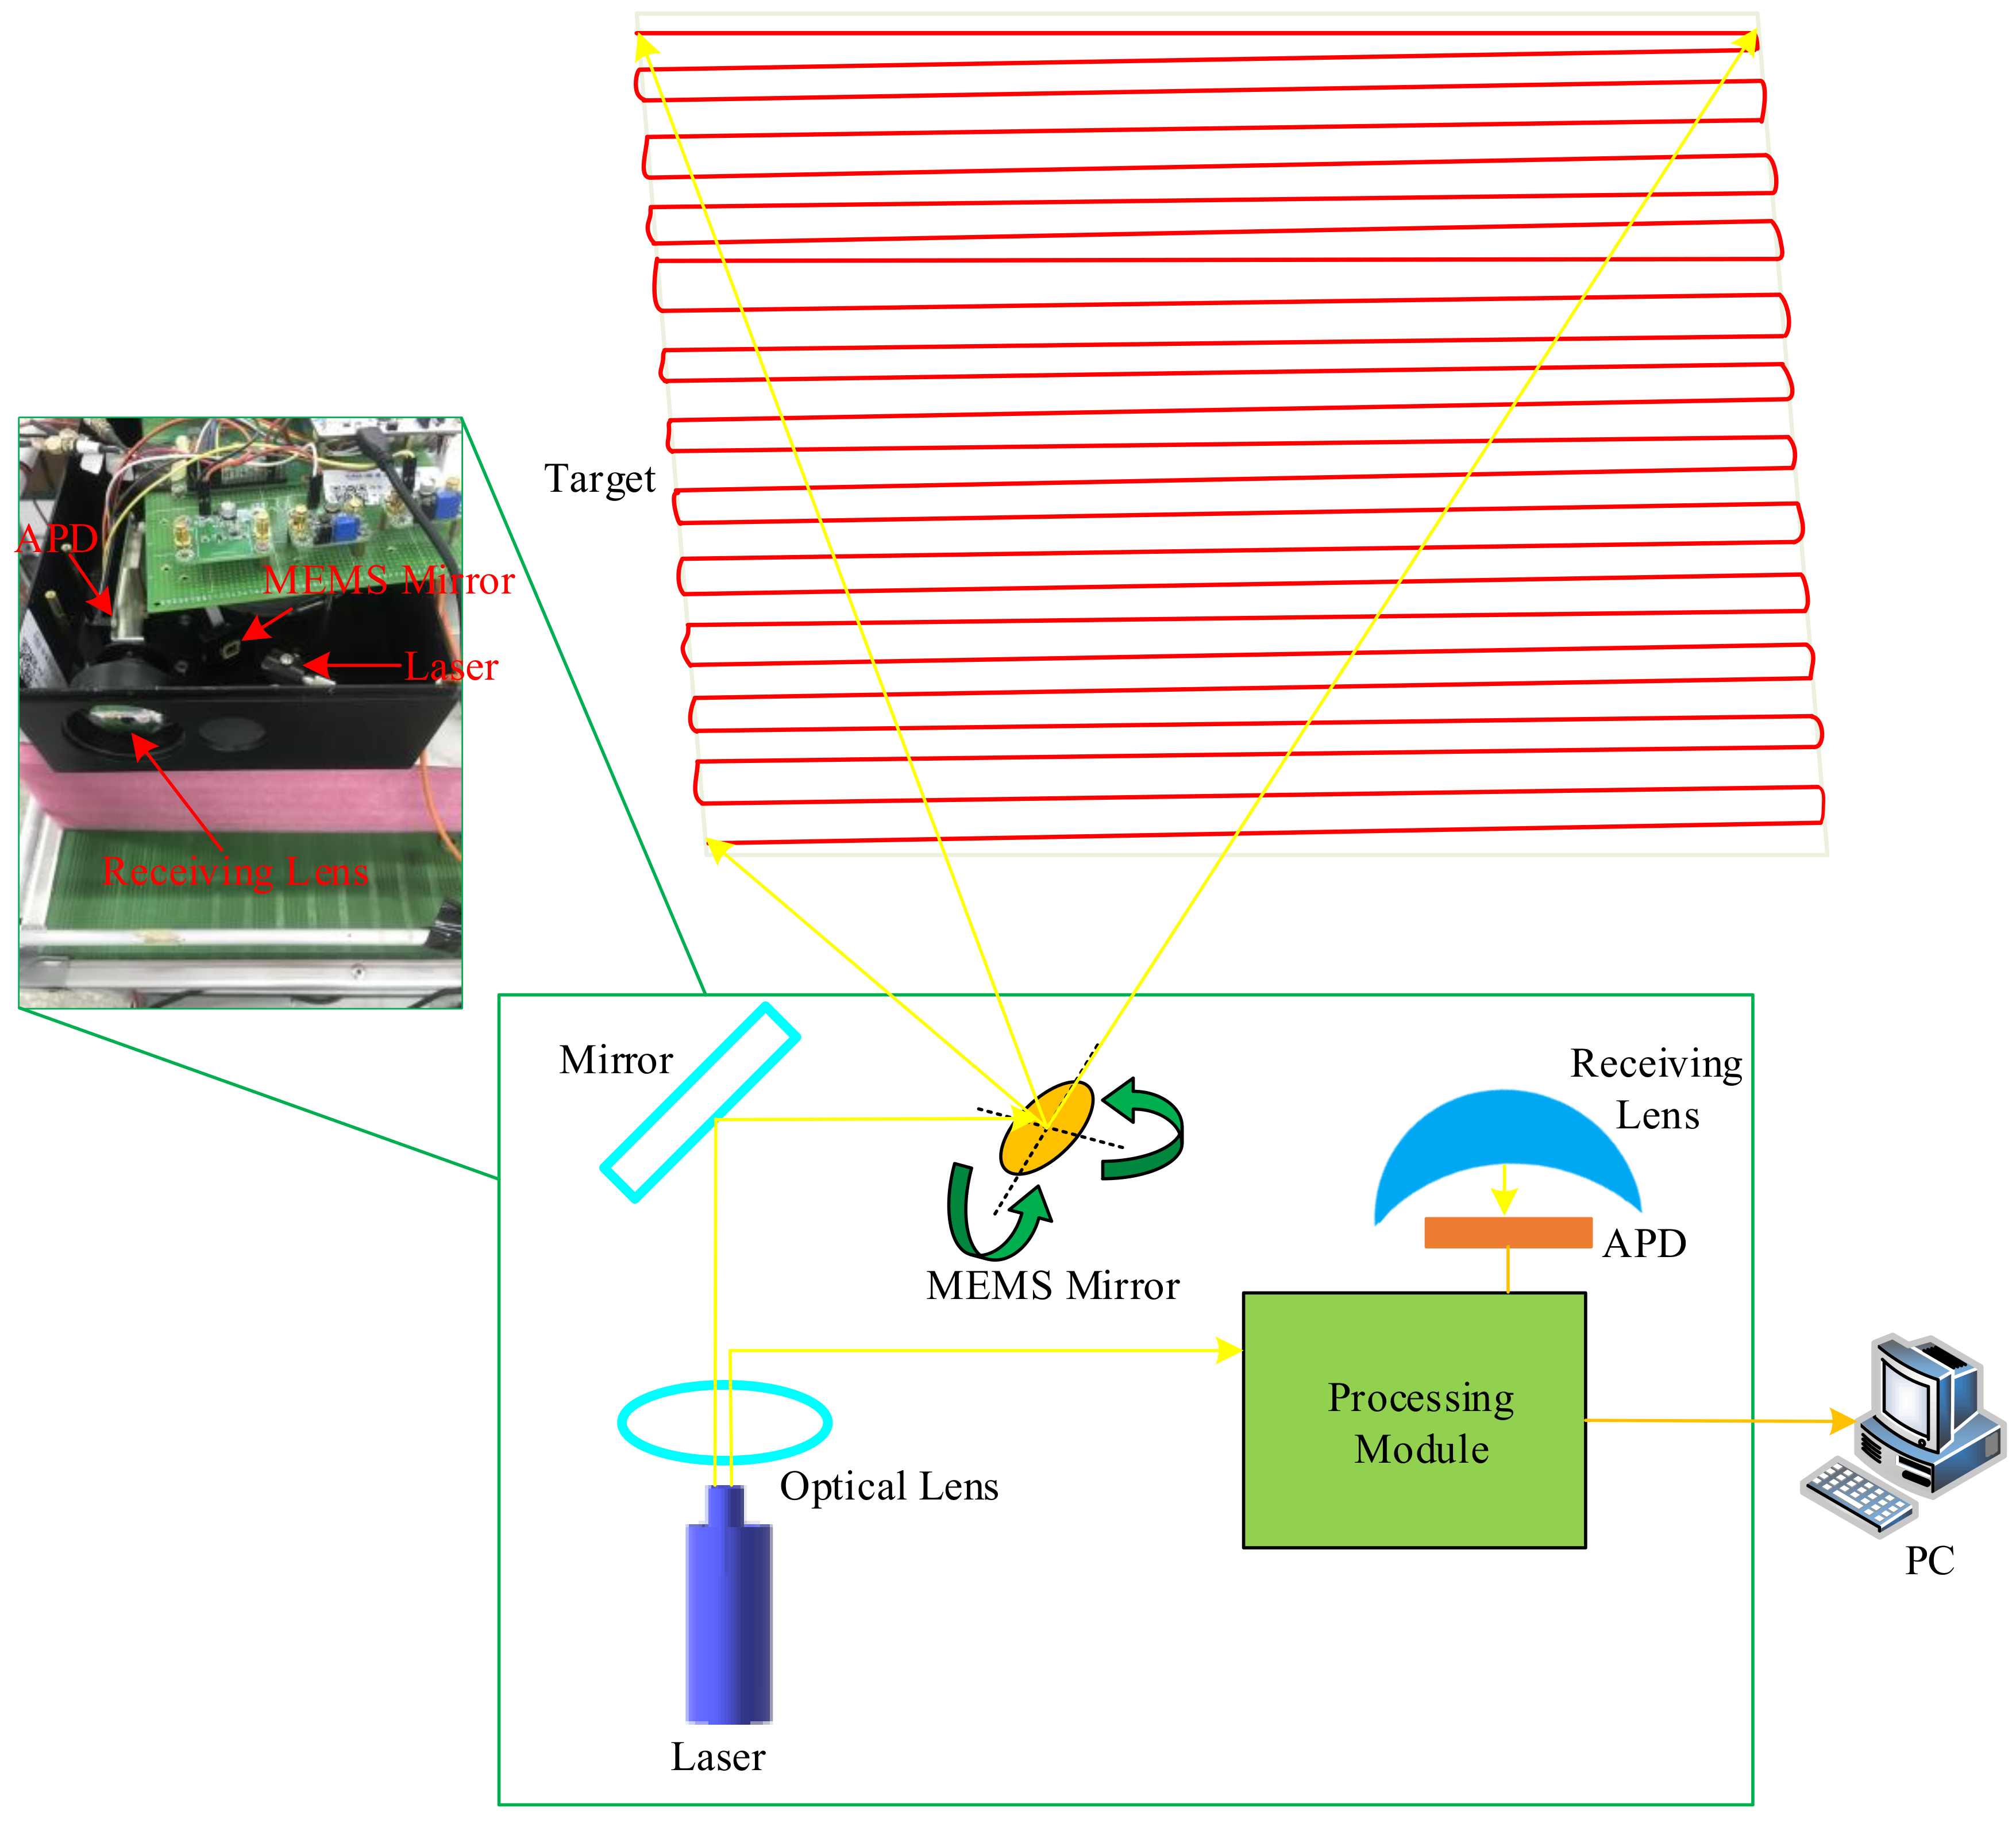
2.1. Principle
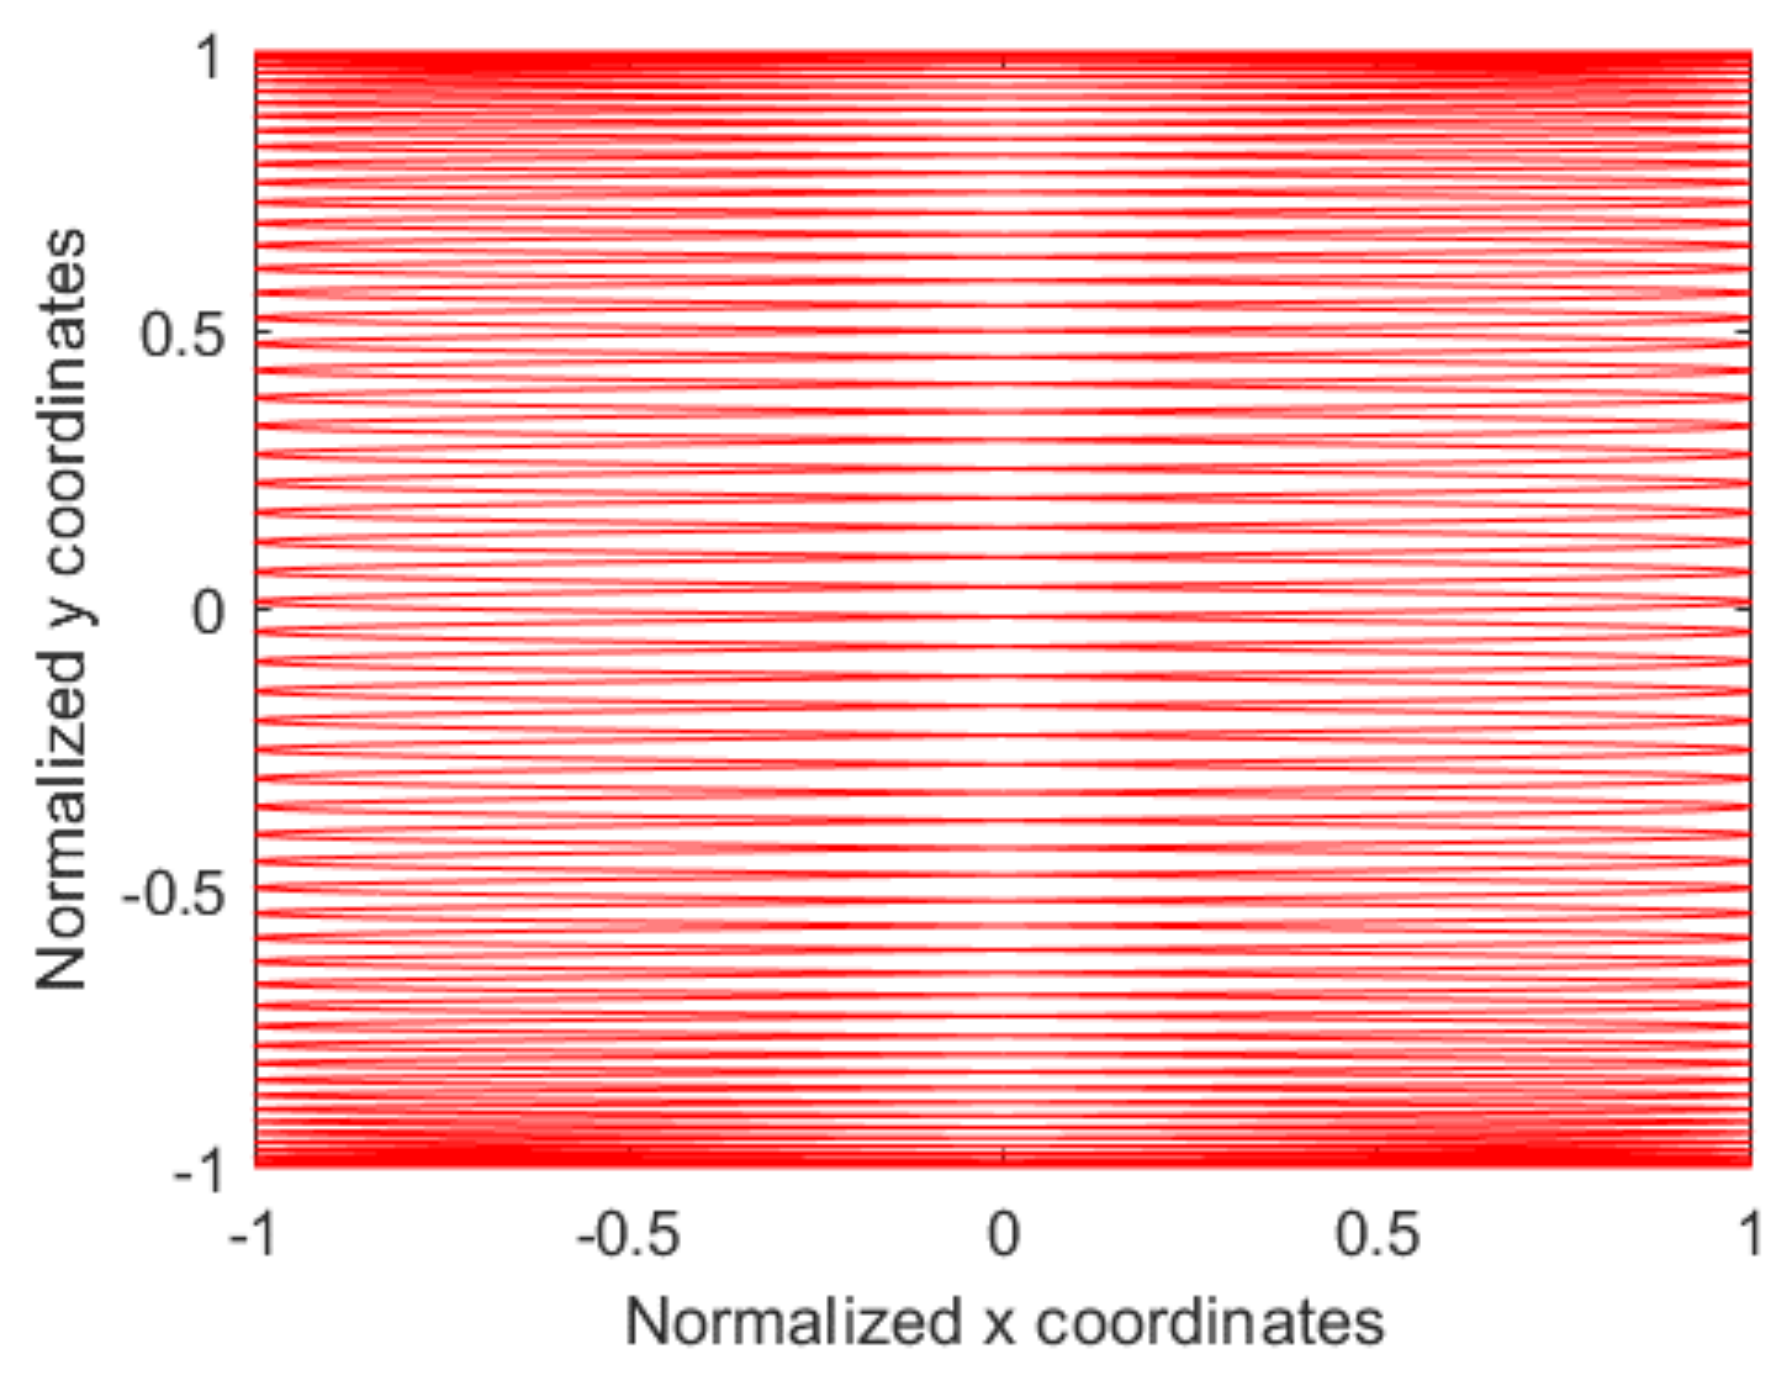
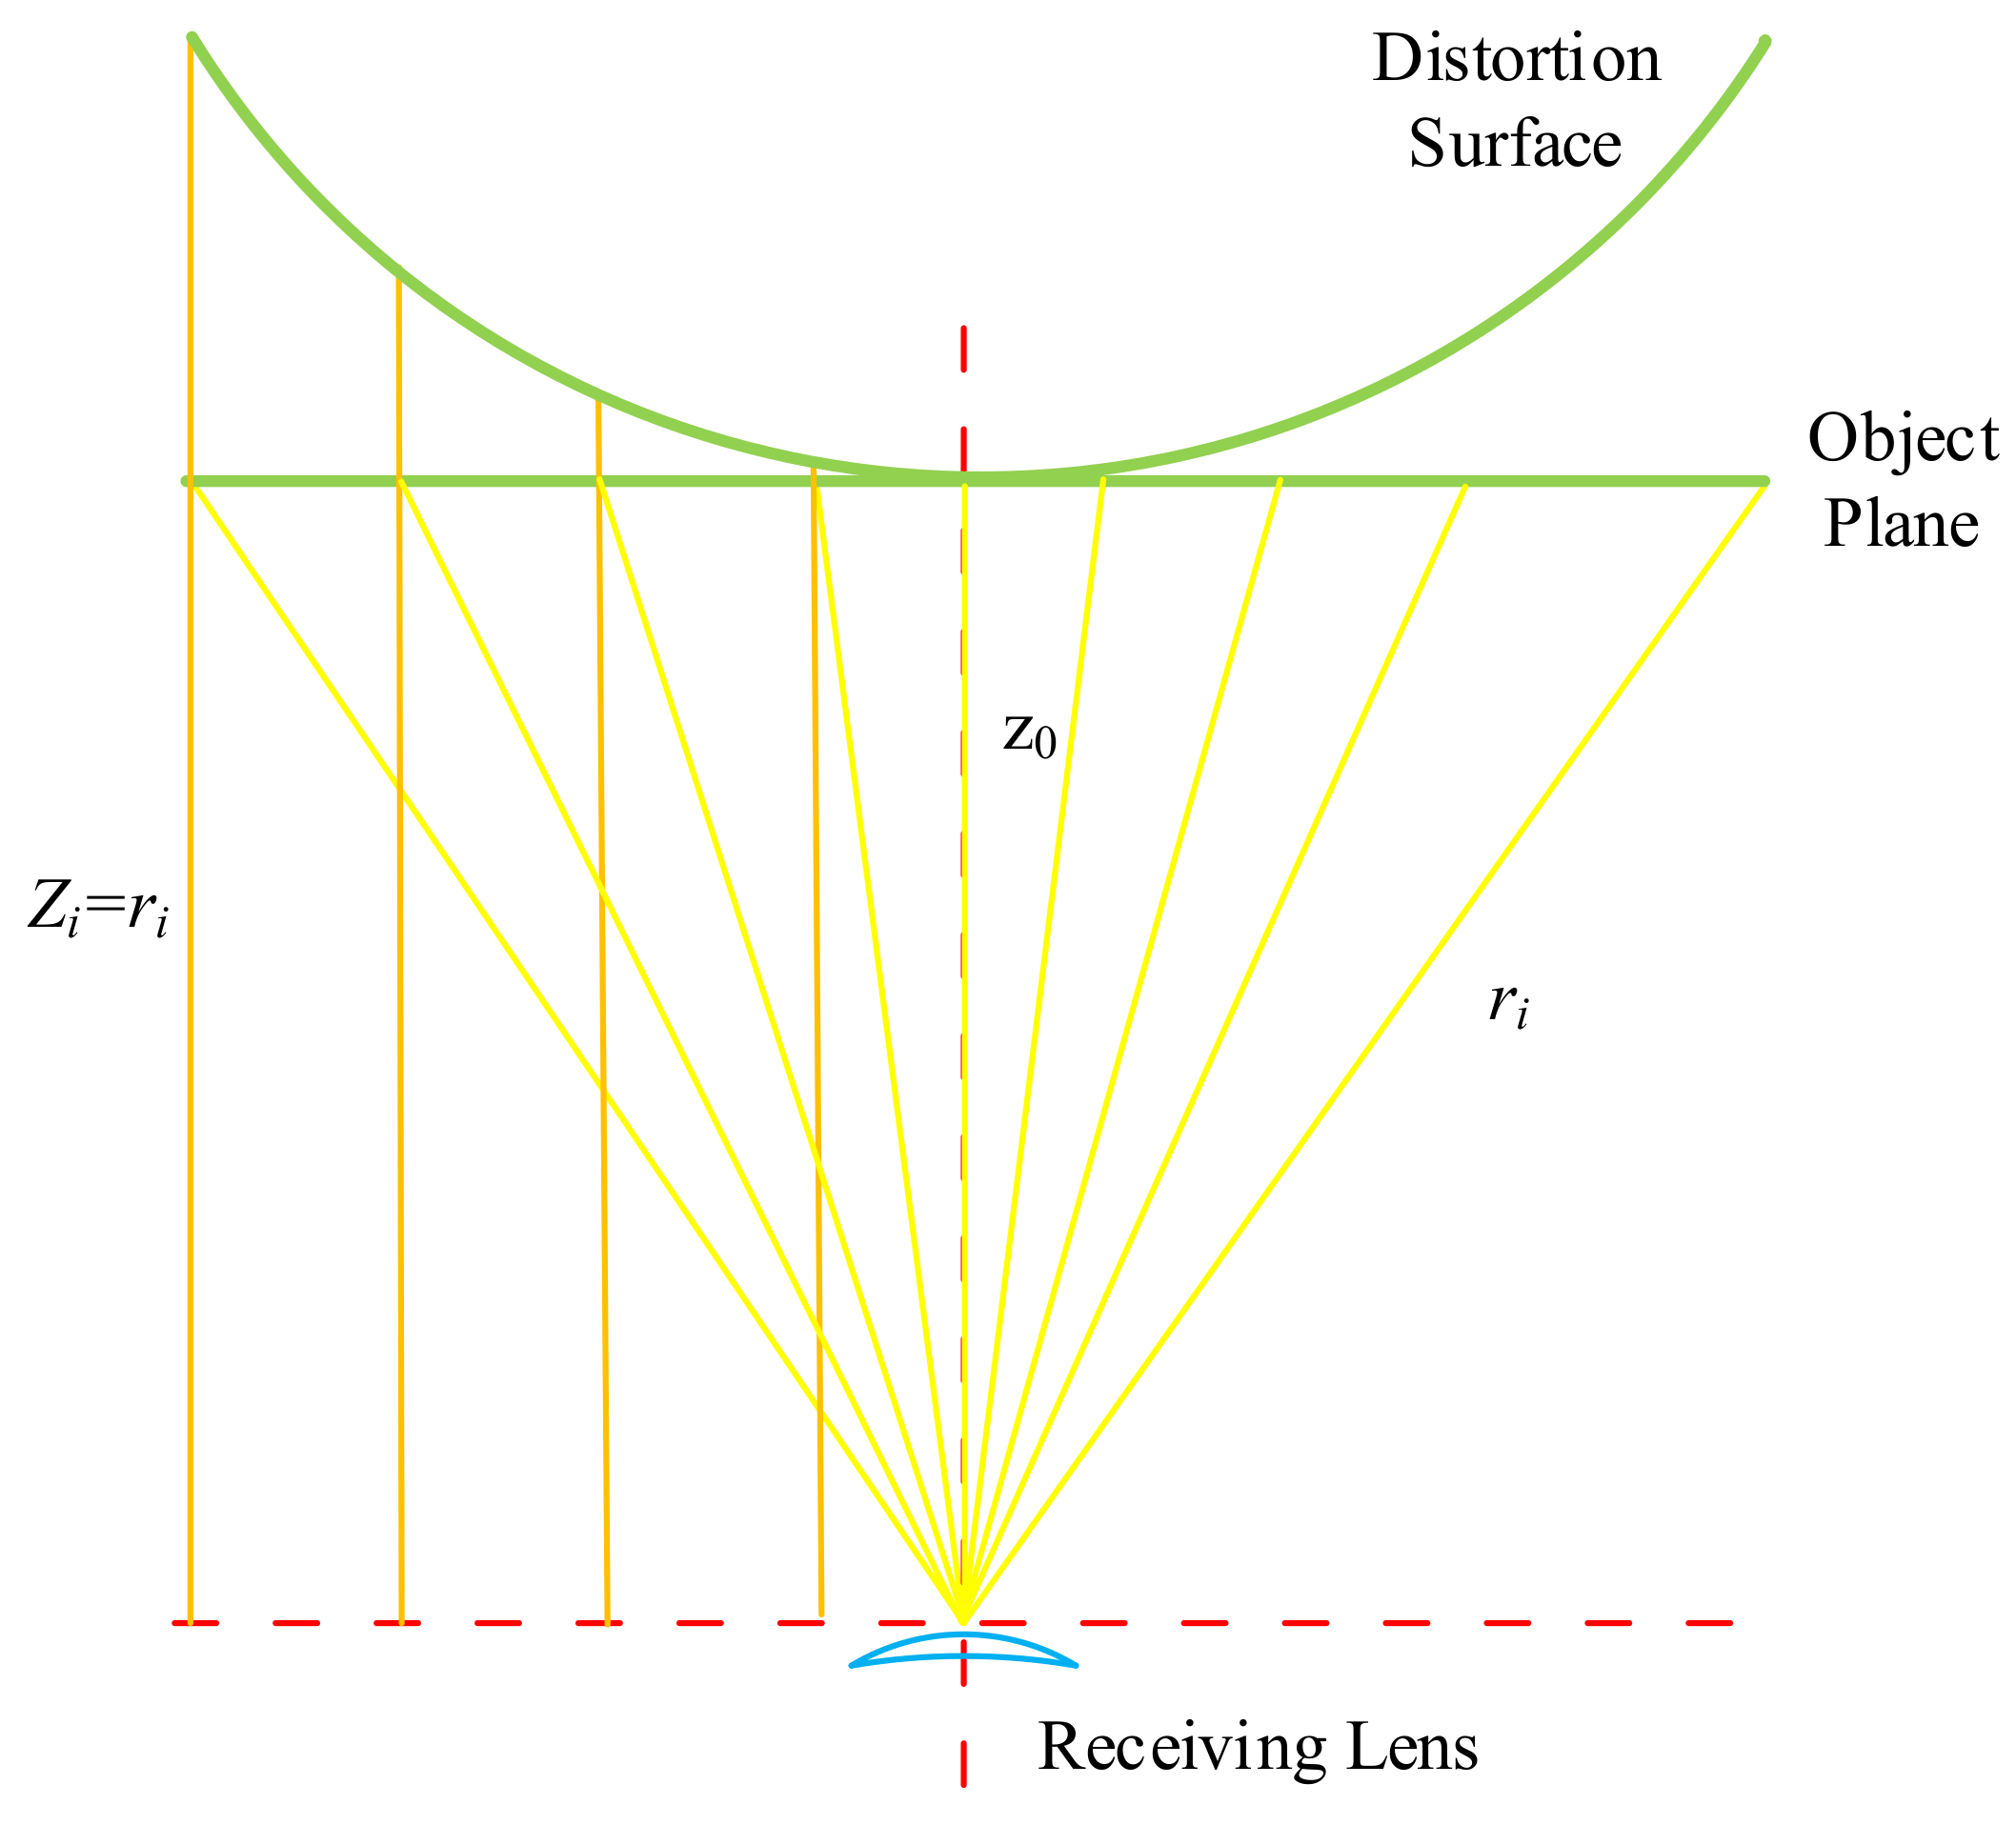
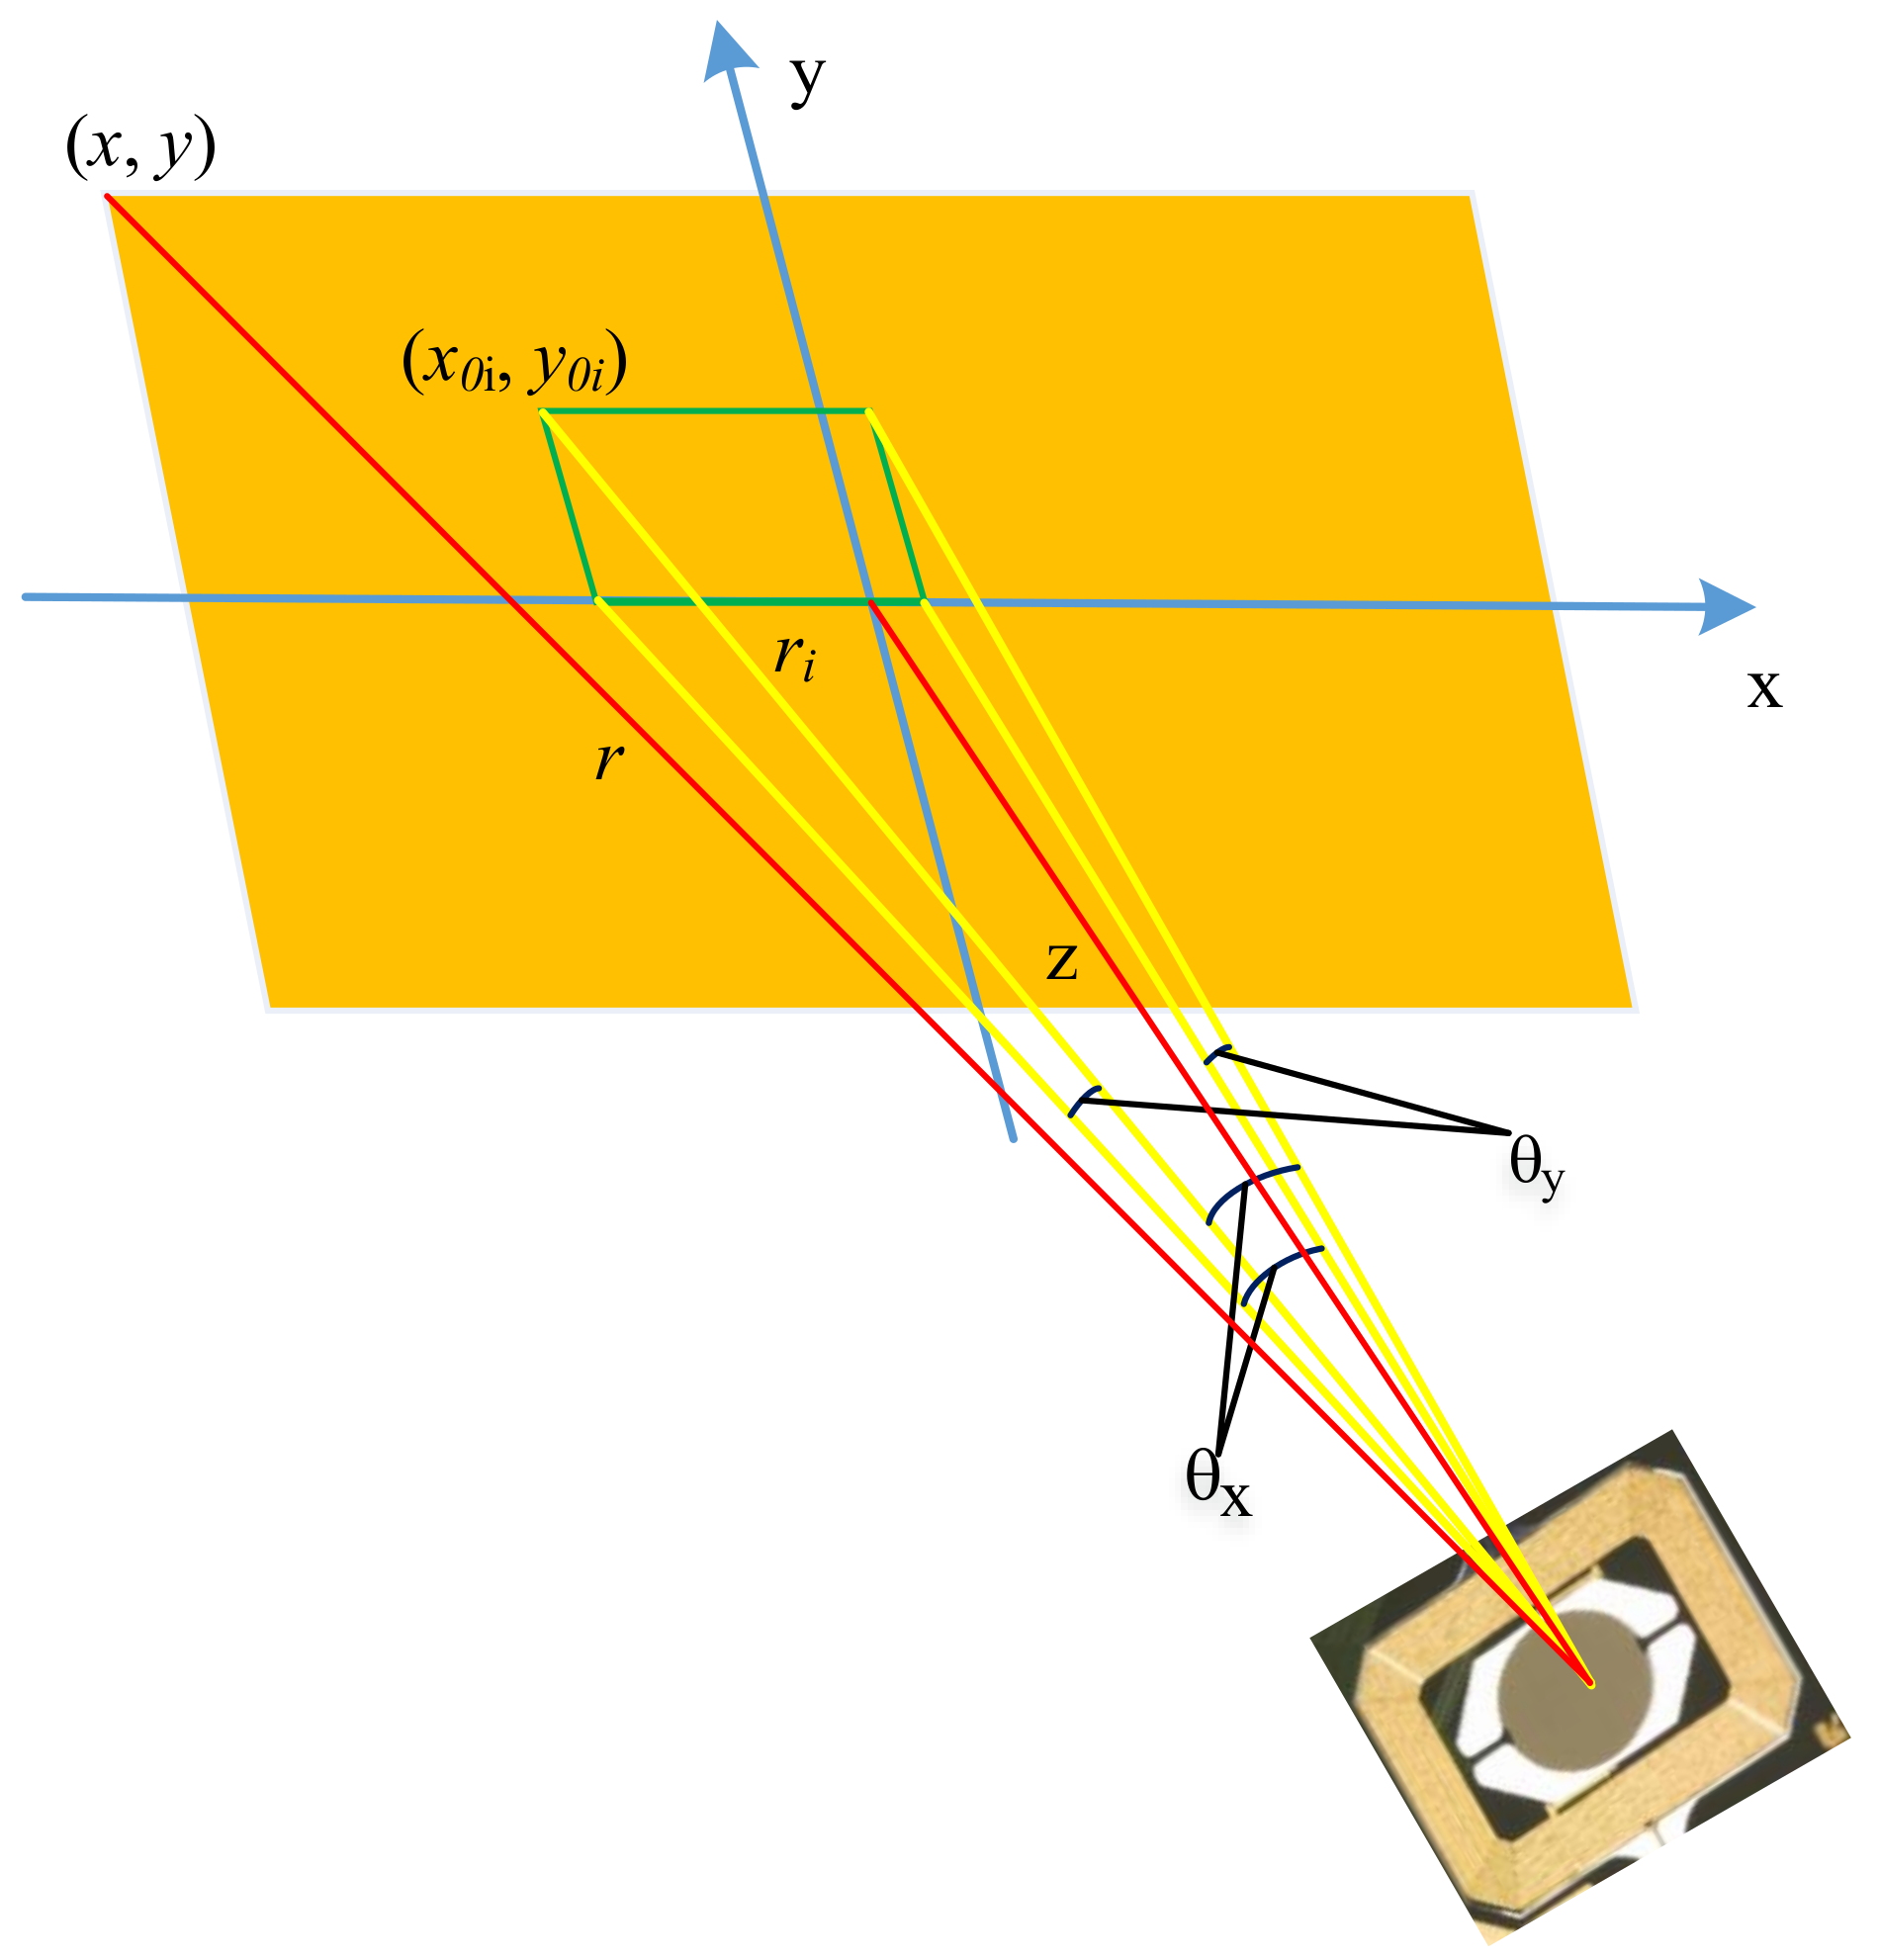
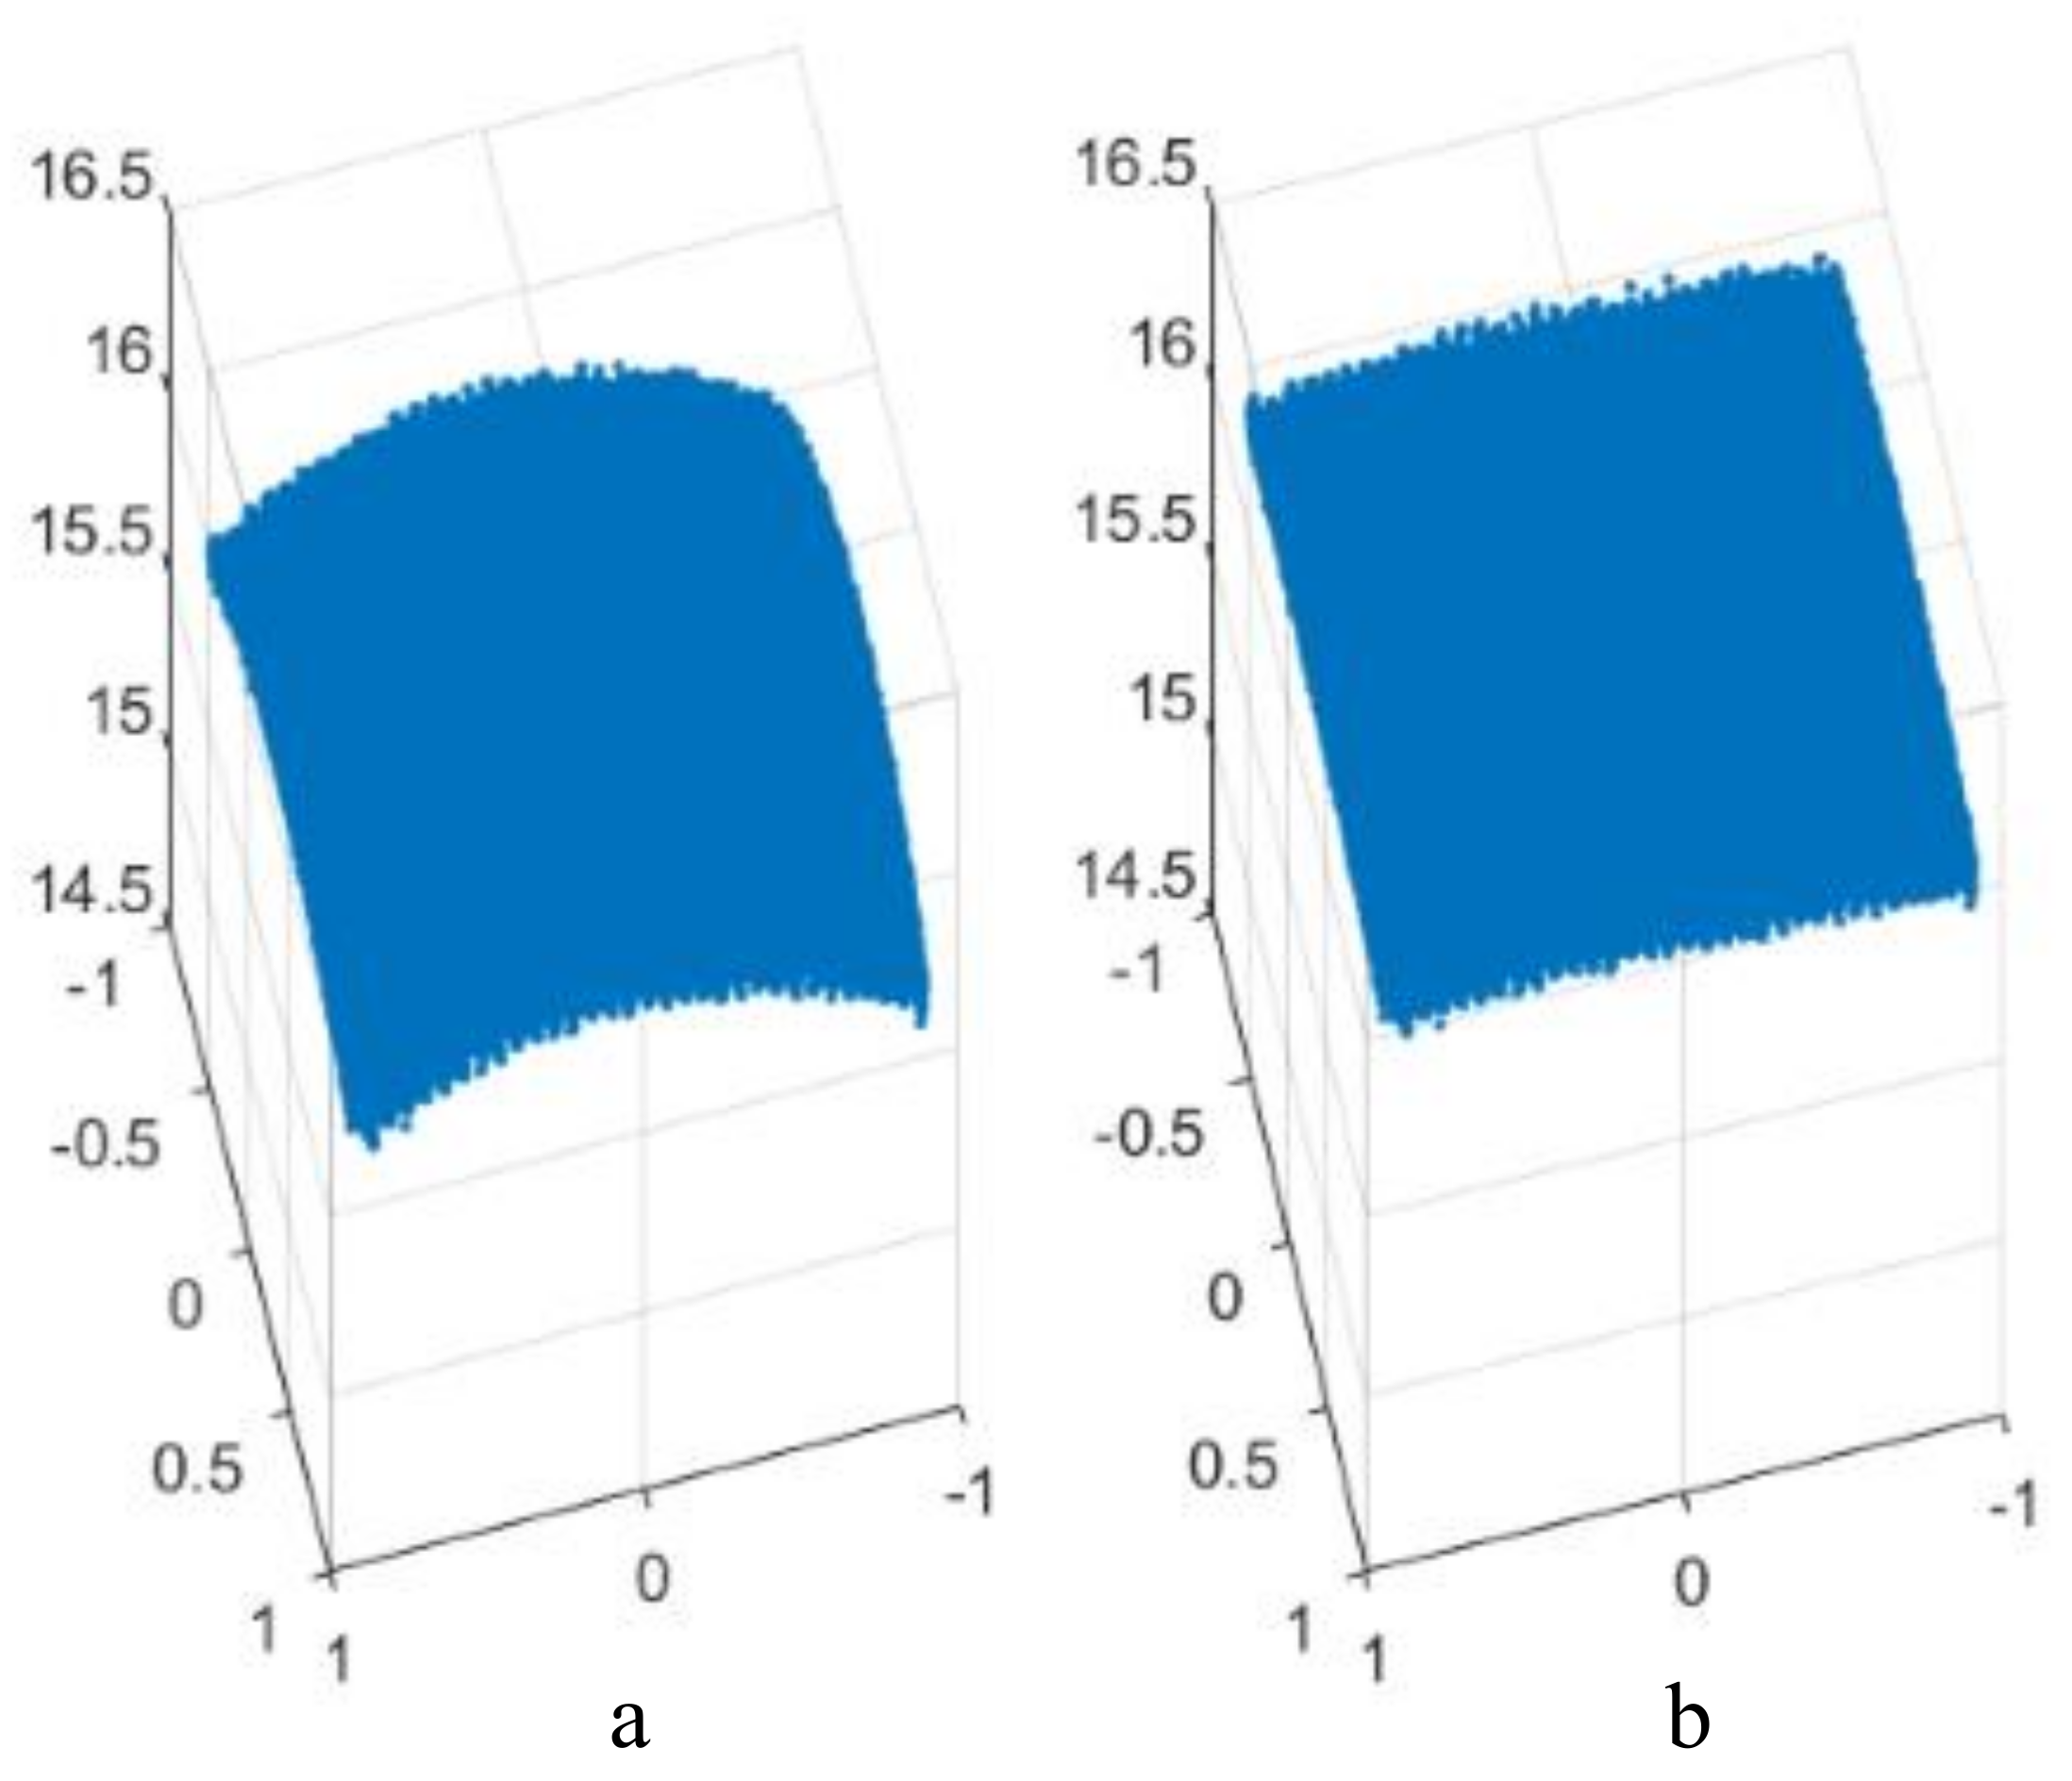
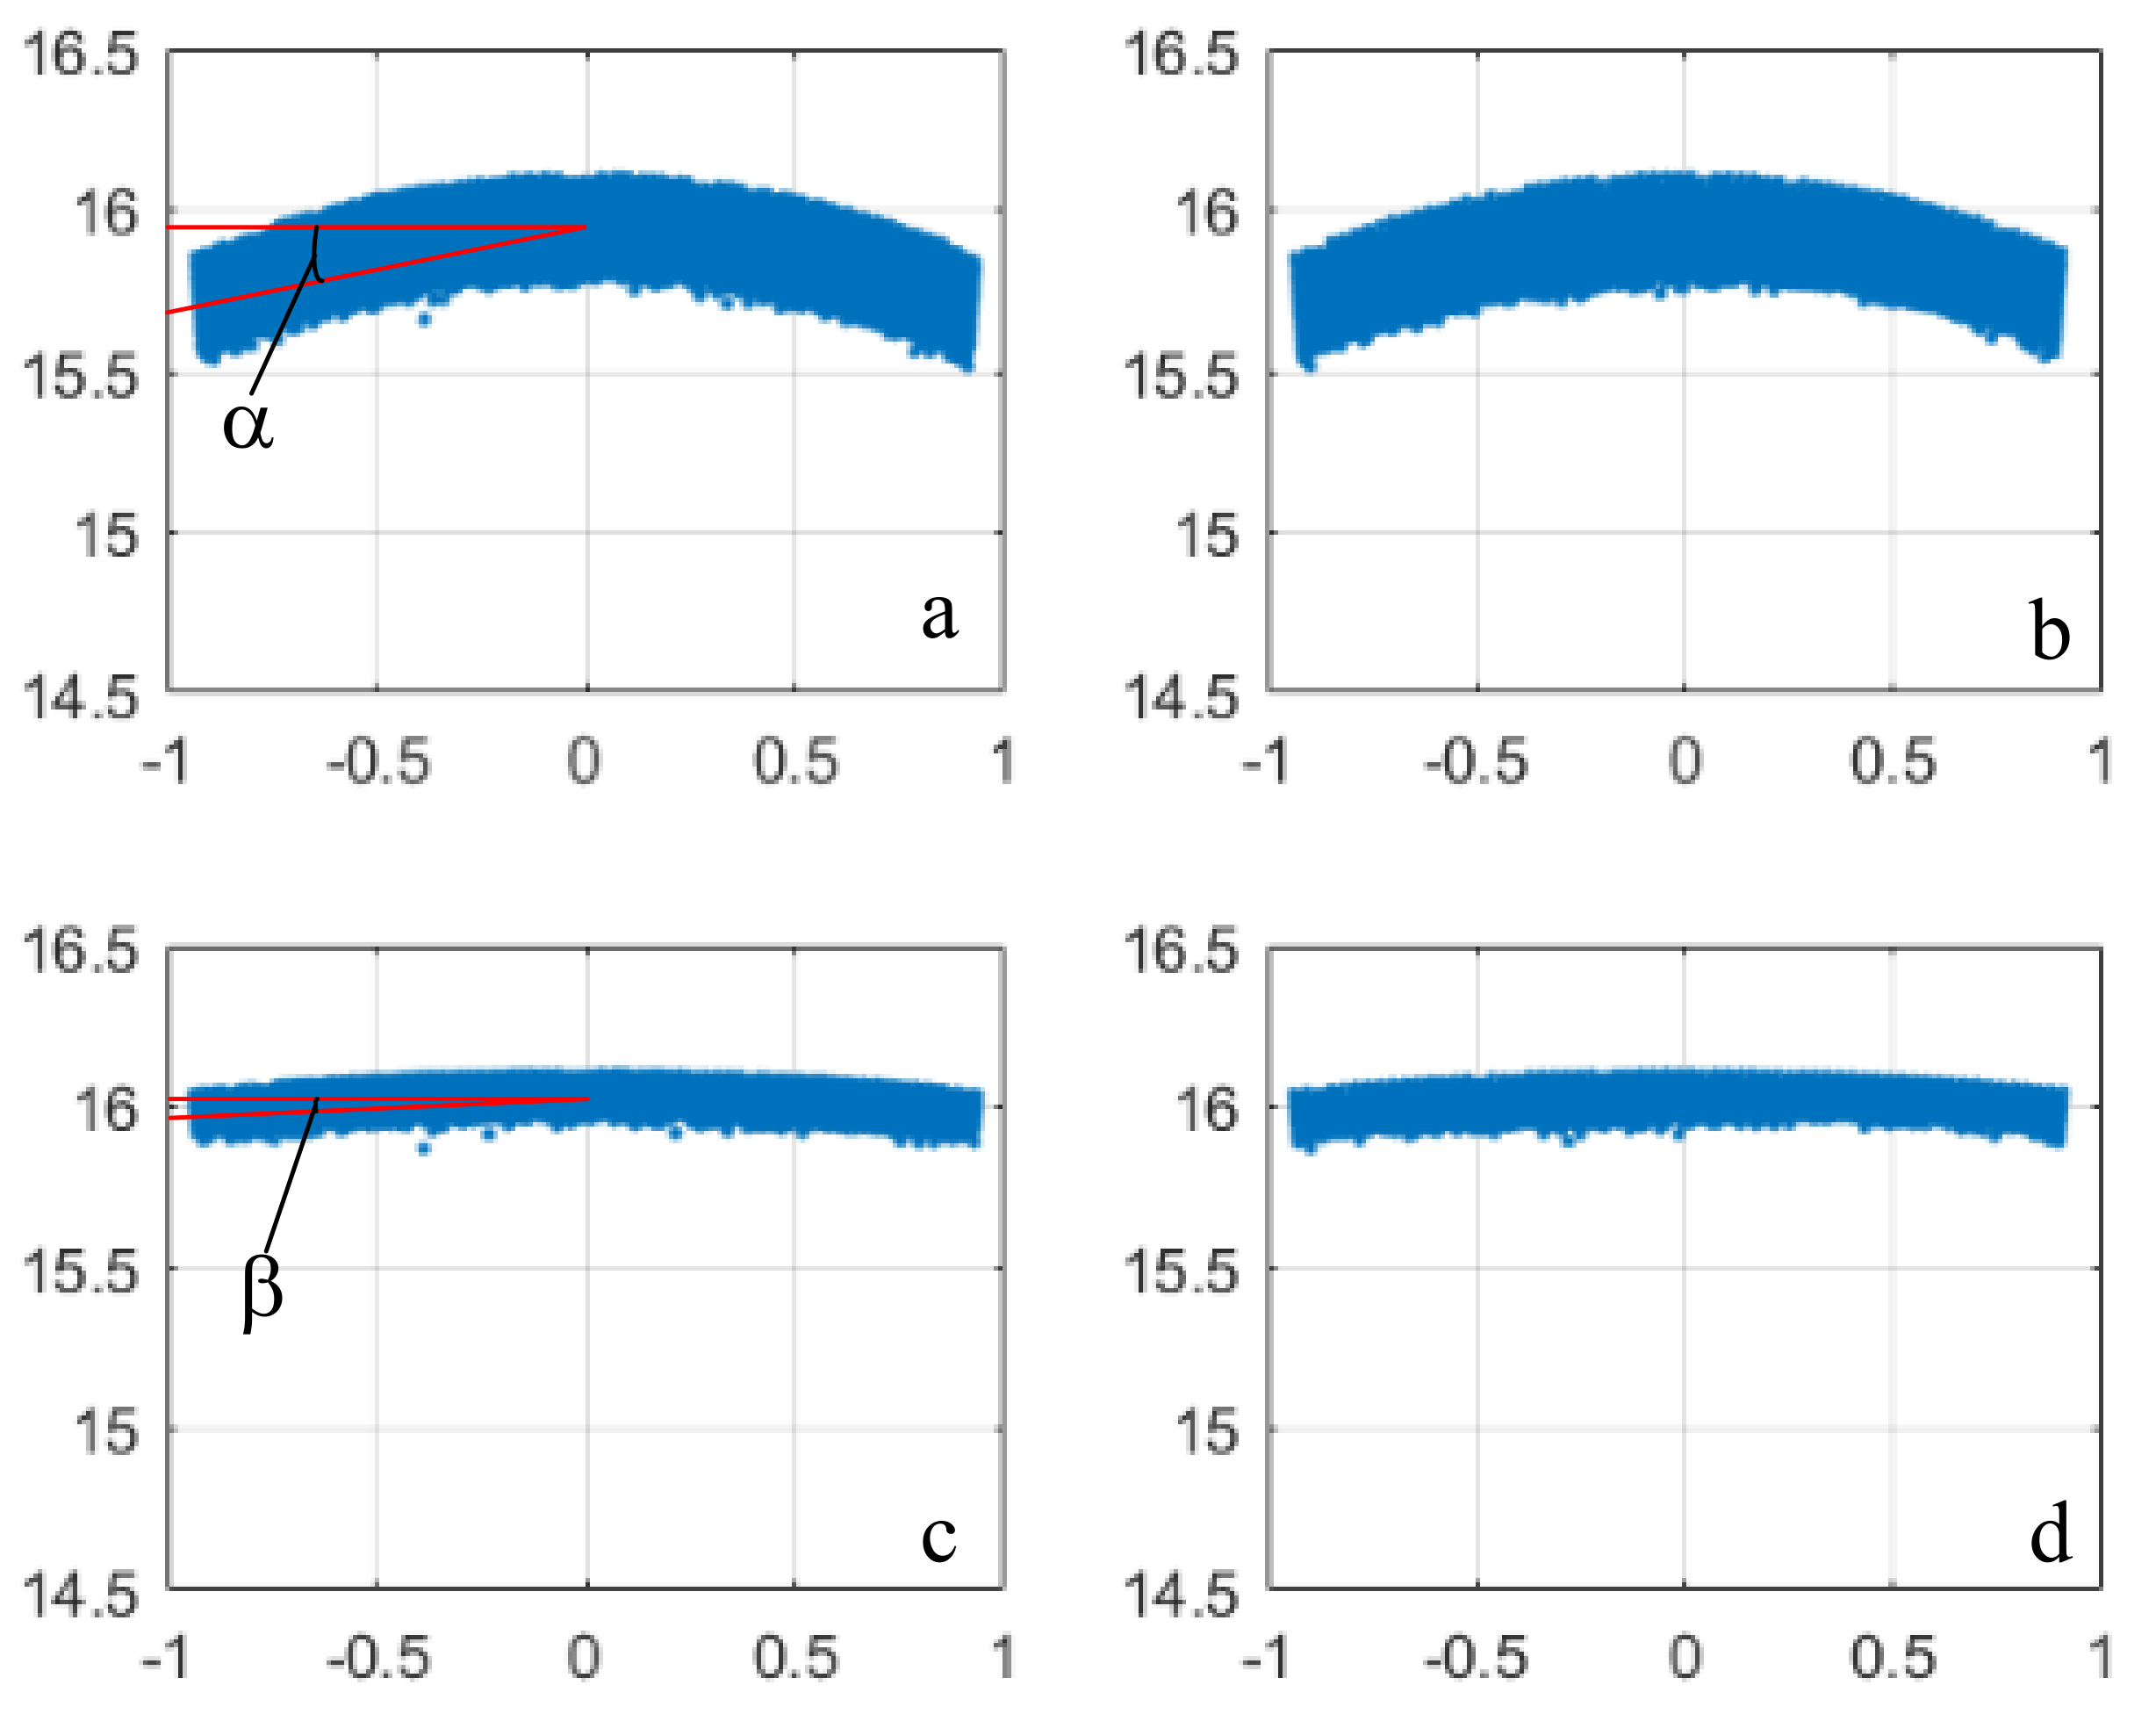
2.2. Analysis of the Causes of Distortion and Correction Methods
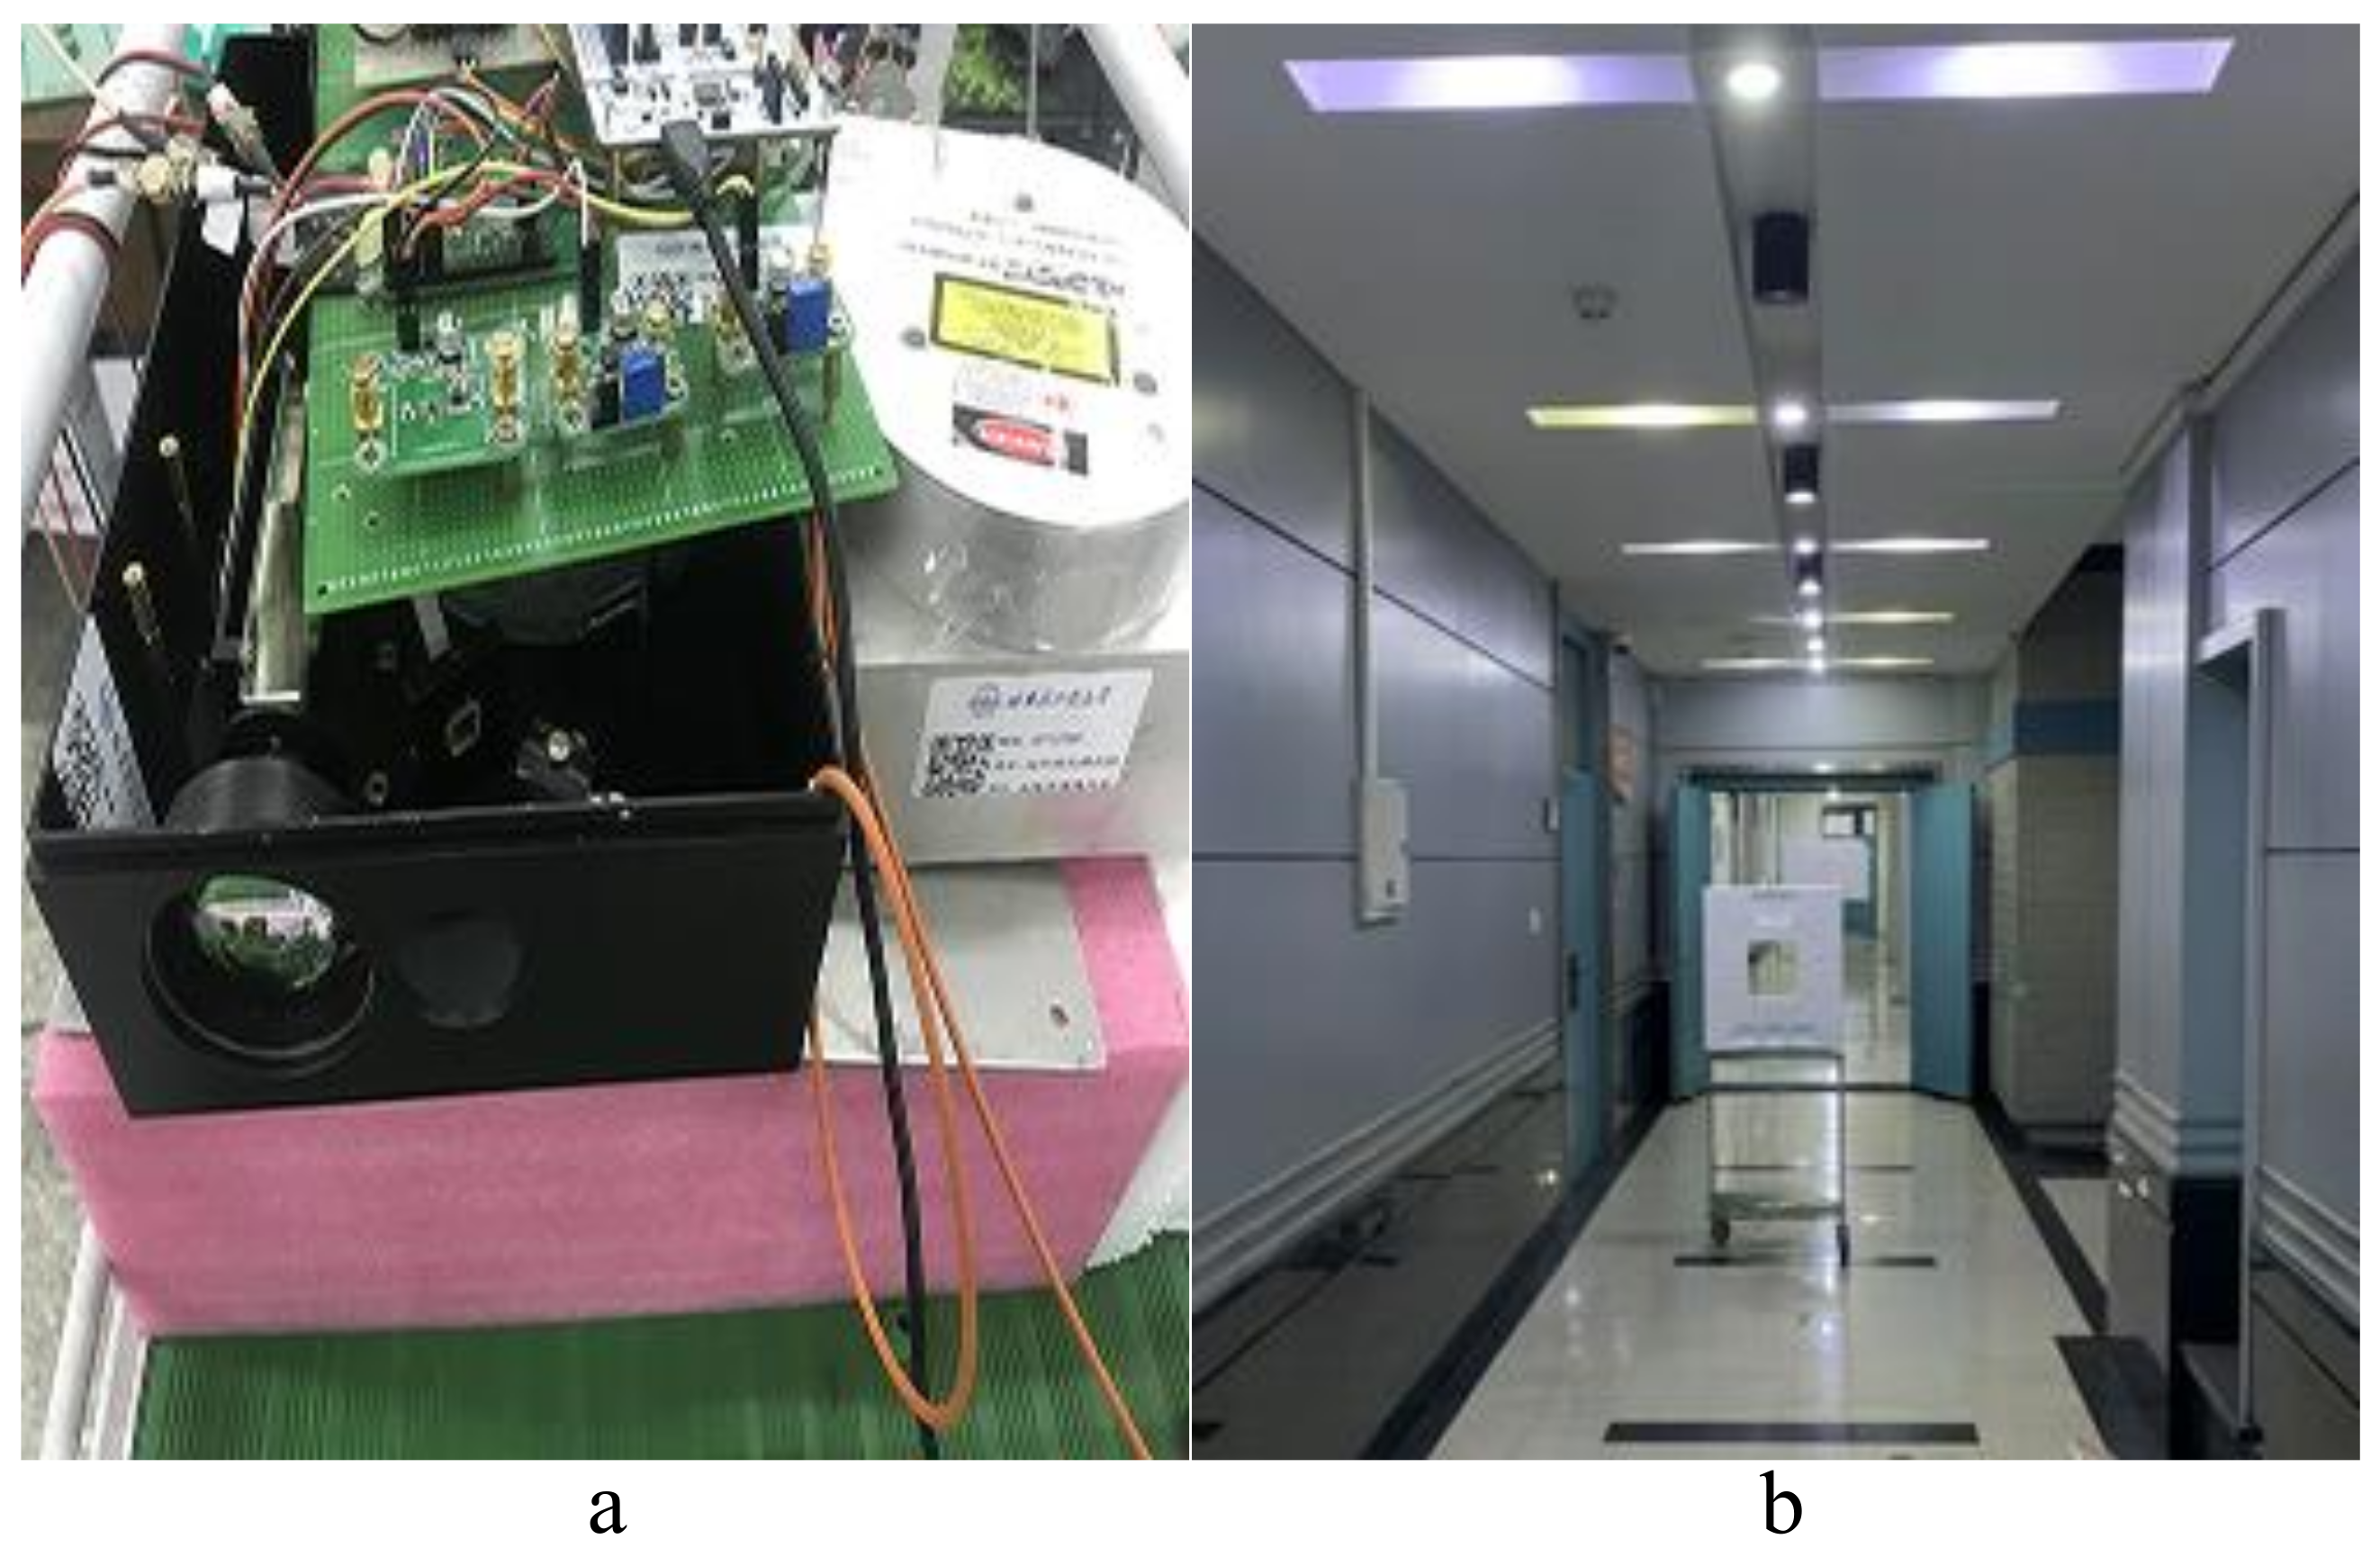
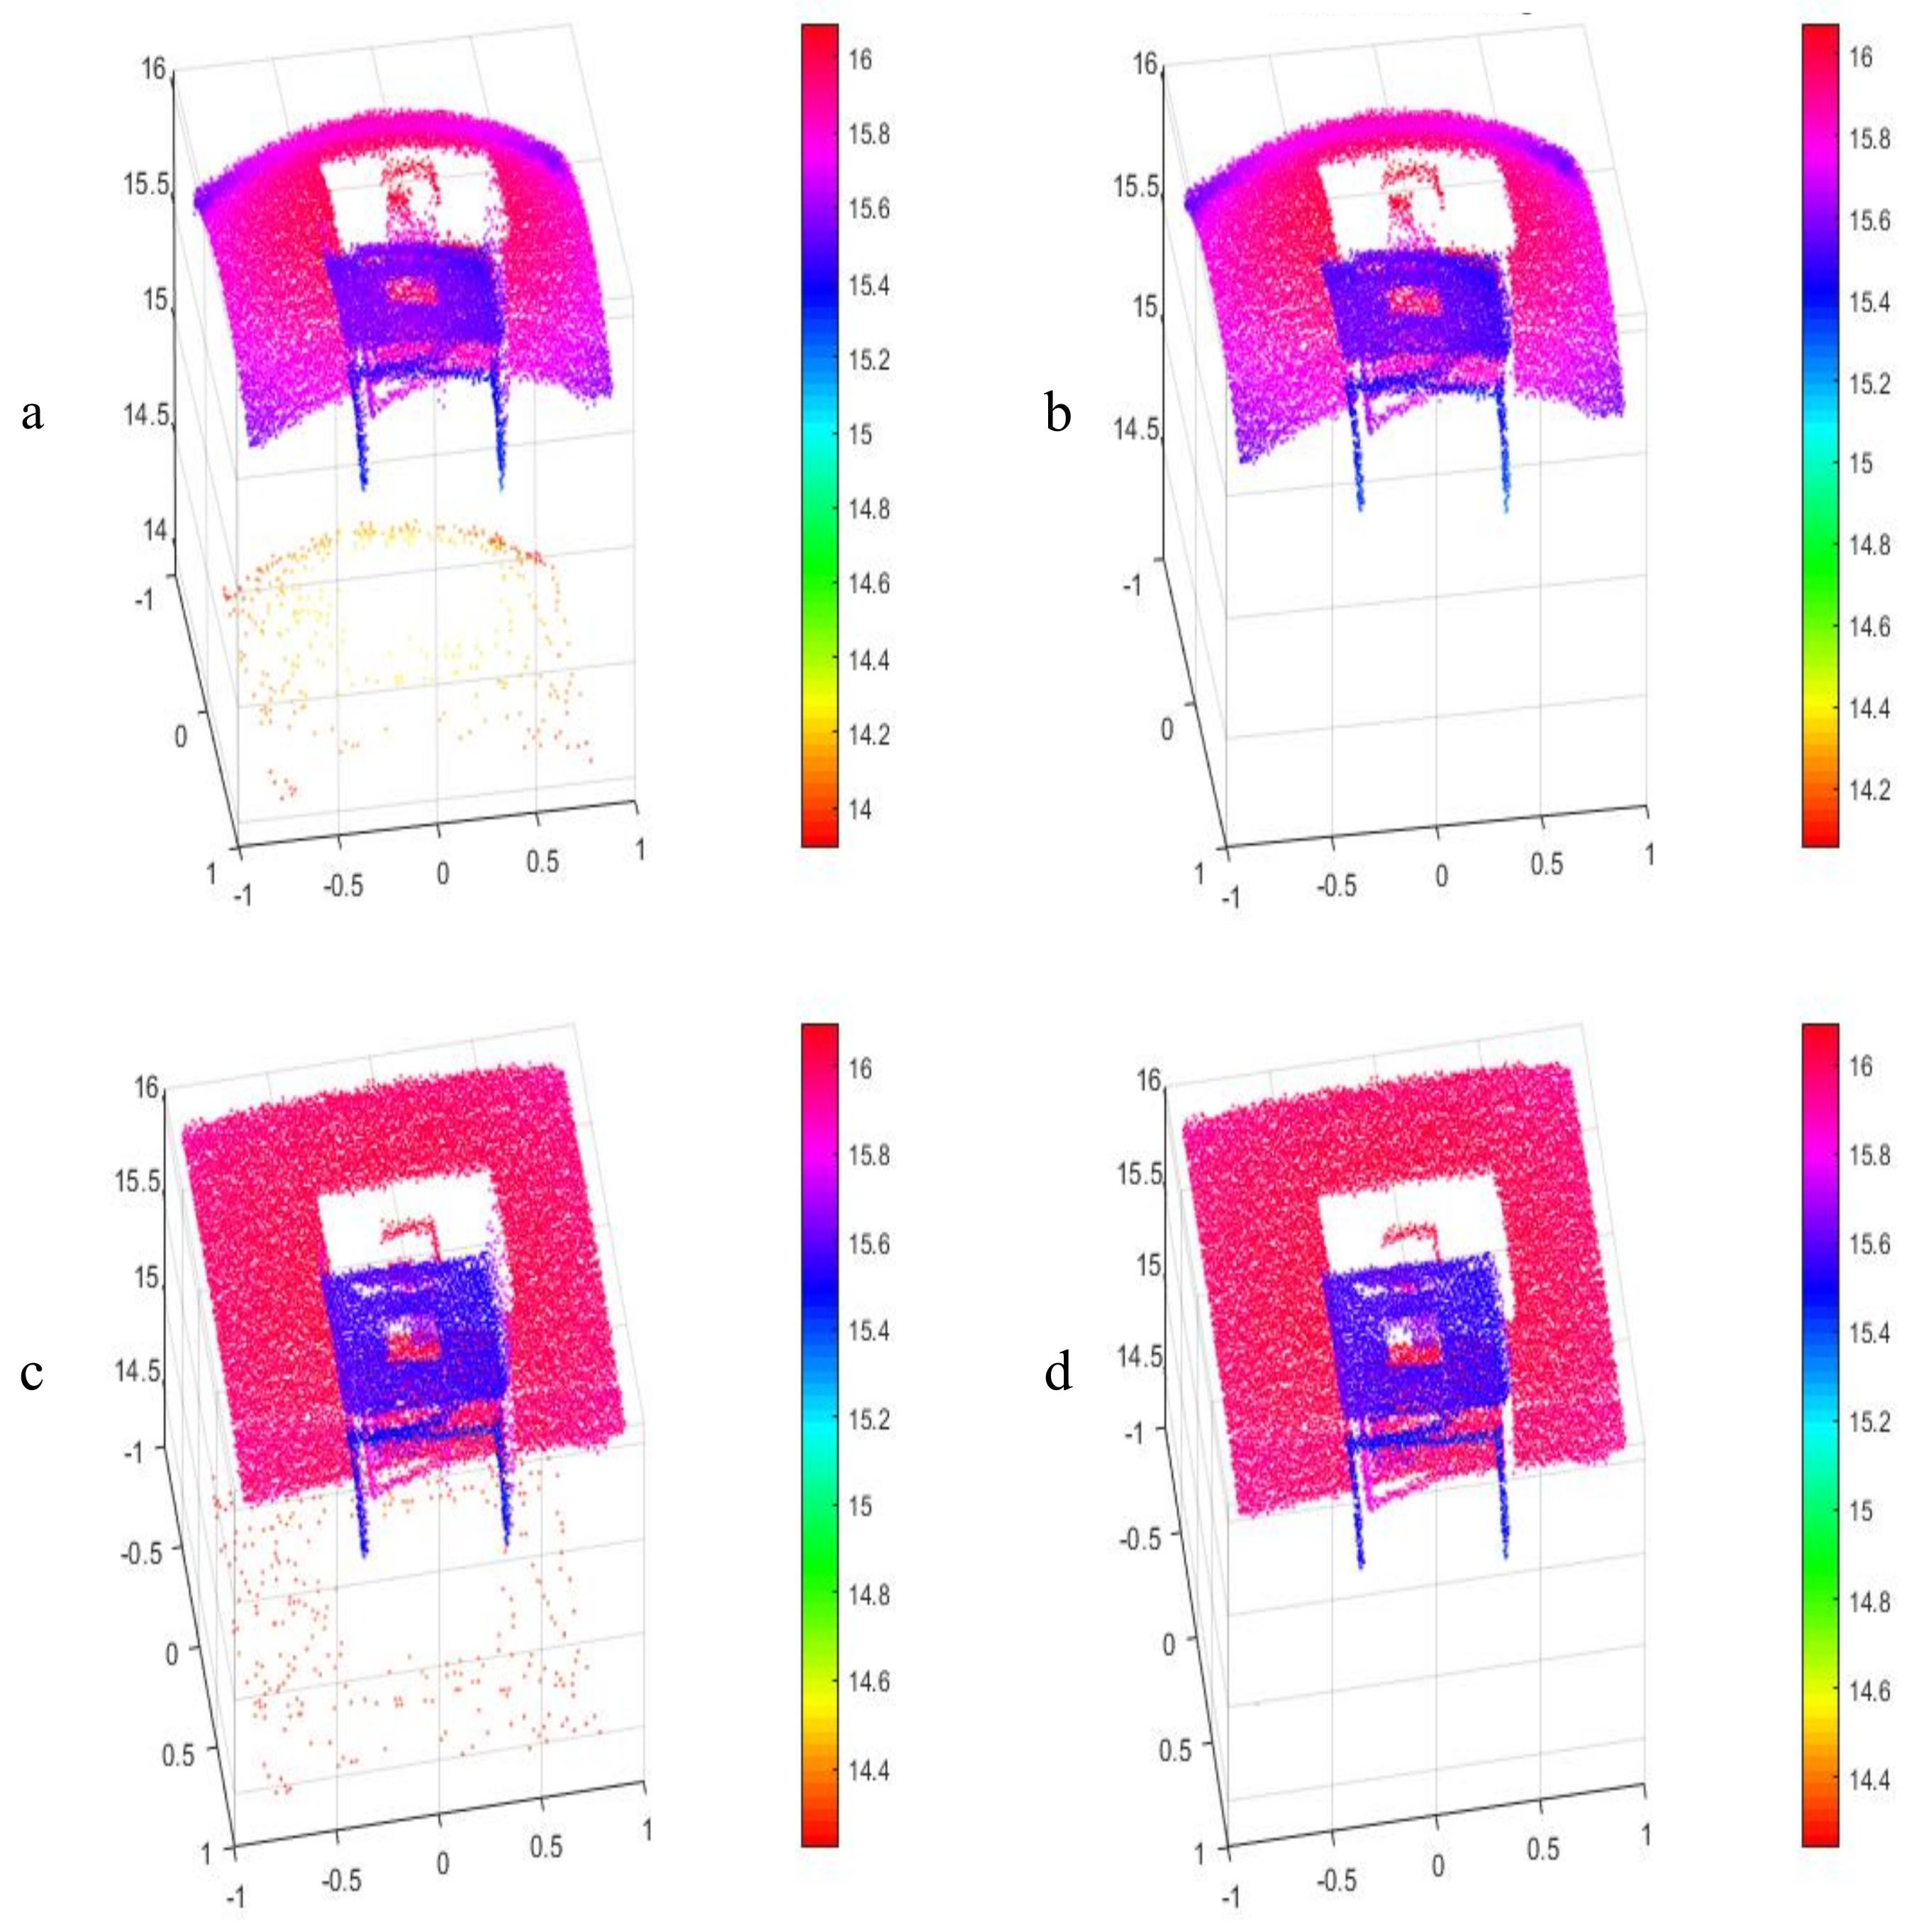
3. Experiment
4. Conclusions
Author Contributions
Funding
Institutional Review Board Statement
Informed Consent Statement
Data Availability Statement
Conflicts of Interest
References
- McManamon, P.F. Review of ladar: A historic, yet emerging, sensor technology with rich phenomenology. Opt. Eng. 2012, 51, 060901. [Google Scholar] [CrossRef] [Green Version]
- Cheng, Y.; Cao, J.; Zhang, F.; Hao, Q. Design and modeling of pulsed-laser three-dimensional imaging system inspired by compound and human hybrid eye. Sci. Rep. 2018, 8, 17164. [Google Scholar] [CrossRef] [PubMed]
- Richmond, R.D.; Cain, S.C. Direct-Detection LADAR Systems; SPIE: Bellingham, WA, USA, 2010. [Google Scholar]
- Ma, X.; Wang, C.; Han, G.; Ma, Y.; Li, S.; Gong, W.; Chen, J. Regional Atmospheric Aerosol Pollution Detection Based on LiDAR Remote Sensing. Remote Sens. 2019, 11, 2339. [Google Scholar] [CrossRef] [Green Version]
- Xing, Y.; Huang, J.; Gruen, A.; Qin, L. Assessing the Performance of ICESat-2/ATLAS Multi-Channel Photon Data for Estimating Ground Topography in Forested Terrain. Remote Sens. 2020, 12, 2084. [Google Scholar] [CrossRef]
- Roback, V.; Bulyshev, A.; Amzajerdian, F.; Reisse, R. Helicopter flight test of 3D imaging flash LIDAR technology for safe, autonomous, and precise planetary landing. SPIE 2013, 8731, 1–20. [Google Scholar]
- Sun, B.; Edgar, M.P.; Bowman, R.; Vittert, L.E.; Welsh, S.; Bowman, A.; Padgett, M.J. 3D computational imaging with single-pixel detectors. Science 2013, 340, 844–847. [Google Scholar] [CrossRef] [PubMed] [Green Version]
- Gong, W.; Zhao, C.; Yu, H.; Chen, M.; Xu, W.; Han, S. Three-dimensional ghost imaging lidar via sparsity constraint. Sci. Rep. 2016, 6, 26133. [Google Scholar] [CrossRef] [PubMed] [Green Version]
- Montagu, J. Galvanometric and Resonant Scanners. In Handbook of Optical and Laser Scanning, 2nd ed.; CRC Press: Boca Raton, FL, USA, 2016; pp. 418–473. [Google Scholar]
- Zhou, Y.; Lu, Y.; Hei, M.; Liu, G.; Fan, D. Motion control of the wedge prisms in Risley-prism-based beam steering system for precise target tracking. Appl. Opt. 2013, 52, 2849–2857. [Google Scholar] [CrossRef] [PubMed]
- Glennie, C.L.; Kusari, A.; Facchin, A. Calibration and Stability Analysis of the VLP-16 Laser Scanner. ISPRS Int. Arch. Photogramm. Remote Sens. Spat. Inf. Sci. 2016, 9, 55–60. [Google Scholar] [CrossRef] [Green Version]
- Miadlicki, K.; Saków, M. LiDAR Based System for Tracking Loader Crane Operator. In Proceedings of the International Scientific-Technical Conference MANUFACTURING, Poznan, Poland, 19–22 May 2019; Springer: Cham, Switzerland, 2019; pp. 406–421. [Google Scholar]
- Miadlicki, M.; Pajor, M.; Sakow, M. Real-time ground filtration method for a loader crane environment monitoring system using sparse LIDAR data. In Proceedings of the 2017 IEEE International Conference on Innovations in Intelligent Systems and Applications (INISTA), Gdynia, Poland, 3–5 July 2017. [Google Scholar]
- Miądlicki, K.; Pajor, M.; Saków, M. Ground plane estimation from sparse LIDAR data for loader crane sensor fusion system. In Proceedings of the 2017 22nd International Conference on Methods and Models in Automation and Robotics (MMAR), Miedzyzdroje, Poland, 28–31 August 2017; pp. 717–722. [Google Scholar]
- Takashima, Y.; Hellman, B.; Rodriguez, J.; Chen, G.; Smith, B.; Gin, A.; Espinoza, A.; Winkler, P.; Perl, C.; Luo, C.; et al. MEMS-based imaging LIDAR. In Optics and Photonics for Energy and the Environment; Optical Society of America: Washington, DC, USA, 2018; p. ET4A. [Google Scholar]
- Tsuji, H.; Imaki, M.; Kotake, N.; Hirai, A.; Nakaji, M.; Kameyama, S. Range imaging pulsed laser sensor with two-dimensional scanning of transmitted beam and scanless receiver using high-aspect avalanche photodiode array for eye-safe wavelength. Opt. Eng. 2016, 56, 031216. [Google Scholar] [CrossRef] [Green Version]
- Milanović, V.; Lo, W.K. Fast and high-precision 3D tracking and position measurement with MEMS micromirrors. In Proceedings of the 2008 IEEE/LEOS International Conference on Optical MEMs and Nanophotonics, Freiburg, Germany, 11–14 August 2008; pp. 72–73. [Google Scholar]
- Milanović, V.; Siu, N.; Kasturi, A.; Radojičić, M.; Su, Y. MEMSEye for optical 3D position and orientation measurement. SPIE Int. Soc. Opt. Eng. 2011, 7930, 79300U. [Google Scholar]
- Milanović, V.; Kasturi, A. Real-time 3D Tracking. Opt. Photon. 2013, 8, 55–59. [Google Scholar] [CrossRef]
- Zheng, Y.; Li, G.; Wu, S.; Liu, Y.; Gao, Y. Guided point cloud denoising via sharp feature skeletons. Vis. Comput. 2017, 33, 857–867. [Google Scholar] [CrossRef]


| 1 laser | |
| 60° (azimuth) by 60° (vertical) FOV | |
| Sensors | Range: Up To 50 m |
| 13 cm range accuracy | |
| 100 kHz | |
| 0.48 Watts | |
| Class 1 | |
| Laser | 1064 nm wavelength |
| 4 ns pulse width |
| Parameters | Values |
|---|---|
| Transmitter | |
| Beam diameter | 3.0 mm |
| Pulse energy | 4.8 uJ |
| Angle of divergence | 0.51 mrad |
| Transmitting system optical aperture | 32 mm |
| Receiver | |
| Receiving system optical aperture | 50 mm |
| APD photosensitive surface size | 3.0 mm |
| APD response frequency band | 250 MHz |
| Spectral response range (minimum) | 600 to 1150 nm |
| ADC sampling rate | 5 GSa/s |
| ADC bandwidth | 1 GHz |
| ADC sampling digit | 14 bit |
| Before Correction/° | After Correction/° | Distortion Reduction | |
|---|---|---|---|
| XZ plane | 15.255 | 3.901 | 74.428% |
| YZ plane | 17.650 | 5.194 | 70.572% |
Publisher’s Note: MDPI stays neutral with regard to jurisdictional claims in published maps and institutional affiliations. |
© 2021 by the authors. Licensee MDPI, Basel, Switzerland. This article is an open access article distributed under the terms and conditions of the Creative Commons Attribution (CC BY) license (http://creativecommons.org/licenses/by/4.0/).
Share and Cite
Guo, D.; Wang, C.; Qi, B.; Zhang, Y.; Li, Q. A Study of Correction to the Point Cloud Distortion Based on MEMS LiDAR System. Appl. Sci. 2021, 11, 2418. https://doi.org/10.3390/app11052418
Guo D, Wang C, Qi B, Zhang Y, Li Q. A Study of Correction to the Point Cloud Distortion Based on MEMS LiDAR System. Applied Sciences. 2021; 11(5):2418. https://doi.org/10.3390/app11052418
Chicago/Turabian StyleGuo, Dongbing, Chunhui Wang, Baoling Qi, Yu Zhang, and Qingyan Li. 2021. "A Study of Correction to the Point Cloud Distortion Based on MEMS LiDAR System" Applied Sciences 11, no. 5: 2418. https://doi.org/10.3390/app11052418