Article

Multi-Response Optimization of Coagulation and Flocculation of Olive Mill Wastewater: Statistical Approach

by
Srikanth Vuppala
1,*,
Riyaaz Uddien Shaik
2 and
Marco Stoller
3
1
Department of Civil and Environmental Engineering, Politecnico di Milano—Piazza Leonardo da Vinci, 32, 20133 Milan, Italy
2
Department of Astronautics Electrical and Energy Engineering, University of Rome “La Sapienza”, Via Eudossiana 18, 00184 Rome, Italy
3
Department of Chemical Materials Environmental Engineering, University of Rome “La Sapienza”, Via Eudossiana 18, 00184 Rome, Italy
*
Author to whom correspondence should be addressed.
Appl. Sci. 2021, 11(5), 2344; https://doi.org/10.3390/app11052344
Submission received: 10 February 2021 / Revised: 26 February 2021 / Accepted: 28 February 2021 / Published: 6 March 2021
(This article belongs to the Special Issue Sustainable Technologies for the Revalorization of Agro-Food Residues)

Abstract

:
Olive oil production is one of the important industrial sectors within the agro-food framework of the Mediterranean region, economically important to the people working in this sector, although there is also a threat to the environment due to residues. The main wastes of the olive oil extraction process are olive mill wastewater (OMW) and olive husks which also require proper treatment before dismissal. In this research work, the main goal is to introduce grey relational analysis, a technique for multi-response optimization, to the coagulation and flocculation process of OMW to select the optimum coagulant dosage. The coagulation and flocculation process was carried out by adding aluminum sulfate (Alum) to the waste stream in different dosages, starting from 100 to 2000 mg/L. In previous research work, optimization of this process on OMW was briefly discussed, but there is no literature available that reports the optimal coagulant dosage verified through the grey relational analysis method; therefore, this method was applied for selecting the best operating conditions for lowering a combination of multi-responses such as chemical oxygen demand (COD), total organic carbon (TOC), total phenols and turbidity. From the analysis, the 600 mg/L coagulant dosage appears to be top ranked, which obtained a higher grey relational grade. The implementation of statistical techniques in OMW treatment can enhance the efficiency of this process, which in turn supports the preparation of waste streams for further purification processes in a sustainable way.

1. Introduction

In the agro-food industry, olive oil production is one of the industrial practices in Mediterranean countries that contribute to the economy at higher levels [1]. During the extraction process, olive mill wastewater (OMW) is generated in higher amounts (in the successive steps of leaf removal, olive washing, grinding, beating and separation of oil) and considered as an environmental hazardous stream due to the high pollutant load, high concentrations of recalcitrant compounds, long-chain fatty acids, phenolic compounds, solids and biotoxicity [2]. Consequently, OMW treatment is not an easy task, and nowadays, most of the waste streams are, on the one hand, considered to be byproducts with a potential for revalorization in the framework of a circular economy approach, whilst, on the other hand, the revalorization of OMW by adopting low-cost treatments appears to be nearly impossible due to its characteristics [3].
Removal of solids from OMW is the first mandatory step, suggested to be performed initially, and possible by using coagulant materials or by centrifugation methods. Coagulation is defined as a chemical process used in wastewater treatment to remove suspended solids and to improve the removal of the chemical oxygen demand (COD). By employing this process, the tendency of small particles in an aqueous suspension to combine with one another can be significantly improved. The interaction among the particles results in the formation of larger aggregates that can be removed from the water by sedimentation and/or filtration as the process of coagulant cumulation to wastewater, in order to destabilize the colloidal particles promoting agglomeration, forming larger particles, which can be easily removed by sedimentation [4,5].
Several synthetic (inorganic and synthetic organic) and natural organic coagulants (NOC) are commonly used in conventional water treatment processes; however, synthetic inorganic coagulants such as FeCl3, polyaluminum chloride (PAC) and aluminum sulfate, Al2(SO4)3·14H2O (alum), are the most accepted and practiced in large-scale wastewater treatment plants [6]. Alum is efficient in turbidity removal [7] which will enhance the photocatalysis process. Azbar et al. [8] treated OMW with the coagulation and flocculation method prior to anaerobic degradation using alum and achieved 47% removal of COD, 27% total phenols, and 39% total organic carbon (TOC). Chiavola et al. [9] worked on OMW with several coagulants, and they observed that alum efficiency was less when compared to acid crackling; however, the raw OMW in their work contained high COD, at 69.4 g/L, and they achieved 20% of COD with 400 mg/L of the alum dosage and a pH of 8. Vuppala et al. [5] achieved 57.1% of COD removal with an 800 mg/L dosage of alum at pH 4.5. This shows that OMW requires extensive optimization since the characteristic changes depending on the month, olive fruit type, extraction method and region. Considering these facts, further optimization of coagulation and flocculation of OMW is needed since the required dosage of coagulant, optimal pH and other suitable conditions should be optimized [5]. In fact, this process consumes a lot of time and resources, leading to unsustainable operating cost issues in factories. This prevents the successful use of the coagulation and flocculation process since uncertainty prevails. Statistical techniques should be employed to study the optimization problem in a feasible way, but stochastic processes require very large sample data to be supported [10,11].
Considering, together, the need and difficulty in selecting a suitable coagulant dosage for OMW treatment, one of the most popular statistical techniques, that is, grey relational analysis, was selected in this work, targeting the optimization of controlled parameters such as TOC, COD, phenols, and turbidity. The grey system theory looks at each stochastic variable as a grey quantity that varies within a fixed region and within a certain time frame, and parallel to this, each stochastic process is a grey process. The engineering concept of a grey box is the basic concept of the grey system theory. Uncertain or not well-known relations among input and output parameters of the process refer to grey relations, or in other words, a relationship among the parameters of a grey system, where the proximity or closeness of grey data sequences represents different unbound parameters of the system. In this paradigm, greyness implies incompleteness [12]. In this work, TOC, COD, phenols and turbidity are taken as grey parameters that affect the amount of coagulant dosage to be used.
In the engineering and technical literature, the most popular technique is Deng’s grey relational analysis (GRA) model, permitting a multi-objective optimization and evaluation of process parameters. Some applications of the GRA model are as follows: (i) optimization of powder metallurgy processing parameters of the Al2O3/Cu composite using the GRA model coupled to the Taguchi method [13], in order to optimize electrical discharge machining process parameters; (ii) optimization of the process parameters for machining aluminum hybrid composites using electrical discharge machining (EDM) [14]; other researchers [15,16] also led works on EDM using the GRA model coupled with the Taguchi method for the multi-optimization of the micromachining process parameters; (iii) principal component analysis combined with multi-objective optimization of process parameters for hard turning of AISI 52100 steel was carried out [11]; (iv) Aslantas et al. [17] applied micro-milling to TI-6Al-4V, whereas another researcher [18] used the analytic hierarchy process (AHP) integrated GRA model to analyze the integrated cascade utilization system of waste geothermal water; (v) the relationships between some parameters to study the degree of the relative importance of the influencing factors about fractal dimensions for super pulverized coal particles were studied [19]. The list is only a selection of case studies that involved the GRA model or variants to seek successful process optimization.
Indeed, the common point of all processes is the high difficulty to select appropriate parameters to satisfy all the conditions. In such cases, the uncertainty of a system and the incompleteness of information could be related using grey relational analysis. Discrete data and multi-variable input can be processed for uncertainty and can generate discrete sequences for the correlation analysis of such sequences [20]. Therefore, it could be defined as a measurement method that discusses the consistency of an uncertain discrete sequence and its target.
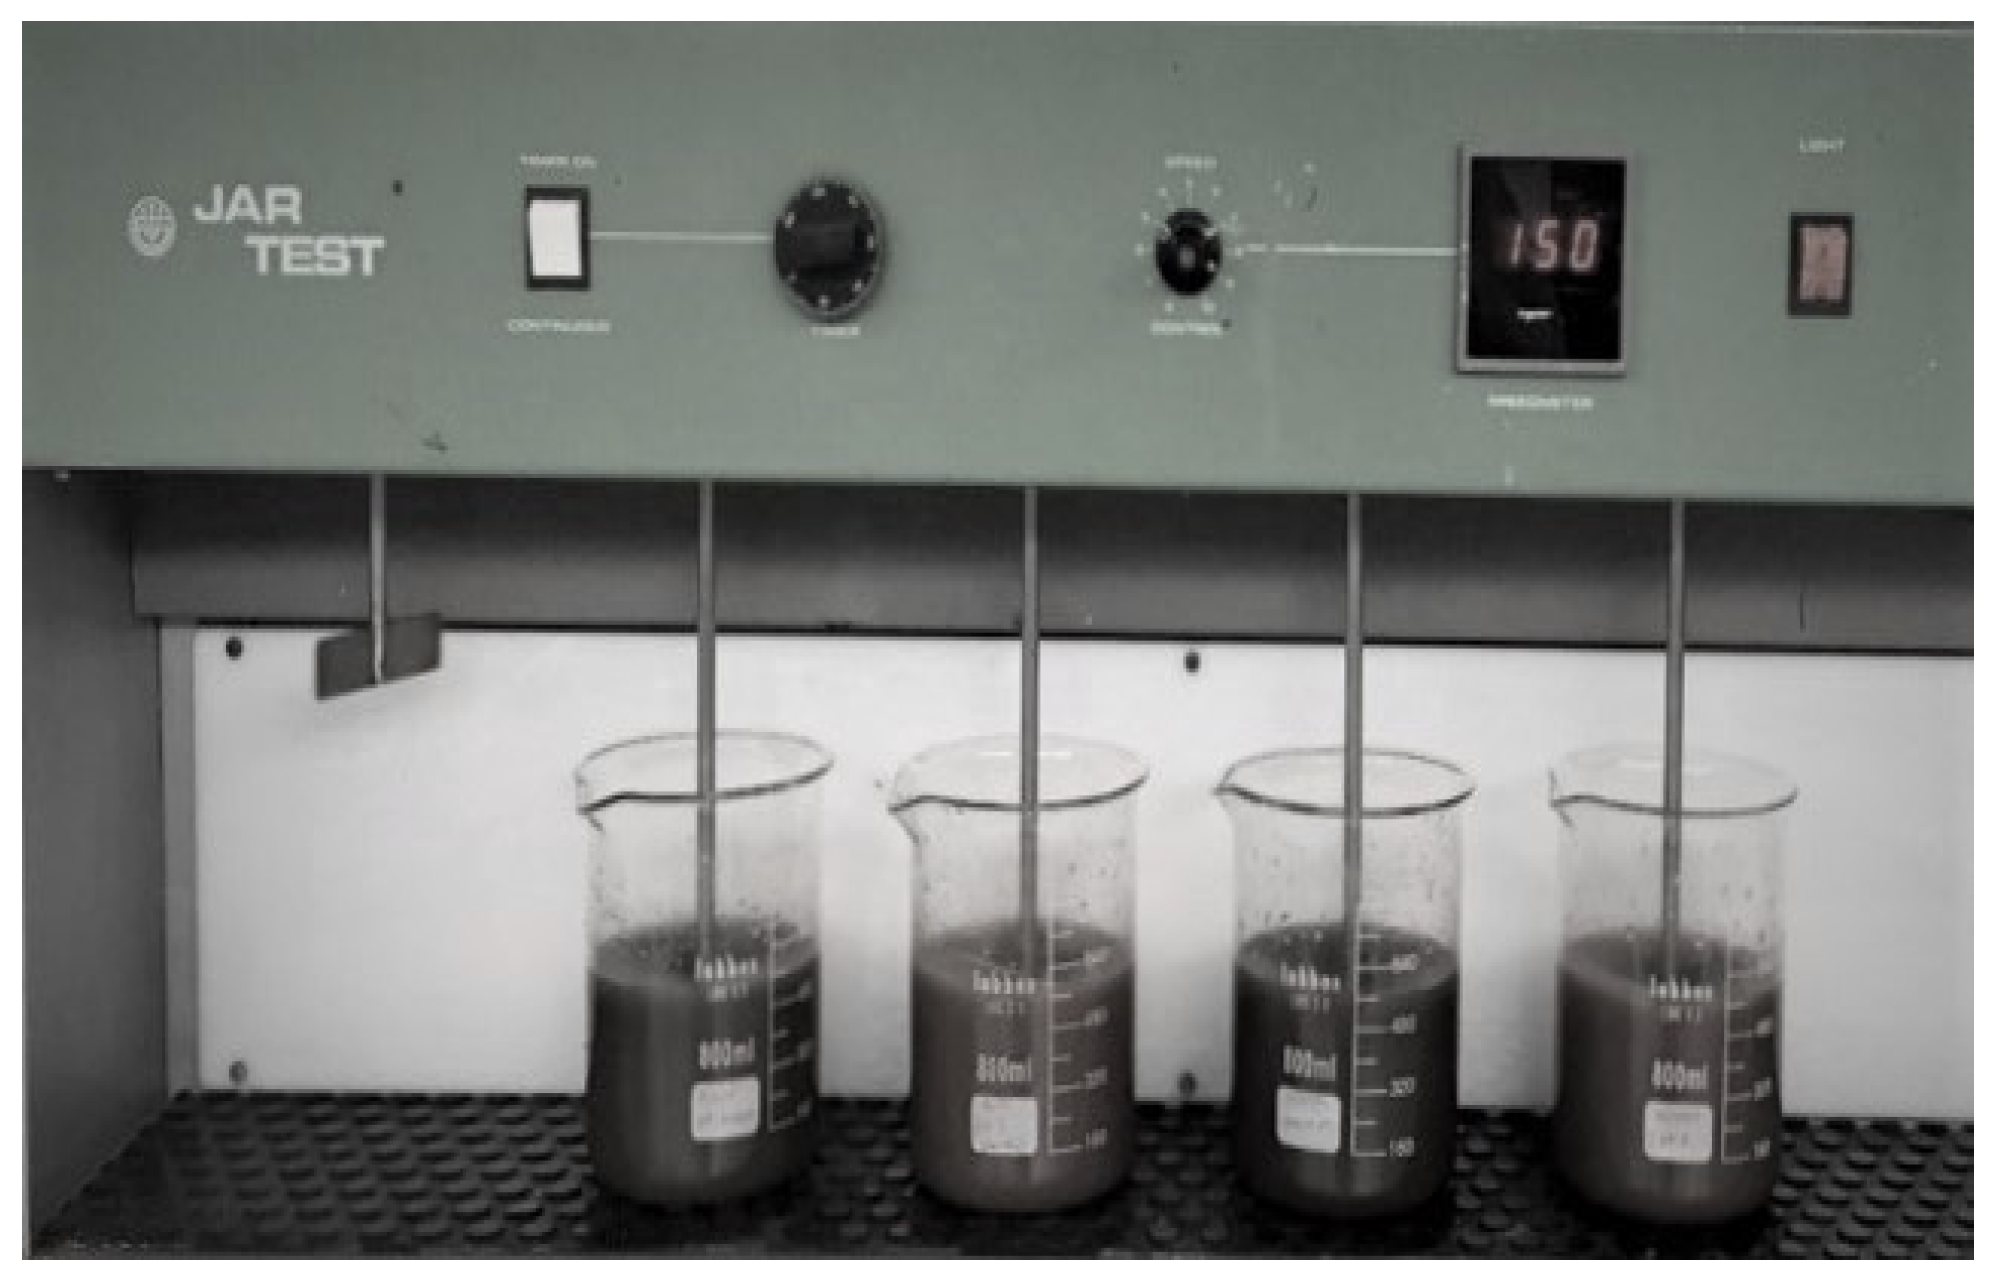
The present work reports multi-response optimization using GRA in the pretreatment of real olive mill wastewater through the coagulation–flocculation process by alum. The coagulation–flocculation method showed high removal rates of the targeted pollutants (TOC, turbidity, COD and total phenols). The experiments were performed by varying the coagulant dosages gradually from a low (100 mg/L) to a high amount (2000 mg/L), and the selection of the optimum amount of coagulant dosage was carried out using grey relational analysis. There is no literature available, so GRA is introduced for optimization of the coagulation and flocculation process to treat OMW. It was confirmed that GRA analysis is a potential and innovative statistical method to identify the optimal operating conditions without any errors.

2. Materials and Methods

2.1. Materials

OMW samples were collected nearby Rome, South of Lazio (Italy), from the local olive oil industry. In particular, the wastewater exits from an oil extraction process based on the 2-phase centrifugal method. The alum coagulant, Al2(SO4)3·14H2O, was procured from Sigma Aldrich (Milan, Italy) and the 1000 mg/L stock solution was prepared without any modifications. For each experiment, the desired concentration of coagulant was used from the prepared stock solution. All the reagents were purchased from Sigma Aldrich (Milan, Italy) and Carlo Erba (Milan, Italy). Deionized water was used for preparing the stock solution and for further dilutions to prepare respective coagulant dosages.

2.2. Experimental Design

To evaluate the performance of the coagulant, four control factors, that is, turbidity, COD, TOC and phenols, were considered. Coagulant dosage and control factors were selected based on a literature review [5], and the raw olive mill wastewater characterization is shown in Table 1. The coarse particles of OMW were separated using a sieve at 0.3 mm as a screening step. At a time (batch 1:100 mg/L–600 mg/L: alum dosage), 6 glass beakers with an 8000 mL volume were used, and 500 mL aliquots were added in tanks for the coagulation–flocculation process, performed through a jar test (shown in Figure 1); in the second batch, another 6 glass beakers were used (batch 2:700 mg/L–2000 mg/L: alum dosage). The coagulant alum concentration was varied in the range 100–2000 mg/L, and the coagulation time was 60 min at fixed pH (4.65) without any pH adjustments, initially with 3 min rapid agitation at 150 RPM and then slowly at 30 RPM for 20 min. The sedimentation step (60 min) followed the coagulation and flocculation process, where an aliquot of OMW solution was withdrawn and then pH, COD, TOC, turbidity and total phenols were determined.
All the parameters were analyzed according to the Standard Methods for the Examination of Water and Wastewater [21]. The turbidity was measured by an HF Scientific™ Micro 100 turbidimeter and the units were recorded as nephelometric turbidity units (NTUs), whereas the pH was measured with a Crison pH meter; COD was measured according to the closed reflux colorimetric method and the phenol concentration was measured by a UV–VIS spectrophotometer at 270 nm by observing the change in the absorbance at the maximum absorption wavelength (T80+, PG Instruments, Ltd., Wibtoft, UK) and then the concentration was calculated from a calibration curve; TOC values were determined using the TOC-L analyzer (Shimadzu) using a standard method [5].
The OMW was characterized by an initial COD value of 24,892 mg/L, TOC of 3200 mg/L, initial turbidity of 3200 NTU and phenols of 260 mg/L, presented in Table 1. Coagulation tests were conducted at room temperature, OMW was not diluted and pH was not adjusted.

2.3. Multi-Response Optimization Using GRA

Grey relational analysis can determine the similarity between seemingly irregular finite data and be used for the multi-response optimization of the coagulation and flocculation process in this study. The analysis was performed in four steps as reported stepwise in the next section of this paper (3.1). The selection of a proper criterion for result analysis must be fixed, that is, “higher-the-better” or “lower-the-better” [22]. Since the removal of wastes is our case, the “higher-the-better” criterion was adopted in this study.

2.4. Grey Relational Generation

There is an importance of normalizing the data used in the model, which can also be referred to as the grey relational generation process. In GRA, when the standard value and reference sequence range are considerably high, the function of the factors is neglected. Additionally, if the targets and directions of the involved factors appear to be disparate, GRA may yield inaccurate results. Hence, data pre-processing is performed to normalize the original reference sequences to a suitable sequence within the range of zero to one. To pre-process data using GRA, the response of the transformed sequences can be grouped into two quality characteristics, namely, “higher-the-better” (Equation (1)) or “smaller-the-better” (Equation (2)). A detailed explanation of the GRA process is mentioned in Section 3 using the values obtained in the coagulation and flocculation experiments. MATLAB software (R2020a) was used to generate the algorithm depending upon the stepwise procedure, as explained in Section 2.3 afterward.

3. Results and Discussion

3.1. Coagulation and Flocculation of OMW at Different Coagulant Dosages

The coagulation and flocculation of OMW was initially optimized by altering the coagulant dosage. The range was mentioned in the Materials and Methods and the tests were conducted at constant pH of raw OMW. At first, based on the literature, the coagulant dosage was at a low dosage [4]. Gradually, the dosage was increased from low, mid to high and the results are reported in Table 2, and the optimal alum concentration appears to be equal to 600 mg/L, very close to the optimal value found by other authors that treated similar OMW streams [8]. The coagulation–flocculation step is fundamental for the subsequent applications (advanced oxidation processes, membrane filtration, etc.) to reduce the turbidity of the effluent. This aspect is important for the photocatalysis process, allowing the light to penetrate the liquid volume with higher intensities. Therefore, the coagulation allowed the reduction of 96.31% of the initial turbidity, 64.63% of the COD, 23.77% of TOC and 66.15% of total phenols; however, the total phenols reduction was high at 700 mg/L. The COD reduction was mainly given by the sorption of organic acids and other surface-charged contaminants onto precipitated flocks, removed in the subsequent sedimentation process (sedimentation time equal to 60 min). As already observed in previous studies, an alum concentration above the optimum value increases the turbidity of the stream due to the restabilization mechanism typical of these processes; similarly, increasing the alum dosage also led to a decrease in TOC removal in another study [8].
The results achieved can be compared with those reported in the literature for a classical coagulant at pH 7 and 2500 mg/L dosage of FeCl3, where the removal of COD, TOC, and total phenols was, respectively, 57%, 45% and 26% on real OMW [23]. Using the FeSO4-7H2O coagulant at 6.67 g/L and flocculant FLOCAN 23 at 0.287 g/L at pH (5.3) achieved 72 ± 1.5% COD and 40 ± 1.3% total phenols removal [24]. In this study, 700 and 500 mg/L alum dosages also show efficient results, but the 600 mg/L dosages achieved better results for three controlled parameters except for total phenols. To select the operating dosage, it is a difficult task to assure optimal performances when the treatment process involves several parameters not all pointing in the same direction. To solve this problem of choice, GRA is applied and reported in Section 3.2.

3.2. Grey Relational Analysis of Coagulation and Flocculation of OMW

There are four steps when performing grey relational analysis.

3.2.1. Process of Grey Relational Generation

Firstly, normalization of data for the responses should be generated considering the lower-the-better or higher-the-better criterion which is called a process of grey relational generation. In our case, the higher-the-better criterion was followed since the targeted pollutants’ removal was satisfied and reported in Table 2. Therefore, values of the considered parameters were translated into a comparability sequence as indicated by Equation (1), where Xi(k) refers to the value of each parameter, I is the serial number of the schemes, k is the serial number of the criteria, max Yi(k) refers to the maximum of Yi(k), min Yi(k) refers to the minimum Yi(k) and Xi(k) refers to the standardized comparability sequence.
Firstly, the higher-the-better criterion can be expressed as Equation (1).
X i ( k ) = Y i ( k ) min Y i ( k ) max Y i ( k ) min Y i ( k )
Secondly, the lower-the-better criterion, which is preferred, can be expressed as Equation (2).
X i ( k ) = max Y i ( k ) Y i ( k ) max Y i ( k ) min Y i ( k )
Normalized data of responses after step 1 are shown in Table 3.
All the candidate values of criteria will be scaled into the range (0,1) upon completion of the grey relational generating procedure. It can be observed in Table 3 that experiment number 12 had a lower value of zero for TOC, whereas experiment number 1 gave a lower value for COD, phenols and turbidity since they had minimum values, among others. Maximum values were shown on TOC and COD in experiment 6, whereas maximum values for phenols were shown in experiment 7.
The normalized data of TOC may be represented with k = 1, that of COD with k = 2 and Table 3 and that of turbidity with k = 4.
If all its criterion values are closest to or equal to 1, the candidate is optimal. Following this, the deviation sequence is calculated between the reference sequence and comparable sequences to calculate the grey relational coefficient.

3.2.2. Deviation Sequence Generation

The deviation sequence can be used to define the closeness of a comparability sequence with a reference sequence. The values in Table 4 equal to an absolute value of the difference between the reference sequence and comparable sequence. The aim of determining the alternative whose comparability sequence is the closest to the reference sequence can be defined by the deviation sequence.
Δ 0 j =   x 0 ( k )   x i ( k )   =   difference   of   absolute   value   x 0   ( k )   and   x i   ( k )
Here, x0 (k) = 1, let delta = difference of absolute value.
The values obtained after step 2, the deviation sequence, are shown in Table 4.
The value of the deviation sequence measures the distance between the comparable sequence (value of 1) and the reference sequence [25]. If the value of deviation is close to 1, it is commented that the comparable sequence is remote to the reference sequence, and vice versa, if the value of deviation is close to 0, they are close to each other. In our case, experiment numbers 6 and 7 have values of 0, representing high closeness with a reference sequence.

3.2.3. Grey Relational Coefficient Generation

The correlation coefficients of each comparison sequence and reference sequence on the corresponding elements are calculated. In this analysis, the correlation coefficient is termed as a grey relational coefficient.
The grey relational coefficient ξi (k) can be calculated as
ξ i ( k ) = [ Δ min   +   ψ   Δ max ] [ Δ 0 i   ( k )   +   ψ   Δ max ]  
Among them, ξi (k) represents the grey correlation coefficients of two sequences at the K element. In the given Equation (4), the distinguishing coefficient (ψ) usually takes a value of 0.5, since a smaller value means a bigger difference between correlation coefficients and a stronger discrimination ability among parameters. The mid-value, i.e., 0.5, was therefore selected to be the best possible value for the distinguishing coefficient [25]. The closeness of Xi(k) and Xo(k) could be determined by a higher value of the grey relational coefficient. The grey relational coefficient can be calculated by Equation (4), where Δmax and Δmin are the maximum and minimum of Xi(k), respectively, and delta is the distinguishing coefficient between [0,1]. The grey relational coefficients between all comparability sequences and the reference sequences are calculated and reported in Table 5. It can be observed from Table 5 that experiment 6 has a maximum value for TOC, COD and turbidity, whereas experiment 7 has a maximum value concerning phenols.
The grey relational grade (GRG) can be calculated after the calculation of all the grey relational coefficients.

3.2.4. Grey Relational Grade Generation

The grey relational grade or Deng’s degree of grey incidence is a degree of partial proximity between two curves and is estimated by taking the average of the grey relational coefficients at each point (k). GRG is the measure of closeness of the geometrical distance between two curves and has been reported as a measure of influence on the reference sequence exerted by the comparison sequence. The grey relational grade between two sequences, i.e., in our case, between two experiments, represents the level of correlation between the reference sequence and the comparability sequence. Generally, the optimal choice would be the one with the highest grey relational grade between the comparability sequence and the reference sequence.
After averaging the grey relational coefficients, the grey relational grade γi can be computed as
γ i =   1 n n ( k ) = 1  
The highest value among GRGs in Table 6 is selected to be the best choice. In this work, rank 1 was obtained for experiment 6, which represents the operating conditions to achieve the best treatment results for the considered sample of OMW as a function of all four considered parameters.

3.3. Confirmation Test

A confirmation test was conducted after GRA, using 10 L of OMW in a single jar, equipped with a mechanical stirrer in the same conditions of the coagulation and flocculation test with the 600 mg/L alum dosage. The results (not shown) achieved were like the results achieved in the jar test method. These results prove that the obtained rank 1 through grey relational analysis at 600 mg/L alum dosage stays optimal for bigger OMW batches too.

4. Conclusions

OMW was treated through the coagulation and flocculation process using alum as a coagulant, with the target to find an optimum coagulant dosage among the range from a low dosage (100 mg/L) to a high dosage value (2000 mg/L) at constant pH, in small batches. To validate the optimal operating conditions, grey relational analysis (GRA) was adopted.
The highest value of GRG was obtained for the coagulant dosage of 600 mg/L. In these conditions, reduction performances of the considered multiple output characteristics (TOC, COD, phenols and turbidity) appeared maximized. In numbers, the obtained removal rates of turbidity, COD, TOC and total phenols were 96.31%, 64.63%, 23.77% and 66.15%, respectively. The results obtained from the grey analysis were validated using the same operating conditions on a bigger batch. Concluding, GRA appears to be a proper and useful tool to optimize operating conditions, viz., coagulant dosage, agitation times and agitation speed, to those not well-known processes affected by multi-parameter responses, such as the coagulation and flocculation of olive mill wastewater, and can improve the reliability of the process to be used safely as a proper pretreatment step in situ in olive oil factories.

Author Contributions

Conceptualization, S.V., R.U.S. and M.S.; methodology, S.V. and R.U.S.; investigation, S.V. and R.U.S.; software, R.U.S. All authors have read and agreed to the published version of the manuscript.

Funding

This research received no external funding.

Acknowledgments

The author (Srikanth Vuppala) acknowledges the XXXI Cycle-International fellowships, La Sapienza Sapienza University of Rome, Italy.

Conflicts of Interest

The authors declare no conflict of interest. The funders had no role in the design of the study or in the collection.

References

  1. Azzaz, A.A.; Jeguirim, M.; Kinigopoulou, V.; Doulgeris, C.; Goddard, M.L.; Jellali, S.; Matei Ghimbeu, C. Olive mill wastewater: From a pollutant to green fuels, agricultural and water source and bio-fertilizer—Hydrothermal carbonization. Sci. Total Environ. 2020, 733, 139314. [Google Scholar] [CrossRef] [PubMed]
  2. Vavouraki, A.I.; Zakoura, M.V.; Dareioti, M.A.; Kornaros, M. Biodegradation of Polyphenolic Compounds from Olive Mill Wastewaters (OMW) during Two-Stage Anaerobic Co-Digestion of Agro-Industrial Mixtures. Waste Biomass Valoriz. 2020, 11, 5783–5791. [Google Scholar] [CrossRef]
  3. Sáez, J.A.; Pérez-Murcia, M.D.; Vico, A.; Martínez-Gallardo, M.R.; Andreu-Rodríguez, F.J.; López, M.J.; Bustamante, M.A.; Sanchez-Hernandez, J.C.; Moreno, J.; Moral, R. Olive mill wastewater-evaporation ponds long term stored: Integrated assessment of in situ bioremediation strategies based on composting and vermicomposting. J. Hazard. Mater. 2021, 402, 123481. [Google Scholar] [CrossRef] [PubMed]
  4. Rizzo, L.; Lofrano, G.; Belgiorno, V. Olive Mill and Winery Wastewaters Pre-Treatment by Coagulation with Chitosan. Sep. Sci. Technol. 2010, 45, 2447–2452. [Google Scholar] [CrossRef]
  5. Vuppala, S.; Bavasso, I.; Stoller, M.; Di Palma, L.; Vilardi, G. Olive mill wastewater integrated purification through pre-treatments using coagulants and biological methods: Experimental, modelling and scale-up. J. Clean. Prod. 2019, 236, 117622. [Google Scholar] [CrossRef]
  6. Gandiwa, B.I.; Moyo, L.B.; Ncube, S.; Mamvura, T.A.; Mguni, L.L.; Hlabangana, N. Optimisation of using a blend of plant based natural and synthetic coagulants for water treatment: (Moringa Oleifera-Cactus Opuntia-alum blend). S. Afr. J. Chem. Eng. 2020, 34, 158–164. [Google Scholar] [CrossRef]
  7. El Shahawy, A.; Hassan, S.; Ebrahiem, E.E.; El Kersh, I. Organic pollutants removal from olive mill wastewater by coagulation and electrocoagulation: Application of box-behnken design (BBD). Desalin. Water Treat. 2019, 148, 102–118. [Google Scholar] [CrossRef] [Green Version]
  8. Azbar, N.; Keskin, T.; Catalkaya, E.C. Improvement in anaerobic degradation of olive mill effluent (OME) by chemical pretreatment using batch systems. Biochem. Eng. J. 2008, 38, 379–383. [Google Scholar] [CrossRef]
  9. Chiavola, A.; Farabegoli, G.; Rolle, E. Combined biological and chemical-physical process for olive mill wastewater treatment. Desalin. Water Treat. 2010, 23, 135–140. [Google Scholar] [CrossRef]
  10. Frutiger, J.; Jones, M.; Ince, N.G.; Sin, G. From property uncertainties to process simulation uncertainties—Monte Carlo methods in SimSci PRO/II process simulator. In 13 International Symposium on Process Systems Engineering (PSE 2018); Eden, M.R., Ierapetritou, M.G., Towler, G.P., Eds.; Elsevier: Amsterdam, The Netherlands, 2018; pp. 1489–1494. [Google Scholar] [CrossRef]
  11. Javed, S.A.; Khan, A.M.; Dong, W.; Raza, A.; Liu, S. Systems evaluation through new grey relational analysis approach: An application on thermal conductivity-petrophysical parameters’ relationships. Processes 2019, 7, 348. [Google Scholar] [CrossRef] [Green Version]
  12. Jiang, B.C.; Tasi, S.L.; Wang, C.C. Machine vision-based gray relational theory applied to IC marking inspection. IEEE Trans. Semicond. Manuf. 2002, 15, 531–539. [Google Scholar] [CrossRef]
  13. Hussain, M.Z.; Khan, S.; Sarmah, P. Optimization of powder metallurgy processing parameters of Al2O3/Cu composite through Taguchi method with Grey relational analysis. J. King Saud Univ. Eng. Sci. 2020, 32, 274–286. [Google Scholar] [CrossRef]
  14. Maniyar, K.G.; Ingole, D.S. Multi response optimization of EDM process parameters for aluminium hybrid composites by GRA. Mater. Today Proc. 2018, 5, 19836–19843. [Google Scholar] [CrossRef]
  15. Kumar Chauhan, N.; Kumar Das, A.; Rajesha, S. Optimization of process parameters using grey relational analysis and taguchi method during micro-EDMing. Mater. Today Proc. 2018, 5, 27178–27184. [Google Scholar] [CrossRef]
  16. Pandey, A.K.; Gautam, G.D. Grey relational analysis-based genetic algorithm optimization of electrical discharge drilling of Nimonic-90 superalloy. J. Braz. Soc. Mech. Sci. Eng. 2018, 40, 117. [Google Scholar] [CrossRef]
  17. Aslantas, K.; Ekici, E.; Çiçek, A. Optimization of process parameters for micro milling of Ti-6Al-4V alloy using Taguchi-based gray relational analysis. Meas. J. Int. Meas. Confed. 2018, 128, 419–427. [Google Scholar] [CrossRef]
  18. Luo, X.; Wang, Y.; Zhao, J.; Chen, Y.; Mo, S.; Gong, Y. Grey relational analysis of an integrated cascade utilization system of geothermal water. Int. J. Green Energy 2016, 13, 14–27. [Google Scholar] [CrossRef]
  19. Liu, J.; Jiang, X.; Huang, X.; Wu, S. Morphological characterization of superfine pulverized coal particles. 1. Fractal characteristics and economic fineness. Energy Fuels 2010, 24, 844–855. [Google Scholar] [CrossRef]
  20. Siksnelyte, I.; Zavadskas, E.K.; Streimikiene, D.; Sharma, D. An overview of multi-criteria decision-making methods in dealing with sustainable energy development issues. Energies 2018, 11, 2754. [Google Scholar] [CrossRef] [Green Version]
  21. American Public Health Association; American Water Works Association; Water Environment Federation. Standard Methods for the Examination of Water and Wastewater; APHA-AWWA-WEF: Washington, DC, USA, 2005; ISBN 0875530478/9780875530475. [Google Scholar]
  22. JagadeeswaraRao, M.; Shaik, R.U.; Buschaiah, K. Grey Relational Analysis of EDM Process Parameters for Incoloy-800. In International Conference on Emerging Trends in Engineering (ICETE); Satapathy, S., Raju, K., Molugaram, K., Krishnaiah, A., Tsihrintzis, G., Eds.; Learning and Analytics in Intelligent Systems; Springer: Cham, Switzerland, 2020; Volume 2. [Google Scholar] [CrossRef]
  23. Gursoy-Haksevenler, B.H.; Arslan-Alaton, I. Treatment of olive mill wastewater by chemical processes: Effect of acid cracking pretreatment. Water Sci. Technol. 2014, 69, 1453–1461. [Google Scholar] [CrossRef] [Green Version]
  24. Papaphilippou, P.C.; Yiannapas, C.; Politi, M.; Daskalaki, V.M.; Michael, C.; Kalogerakis, N.; Mantzavinos, D.; Fatta-Kassinos, D. Sequential coagulation–flocculation, solvent extraction and photo-Fenton oxidation for the valorization and treatment of olive mill effluent. Chem. Eng. J. 2013, 224, 82–88. [Google Scholar] [CrossRef]
  25. Ertugrul, I.; Oztas, T.; Ozcil, A.; Oztas, G.Z. Grey Relational Analysis Approach in Academic Performance Comparison of University: A Case Study of Turkish Universities. Eur. Sci. J. 2016, 12, 128–139. [Google Scholar] [CrossRef]
Figure 1. Jar test apparatus for optimization of coagulation and flocculation experiments [5].
Applsci 11 02344 g001
Table 1. Control factors of olive mill wastewater (OMW) treatment.
Control FactorsUnitsConcentration
pHNA4.65
TurbidityNTU3200 (NTU)
TOCmg/L3660 (mg/L)
CODmg/L24,892 (mg/L)
Phenolsmg/L260 (mg/L)
Table 2. Percentage removal of targeted pollutants vs. coagulant dosage.
ExperimentDosage (mg/L)TOC%COD%Phenols%Turbidity%
110014.9751.9630.777.44
220015.3655.7133.8517.97
330018.3159.7436.5437.50
440021.0459.8853.8553.13
550021.1260.2162.3193.81
660023.7764.636596.31
770022.9863.8566.1594.44
880016.4863.8262.3193.13
990015.6062.6960.7791.69
10100012.9262.5654.6291.25
11150012.5462.2453.0887.84
12200011.8062.2250.3886.88
Table 3. Normalized data of responses.
Experiment TOCCODPhenolsTurbidity
10.2648000
20.29680.29600.08700.1185
30.54340.61420.16300.3383
40.77170.62500.65220.5141
50.77850.65100.89130.9719
61.00001.00000.96741.0000
70.93380.93881.00000.9789
80.39040.93590.89130.9641
90.31740.84710.84780.9480
100.09360.83690.67390.9430
110.06160.81190.63040.9047
1200.80960.55430.8938
Table 4. Deviation sequence.
Experiment TOCCODPhenolsTurbidity
0 (reference sequence)1111
10.73521.00001.00001.0000
20.70320.70400.91300.8815
30.45660.38580.83700.6617
40.22830.37500.34780.4859
50.22150.34900.10870.0281
6000.03260
70.06620.061200.0211
80.60960.06410.10870.0359
90.68260.15290.15220.0520
100.90640.16310.32610.0570
110.93840.18810.36960.0953
121.00000.190430.44570.1062
Table 5. Grey relational coefficient.
Experiment TOCCODPhenolsTurbidity
10.40480.33330.33330.3333
20.41560.41530.35380.3619
30.52270.56450.37400.4304
40.68650.57140.58970.5071
50.69300.58890.82140.9467
61.00001.00000.93881.0000
70.88310.89091.00000.9595
80.45060.88640.82140.9331
90.42280.76580.76670.9057
100.35550.75410.60530.8977
110.34760.72660.57500.8399
120.33330.72430.52870.8248
Table 6. Grey relational grade (GRG) table.
Experiment TOCCODPhenolsTurbidityGRGRANK
10.40480.33330.33330.33331.404812
20.41560.41530.35380.36191.546611
30.52270.56450.37400.43041.891510
40.68650.57140.58970.50712.35489
50.69300.58890.82140.94673.05013
61.00001.00000.93881.00003.93881
70.88310.89091.00000.95953.73352
80.45060.88640.82140.93313.09154
90.42280.76580.76670.90572.86165
100.35550.75410.60530.89772.61266
110.34760.72660.57500.83992.48927
120.33330.72430.52870.82482.41128
Publisher’s Note: MDPI stays neutral with regard to jurisdictional claims in published maps and institutional affiliations.

