Article

Electric-Field Induced Shift in the Plasmon Resonance Due to the Interfacial Pockels Effect of Water on a Silver Surface †

1
Department of Physics, Faculty of Science, Tokyo University of Science, 1-3 Kagurazaka, Shinjuku-ku, Tokyo 162-8601, Japan
2
Department of Electronics and Information Technology, Faculty of Science and Technology, Hirosaki University, Hirosaki, Aomori 036-8561, Japan
3
Advanced Ultrafast Laser Research Center and Department of Engineering Science, The University of Electro-Communications, Chofu, Tokyo 182-8585, Japan
4
Department of Electrophysics, National Chiao Tung University, 1001 Ta Hsueh Road, Hsinchu 300, Taiwan
5
Research Center for Water Frontier Science and Technology, Tokyo University of Science, 1-3 Kagurazaka, Shinjuku-ku, Tokyo 162-8601, Japan
*
Author to whom correspondence should be addressed.
Application: An electro-optic modulator based on fully interfacial effects (surface plasmon polaritons and the Pockels effect) as a potential application.
Appl. Sci. 2021, 11(5), 2152; https://doi.org/10.3390/app11052152
Submission received: 6 February 2021 / Revised: 16 February 2021 / Accepted: 23 February 2021 / Published: 28 February 2021
(This article belongs to the Special Issue Advances of Interfacial Optics)

Abstract

:
In the research on application of an optical modulator used for information communication, materials having a large Pockels effect, a refractive index change proportional to the electric-field, are required. It is known that the interfacial water on the surface of transparent oxide electrodes has a giant Pockels coefficient, which is an order of magnitude larger than the solid Pockels crystals practically used. It is important to know the Pockels coefficient of water on not only an oxide surface, but also a metal surface to understand the mechanism of the interfacial Pockels effect of water. However, a method has not yet been established for evaluating the coefficient of water–metal interface. Here we present an evaluation method of the Pockels coefficient of interfacial water on a metal (silver) surface from the spectral shift of the surface plasmon polariton resonance due to electric-field induced refractive index change of the interfacial water. The Pockels coefficient of interfacial water on Ag was evaluated as | r 33 | = 5 ± 1 pm/V, without need for exact knowledge of the thickness of the interfacial layer (electric double layer of water) as long as the penetration depth of the plasmon is larger than the thickness.

1. Introduction

The Pockels effect is a refractive index change ( Δ n ) proportional to the applied electric ( E ) field, and is characterized by a sign reversal of the Δ n when the direction of the E field changes. Materials exhibiting the large Pockels effect are essential for optical communications, and active study is being conducted to search for them.
In one such study, it was reported in 2007 and 2008 that water in the nanometer-order electric double layer (EDL) [1] at the interface of transparent oxide electrodes has a Pockels coefficient one order of magnitude larger than that of the electro-optic crystal LiNbO3, which is in practical use [2,3] (see also [4,5] and reference therein). Since then, it has been reported that the magnitude of the Pockels coefficient depends on the electrode material (about 1/3 for GaN electrodes compared to Indium Tin Oxide, ITO, electrodes) [6], and that liquids other than water also exhibit the Pockels effect [7]. However, the microscopic physical mechanism is still unknown, and there is no theory that can predict the magnitude and sign of the Pockels coefficient. For metal electrodes, there is only an evaluation on the order of the Pockels coefficient for platinum being two orders of magnitude smaller than that of ITO [8], and a precise quantitative evaluation has not yet been performed. The reason for this is that the Δ n of interfacial water on the transparent electrode was estimated from the shift of interference fringes in the transmission spectrum of the thin transparent electrode film [2,3], while the same method cannot be used for metals because it is difficult to observe interference fringes even in thin films due to their large extinction coefficient [8]. If we can evaluate the Pockels coefficient of water at the interface of noble metals such as silver (Ag) and platinum (Pt), it will be the key to understand the mechanism. Therefore, the purpose of this paper is to establish a method to evaluate the Pockels coefficient of water on metal surfaces.
Surface plasmon polariton (SPP) resonance is known as a phenomenon that shows a sharp spectral structure in metals. Surface plasmons localized on metal surfaces have been used as highly sensitive sensors to probe the state of the interface because their resonance energy is sensitive to the refractive index of the dielectric in contact with the metal surface. This principle has long been the focus of attention, and has been applied as highly sensitive sensors for trace substances [9,10]. The detection mechanism is based on the adsorbed molecules causing a change in the local refractive index, which in turn changes the resonance conditions of the SPP waves. For this purpose, the attenuated total reflectance method (Kretschmann geometry) is generally used [11,12]. For example, we can sense the adsorption of small amounts of molecules on metal surfaces in water or air.
More directly, the Pockels effect in the material in contact with the metal has been studied and utilized. As an earlier pioneering work, the Pockels effect by the Langmuir–Blodgett film coated on Ag was sensitively detected as the SPP resonance shift, and the nonlinear susceptibility χ ( 2 ) was evaluated [13,14]. Then, an electro-optic (EO) polymer in contact with Ag was demonstrated as a light modulator, because the shift of the resonance dip due to the Δ n is proportional to the E field applied to the EO polymer [15]. In all these studies, Kretschmann geometry was used. Since then, high-speed and high-modulation-depth plasmon light modulators with more sophisticated structures have been reported [16,17,18,19], where EO materials, such as EO polymers exhibiting the Pockels effect, have been used as dielectrics in contact with the surface. More interestingly, a deep optical modulation was recently demonstrated using the shift of interference fringes on ITO due to the Pockels effect of water within a nanometer-order layer. The interference effect appeared as a sharp spectral dip in the total reflection spectrum at the ITO-water interface, and evanescent light penetrating the water side picked up the Δ n there, causing the dip to shift spectrally. Note that the principle of this modulator is the same as Reference [15], because the mechanism of generating the sharp dip is both “coherent perfect absorption” [20,21]. Therefore, if the Pockels coefficient of water at the interface of a metal showing sharp SPP resonance is large, it would provide a unique method of light modulation because the SPP and the Pockels effect are both the interfacial effect.
In this paper, with the above motivation, we used Ag, which has long been studied for its sharp plasmon resonance, to observe the spectral shift of the plasmon resonance caused by the Pockels effect of water in the EDL of its interface. The magnitude of the Pockels coefficient was evaluated as | r 33 | = 5 ± 1 pm/V. Here, the lower index “3” designates the electric-field direction normal to the electrode surface. Although it is difficult to estimate the thickness of the EDL under an alternating current (AC) E field, we have shown that a reliable value for the coefficient can be estimated by considering the penetration depth of SPPs without knowing the exact thickness. This value is consistent with the order of magnitude estimated for Pt, indicating that the Pockels coefficient of water is smaller on the noble metal surface than on the oxide or nitride electrode surface.

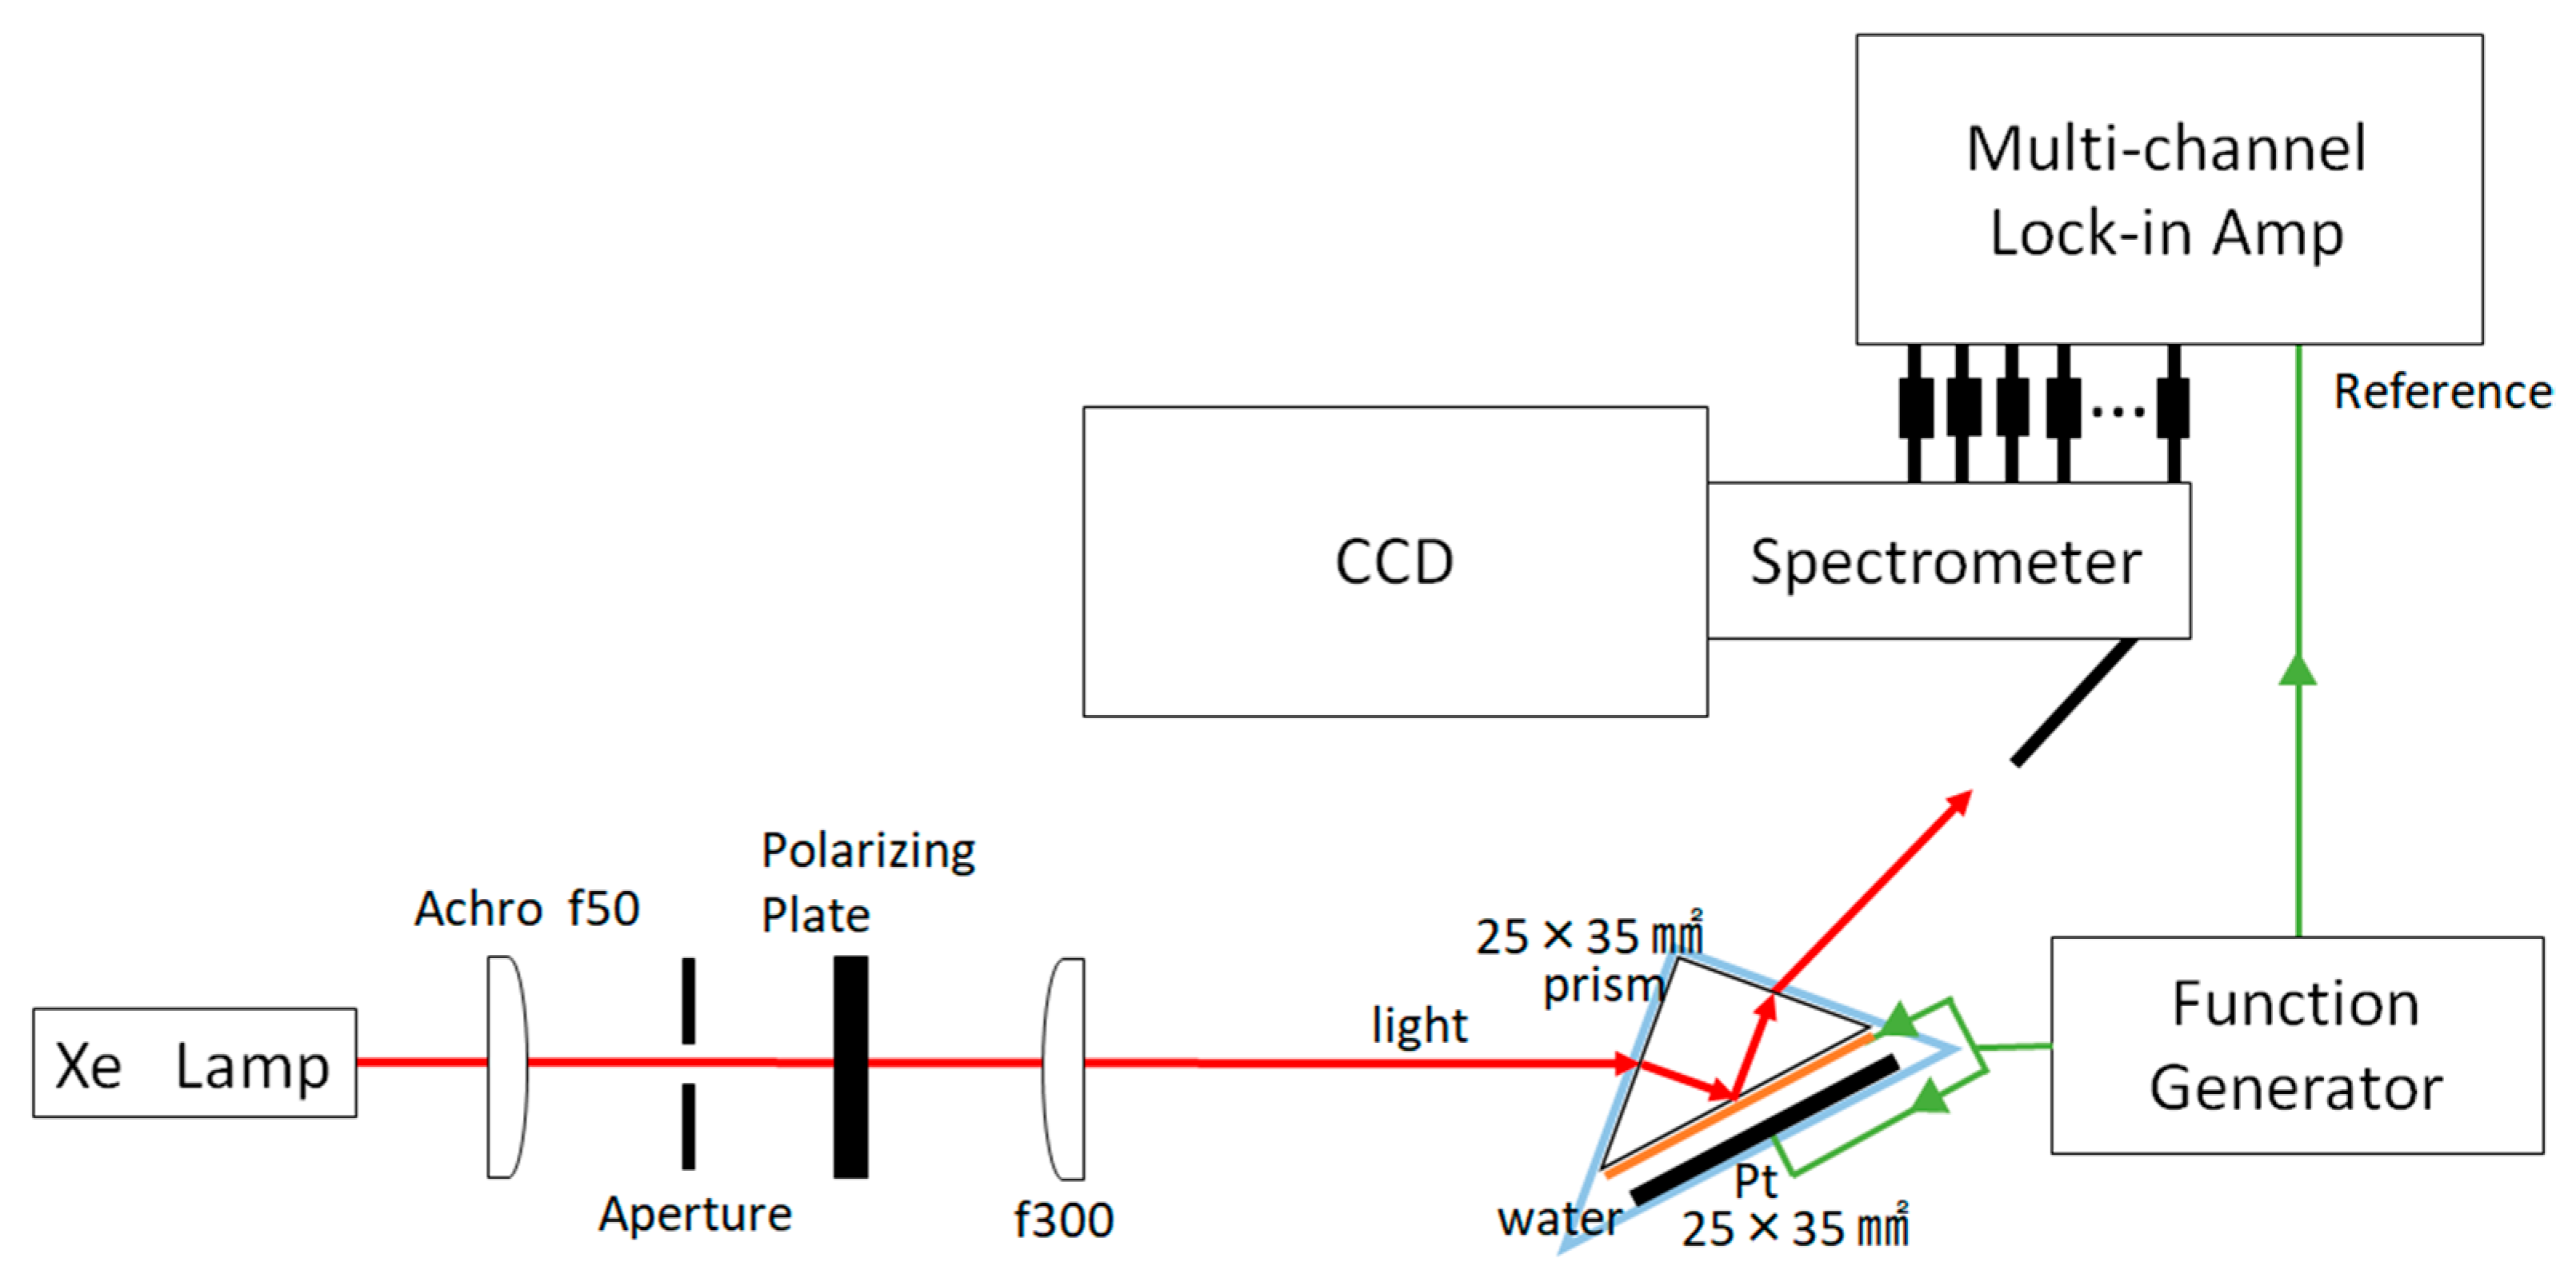
2. Materials and Methods

Ag films were deposited by vacuum evaporation onto the hypotenuse surface of right-angle quartz prism ( 25 × 35   cm 2 ) at room temperature. The evaporation was performed in a diffusion-pumped vacuum deposition system (VPC-260, ULVAC, Chigasaki, Japan) using 99.9% pure Ag wires on a tungsten boat at a pressure of 4.0 × 10 3 Pa and a deposition rate of 0.30 nm/s to obtain 53-nm-thick film. A conducting wire was attached to the deposition surface using silver paste.
The incident angle dependence of the SPP resonance spectra of Ag in air was measured in the Kretschmann configuration (by attenuated total reflection) by varying the incident angle using a spectrophotometer (SolidSpec-3700 DUV, Shimadzu, Kyoto, Japan) in the variable-angle absolute reflectance measurement mode.
For the measurement of reflection spectra and E -field modulation spectra in water, the Ag-deposited prism was placed in a self-made triangular prism-shaped glass cell fixed on a rotating stage with all but the hypotenuse surface in close contact with the glass cell. A sodium chloride aqueous solution with a concentration of 1.0 × 10 4 mol/L was poured into the space between the prism hypotenuse surface and the glass cell, and a Pt plate electrode was placed at 5 mm from the Ag film. For the measurement of the electromodulation spectra, we adopted a reflection angle within the prism of 70.3° (   θ = 70.3°). The reason for setting the aqueous solution concentration to 1.0 × 10 4 mol/L is that the Ag film reacts with the aqueous solution and deteriorates when an E field is applied.
The experimental setup is shown in Figure 1. The white light from a Xe lamp (EQ-99 X, Energetiq, Wilmington, MA, USA) was irradiated to the prism and was made incident on the Ag thin film from within the prism. Then the total reflected light is transferred through an optical fiber bundle to an imaging spectrometer (SpectraPro 300i, Acton, IN, USA) with a liquid nitrogen cooled Charge Coupled Device (CCD) (SPEC-10 System, Princeton Instruments, Trenton, NJ, USA). The reflected light spectra R p and R s of p-polarized and s-polarized light were measured by adjusting the angle of the polarizing plate for the reflectance ratio R p / R s to be obtained.
By switching a flipping mirror in the spectrometer to the other exit port, the totally reflected and spectrally dispersed light was sent to a multichannel lock-in amplifier (7210, Signal Recovery, Edinburgh, UK) for electromodulation spectroscopy. At the focal plane of the exit port, 128 monochromatized components of light were focused onto a bundled fiber array of 100 µm core/110 µm clad fibers arranged in a 16 × 128 rectangle, and were sent to 128 avalanche photododes (APDs, S5343, Hamamatsu Photonics, Hamamatsu, Japan) through 128 fibers bundled with 16 vertical fibers together for detection. The signals from 128 APDs were pre-amplified and detected with the 128-channel lock-in amplifier. Thus, a tiny change in the reflected light spectrum synchronized with a specific modulation frequency of the AC E field applied to the sample was efficiently detected at 128 wavelengths simultaneously [2,3].
The function generator was connected to a lead wire attached to the Ag thin film deposited on the prism. The AC E field with amplitude of 0.4 V, 0.8 V, 1.2 V, 1.6 V, and 2.0 V at frequencies f of 222 Hz, 333 Hz, and 444 Hz were applied between the Ag film and the Pt electrode. The difference reflection (reflection change) spectra Δ R ( ω ) of both in-phase ( X ) and quadrature-phase ( Y ) components at the modulation frequency f were detected with the multi-lock-in and normalized with the reflected ( R ) spectra of the white light, which were also taken with the multi-lock-in at the chopper modulation frequency around 230 Hz.
The X and Y components of the observed reflection change Δ R p were denoted as Δ X and Δ Y , respectively, and normalized against R p to obtain Δ X / R p and Δ Y / R p spectra in order to remove the channel dependence of sensitivity of the multi-lock-in and the wavelength dependence of the white light spectrum.

3. Results and Discussion

3.1. Results

The concentration of NaCl in the aqueous solution could not be increased because NaCl reacts with the electrode with the voltage applied. The deterioration of the electrode during the experiment was minimized by setting the electrolyte concentration as low as possible (0.0001 mol/L), but when the electrolyte concentration was 0.001 mol/L, the electrode discolored and SPP resonance could not be detected. In addition, the experiment was carried out with an aqueous solution of sodium dihydrogenphosphate having a concentration of 0.1 mol/L, but the electrode was similarly deteriorated and SPP resonance could not be observed.
Figure 2a,b show R p / R s spectra at three incidence angles θ within the quartz prism. The resonance dip of the SPP in Ag was observed and its energy was blue-shifted as θ was increased, expected from the resonance (intersection) between the SPP dispersion curve and the prism light line as a function of k , light wavenumber parallel to the Ag surface [12]. The resonance energy was red-shifted when the dielectric medium in contact with Ag surface was replaced from air to water, as expected from the surface plasmon energy ω = ω p n 2 + 1 as k , where ω p is the bulk plasma frequency and n is the refractive index of the medium.
Figure 3 shows electromodulation spectra synchronized with f at θ = 70.3° for frequencies f of 222, 333, and 444 Hz, with the applied voltages from 0.4 to 2.0 V. Compared with the reflection spectrum at θ = 70.3° in Figure 2b, it is clear that the E field modulation signal is an energy shift of the SPP resonance dip, because the latter takes the form of the first derivative of the former with respect to photon energy. The modulation signal synchronized with 2 f was smaller by more than one order of magnitude, so that the signal was dominated by the Pockels effect.

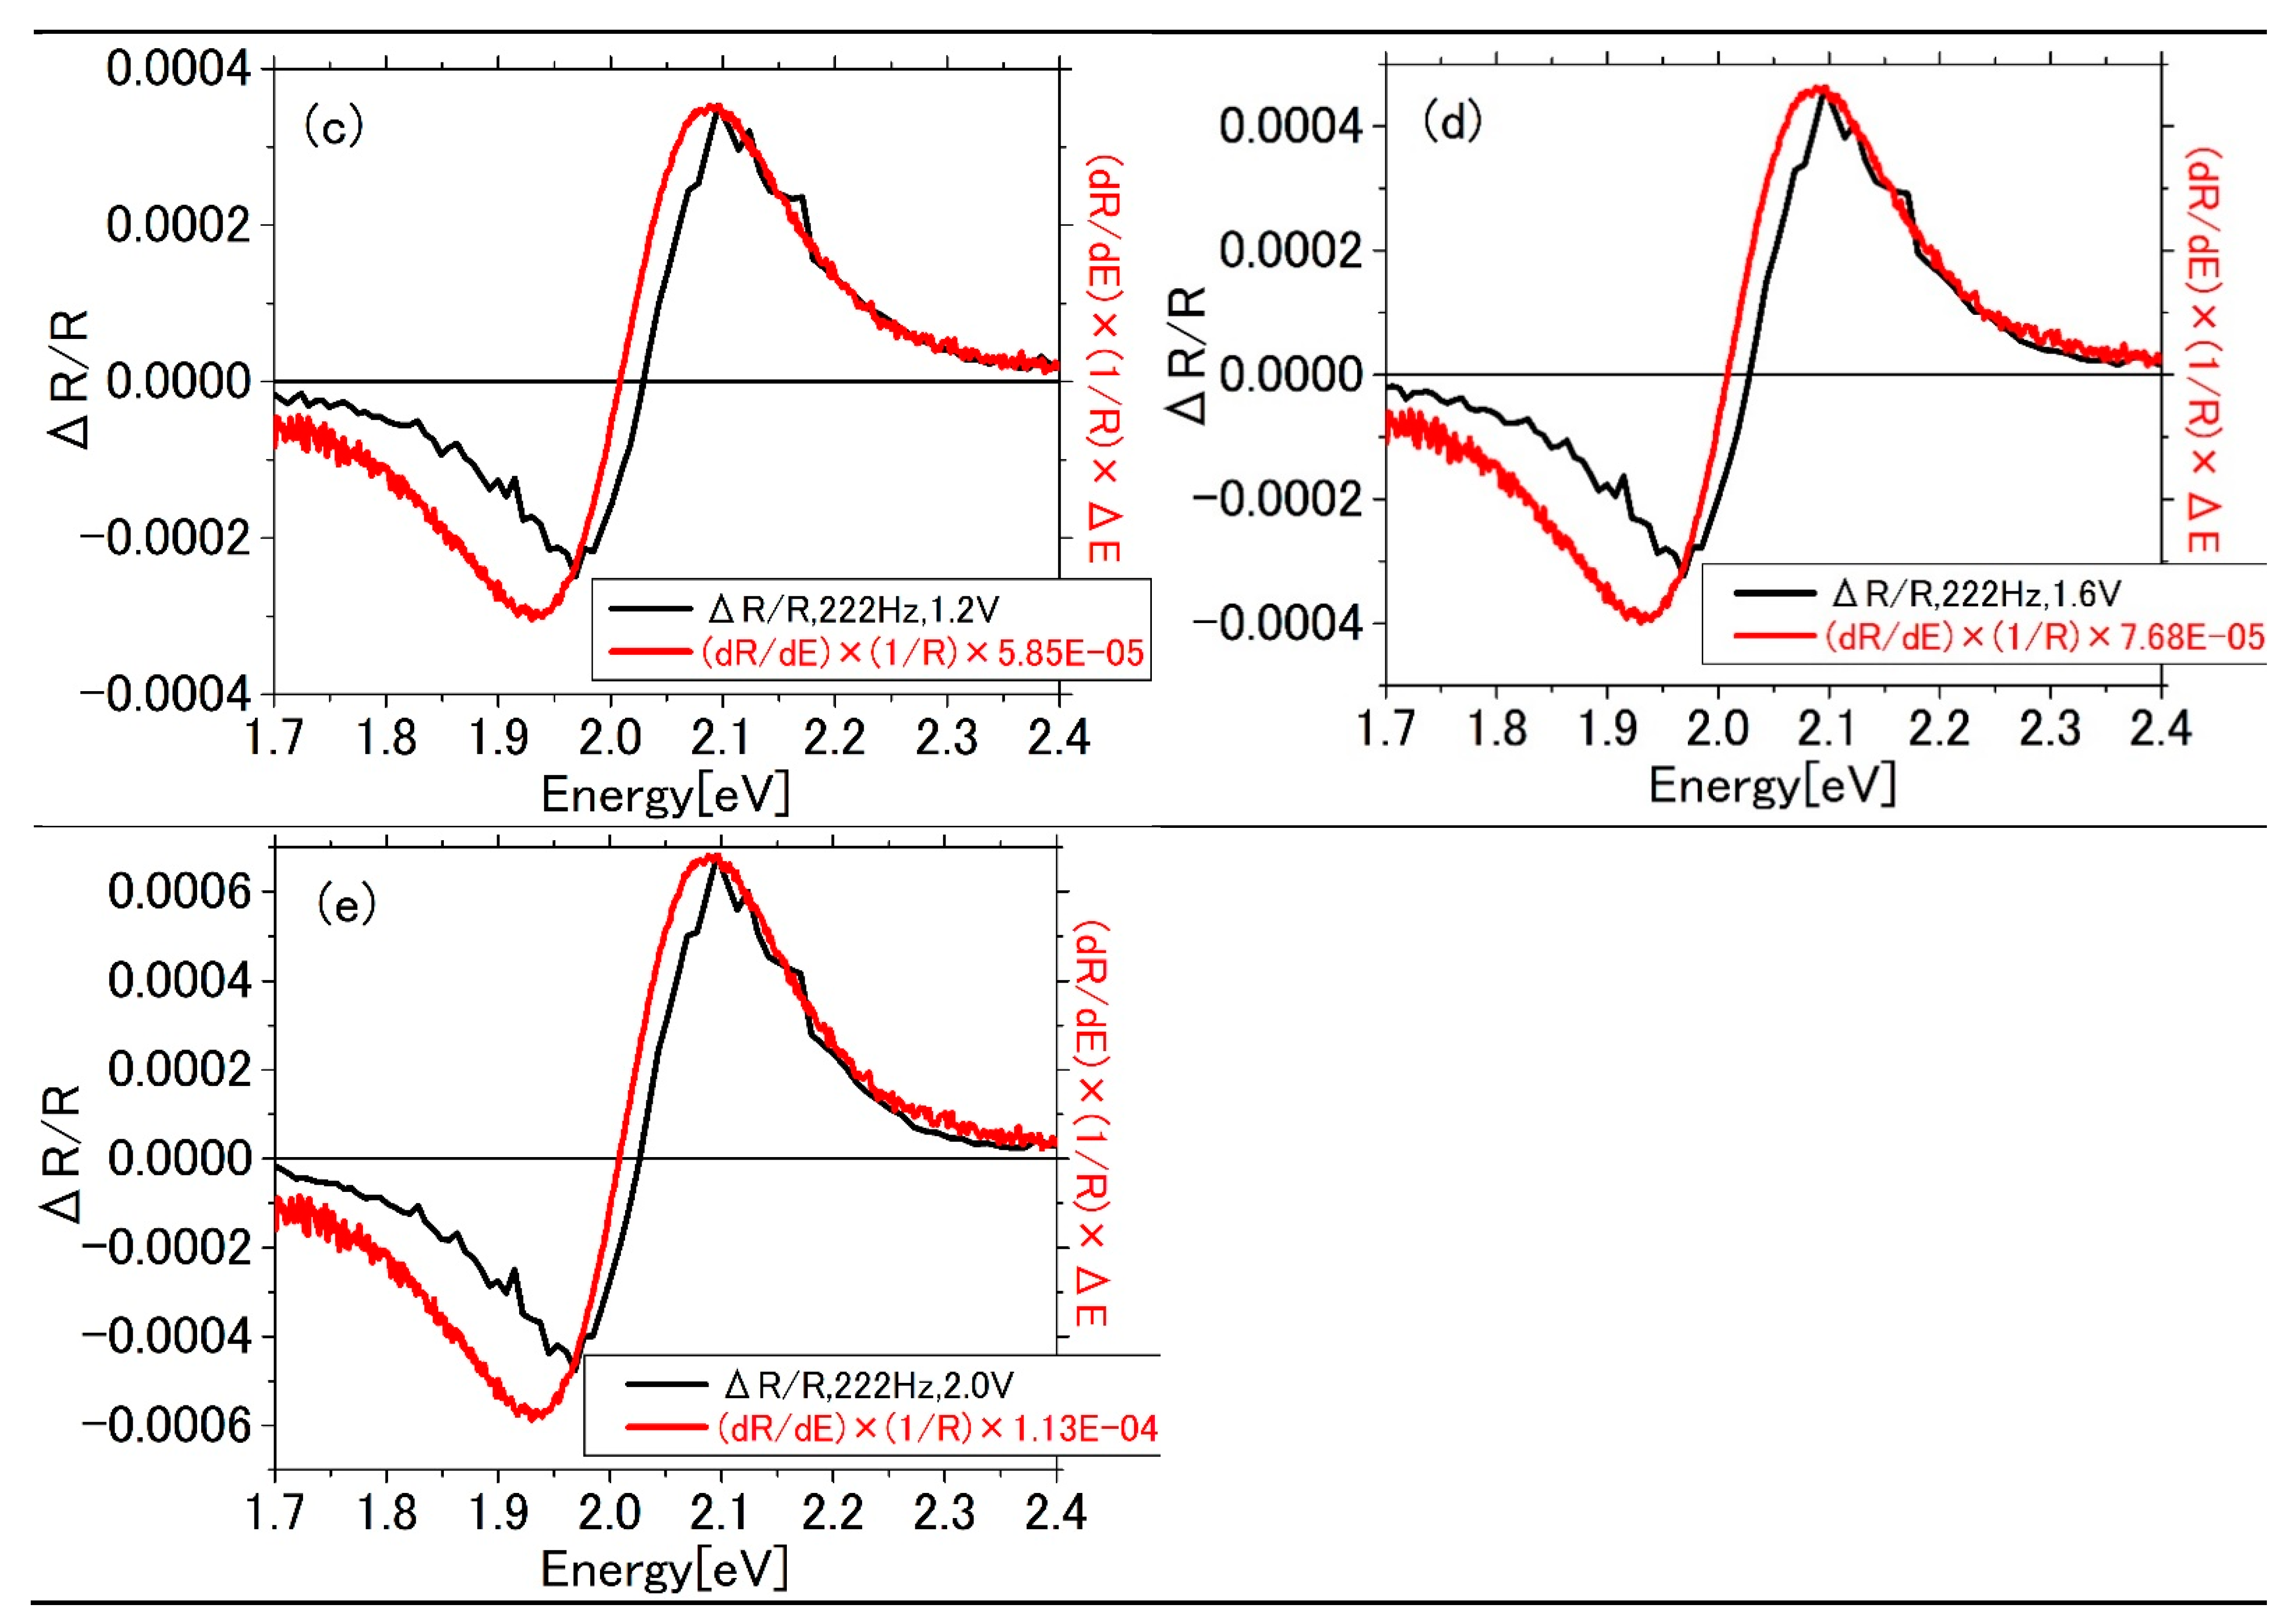
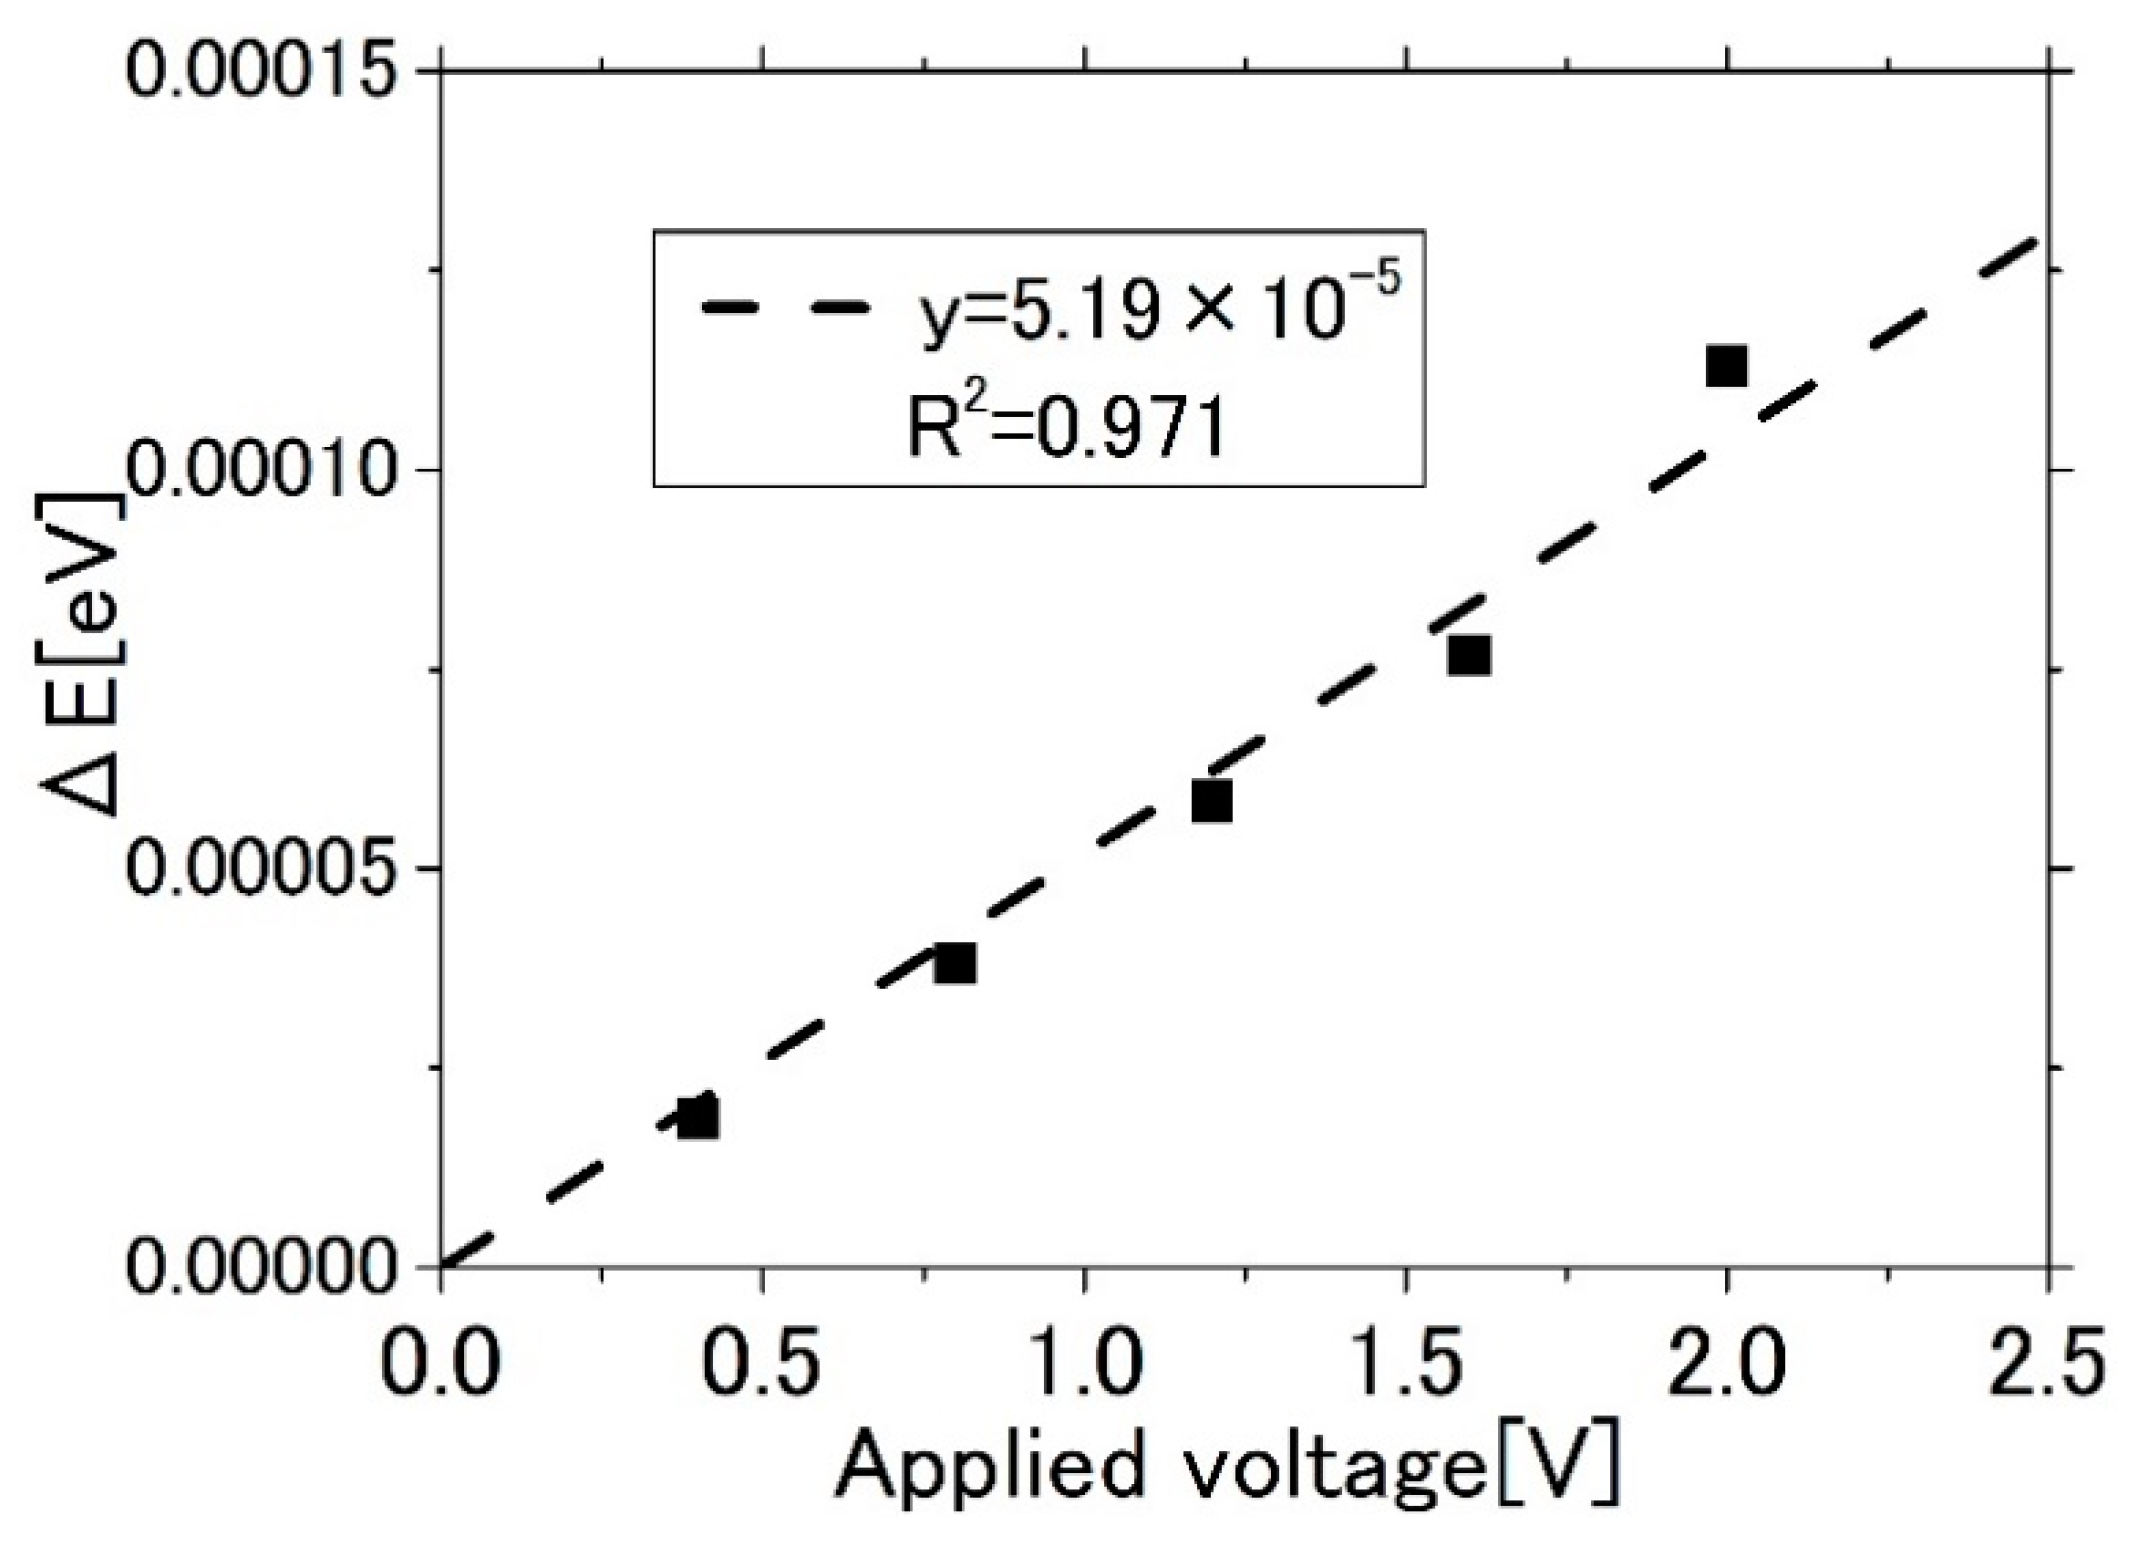
3.2. Evalation of Energy Shift of the Plasmon Resonance

The energy shift Δ E of the SPP resonance peak is determined by fitting the first derivative of R p R s measured with the cooled spectrometric CCD to Δ R p R s measured with the multi lock-in amplifier (MLA) as follows:
d d E ( R p R s ) Δ E = ( d R p d E ) Δ E R s = Δ R p R s   ( CCD )  
Δ X   or   Δ Y R s = I Δ R p I R s = Δ R p R s   ( MLA )
Here R s , used as the normalization factor, is assumed to be constant and I is the light intensity. The CCD data were used for differentiation because the pixel resolution is much higher (2048 against 128 ch for MLA). The first derivative of R p normalized by R s is shown in Figure 4.
The results of the fitting are summarized in Figure 5 using the MLA data at 222 Hz. The fit is fairly good between ( d R p d E ) Δ E R s and Δ R p R s , except that there is a slight deviation in the zero crossing, but the reason why is unknown.
Δ E thus determined as a function of the applied voltage is plotted in Figure 6, clearly demonstrating that Δ E is proportional to the voltage, i.e., the observed spectral shift is due to the Pockels effect.

3.3. Evaluation of the Refractive Index Change in the Interfacial Water

The Δ n corresponding to the energy shift was evaluated as follows. We adopted the value 1.13 × 10 4 eV for the energy shift at 222 Hz and 2.0 V.
Firstly, we used the simple analytical formula for the SPP dispersion of Ag, which uses the known bulk plasma frequency ω p = 3.82 eV ( ω p = n e ε b e 2 m , screened by the bound electrons) of Ag and the background dielectric constant ε b of Ag determined from fitting to the SPP resonance energy observed in the present experiment.
The SPP dispersion neglecting dissipation with the wavenumber k = k x parallel to the interface is analytically expressed as follows:
k x = ω c ε 1 ε 2 ε 1 + ε 2
and
k x = ω c n g sin θ
with ε 1   and   ε 2 being the dielectric constants of dielectric and metal, respectively, the incident angle θ in the quartz prism, and the refractive index n g and n w of quartz and water. Solving Equations (3) and (4) with ε 1 = n w 2   and ε 2 = ε b ( 1 ω p 2 ω 2 ) for ω as a function of n w and θ leads to
ω = ω p ε b [ ( n g sin θ ) 2 n w 2 ] ( ε b + n w 2 ) ( n g sin θ ) 2 ε b n w 2
Table 1 shows the results of fitting of the experimentally observed SPP resonance wavelength at the respective incidence angles θ in Figure 2b to Equation (5) to determine ε b . The value for ω p was fixed at 3.82 eV. The determined value around 5 for ε b agrees well with the recent study on the dielectric function of Ag [22].
From Equation (6), the relation between energy shift in the SPP resonance and the Δ n of water is expressed by
Δ ω Δ n w = n w ε b 1 2 ( n g sin θ ) 4 [ ( ε b + n w 2 ) ( n g sin θ ) 2 ε b n w 2 ] 3 2 [ ( n g sin θ ) 2 n w 2 ] 1 2 ω p
For the energy shift 1.13 × 10 4 eV at θ = 70.3°, 222 Hz, and 2 V, we deduced Δ n w = 1.08 × 10 4 for ε b = 5.94 .
Secondly, the SPP dispersion previously determined experimentally by Johnson and Christy [23] was employed, and the Δ n was determined by numerical calculation as follows.
In Figure 7, the experimental data are compared with the dispersion relations in Equation (3), obtained from the resonance dip energy as a function of the incidence angle in the reflection spectra calculated by the transfer matrix method [24] using the dielectric constant of Ag in [23] for ε 2 and 1 (air) or 1.332 (water) for ε 1 . It was confirmed that the experimental results agree fairly well with the known SPP dispersion relation.
In order to reliably determine the Pockels coefficient, then, we evaluated Δ n d w with d w being the thickness of the EDL of water where the Pockels effect occurs, as discussed in the following subsections.

3.4. Evaluation of the Pockels Coefficient of the Interfacial Water

The Pockels coefficient r i j defined by [25,26]
Δ n i = n i n w = n w 3 r i j E j / 2  
is related with the first order nonlinear refractive index n i j (defined by Δ n i = n i j E j ) as r i j = 2 Δ n i n w 3 E j = 2 n i j n w 3 . Since mutual conversion is trivial, we use the nonlinear refractive index as the Pockels coefficient r for the time being.
Even if the Δ n is known, there are three additional factors that need to be considered in order to estimate the Pockels coefficient: (i) The fraction of the applied voltage that is distributed to the layer where the Δ n occurs, (ii) the E field in the layer that is determined by the thickness of the layer and the voltage distributed, and (iii) the penetration depth of SPP waves into the layer. The layer referred to here is the EDL of water, which is a so-called diffuse layer and therefore has E field and refractive index gradients, but for simplicity, we assume that the E field is uniformly applied within the layer over its effective thickness and a uniform Δ n occurs, following the assumption in the previous literature on the evaluation of the Pockels effect in water [3].

3.4.1. Thickness of the Electric Double Layer of Water

The electrolyte concentration could not be increased because it would react with the electrode. Then, as the Debye Hückel length d ( d = 0.304 M 1 2   where   M is the molar concentration of electrolyte) increases with decreasing concentration, thickness d of the EDL (diffuse layer) is increased, resulting in the smaller interfacial E field V / d for the same applied voltage V . Therefore, for the same Pockels coefficient, the Δ n at the interface in direct contact with the electrode is small. In other words, the thicker the interfacial layer (=EDL) is, the smaller the Δ n within the layer becomes. However, it should be noted that this (i.e., d = 0.304 M 1 2 ) is a steady-state value with a direct current (DC) E field applied, while in this experiment with the AC E field applied, the EDL is transiently formed and must be considered thicker. The formation dynamics of the EDL have only recently been addressed in papers [27,28], and it is currently difficult to estimate the effective thickness in this experiment. Therefore, one can safely consider d w to be between 30 nm and 300 nm. In this case, for the same Pockels coefficient, the Δ n of water at the interface directly in contact with the metal depends on the assumed d w . In contrast, when the penetration length δ w of SPP into water is larger than d w , the energy shift of SPP resonance does not sensitively depend on d w as shown below, so that the Pockels coefficient can be determined in a reliable manner.

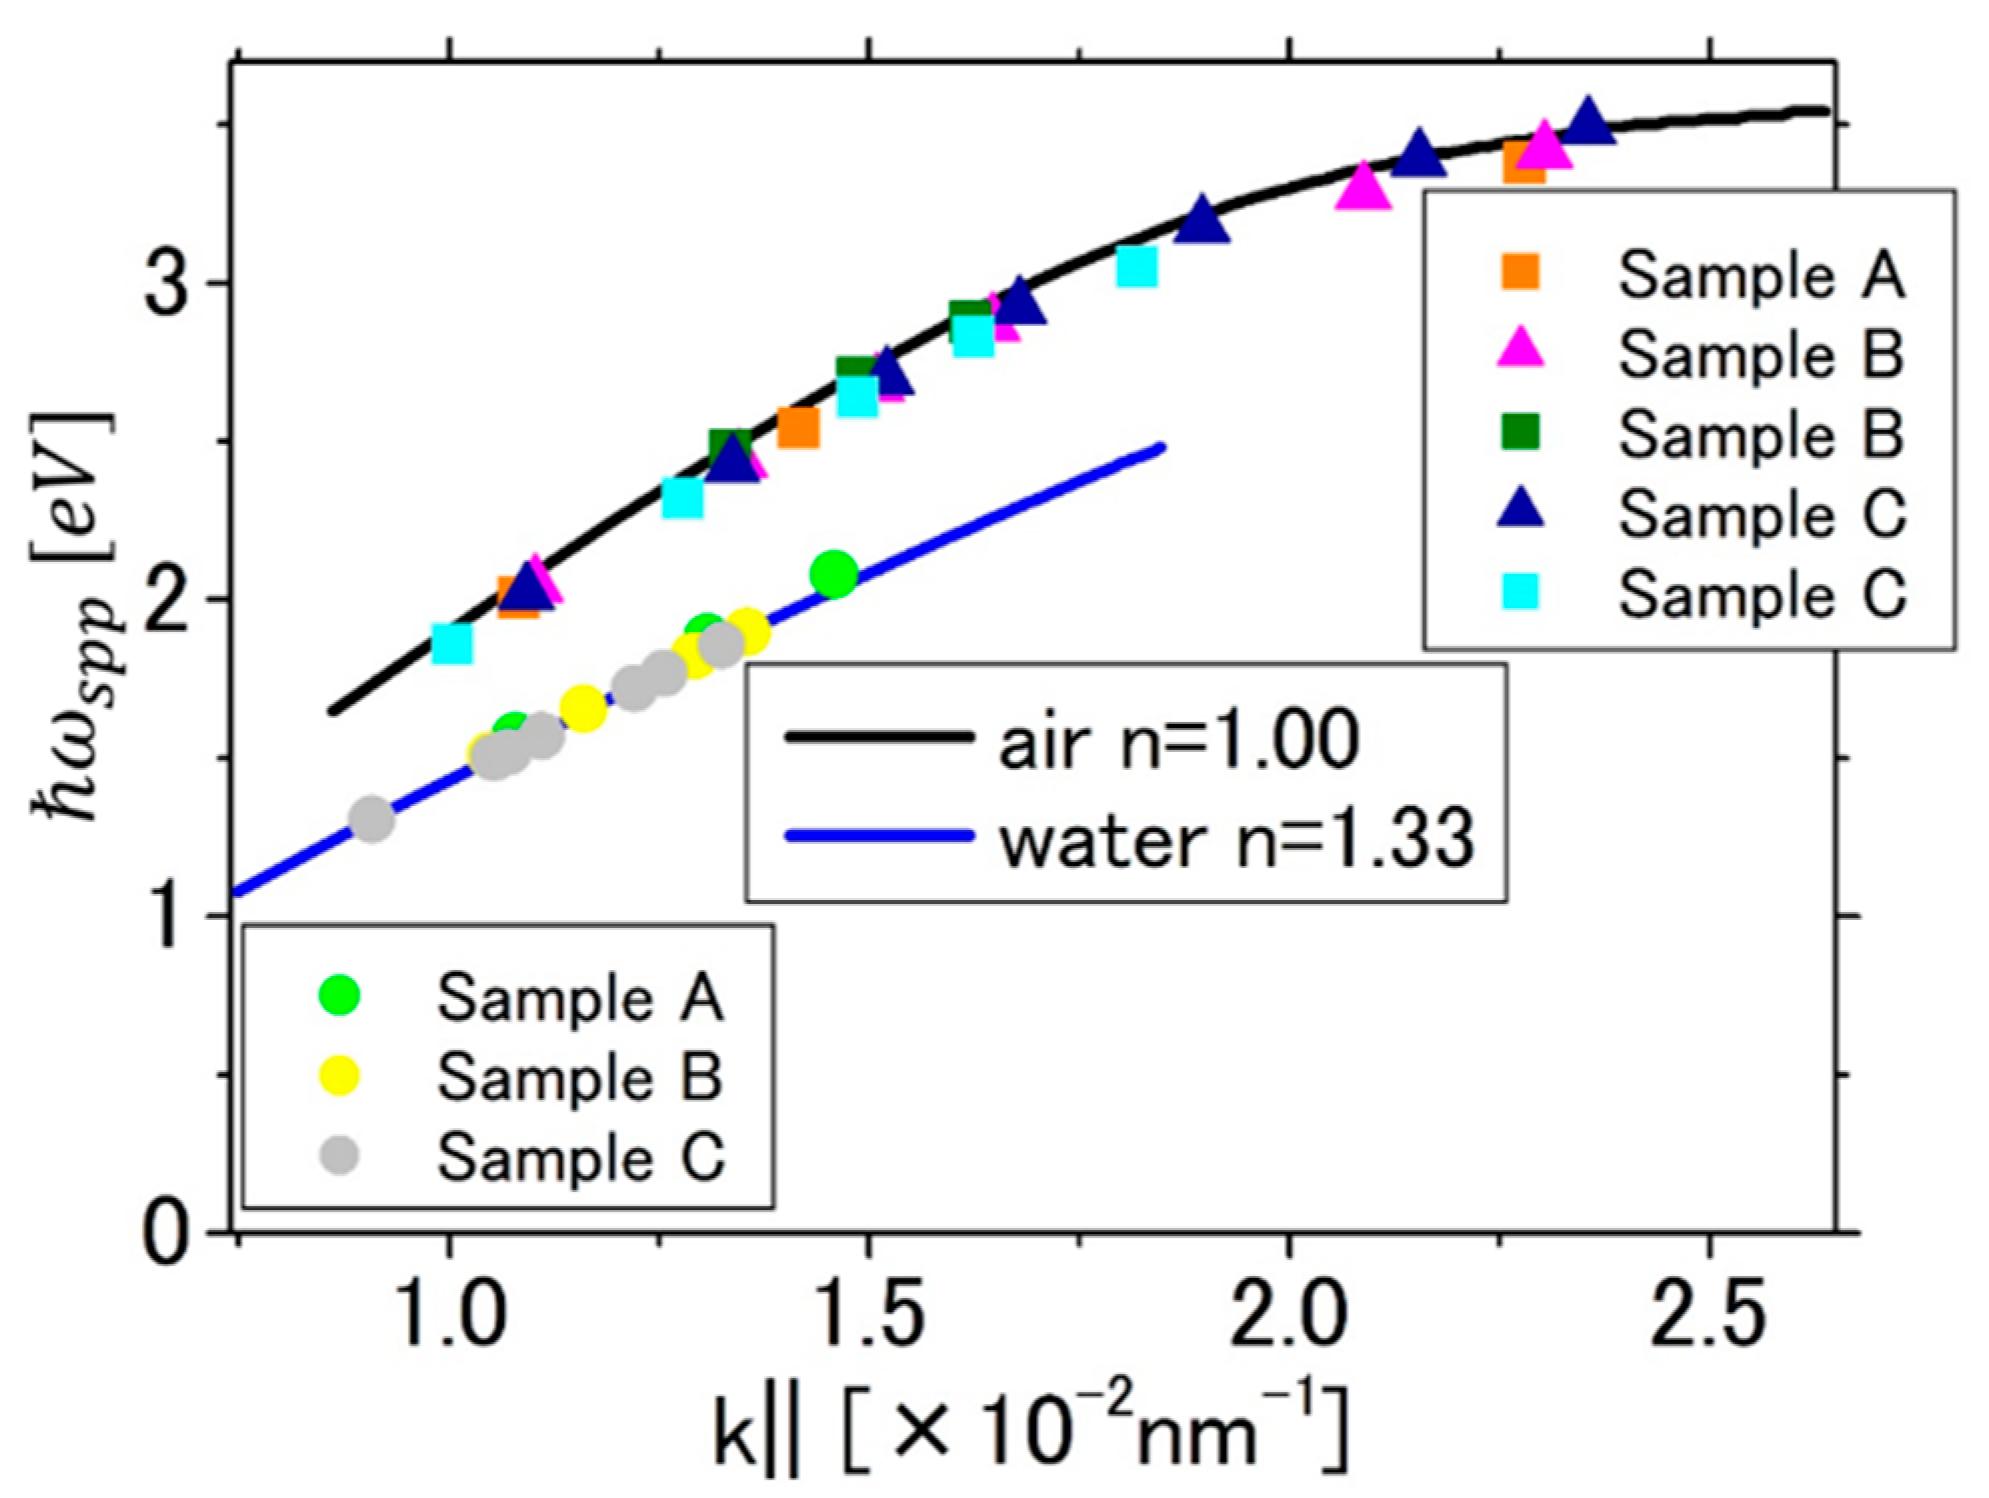
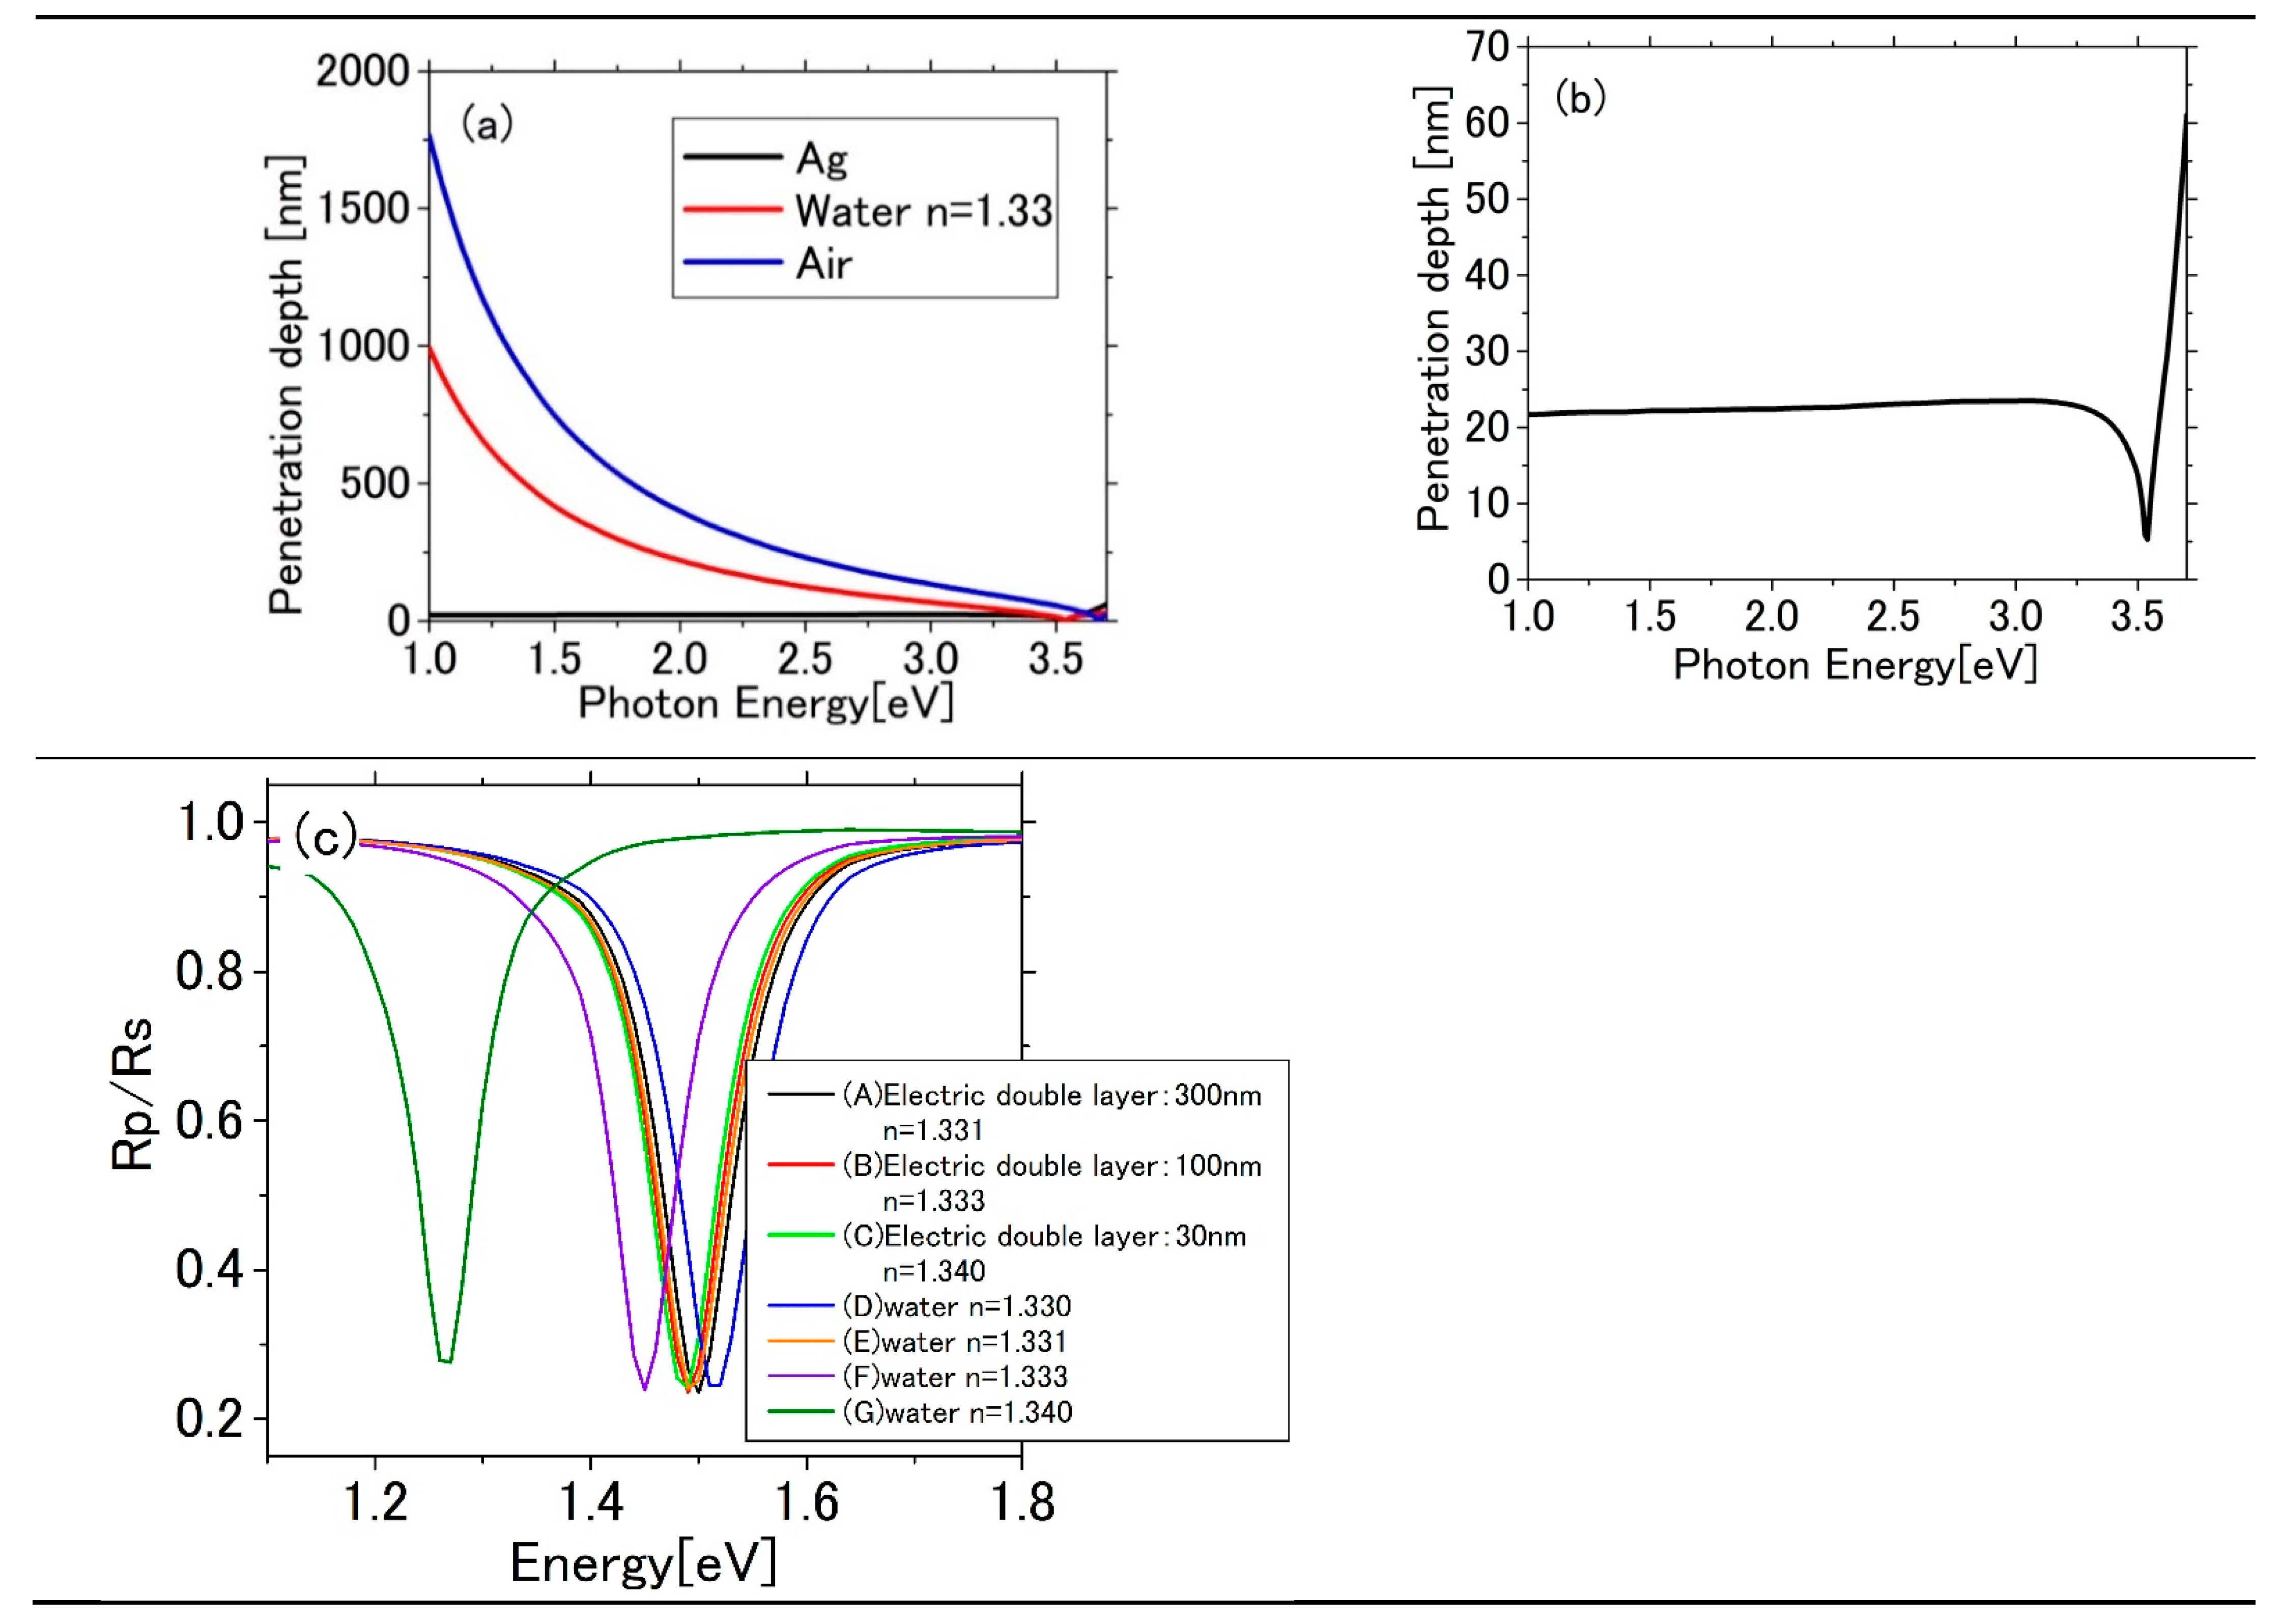
3.4.2. Penetration Depth of Surface Plasmon Polaritons

It has been found that the penetration depth of SPP waves is about δ d λ/2 (about 300 nm on the conditions of Ag, air, and visible light wavelengths) on the dielectric side with λ the wavelength in vacuum of light corresponding to the plasmon resonance frequency, and δ m λ p / 2 π ( λ p is the wavelength in vacuum corresponding to the bulk plasma frequency, 25–30 nm in Ag~the order of the skin depth) on the metal side [29].
If the penetration depth of SPP into the water side δ w < thickness of the EDL d w of water, the Pockels coefficient r i j depends on the estimation of the thickness of d w . This is because (assuming a uniform Δ n in the EDL) the SPP feels a uniform Δ n over the range of penetration length δ w , regardless of the thickness of d w , but the magnitude of the E field in the layer depends on d w . In other words, the estimate of the Pockels coefficient is expressed by
r = Δ n E = Δ n d V ,
which means the thicker d leads to the larger r for the same Δ n . On the other hand, when δ w > d w , as in the present experiment, the phase change ( spectral shift) of the transmitted light is proportional to the propagation distance d as follows with k being the wavenumber in vacuum:
Δ T T Δ ϕ = k Δ n d = k r V  
(from Δ n = r E   and   V = E d ), thus
r = Δ n E = k Δ n d k E d = Δ ϕ k V  
where r estimated from the shift of the SPP resonance ( Δ R R ) is independent of the assumed thickness of d w , as is the case in [3]. In fact, this can be confirmed by calculation on the condition that:
In a four-layered structure of (semi-infinite) quartz, Ag thin film, EDL of water, and bulk water (semi-infinite), the thickness d w of the EDL of water, the refractive index n within the layer ( Δ n , change from the refractive index of 1.33 for bulk water around 600 nm) are assumed to be
A.
300 nm, 1.331 (0.001),
B.
100 nm, 1.333 (0.003), and
C.
30 nm, 1.34 (0.01),
respectively. Note that Δ n d w = 0.3   nm for all the cases.
The SPP resonance spectrum calculated by the transfer matrix method under the same Kretschmann configuration as in the experiment with an incident angle of 70.3° is shown in Figure 8. The dielectric permittivity of Ag is from the JC’s paper [23], and the penetration depths of SPPs using JC’s permittivity into the dielectric and metal sides are also calculated. The results show that the energy shift is approximately proportional to Δ n when a uniform Δ n is assumed as in (E) 1.331, (F) 1.333, and (G) 1.34 for bulk water, whereas when the Δ n is limited to within the EDL under the above conditions, δ w ( = 206   nm ) d w is approximately satisfied and the spectral shift is determined by Δ n d w to be almost the same. It is reasonable that the shift is larger when the Δ n is concentrated at the interface even for the same Pockels coefficient, reflecting the fact that the amplitude of SPP is larger near the interface in the range of penetration depth.
The experimental Δ n d w is evaluated as Δ n d w =   0.00135   ±   0.000133 nm. This is derived from 0.3   nm   ( Δ n d w ) multiplied by the ratio of the experimentally observed energy shift (70.3°,2 V,222 Hz) against the averaged energy shift of the calculated SPP resonance of (A), (B), and (C), which agree closely with each other ((E) also agrees), from that with no refractive index change (D) (Table 2).

3.4.3. Magnitude and Phase of Voltage Distributed in the Electric Double Layer of Water

In addition, information on the voltage falling on the EDL of water at the Ag electrode interface is needed to evaluate the Pockels coefficient. Therefore, complex impedance measurements were performed using an impedance/gain-phase analyzer (Model 1260, Solatron, Victorville, CA, USA) and a potentiostat/galvanostat (Model 1287, Solatron). The results for the same solution and electrode configuration (but Au was used instead of Ag because it was more robust) as in the E field modulation experiments are shown as a Cole–Cole plot in Figure 9a, where the circled data point in the graph corresponds to a frequency of 222 Hz. The fitting curve for the graph was calculated using the equivalent circuit shown in Figure 9b. Here, the contribution from the electrode surface is taken as the constant phase element (CPE) [30]. At a frequency of 222 Hz, the voltage distribution ratio to the EDL is 0.22, so the corresponding voltage drop is 0.44 V for the applied voltage of 2 V. For simplicity, the distribution ratio to the Pt- and Ag-electrode interfaces is assumed to be equal, which is 0.22 V. From the above, the Pockels coefficient r 33 of the interfacial water on Ag can be evaluated as follows:
n 33 ( r 33 ) = Δ n E = Δ n d w V = 0.00135 ± 0.000133 0.22 = 0.0061 ± 0.0006   nm / V = 6.1 ± 0.6   pm / V
Δ n = n 3 n w = n w 3 r 33 E 3 / 2
r 33 = 2 Δ n n w 3 E 3 = 2 1.33 3 Δ n E = 5.2   pm / V
where the subscript 33 indicates that the photoelectric field is a p-polarized evanescent wave parallel to the applied E field normal to the interface. From the following discussion about the sign of the coefficient and reliability of the impedance measurement, we conclude:
| r 33 | = 5 ± 1   pm / V .
Let us consider the phase of the lock-in signal. Figure 10 shows the frequency dependence of the X and Y signals of the experiment. From the fitted impedance Z ,
Z = R s + 1 1 R p + ( j ω ) p T ,  
the distribution ratio r E D L of the voltage to the EDL of water is expressed by
r E D L = ( 1 + R s R p + R s T ω p cos π 2 p ) j ( R s T ω p sin π 2 p ) ( 1 + R s R p + R s T ω p cos π 2 p ) 2 + ( R s T ω p sin π 2 p ) 2 = X i Y X 2 + Y 2 .
The real and imaginary parts are considered to be reflected in the X and Y of the lock-in signal. The negative sign of the imaginary part indicates that the voltage distribution to the interfacial layer is delayed due to the time required to charge the EDL capacitance, i.e., due to the formation of the EDL, and this is expressed as a phase delay. From Equation (12), 0.14:−0.17 is the ratio of the real and imaginary parts of Z at 222 Hz, which is inconsistent with about the 2:5 signal amplitude ratio for X : Y of the lock-in amplifier in the raw experimental data in Figure 3a,b. What is more puzzling in the electromodulation experiment is that Y becomes more dominant at lower frequencies, and that X and Y are not sign-reversed, but are of the same sign, being inconsistent with the impedance measurement where the r E D L in Equation (12) indicates that X is dominant at low frequencies and | Y | increases with frequency, and the Y signal should be inverted with respect to X . In fact, in the Pockels effect of interfacial water on transparent electrode ITO and metal electrode Pt, Y is inverted (delayed) with respect to X at frequencies of this range, as shown in Figure 11, being consistent with the impedance measurement. Note that the results in Figure 11b are the same in mechanism as the present signal in that the resonance reflectance dip is generated by coherent perfect absorption [20,21].
Although it is difficult to find a reason, if the phase of r E D L is advanced by about π 2 , as shown in Figure 10, we can fairly well reproduce the behavior observed in the experiment, where Y is dominant at lower frequencies and X and Y have the same sign. Alternatively, if the phase is delayed by about π 2 , the behavior can also be explained as X and Y , which are 180° reversed. In the former case, the resonance dip is red-shifted, i.e., Δ n is positive (with applied voltage positive; r i j is negative from the formula Δ n = n i n w = n w 3 r i j E j / 2 ). On the other hand, in the latter case, the opposite is true.
Presently, the mechanism of this additional phase change with respect to the phase of the distributed voltage is not obvious. Here, we just list three possible reasons for the additional phase.
  • It may be a unique effect of the plasmon. However, to the best of our knowledge, there have been no experimental and theoretical reports about the additional phase of the plasmon in response to the dynamical refractive index change. It is unlikely that the plasmon does not instantaneously respond to the refractive index change at the interfacial dielectric around this low frequency range.
  • The Δ n of the interfacial water on Ag surface rises with the additional phase (nearly ± π 2 ) in response to the electric field falling in the EDL. As shown in Figure 11, however, as long as the surface on ITO and Pt electrodes are concerned, the Pockels effect of interfacial water nearly instantaneously responds to the field around this low frequency range.
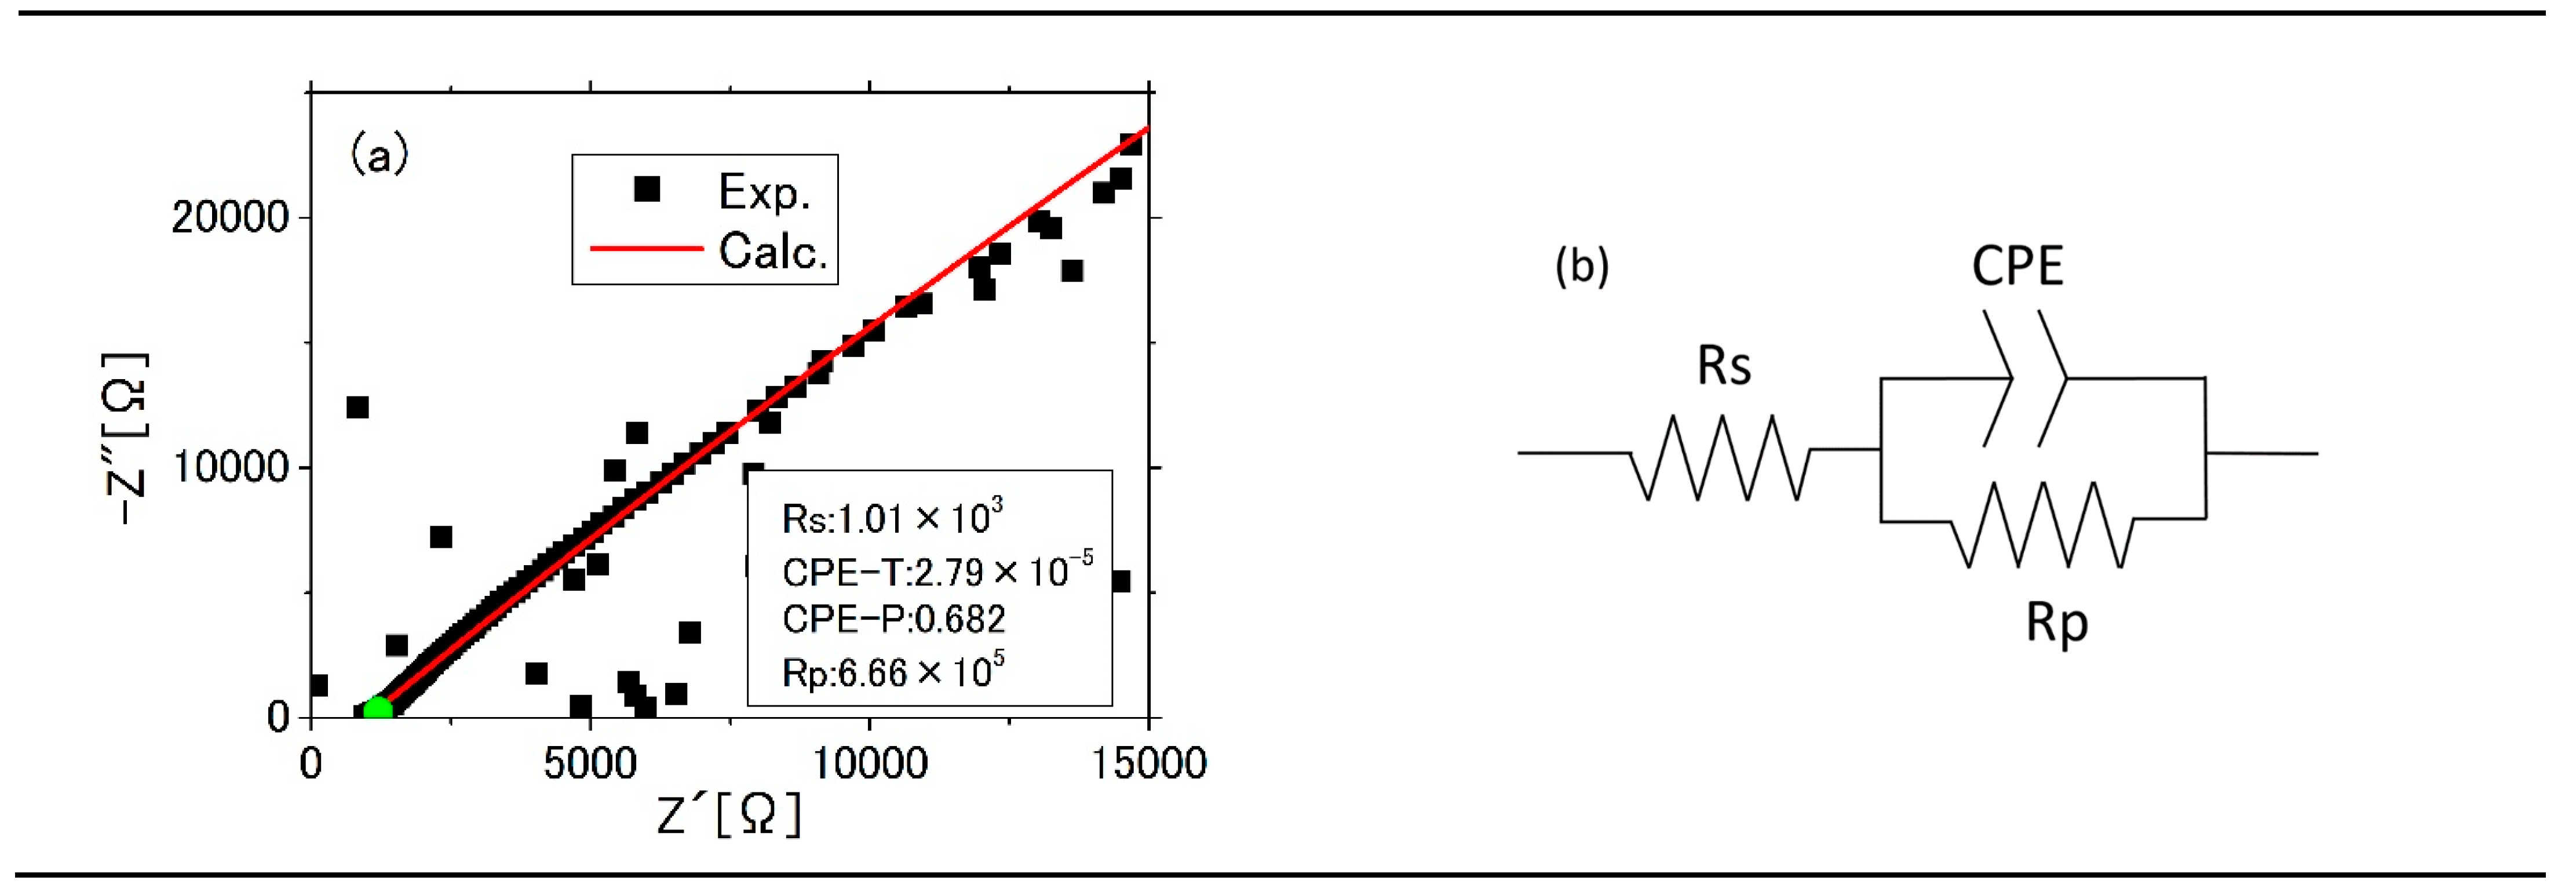
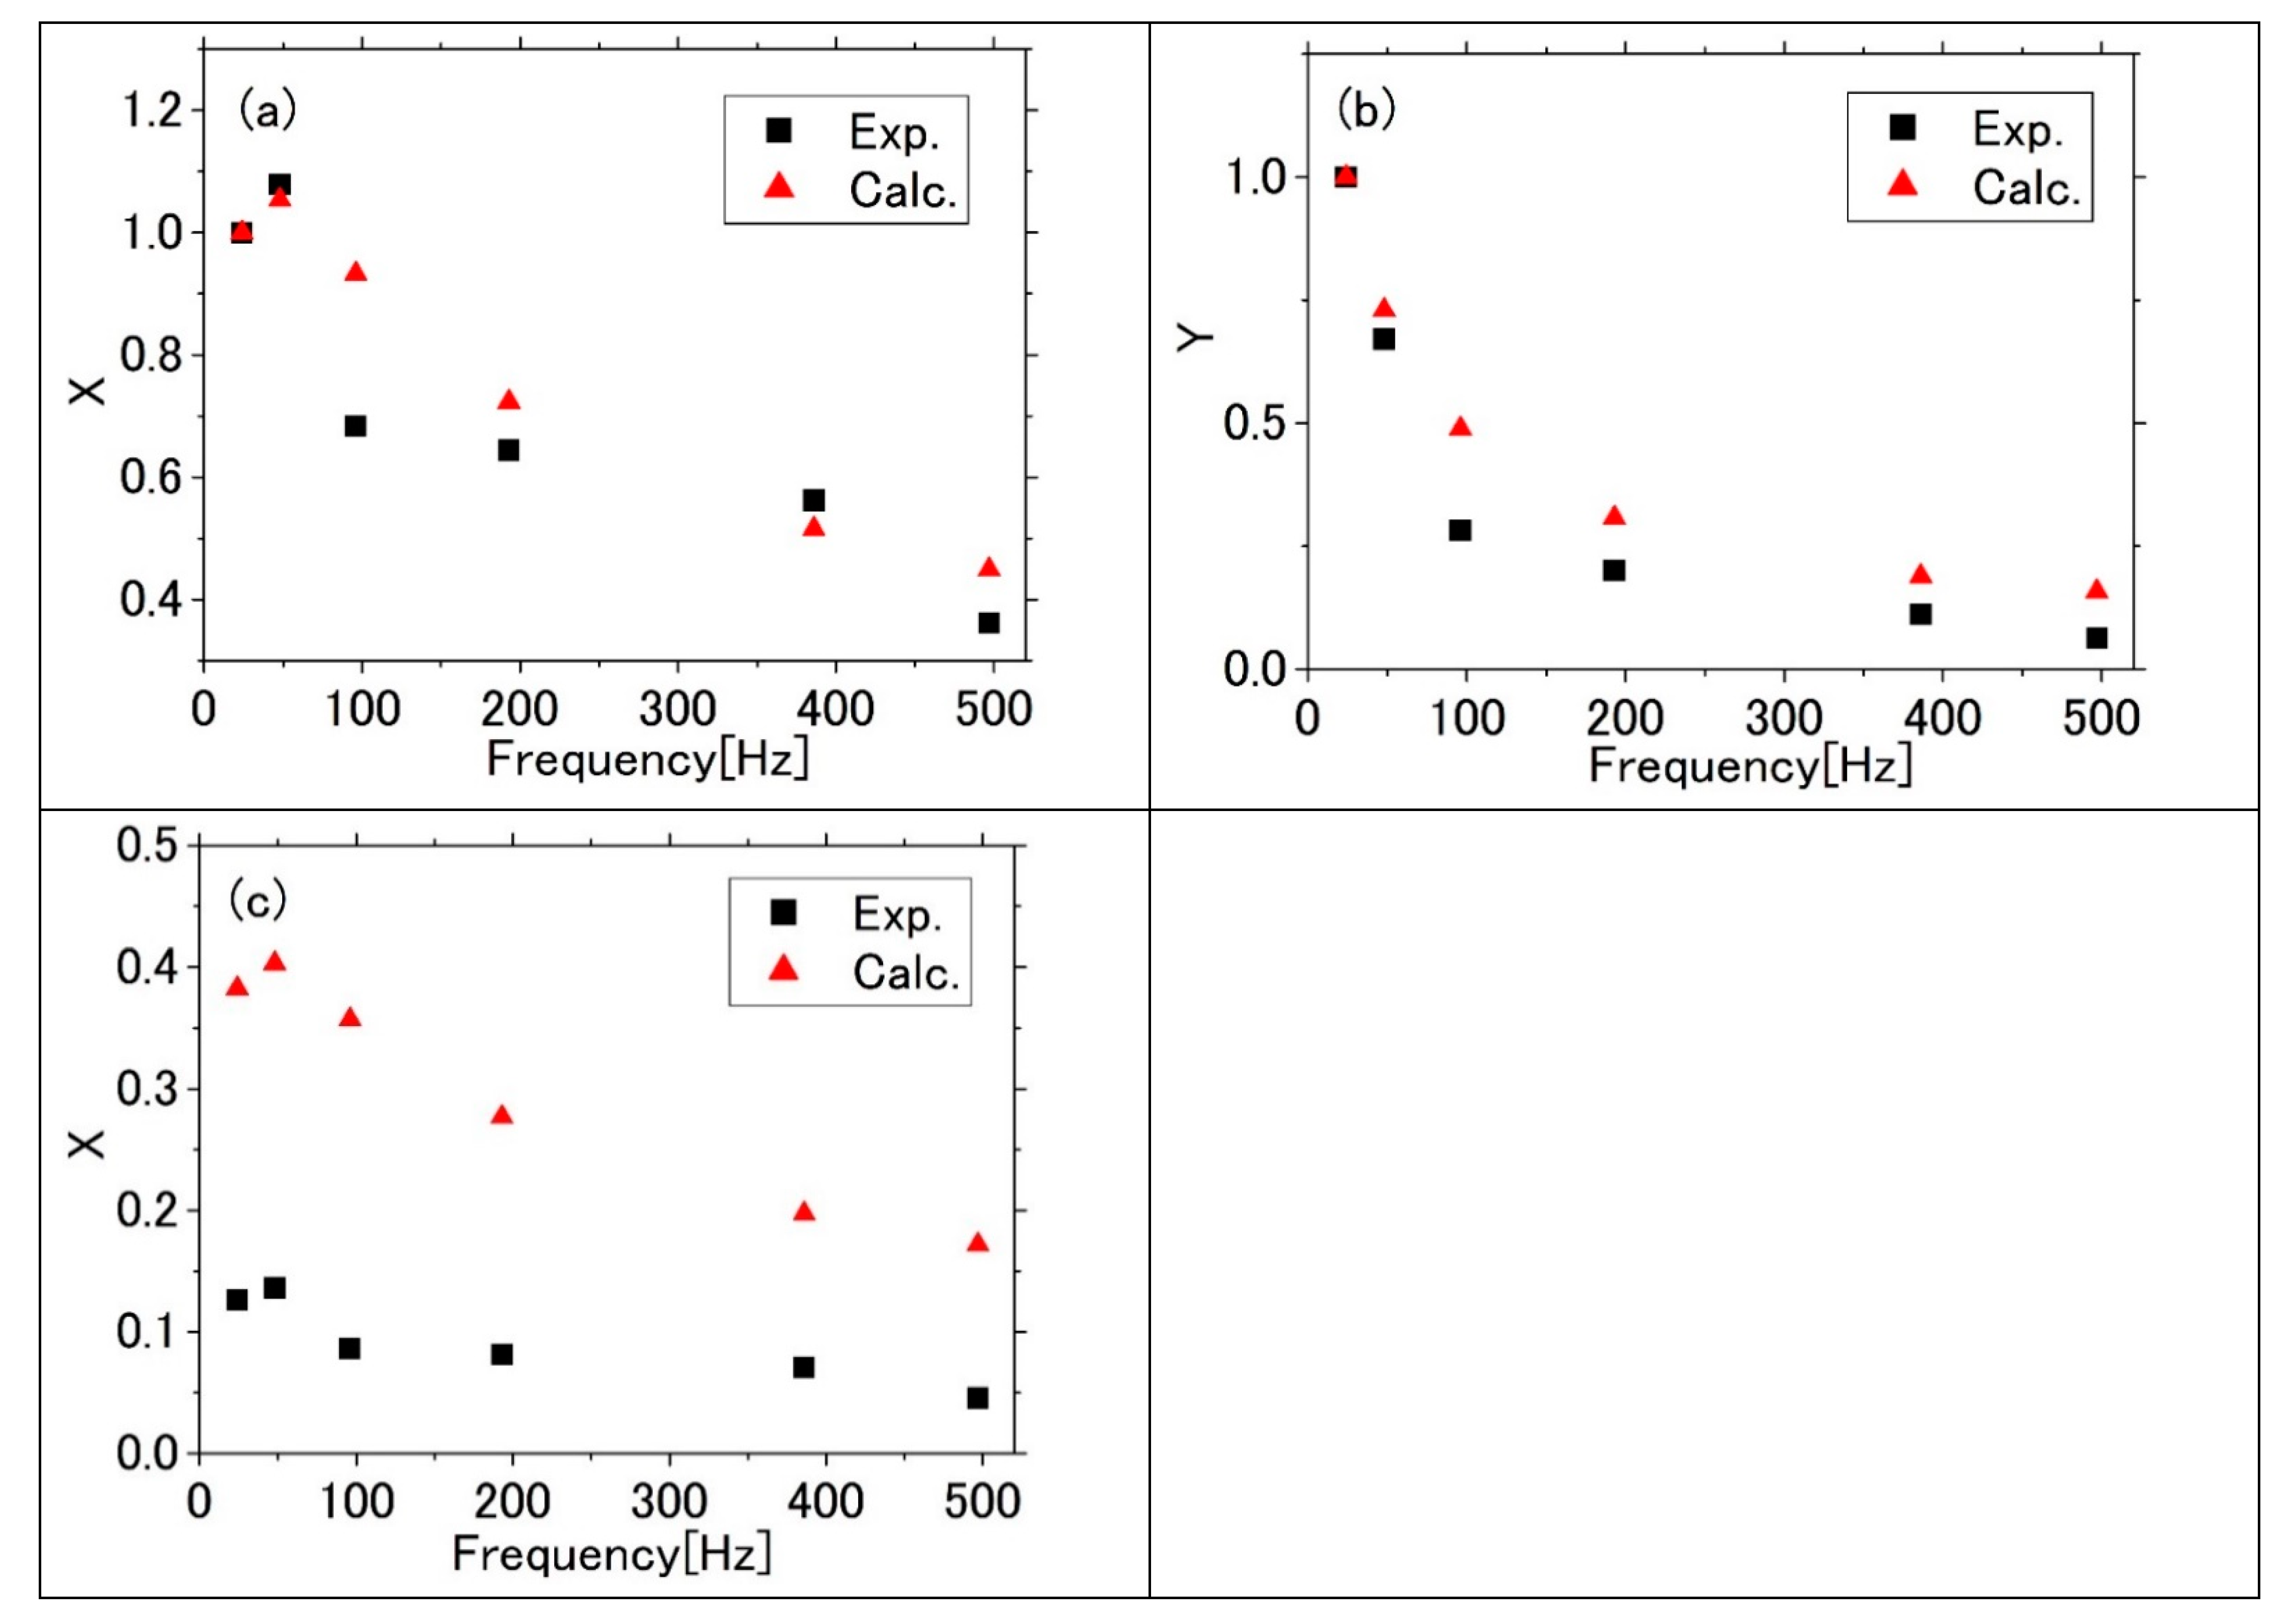
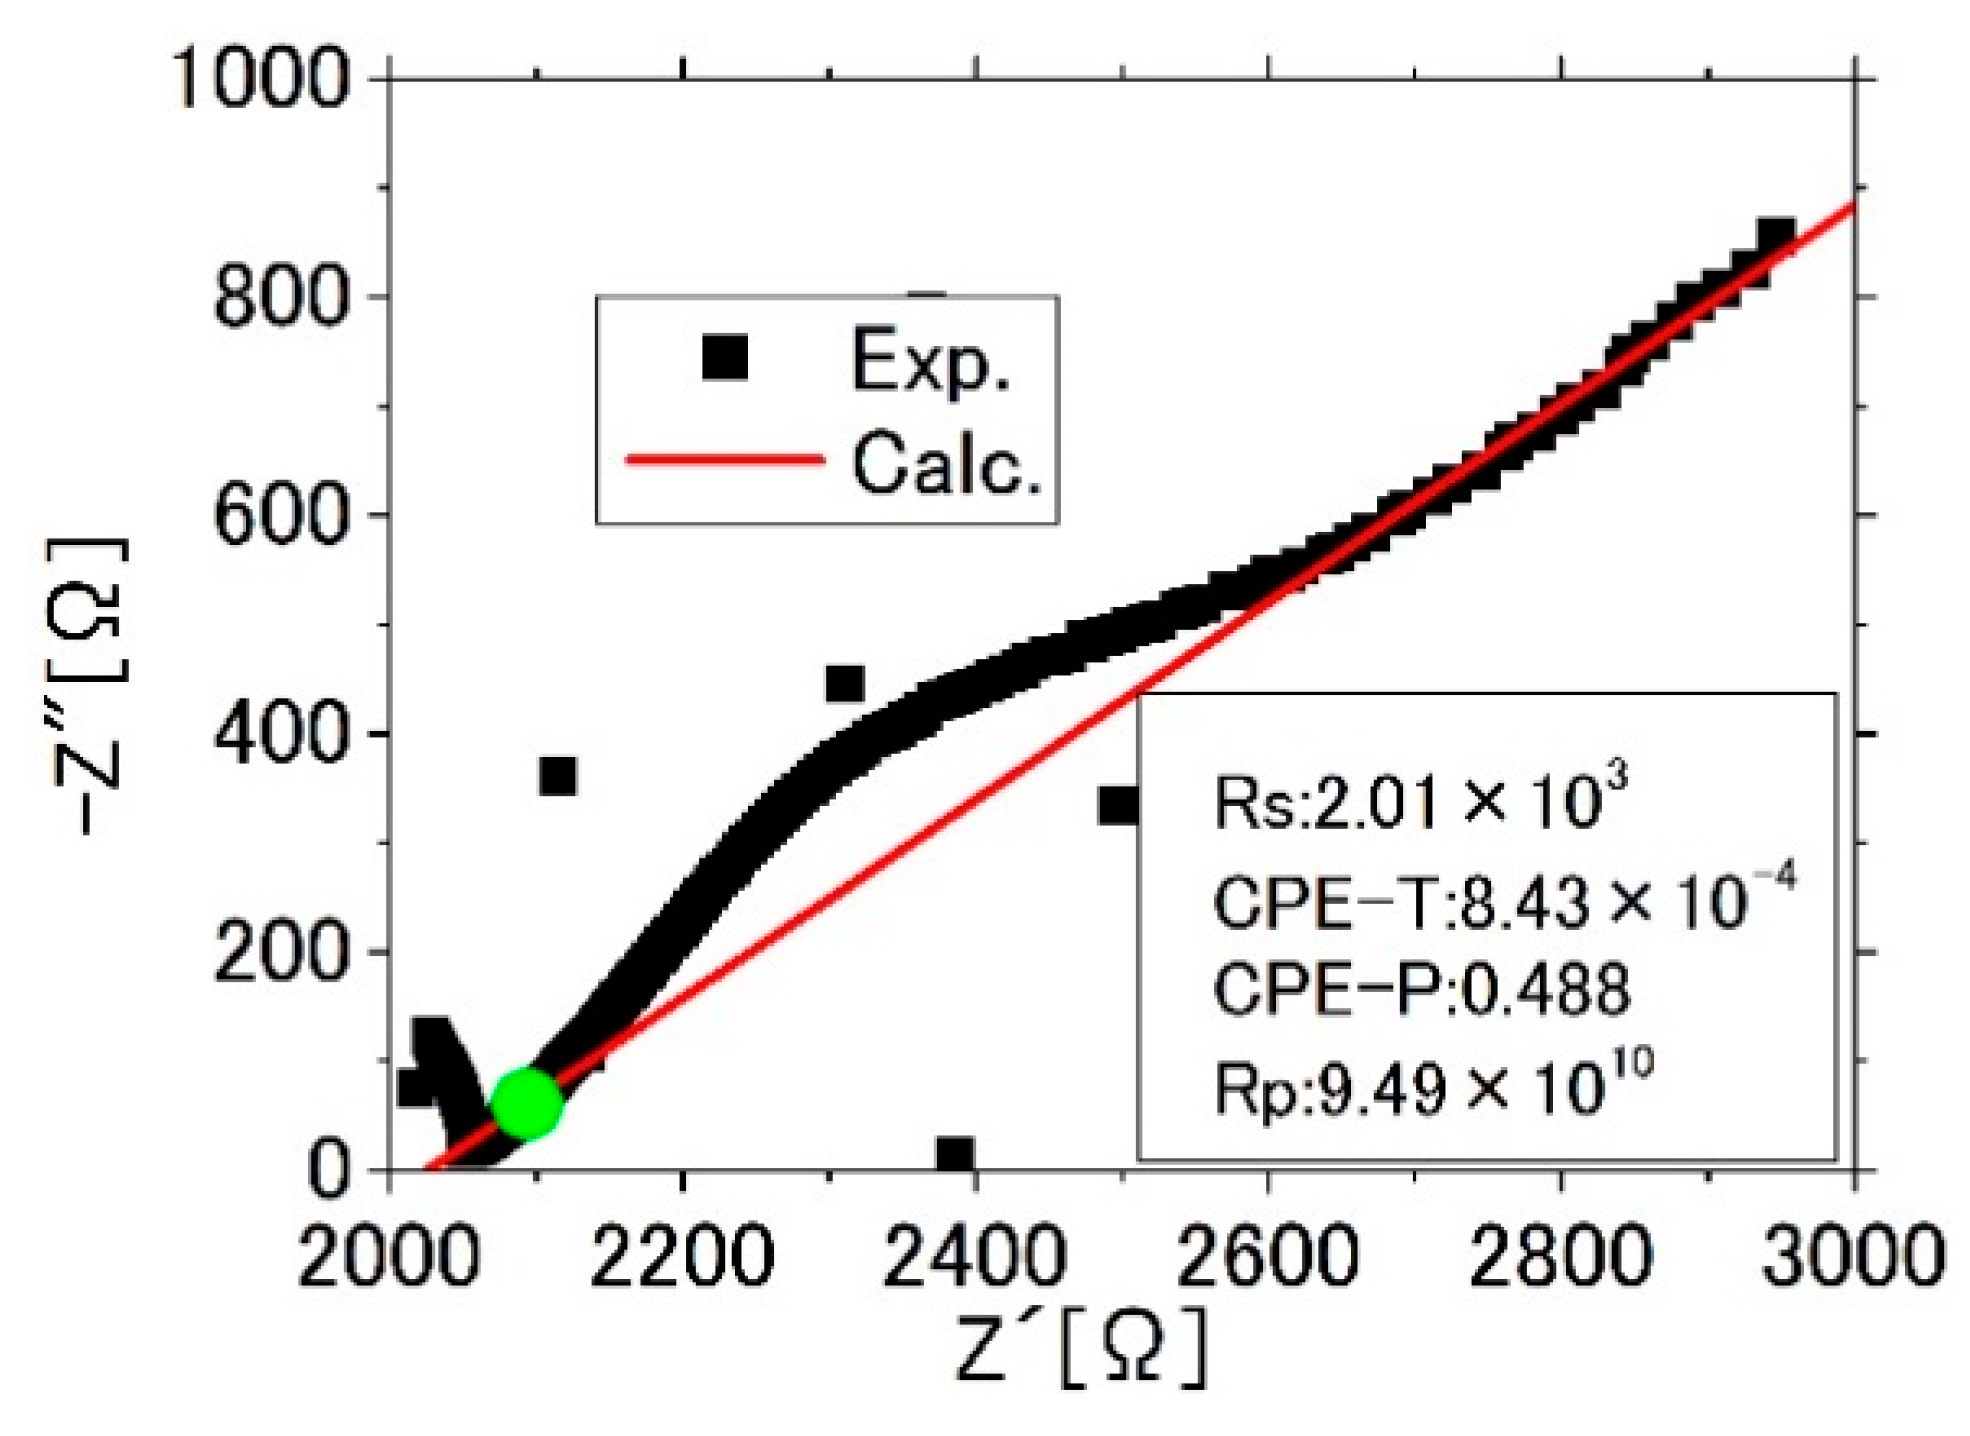
  • The equivalent circuit was not correctly determined due to the imperfect impedance measurement. As shown in Figure 10, the present parameters reproduce the overall decaying behavior of the experimental signal magnitude with frequency, but the phase is inconsistent and there is discrepancy in the ratio of X / Y even after adjusted by ± π 2 phase. We used an Au electrode for the impedance measurement, because with the Ag electrode, the Cole–Cole plot showed anomalous behavior for lower frequencies, and it is difficult to be fit by the usual equivalent circuit. One of the possible reasons is the effect of the electrode reaction with electrolyte ions. The result for Ag is shown in Figure 12, where the same equivalent circuit is used for fitting. However, even in this case, since all the data points in the Cole–Cole plot reside in the Re   Z > 0 and Im Z < 0 region, similarly to Figure 9, it should show such behavior that X dominates for the low frequencies and Y grows with increasing frequency, as usual.
Since it is difficult to solve the phase puzzle, therefore, we cannot determine the sign of the Pockels coefficient of interfacial water on Ag surface. However, the following can be argued modestly about the sign. It is reported that the transmission spectra (interference fringes) are blue-shifted and Δ n is negative ( r 13 , r 33 > 0 ) for the interfacial water on the transparent oxide electrode [3,21], while the transmission spectrum is characterized by the red-shift on the Pt electrode [8], and Δ n is most likely to be positive ( r 13 < 0 ). From this, since Ag is a noble metal as well as Pt, and it is more likely that the Δ n of the interfacial water on the Ag electrode is positive Δ n > 0   ( Δ n < 0 ) for the positive (negative) applied voltage, so that the Pockels coefficient is negative ( r 33 < 0 ).

3.5. Discussion

The fact that the Pockels coefficient of interfacial water on the Ag electrode (5 pm/V) is nearly two orders of magnitude smaller than that on the ITO transparent electrode (200 pm/V) is consistent with the previous report of the Pockels coefficient on ITO and Pt electrodes [8]. Pt and Ag are common in that both are noble metals and are robust against oxidation. These results are consistent with the hypothesis that hydrogen-bonding interactions between solvent molecules and electrode surfaces are effective in the process [8] as well as the dependence on the electrode material, where the Pockels coefficient of GaN electrode is about 60 pm/V [6] comparable with ITO, and the dependence on the solvent type, where methanol and ethanol, which are protonic solvents, have Pockels coefficients comparable to water on the ITO surface [7]. For further verification of the hypothesis, it would be interesting to study the Pockels coefficient at the interface of base metals, on which an oxide film is formed. If the sign of the Pockels coefficient of interfacial water on Ag or Pt is opposite to that on ITO or GaN, it will be essentially connected to the mechanism.

4. Conclusions

Taking advantage of the sensitivity of the SPP resonance of metals to the refractive index of the dielectric layer in contact with the metal, we observed a shift in the resonance energy due to the Pockels effect of the water (in the EDL) on the Ag electrode surface when an E field was applied normally to the electrode surface. When an AC voltage was applied between the Ag film and the Pt electrode in the attenuated total reflection (Kretschmann) geometry, the SPP resonance shifted spectrally in synchronization with the frequency of the AC voltage, and the magnitude of the energy shift was proportional to the voltage. This indicates that the signal is due to the Pockels effect. To evaluate the Pockels coefficient, we calculated the SPP resonance spectrum of the Ag film covered with a thin electric double layer of thickness d w and the Δ n from bulk water, using the known complex dielectric constant of Ag. As long as the penetration depth of the SPP into the water layer, δ w , is larger than the thickness of the EDL of water, d w , we showed that the spectral shift is proportional to the optical path length change Δ n d w , and evaluated Δ n d w which reproduces the spectral shift of the experiment. Therefore, although the effective thickness of the EDL under AC E field is not precisely known, the Pockels coefficient was determined to be about 5 pm/V from 2 Δ n d w n w 3 V using the voltage V distributed in the EDL determined through AC impedance measurement.

Author Contributions

Conceptualization, E.T., methodology, E.T., Y.N., and S.S., software, R.W., validation, Y.N., K.S., and E.T., formal analysis, Y.N., A.O., and R.W., investigation, Y.N. and S.S., writing—original draft preparation, E.T. and Y.N., writing—review and editing, E.T., T.K., and K.S., visualization, Y.N., supervision, E.T., project administration, E.T., funding acquisition, E.T. All authors have read and agreed to the published version of the manuscript.

Funding

This research was funded by Grant in Aid for Scientific Research(C) (Grant Number JP15 K05134) and Scientific Research(B) (Grant Number JP20 H02659), Japan Society for the Promotion of Science (JSPS); Murata Science Foundation.

Institutional Review Board Statement

Not applicable.

Informed Consent Statement

Not applicable.

Acknowledgments

The authors acknowledge Kentaro Takagi and So Aizawa for their support in the preparation stage of the experiment.

Conflicts of Interest

The authors declare no conflict of interest.

References

  1. Brown, G.E.; Henrich, V.E.; Casey, W.H.; Clark, D.L.; Eggleston, C.; Felmy, A.; Goodman, D.W.; Gratzel, M.; Maciel, G.; McCarthy, M.I.; et al. Metal oxide surfaces and their interactions with aqueous solutions and microbial organisms. Chem. Rev. 1999, 99, 77–174. [Google Scholar] [CrossRef] [Green Version]
  2. Tokunaga, E.; Nosaka, Y.; Hirabayashi, M.; Kobayashi, T. Pockels effect of water in the electric double layer at the interface between water and transparent electrode. Surf. Sci. 2007, 601, 735–741. [Google Scholar] [CrossRef]
  3. Nosaka, Y.; Hirabayashi, M.; Kobayashi, T.; Tokunaga, E. Gigantic optical Pockels effect in water within the electric double layer at the electrode-solution interface. Phys. Rev. B 2008, 77. [Google Scholar] [CrossRef] [Green Version]
  4. Alghamdi, A.M.; Ben Omrane, I.; Gala, S.; Ragusa, M.A. A regularity criterion to the 3D Boussinesq equations. Sib. Electron. Math. Rep. 2019, 16, 1795–1804. [Google Scholar] [CrossRef]
  5. Chen, Z.; Han, K.; Zhang, Y.-N. Reflective Fiber Surface Plasmon Resonance Sensor for High-Sensitive Mercury Ion Detection. Appl. Sci. 2019, 9, 1480. [Google Scholar] [CrossRef] [Green Version]
  6. Kanemaru, H.; Nosaka, Y.; Hirako, A.; Ohkawa, K.; Kobayashi, T.; Tokunaga, E. Electrooptic effect of water in electric double layer at interface of GaN electrode. Opt. Rev. 2010, 17, 352–356. [Google Scholar] [CrossRef]
  7. Kanemaru, H.; Yukita, S.; Namiki, H.; Nosaka, Y.; Kobayashi, T.; Tokunaga, E. Giant Pockels effect of polar organic solvents and water in the electric double layer on a transparent electrode. RSC Adv. 2017, 7, 45682–45690. [Google Scholar] [CrossRef] [Green Version]
  8. Yukita, S.; Suzuki, Y.; Shiokawa, N.; Kobayashi, T.; Tokunaga, E. Mechanisms of the anomalous Pockels effect in bulk water. Opt. Rev. 2018, 25, 205–214. [Google Scholar] [CrossRef]
  9. Oliveira, L.C.; Lima, A.M.N.; Lima, A.M.N.; Neff, H.F. Surface Plasmon Resonance Sensors, 2nd ed.; Springer Publishing: Salmon, CA, USA, 2019. [Google Scholar]
  10. Liedberg, B.; Nylander, C.; Lundstrom, I. Surface-plasmon resonance for gas-detection and biosensing. Sens. Actuators 1983, 4, 299–304. [Google Scholar] [CrossRef]
  11. Kretschmann, E. Die Bestimmung optischer Konstanten von Metallen durch Anregubg von Oberflächenplasmaschwingungen. Z. Phys. 1971, 241e, 313–324. [Google Scholar] [CrossRef]
  12. Takagi, K.; Nair, S.V.; Watanabe, R.; Seto, K.; Kobayashi, T.; Tokunaga, E. Surface Plasmon Polariton Resonance of Gold, Silver, and Copper Studied in the Kretschmann Geometry: Dependence on Wavelength, Angle of Incidence, and Film Thickness. J. Phys. Soc. Jpn. 2017, 86. [Google Scholar] [CrossRef]
  13. Cross, G.H.; Girling, I.R.; Peterson, I.R.; Cade, N.A. Linear pockels response of a monolayer langmuir-blodgett-film. Electron. Lett. 1986, 22, 1111–1112. [Google Scholar] [CrossRef]
  14. Wijekoon, W.; Asgharian, B.; Casstevens, M.; Samoc, M.; Talapatra, G.B.; Prasad, P.N.; Geisler, T.; Rosenkilde, S. Electrooptic effect in langmuir-blodgett-films of 2-(docosylamino)-5-nitropyridine probed by surface-plasmon waves. Langmuir 1992, 8, 135–139. [Google Scholar] [CrossRef]
  15. Jung, C.; Yee, S.; Kuhn, K. Electro-optic polymer light modulator based on surface plasmon resonance. Opt. Soc. Am. 1995, 34, 946–949. [Google Scholar] [CrossRef] [PubMed]
  16. Melikyan, A.; Alloatti, L.; Muslija, A.; Hillerkuss, D.; Schindler, P.C.; Li, J.; Palmer, R.; Korn, D.; Muehlbrandt, S.; Van Thourhout, D.; et al. High-speed plasmonic phase modulators. Nat. Photonics 2014, 8, 229–233. [Google Scholar] [CrossRef]
  17. Haffner, C.; Heni, W.; Fedoryshyn, Y.; Niegemann, J.; Melikyan, A.; Elder, D.L.; Baeuerle, B.; Salamin, Y.; Josten, A.; Koch, U.; et al. All-plasmonic Mach-Zehnder modulator enabling optical high-speed communication at the microscale. Nat. Photonics 2015, 9, 525. [Google Scholar] [CrossRef]
  18. Ayata, M.; Fedoryshyn, Y.; Heni, W.; Baeuerle, B.; Josten, A.; Zahner, M.; Koch, U.; Salamin, Y.; Hoessbacher, C.; Haffner, C.; et al. High-speed plasmonic modulator in a single metal layer. Science 2017, 358, 630–632. [Google Scholar] [CrossRef] [PubMed] [Green Version]
  19. Haffner, C.; Chelladurai, D.; Fedoryshyn, Y.; Josten, A.; Baeuerle, B.; Heni, W.; Watanabe, T.; Cui, T.; Cheng, B.J.; Saha, S.; et al. Low-loss plasmon-assisted electro-optic modulator. Nature 2018, 556, 483. [Google Scholar] [CrossRef]
  20. Chong, Y.D.; Ge, L.; Cao, H.; Stone, A.D. Coherent Perfect Absorbers: Time-Reversed Lasers. Phys. Rev. Lett. 2010, 105. [Google Scholar] [CrossRef] [Green Version]
  21. Hayama, D.; Seto, K.; Yamashita, K.; Yukita, S.; Kobayashi, T.; Tokunaga, E. Giant Pockels effect in an electrode-water interface for a “liquid” light modulator. OSA Contin. 2019, 2, 3358–3373. [Google Scholar] [CrossRef]
  22. Yang, H.H.U.; D’Archangel, J.; Sundheimer, M.L.; Tucker, E.; Boreman, G.D.; Raschke, M.B. Optical dielectric function of silver. Phys. Rev. B 2015, 91. [Google Scholar] [CrossRef] [Green Version]
  23. Johnson, P.B.; Christy, R.W. Optical Constants of the Noble Metals. Phys. Rev. B 1963, 6, 4370–4379. [Google Scholar] [CrossRef]
  24. Born, M.; Wolf, E. Principles of Optics, 6th ed.; Pergamon Press: Oxford, UK, 1980. [Google Scholar]
  25. Yariv, A. Quantum Electronics, 3rd ed.; John Wiley & Sons: New York, NY, USA, 1989. [Google Scholar]
  26. Boyd, R.W. Nonlinear Optics, 3rd ed.; Elsevier: Amsterdam, The Netherland, 2008. [Google Scholar]
  27. Morrow, R.; McKenzie, D.R.; Bilek, M.M.M. The time-dependent development of electric double-layers in saline solutions. J. Phys. D Appl. Phys. 2006, 39, 937–943. [Google Scholar] [CrossRef]
  28. Han, Z.J.; Morrow, R.; Tay, B.K.; McKenzie, D. Time-dependent electrical double layer with blocking electrode. Appl. Phys. Lett. 2009, 94. [Google Scholar] [CrossRef] [Green Version]
  29. Barnes, W.L. Surface plasmon-polariton length scales: A route to sub-wavelength optics. J. Opt. A Pure Appl. Opt. 2006, 8, S87–S93. [Google Scholar] [CrossRef]
  30. Fricke, H. The theory of electrolytic polarization. Philos. Mag. 1932, 14, 310–318. [Google Scholar] [CrossRef]
Figure 1. Experimental setup with a cooled Spectrometric CCDs for measurement of reflection spectra and with a multi lock-in amplifier for measurement of electromodulation spectra ΔR using the function generator. R for normalization of ΔR was measured by intensity-modulationg the reflected probe with a chopper (not shown).
Applsci 11 02152 g001
Figure 2. Reflection spectra of Ag in contact with (a) air and (b) water. The incidence angle θ in the prism was calculated as θ = 45 ° + sin 1 [ sin ( θ a 45 ° ) / 1.47 ] from the incidence angle θ a in air [12] with the quartz refractive index 1.47. (For example, θ = 70.3° when θ a = 84°).
Applsci 11 02152 g002
Figure 3. Normalized electromodulation spectra Δ X / R s and Δ Y / R s at 222 Hz, 333 Hz, and 444 Hz.
Applsci 11 02152 g003
Figure 4. (a) Reflection spectrum and (b) its first derivative with respect to the photon energy, measured with the cooled spectrometric CCD.
Applsci 11 02152 g004
Figure 5. The results of fitting ( d R p d E ) Δ E R s (red curves) to Δ R p R s at 222 Hz (black curves) with the peak applied voltage of (a) 0.4 V, (b) 0.8 V, (c) 1.2 V, (d) 1.6 V, and (e) 2.0 V. Here, the Δ R p R s is phase rotated from the raw data in Figure 3 such that the X signal dominates.
Applsci 11 02152 g005aApplsci 11 02152 g005b
Figure 6. Dependence of ΔE on applied voltage at 222 Hz.
Applsci 11 02152 g006
Figure 7. Experimental data compared with calculated dispersion relations (Equation (3)) of SPP for Ag ( ε 2 from [23] in contact with air and water ( ε 1 = 1   and   1.33 2 ) .
Applsci 11 02152 g007
Figure 8. (a) Penetration depth of SPP as a function of photon energy. (b) Enlarged graph for the penetration depth into the metal side. (c) SPP resonance spectra calculated by the transfer matrix method under the same Kretschmann configuration as in the experiment with an incident angle of 70.3°.
Applsci 11 02152 g008
Figure 9. (a) Cole–Cole plot ( Im Z against Re Z ). The green circle shows the impedance at 224 Hz, closest to 222 Hz. (b) Equivalent circuit assumed for the electrolyte bulk solution and the electric double layer (EDL).
Applsci 11 02152 g009
Figure 10. Frequency dependence of (a) X and (b) Y components in the electro-modulation spectra and in the calculation from Equation (12) with phase advanced by π 2 . For both X and Y , the magnitude is normalized to 24 Hz. (c) Frequency dependence of X in the electro-modulation spectra and in the calculation from Equation (12) with phase advanced by π 2 , normalized to the magnitude of Y at 24 Hz.
Applsci 11 02152 g010
Figure 11. (a)Typical data for raw electromodulation transmission change spectra of normal incidence on 330-nm thick Indium Tin Oxide (ITO) electrode in 0.1 M LiCl aqueous solution with an AC voltage of 1 V (ampliude) at 210 Hz. The X signal is due to blue shift of the transmission spectrum. (b) Raw electromodulation reflection change spectra of 87 ° incidence on 400-nm thick TCO electrode in 0.1 M NaCl aqueous solution with an AC voltage of 2 V (ampliude) at 30 Hz. The X signal is due to blue shift of the reflection spectrum [21]. (c) Raw electromodulation transmission change spectra of normal incidence on 20-nm thick Pt electrode in 0.1 M NaCl aqueous solution with an AC voltage of 2 V (ampliude) at 21 Hz. The X signal is characterized by red shift of the transmission spectrum [8].
Applsci 11 02152 g011
Figure 12. Cole–Cole plot from the impedance measurement for Ag electrode with the applied voltage of 2 V. The green circle shows the impedance at 224 Hz, closest to 222 Hz. The same equivalent circuit as in Figure 9b is assumed for fitting.
Applsci 11 02152 g012
Table 1. The background dielectric constant ε b of Ag, experimentally determined from the fit of the observed surface plasmon polariton (SPP) resonance wavelength to Equation (5) with ω p = 3.82   eV .
Incidence   Angle   θ 
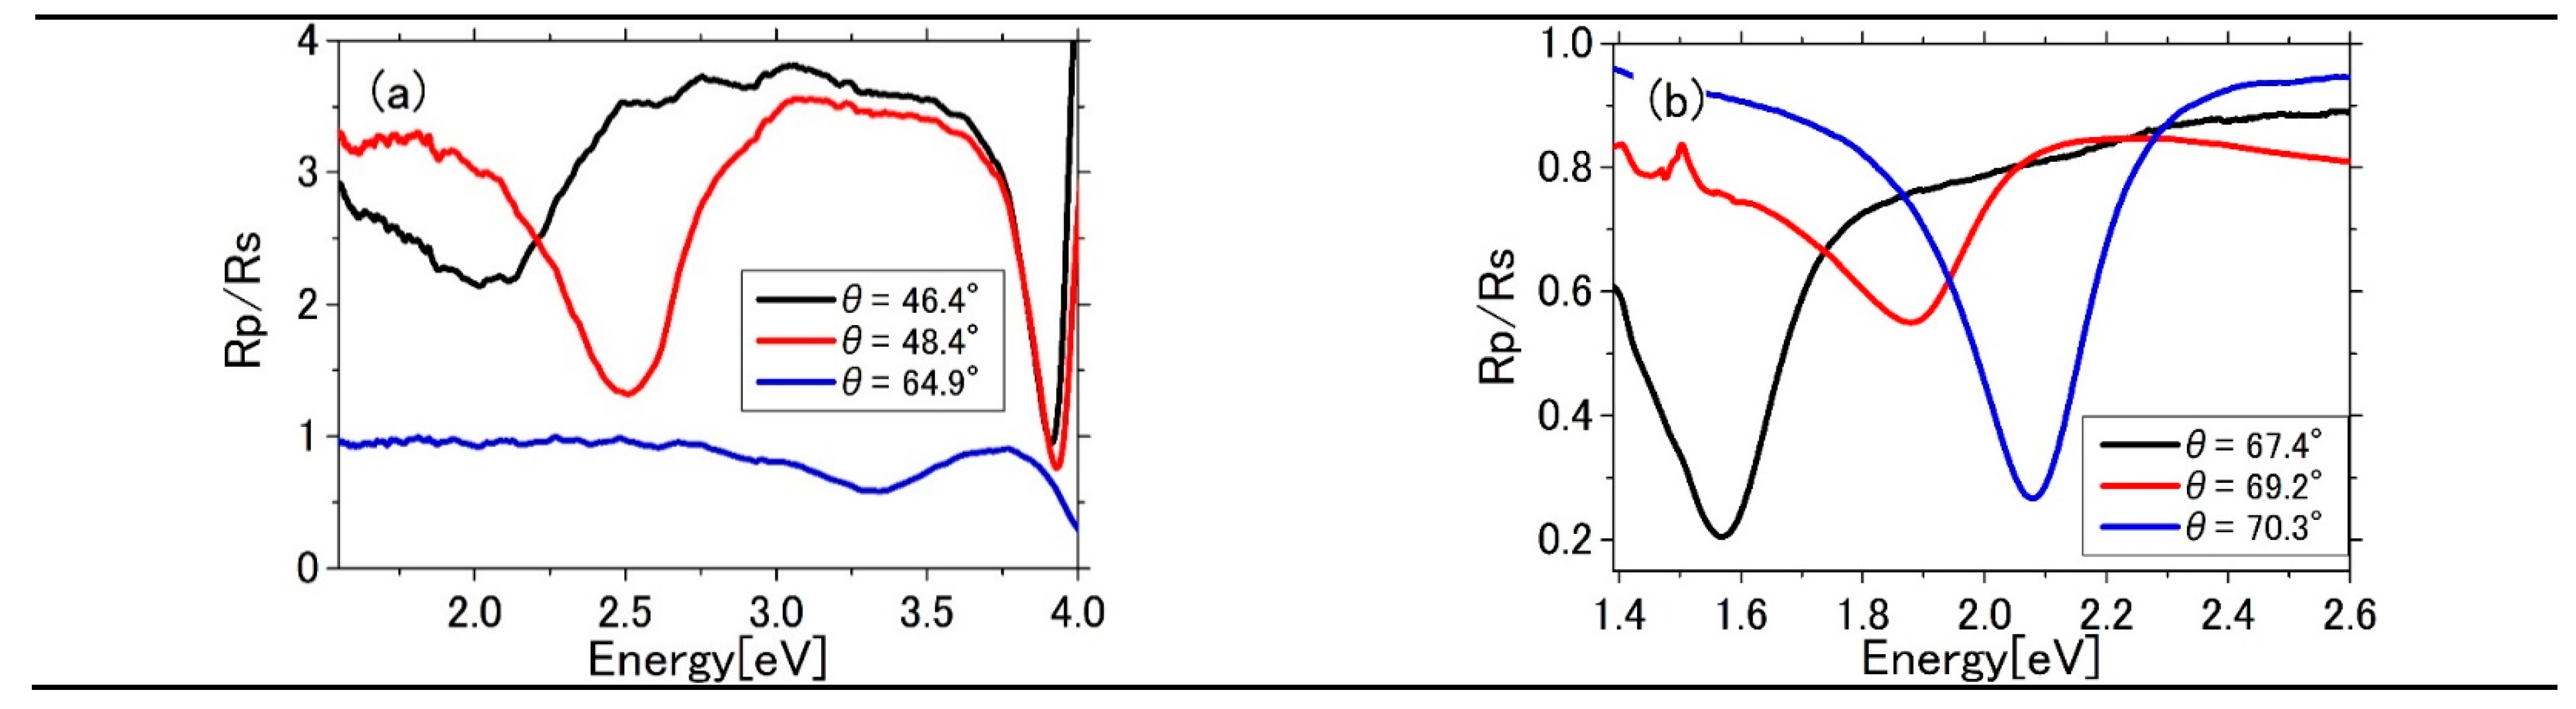
Experiment
Figure 2b
Calculation   Equation   ( 5 )   with   ε b = 5.03 Calculation   Equation   ( 5 )   with   ε b = 5.94
67.4°1.58 eV1.72 eV1.84 eV
69.2°1.88 eV1.88 eV2.00 eV
70.3°2.08 eV1.95 eV2.08 eV
Table 2. The energy shift of the SPP resonance from that with n = 1.330 in Figure 8c.
d w Δ n Δ n d w Energy Shift (eV)
3000.0010.30.022
1000.0030.30.025
300.010.30.028
Publisher’s Note: MDPI stays neutral with regard to jurisdictional claims in published maps and institutional affiliations.

