1. Introduction
Localization is known to be useful in various domains, such as medical care, police, firefighting, industries, museums, airports, and shopping malls. Specifically, the positions of defined objects in the mentioned domains are sought for using localization systems. A few examples of such objects include pedestrians in a building or airport, auto-motives on the road, foreign objects in the human body, mobile animals in a game park, and merchandise on a shelf. A key example is the precise positioning of mobile objects is one key challenge in navigation studies.
Positioning systems are classified as either indoor or outdoor depending on their development purposes and areas of application. Outdoor positioning systems have had a huge number of breakthroughs in terms of the accuracy and precision of the tools in the market today. Such outdoor positioning tools include the global positioning system (GPS), the BeiDou, and the Quasi-Zenith Satellite System (QZSS). The same outdoor tools are not accurate for indoor environments given the high levels of signal interference, absorption, multipath propagation, and fading effects in indoor scenarios. Therefore, indoor positioning solutions are currently a major work on progress in the navigation research community.
Various technologies, including infrared, Bluetooth, ultra-Wide band (UWB), wireless fidelity (Wi-Fi), RFID, cameras, sound, and magnetic systems, are basically used as workbenches for localization data generation. Different indoor positioning solutions based on these technologies [
1,
2,
3,
4,
5,
6,
7,
8,
9,
10] have been studied. Positioning approaches proposed in [
1,
2,
3,
4] are based on image data collected from indoor environments, while those in [
5,
6,
7,
8] were based on received signal strength indicator (RSSI) data.
Conventional image-based positioning approaches [
1,
2,
3,
4] use images of various kinds generated from the target indoor environment. Examples of such images include photographic images [
11], radar signal graphical data [
12], and RSSI CWT graphs [
13]. Such images are used in the prediction or estimation of indoor positions and hence are used as fingerprints. This is what is referred to as combining image-based positioning with finger-print based positioning. So far, very limited studies [
13] show that fingerprint data has been applied in deep learning systems for localization purposes. Notably, the most prominent fingerprint data transformed to feature sets are the RSSI.
In order to build deep learning-based localization systems, indoor feature representation is very critical. It is said features which compose the fingerprints used as indoor datasets. Popular feature representation approaches include the use of the time domain, frequency domain, and joint time-frequency domain. Examples of time domain features include mean, variance, standard deviation, root mean square, mean crossing rate, and many more. Examples of frequency domain features include spectral energy commonly referred to as PSD and the discrete fast Fourier transform coefficient. An example of a joint time-frequency feature is the wavelet coefficient. The CWT, therefore, falls under the time-frequency domain.
Studies such as Soro et al. [
13] have used CWT-based images to build a feature set from RSSI data usable for indoor localization using CNN and K-nearest neighbors (k-NN). Notably, Soro et al. [
13] was the first to use CWT-based images to solve indoor localization problems using deep learning. In said study, the Morlet mother wavelet was used to build CWT graphical images which were the basis of the indoor fingerprint regarded as the dataset.
This paper proposes a CWT-based approach for formulating the indoor fingerprint using RSSI data but introduces data augmentation in order to improve on the quality of the realized CWT-based dataset for purposes of improving the localization accuracy. Data augmentation is a technique which is used specifically to increase the size of a dataset due to data scarcity [
14]. However, augmented data are expected to be representative of the real experimental data; hence, they require careful creation. A few of the various approaches used for creating augmented data include using Gaussian noise, local averaging, rotation, and time warping. Additionally, both the Morlet and the Morse mother wavelets were extensively experimented on to evaluate the performance of the augmented CWT features. The generalized Morse and Morlet wavelets were chosen so as to capture the general performance of limiting special forms of wavelets in both families. The key contributions of this paper are therefore summarized as follows:
A dataset based on CWT scalogram image data. The CWT images were augmented with CWT scalograms derived from recorded RSSI signals complemented with additional white Gaussian noise (WGN).
A numerical CWT PSD dataset derived from CWT scalogram images. The numerical CWT PSD dataset was augmented with numerical PSD’s of CWT scalograms derived from recorded RSSI signals complemented with additional WGN.
A performance analysis of the proposed datasets together with conventional feature set formulations. All datasets were trained using CNN and ANN to estimate the room a human subject is in and also estimate the exact position of the human subject in a room.
The rest of this article is organized as follows:
Section 2 discusses the related works in indoor localization.
Section 3 presents the preliminaries.
Section 4 presents the proposed feature extraction algorithm and augmentation method.
Section 5 presents the experimental setup.
Section 6 presents the results and discussions. Finally,
Section 7 concludes this article.
2. Related Works
This section mainly focuses on related works on deep learning approaches used for localization and feature extraction techniques particularly in indoor environments. The aim of this section is to point out the performances of different studies to aid analysis and validation of the proposed algorithm in this study.
In [
15], a localization model was proposed by combining CNN with Gaussian process regression (GPR) using Wi-Fi RSSI data. RSSI fingerprints were captured from several access points in order to generate a CNN training dataset which was used for feature extraction after the reprocessing stage. In order to improve the performance of the model, the GPR algorithm was applied for coordinate adjustment of the target node. However, this approach exhibits a high computational complexity in order to achieve better prediction accuracy. Although in this study we also used CNNs in the experiments, our computational complexity in terms of training time was low, which is attributed to the proposed CWT feature sets. Our real-time positioning time complexity was low when using the trained deep learning model.
Shao et al. [
10] developed a novel hybrid location image based on sensor data series from both WiFi and magnetic field data. CNN was applied to classify the location of images for a defined reference point. Two steps for learning were adopted in order to acquire patterns of different networks. Additionally, these steps are: first, an early-stop method for preventing overfitting caused by small datasets for WiFi fingerprint features; secondly, long-term training of stable magnetic field for learning the different image features. This proposed method achieved a localization error of 1 m considering different smartphone orientations, users, and even use patterns.
Dou et al. [
16] proposed a top-down searching method using a deep reinforcement learning agent to handle dynamics in indoor environments using WiFi fingerprints. The model uses a hierarchical search strategy that begins from the whole area towards the target node. This method does not require prior knowledge of the floor plan. For a floor size of 2500 square meters, 75% accuracy was reported.
Njima et al. [
17] developed a localization system that transfers the online prediction complexity to an offline preprocessing step using a convolutional neural network. The fingerprints were generated based on 3D radio images formulated using RSSI data, and CNNs were used for target training and prediction. Using finger print data, Kurtosis values were calculated and used to provide statistical parameters that distribute global information to the local filters. However, Njima et al. [
17], considered localization accuracy and computational complexity as a trade-off, yet scalability and energy-efficiency are sometimes key metrics towards high accuracy of the target.
Ibrahim et al. [
18] presented a CNN-based approach for indoor localization using RSSI time-series from WiFi access points. They demonstrated the approach on the UJIIndoorLoc dataset considering multi-building and multi-floor data and obtained 100% accuracy on both building and floor prediction using a mobile node. Four feature set formulations were implemented, namely, single RSS vector, averaged RSS time-series, concatenated RSSI time-series, and RSSI time-series images. Feedforward DNNs and CNN were used in the prediction of the building floor and specific node location coordinates (longitude and latitude). The study reported that the RSSI time-series image dataset formulation yields an better result. However, it requires huge datasets, which is expensive in terms of manpower and time for data collection.
Hsieh et al. [
19] generated a deep learning-based approach for indoor localization through combining received signal strength (RSS) and channel state information (CSI). However, CSI-based approaches need extra hardware modifications in the mobile nodes in order to generate the data, and this makes them expensive compared to RSSI-based methods that do not require additional hardware.
Abbas et al. [
20] presented a WiDeep, a deep learning-based indoor localization system that achieves a fine-grained and robust accuracy in the presence of noise. It associates a stacked denoising auto encoder deep learning model with a probabilistic framework to reduce noise in WiFi fingerprints and capture the complex relationship between WiFi AP signals that run on the Android device and their locations. WiDeep employed regularization to avoid overfitting in deep learning models. WiDeep was evaluated with two separate test beds, a large university building and a small domestic apartment with different WiFi APs. The model achieved mean localization accuracy of 2.64 m and 1.21 m for the larger and the smaller test beds, respectively.
Chen et al. [
21] created a sensor fusion framework which combines WiFi, Pedestrian Dead Reckoning (PDR), and landmarks. The data obtained by all these sensors were fused using the Kalman filter for position estimation. The performance of the system was evaluated by comparing the proposed fusion approach with individual approaches of WiFi weighted path loss (WPL) and PDR with landmarks. The proposed approach produced an average localization error of 1 m, which is an interesting performance.
Kumar et al. [
22] proposed an indoor localization of vehicles that uses a CNN with deep learning to identify and localize vehicles in a car-park. Based on the study, a vehicle can localize itself with landmark-based positioning and internal car sensors, but is costly and requires precise knowledge of the enclosed area. The approach used off-the-shelf cameras mounted in the car-park and vehicle-to-infrastructure communication to enable all vehicles to obtain an indoor position. In this work, a pre-trained Google Net model was applied for object class classification of the images obtained from a public dataset known as ImageNet and other small images captured by cameras in their car garage. The evaluation of system was done on an eValet underground car garage equipped with network cameras monitoring several lanes. The approach generated an accuracy of 65.69% on the test data.
Wang et al. [
23] developed DeepFi, a novel deep-learning-based indoor fingerprinting system using CSI. The experiment was conducted using one fixed AP and a mobile terminal. The mobile device receives transmitted wireless signals from the access point and stores the raw CSI values in its firmware. The CSI values from the firmware were read and assigned weights. The study proposed using the weights in a deep network to represent fingerprints and apply a greedy learning algorithm for weight training in order to reduce complexity. DeepFi achieved good accuracy; nevertheless, capturing fingerprints using CSI is not cost effective and requires a powerful machine to perform localization tasks.
Li et al. [
24] proposed an indoor localization system using the affinity propagation clustering algorithm and the particle swarm optimization-based artificial neural network (PSO-ANN). Both algorithms were used on WiFi-based RSS data. The clustering technique was implemented with the purpose of reducing the location error. The PCA algorithm was used to reduce the dimensions of RSS fingerprint data. Additionally, the PCA was used with a purpose of reducing the computational complexity during the ANN training process. The affinity propagation clustering was also performed in an unsupervised approach in order to reduce the computational complexity. The proposed algorithm produced an error of 2.971 m.
Anindya et al. [
5] proposed a sigma-point Kalman smoother (SPKS)-based location and tracking algorithm as a superior alternative for indoor positioning. In their experimentation, different low cost sensors were used to capture the indoor environment data, including RSSI, infrared motion sensor data, and binary foot switches. Data from all these sensors were fused using a sigma-point Kalman smoother to determine the human user’s indoor position. Their study presents superior results compared to using the extended Kalman filter and a commercially available positioning tool.
Wang et al. [
25] proposed the use of a support vector machine (SVM) and an improved Kalman filter (KF) to estimate a target position based on RSSI. They applied the SVM in order to produce the estimated positions which are enhanced using the Kalman filter. However, Wang et al. report that the combination of SVM and the KF introduces a higher run-time. The proposed approach in our study only uses only a deep learning-trained model and does not exhibit real-time positioning delays except during the training of the deep learning model.
Pubudu et al. [
26] proposed a robust extended Kalman filter (REKF) algorithm which estimates the positions of sensors which are attached to mobile robots in an indoor environment. This applications for which the approach was proposed are delay tolerant networks (DTNs). The approach of enabling sensor node mobility was done to eliminate the processing constraints of static sensor nodes and the need for static reference beacons. The positioning results show that the proposed REKF achieved localization accuracy within 1 m in the indoor environment.
Soro et al. [
13] used a CWT to extract time-frequency features from the transformed image and used a CNN to train and learn the patterns. A K-nearest neighbors (KNN) model was then applied to define the target location. The method achieved good performance compared to some existing models. The work in [
13] is the closest match to an existing feature extraction approach using the CWT for indoor localization compared to the idea in this paper. The difference is that this paper introduces the concept of data augmentation in order to further improve on the localization performance exhibited by the CWT feature set without data augmentation. Additionally, extensive experimentation was done to evaluate the performance of the augmented CWT features by applying Morlet and Morse.
Various data augmentation approaches have been developed to improve on the performance of deep learning models. Some of these include local averaging [
14] and jittering [
27] for time series data. In this paper, jitter-caused additive Gaussian noise is used as a tool for augmenting the RSSI signal.
Table 1 shows a summary of existing feature set formulations used in indoor localization studies. Each of the feature set formulations is characterized in terms of the technical dataset composition and whether its augmented or not.
4. Proposed Algorithm
The proposed algorithm for predicting the position of a human subject in an indoor environment is applied for two purposes. The first is to identify the room where the human subject holding the smartphone receiving the RSSI data is. The second is to estimate the precise position of a human subject holding a mobile phone in a room through the use of Wi-Fi RSSI fingerprints captured from Wi-Fi access points that are fixed at different locations. These two goals are achieved through the process flow illustrated in
Figure 3. However, first, the description of the initial RSSI feature set formulation is presented next before the next subsections on augmentation.
Raw RSSI from different APs are captured at different reference points in each room. The window period for each RSSI capture is 1 s. The captured RSSI data are considered as a signal after normalization. Raw RSSI data from the APs are collected and normalized, especially for gradient-based optimization methods in order to accelerate the learning process and minimize the risk of algorithm divergence [
7]. Normalization of the RSSI data is done to take care of APs whose signals have not been received at the reference point and those APs with a very low signal strength. We adopted the normalization approach used in [
15,
34] which is as follows: (1) All APs which were invisible are set to −120 dBm such that the normalization result is zero. (2) All RSSI below −110 dBm are set to zero, because at that level, the signal is susceptible to noise which may render it unreachable. Generally, all RSSI data after normalization are between 0 and 1. It is these normalized RSSI data for each window of 1 s that are considered as the normalized RSSI signal for which the CWT is performed with the purpose of extracting the CWT graphical image and the CWT-PSD numerical data. At this stage, all CWT images are considered as the initial dataset except for the CWT-PSD, which must still under go dimension reduction using PCA.
4.1. Augmented CWT Image Feature Set Formulation
For each time window segment, after CWT generation, white Gaussian noise is added to each normalized RSS fingerprint signal, after which a CWT is again generated for the purpose of augmenting the initial CWT image feature set.
Figure 4 includes the augmented CWT image formulation.
4.2. Augmented CWT-PSD Numerical Feature Set Formulation
Given the variation in the dimensions of the CWT matrix numerically, a process of dimension equalization using the PCA is necessary. This process was done after locally averaging the numerical data. The said CWT matrix numerical data are the CWT PSD data.
The PSD data used from each CWT image are of vector size 1 × 16 after PCA equalization. These PSD data are referred to as the initial CWT-PSD numerical feature set. For each time window segment, after PSD extraction, white Gaussian noise is added onto each normalized RSS fingerprint signal, after which the PSD data are again extracted for purposes of augmenting the initial CWT-PSD numerical feature set. The process flow of the augmented CWT-PSD numerical feature set is included in
Figure 4.
5. Experimental Setup
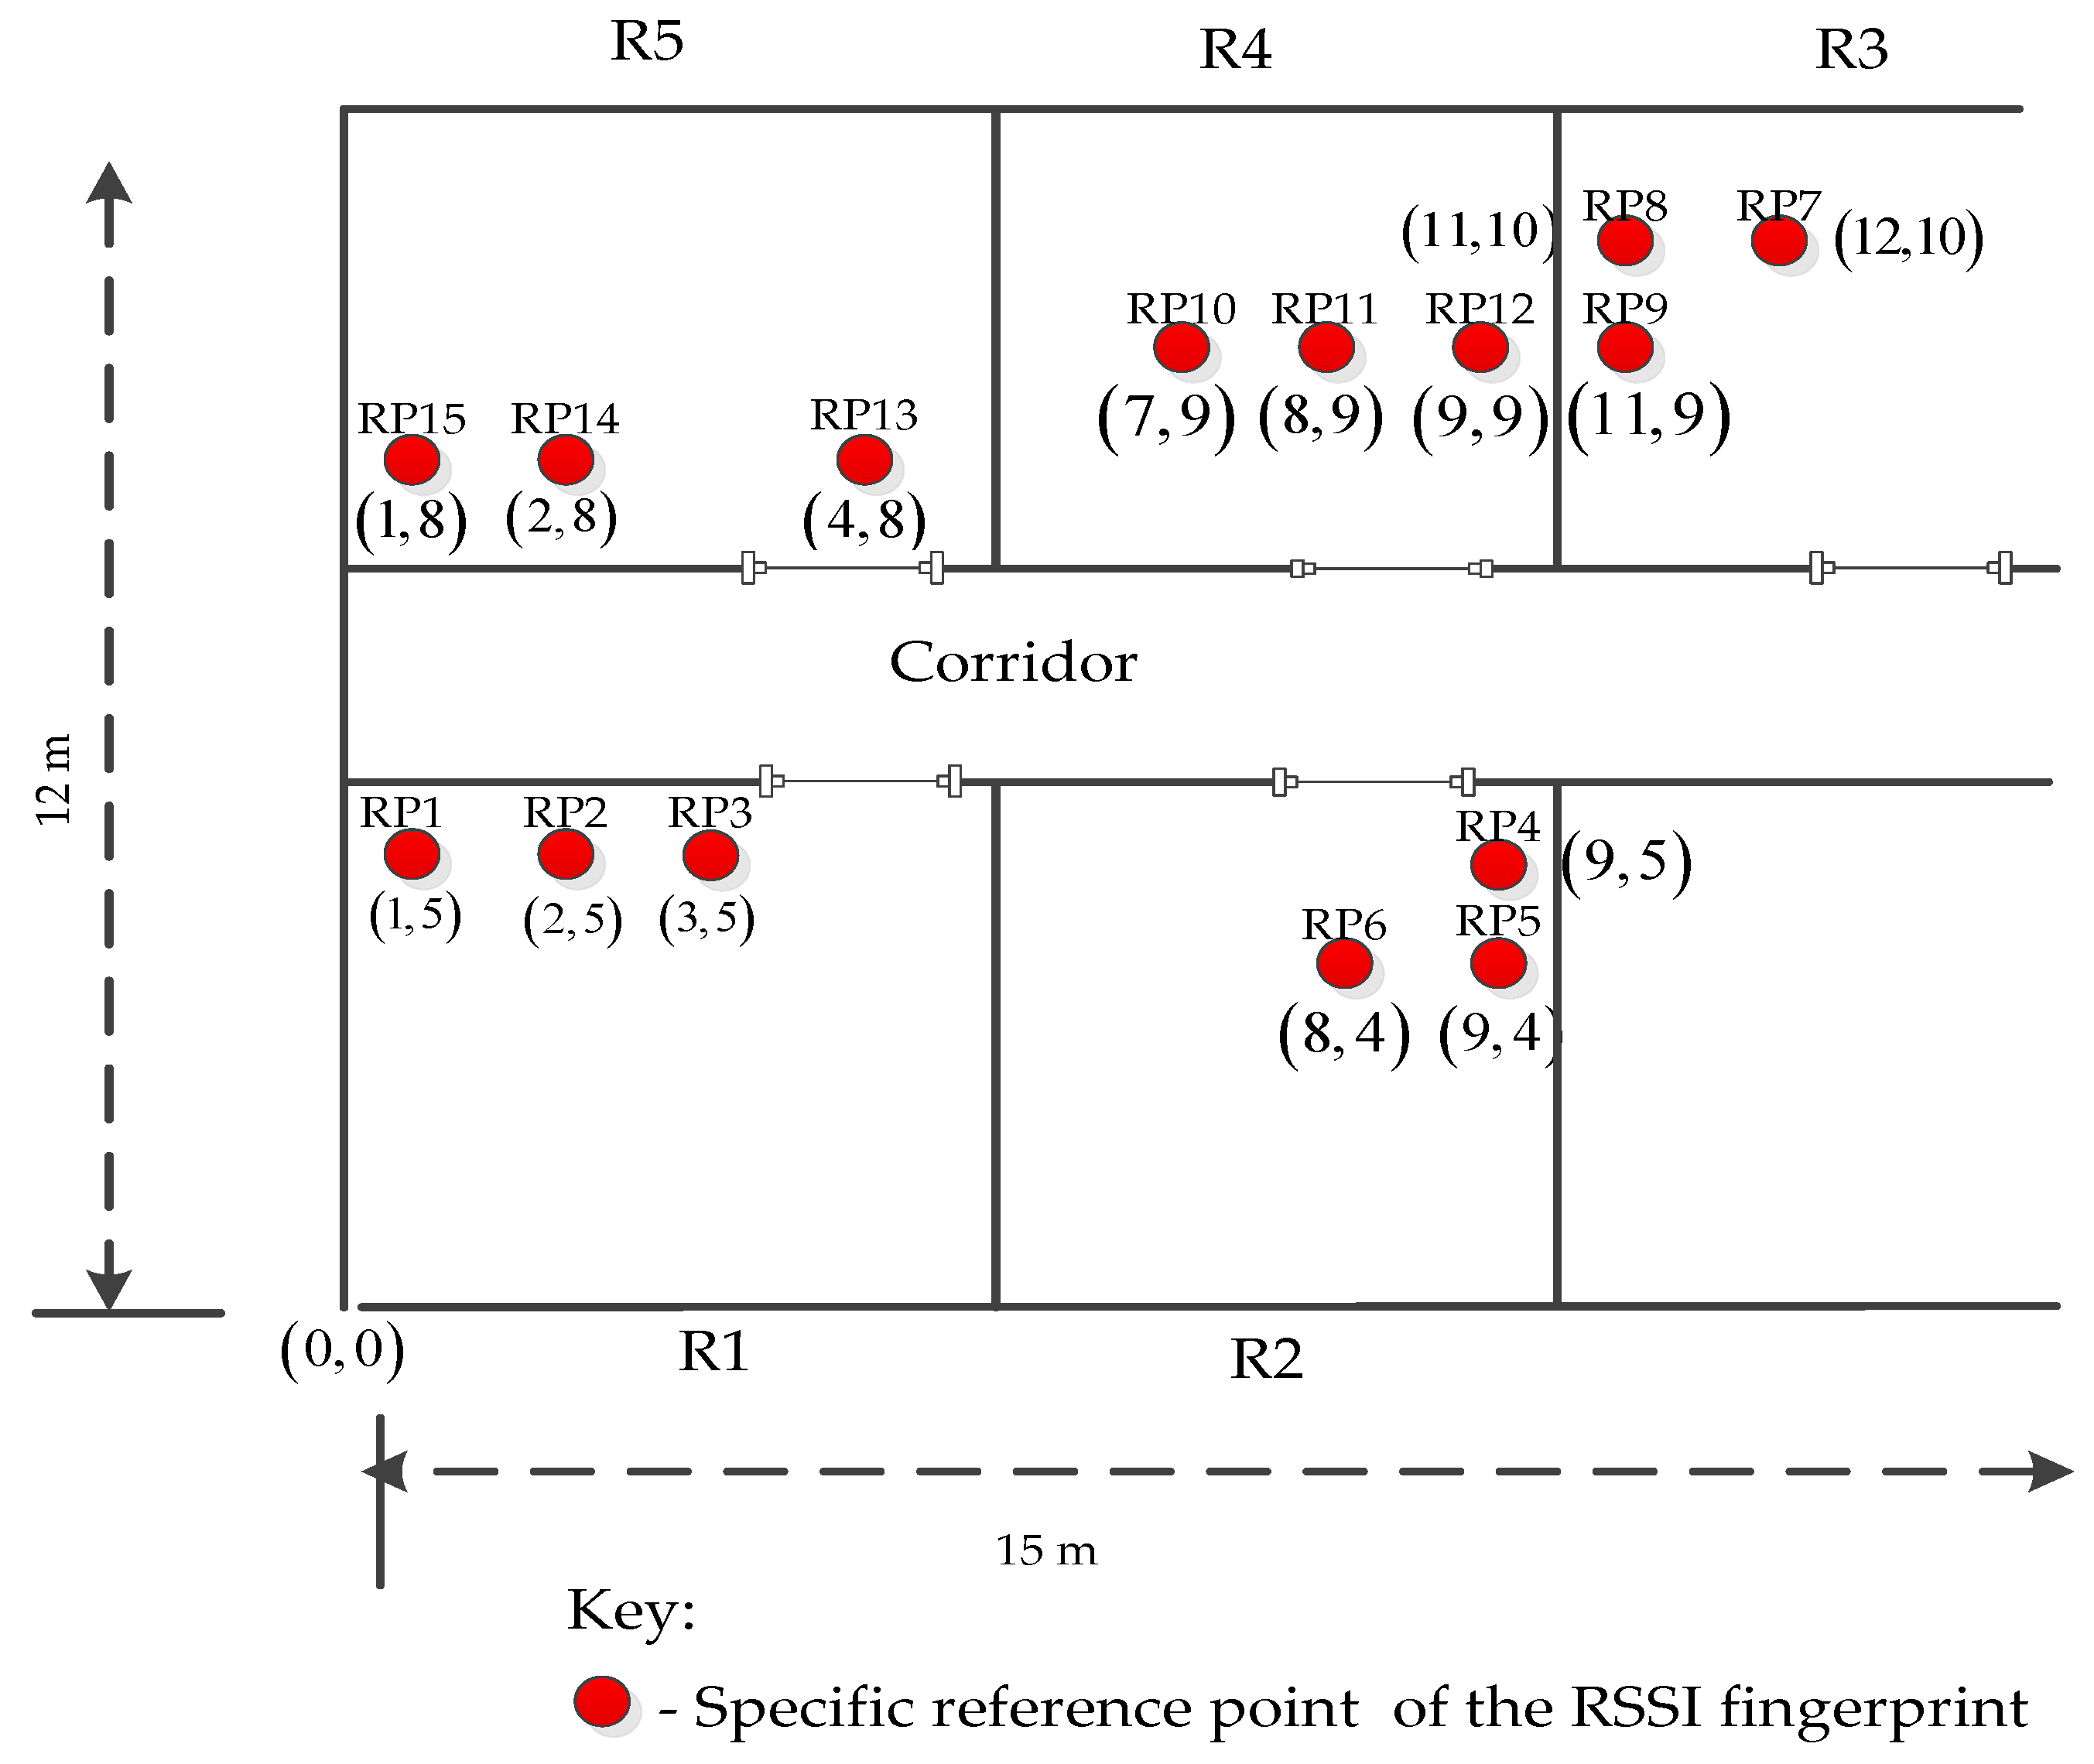
The experiment was conducted on the third floor of Block A, in the Network department at the college of computing and information science of Makerere University, as indicated in
Figure 5. Five offices (rooms) were considered with over thirty one (31) access points labeled as AP1–AP31.
A customized Wi-Fi analyzer application installed in a smart mobile phone was used to capture the RSSI values from APs within defined reference points seen in
Figure 5.
Fifteen (15) reference points for each room were considered by obtaining the RSSI vector at each point for room identification. The RSSI from different APs for each reference point were captured thrice at different times, each lasting for a period of 1 s. The RSSI data captured from the APs formulated a RSSI vector which was normalized and considered as a signal. This implies that each reference point had three RSSI data vectors which were captured in 3 s. In total, 45 RSSI vectors were captured for each room, since each room contains fifteen reference points. It is the 45 RSSI vectors which were processed for room identification. A CWT was performed on each RSSI vector signal and the CWT graphical image was extracted. The CWT-PSD numerical data were also extracted from each CWT graphical image of each RSSI vector signal. Since the window size was fixed to 1 s and the RSSI capture was done three times for each reference point, each reference point had three CWT graphical images. The CWT-PSD data generated a dataset size equivalent to the number of rows in the three different CWT-PSD 2-dimensional matrices attained in the 3 s. The separation distance between the reference points was one to two meters.
Three (3) reference points from each of the five rooms used in the experiment were selected to collect RSSI data for specific reference point estimation. Three reference points which were close to each other were sampled out to be representative of all the reference points in a room, given that the separation distance between all the points was uniform. Again, in order to take care of the RSS variations exhibited at the various positions in a room, 200 RSSI vectors were collected at each reference point, which implies that a total time of 200 s was used at each point. The assumption was that by increasing the time-space for RSSI data acquisition, we would be able to capture the RSS diversity at the different points in the room which were represented by the three sampled reference points. Collectively, 15 reference points in all the five rooms were considered, making the total number of RSSI data vectors 3000. It was the 3000 RSSI vectors which were used to estimate each of the selected specific positions in each room. For each RSSI vector, after augmentation using additive Gaussian noise, the feature set size was doubled. A summary of the dataset sizes is presented in
Table 2.
For purposes of clarity, in the proceeding text in this paper, we have chosen to refer to the augmented CWT feature set and the augmented numerical CWT PSD feature set derived in
Figure 4 as the proposed augmented CWT feature set and the CWT-PSD feature set respectively. We have chosen to follow this nomenclature in order to signify the CWT feature set as the key superior feature set formulation presented in this paper.
For purposes of determining the optimal CNN and ANN configuration parameters, arbitrary values of the number of layers (10–30), learning rates (0.01–0.5), and maximum iterations (100–200) were tested. The best performing parameter values were adopted, as shown in
Table 3 and
Table 4.
Table 5 shows the performance metrics which were used in the performance evaluation of the proposed feature set.
For this study, a real-time positioning system using the proposed algorithm was developed. The hardware composition was a smartphone dedicated to receive the signals from the APs and then route them to a server containing the RSSI data processing and localization system.
6. Results and Discussion
In this section, we report the performance of our proposed augmented CWT feature sets while comparing it with existing feature set formulations used for indoor localization applied in deep learning models. The two existing feature set formulations used for validating our proposed feature set were those proposed in [
13,
34]. In [
13] joint a CWT-based feature set was proposed but without any augmentation. In [
34], the feature set was composed of single RSSI images in which nine dummy values were added to each RSSI vector to generate a 2D image for CNN training and classification. We further show the effect of the Morlet and Morse wavelet transformed data on the room and specific position performance. Firstly, we present results for room identification in
Section 6.1. Secondly, the performance results for specific reference point recognition are presented in
Section 6.2.
6.1. Room Identification Results
Table 6 shows the confusion matrices for room identification based on the Morse wavelet.
Table 6a shows the performance exhibited by the CWT features using CNN with an accuracy of 92.73%.
Table 6b shows the proposed augmented approach using CNN with an accuracy of 97.3%. The proposed approach exhibits a superior performance because of the augmented features generated by addition of Gaussian noise to the original RSSI signal before CWT transformation. The results in
Table 6a are attributed to a dataset with 255 images, and the augmented dataset whose results are in
Table 6b was of size 450 images. Based on the accuracy results, the better performance of the augmented dataset implies that the Gaussian noise introduces more distinguishable features which are desirable for an RSSI classification.
Table 6c represents the proposed CWT-PSD without data augmentation using ANN with an accuracy of 88.2%.
Table 6d shows the proposed augmented CWT-PSD using ANN with an accuracy of 70.6%. Contrary to the image-based CNN classification in
Table 6b, the augmented PSD using ANN did not perform better than the CWT-PSD without augmentation represented by the confusion matrix in
Table 6c. This phenomenon reveals that augmented images provide more distinguishable patterns compared to augmented numerical data. Studies such as [
35] show that augmentation greatly increases the performance of CNN-based classification.
The dataset size of the proposed CWT-PSD without data augmentation using ANN was 255 vectors, and that of the augmented CWT-PSD was 450. Despite the fact that a huge dataset increases classification performance, a huge dataset can also degrade classification performance, especially if the augmented data cause a huge change in the distribution of the data, causing complexity in separating the data. This analysis implies that the Gaussian noise is not the best for augmenting numeric data in a classification problem.
Table 6e shows the performance of the single RSSI vector in [
34] with CWT as the feature extraction approach with an accuracy of 95.7%.
Table 6f shows the performance of the single rss vector in [
34] with FFT as the feature extraction approach with an accuracy of 87.3%. The accuracy results for the CWT features compared to the FFT features in the single RSS vector [
34] approach are better. This points to the ability of CWT to better distinguish features in different classes. Generally, the proposed augmented CWT feature set performed better than all the other mentioned feature sets (
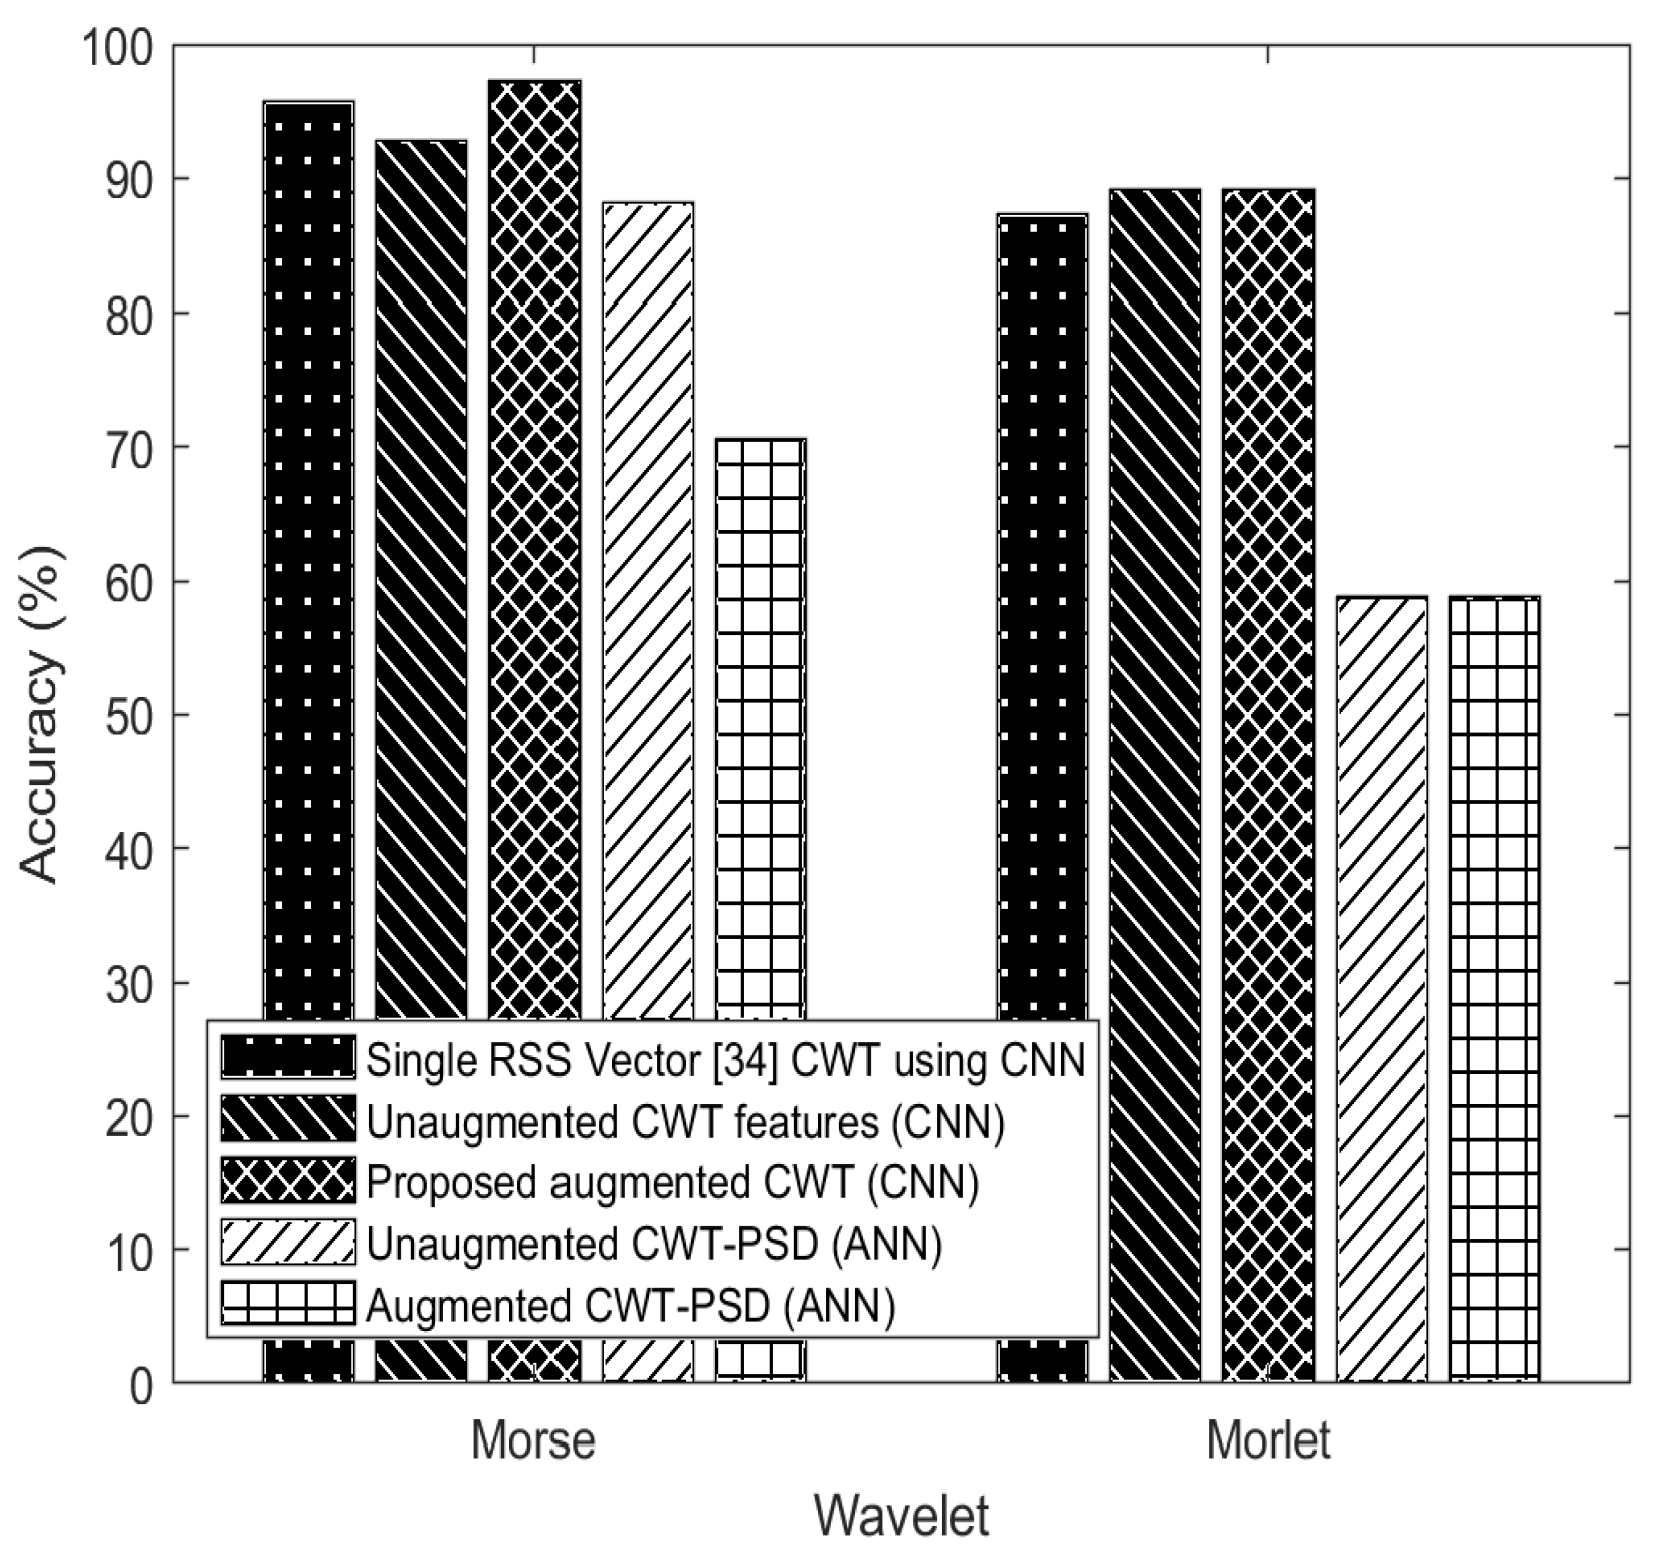
Table 6). It is also clear that the CNN model outperformed the ANN in classification. The general results in
Figure 6 also show that the Morse wavelet provides a better feature set compared to the Morlet wavelet.
For the rest of the figures in this article, we use the acronyms “A, B, C, D, E, F, G” to represent the CNN-based Morse wavelet-generated feature set, the CNN-based Morlet wavelet-generated feature set, the ANN-based Morse wavelet-generated feature set, the ANN-based Morlet wavelet-generated feature set, the CNN-RSSI [
34] Morse-based feature set, the CNN-RSSI [
34] Morlet-based feature set, and the CNN-RSSI [
34] FFT-based feature set.
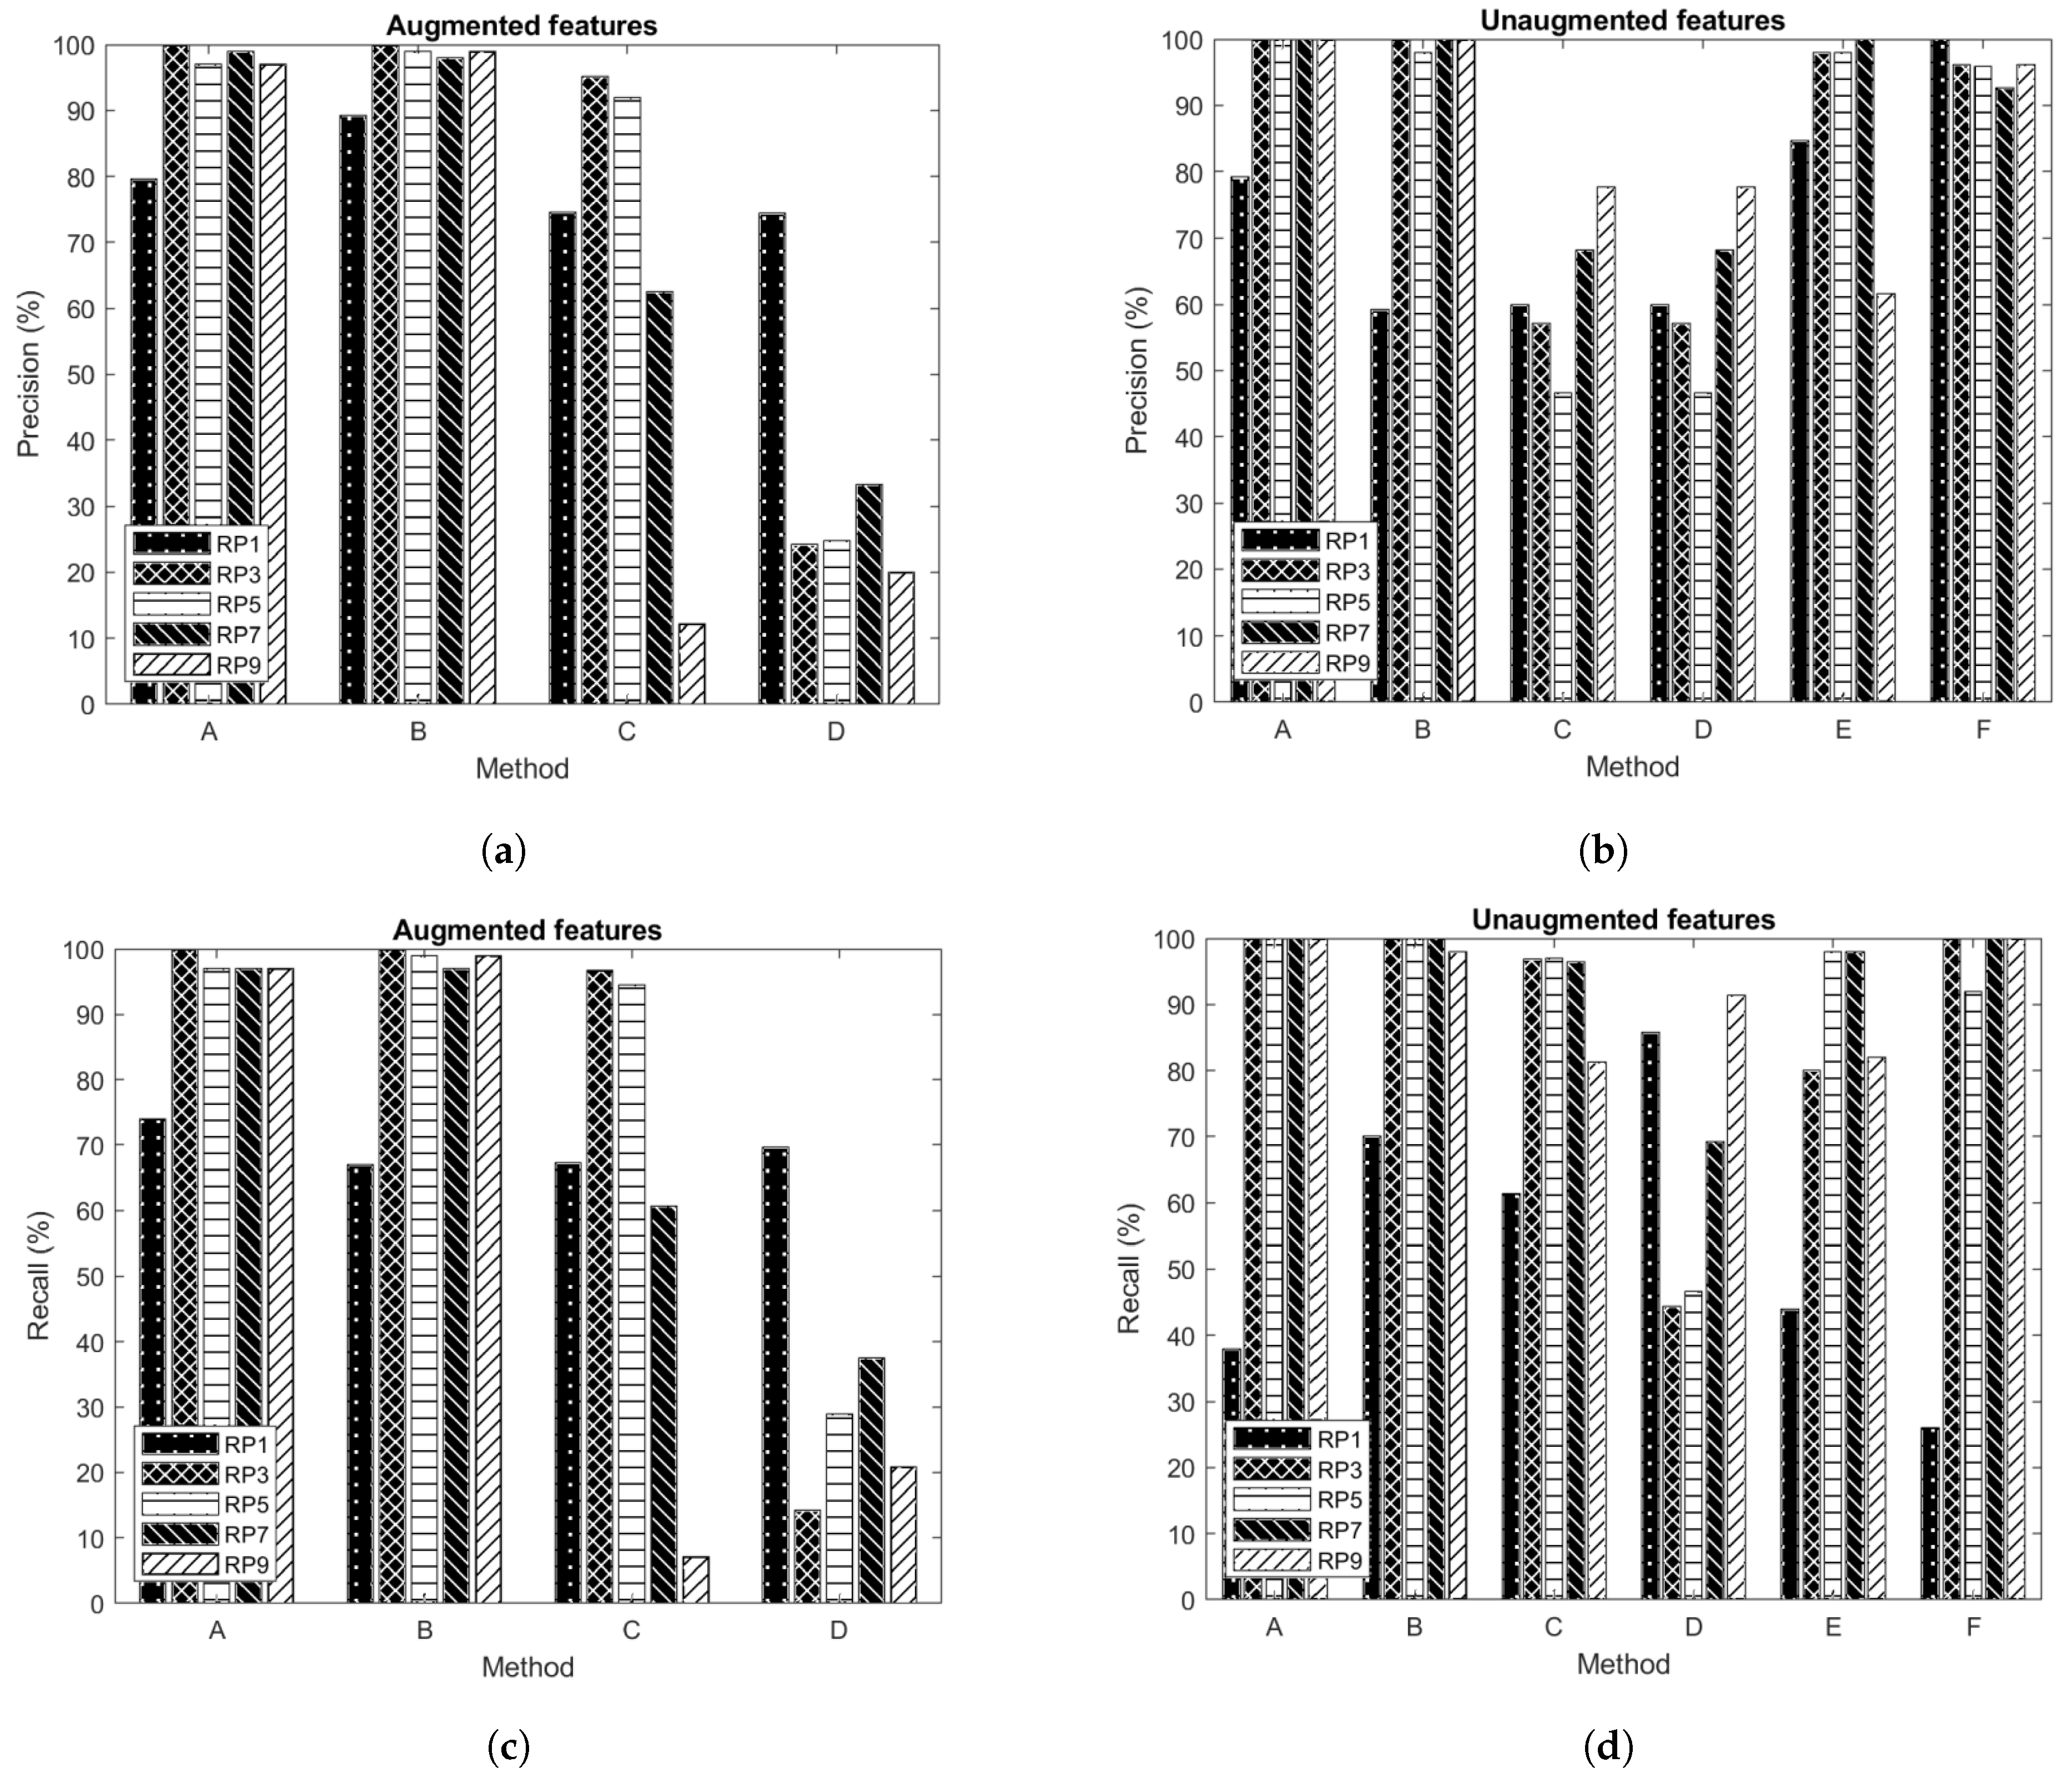
Figure 7a–d are presented to compare the performance of a deep learning approach used together with a wavelet. This should provide information on which deep learning approach should be used together with a specific wavelet transform to achieve good classification performance in terms of precision and recall.
Figure 7a shows that for the augmented dataset, the Morse wavelet-generated features, when used in the CNN deep learning model, generated the best performance in terms of precision. The worst performance in
Figure 7a is exhibited by the Morlet wavelet features used in ANN.
Figure 7b shows that for the unaugmented dataset, the Morlet wavelet-generated feature set used with the ANN model offered the best precision. Additionally, the worst was the Morse wavelet dataset applied to the ANN model. The ANN-based Morse precision performance for R4 was 0%, which is an indicator that the the time, R4 was not correctly identified. From the original RSSI data, R4’s RSSI signal has a huge similarity with all the other rooms’ RSSI signals. This gives us the insight that without augmentation, it is highly likely that the classification of R4 would generate a very minimal precision.
Figure 7c,d show the recall performance for the augmented and unaugmented datasets respectively. The results still show that the CNN-based Morse wavelet model performed better in the augmented feature set and the ANN-based Morlet wavelet model performed worst in the unagmented feature set. Generally, on average, the CNN-based Morse wavelet dataset performed best for accuracy, recall, and precision for the augmented dataset, and the ANN-based Morlet was preferable for the unaugmented dataset.
Table 7a–d present the confusion matrices for room identification based on the Morlet wavelet for the different feature set formulations mentioned in this study based on the Morlet wavelet. The best accuracy attained was 94.55% attained by the single RSSI Vector [
34] using the CNN. Our proposed augmented CWT achieved 89.1%, which is the same as that attained by the unaugmented CWT. The RSSI feature set [
34] is not an augmented feature set, yet it performed better than the augmented feature sets, implying that augmentation is not very effective when the Morlet wavelet is used for feature set generation. The augmented CWT-PSD using ANN also exhibited the same accuracy of 58.8% with the unaugmented PSD-CWT using ANN. This still shows the ineffectiveness of using augmentation when using the Morlet wavelet.
6.2. Estimation Results of Specific Reference Points
Figure 8 and
Figure 9a–d present the accuracy, precision, and recall results for the identification of specific reference points in a room. For the purpose of visualizing the results, only five points out of the fifteen reference points which formulated a finger print in each room were selected for analysis of precision and recall.
In
Figure 8, the accuracy of the proposed augmented CWT is nearly the same as that of the unaugmented CWT for the Morse wavelet, at 94.93% and 94.80% respectively. However, both feature sets outperformed all the other feature sets, for both Morse and Morlet wavelets. Generally, the Morse-based feature sets performed better than the Morlet. This is significant for the unaugmented CWT-PSD using ANN.
The precision results arrived at using CNN for both the augmented and unaugmented datasets are high in
Figure 9a–d. It is also clear from
Figure 9a,c that the ANN-Morlet based precision and recall results are low for the augmented feature sets compared to the ANN-based, Morlet-based precision results for the unaugmented features in
Figure 9b,d. We can deduce that ANN-based classification using Morlet-based feature sets does not exhibit improved performance when data augmentation is applied. For the case of this study, we can more specifically deduce that augmentation using Gaussian noise does not improve the performance of ANN-based learning models compared to CNN-based learning models.
In summary, for both room prediction and specific reference point estimation, the pattern observed was that there existed better accuracy, precision, and recall performance for Morse over Morlet for ANN, and they were nearly the same for CNN. This result is backed up by the fact that technically, the Morse wavelet belongs to a two-parameter family of wavelets which generates distinct joint-time frequency data space compared to the Morlet, which is a single-parameter family of wavelets. The distinct joint-time frequency numerical data are what composes the CWT-PSD, which is used as input to the ANN model. The joint-time frequency graph which is referred to as the CWT image in this paper is used as input to the CNN model. The close performances of Morse and Morlet when using the CNN are attributed to the similarity of CWT graphical image extracts.
6.3. Prediction Error Analysis
The localization prediction error is categorized as: (1) poor recognition pointing to the same room and (2) poor recognition pointing to a different room. Poor recognition pointing to the same room means that the learning model predicted a different reference point, but in the same room wherein the actual true reference point exists, whereas poor recognition pointing to a different room means that the predicted reference point is in a different room to where the true reference point exists.
For the proposed augmented CWT Morse-based feature set, the poor recognition pointing to a different room accounts for 4.7% of the total number of dataset instances, while the poor recognition pointing to the same room instances account for 0.2% of the total number of dataset instances. The summarized analyses for the entire feature set formulations and deep learning models are presented in
Figure 10a,b.
In
Figure 10a, the proposed CWT using CNN generates the least error for out-of-room predictions. This result is for the Morse-based feature set. This implies that the number of predicted reference positions which are different from the actual reference positions are the least compared the the other feature sets. The augmented CWT-PST using CNN offered the highest number of wrongly predicted positions. This is mainly because the larger the size of the dataset, the greater the number of errors, yet this factor may not affect the accuracy. However, in the in-room predictions, the unaugmented CWT-PSD using CNN offers the least prediction error compared to all the other feature sets. Its prediction error performance appears better than that of the proposed augmented CWT features. However, although the number of wrongly predicted positions for the proposed augmented CWT is higher, they appear in the same room. This implies that the localization error performance for the proposed CWT is better than that of the unaugmented CWT using CNN.
The Morlet-based prediction error results in
Figure 10b show that the proposed augmented CWT using CNN offered the lowest prediction error, implying that it had the least number of wrongly predicted reference positions which are outside the actual room. The augmented CWT-PSD using ANN performed the worst in prediction error, implying that it had the highest number of predicted reference points outside the actual room.
The in-room predictions show that the proposed augmented CWT features was still the best performer in terms of prediction error, followed by the unaugmented CWT using CNN. The observations for both in-room and out-of-room predictions show that CNN is the best learning model for prediction of indoor positions with minimum error.
For brevity, only two confusion matrices generated for specific reference point prediction are presented. The two confusion matrices shown in
Table 8 and
Table 9 are the ones generated by the proposed augmented CWT feature dataset based on the CNN model and the CWT feature dataset based on the CNN model without augmentation.
6.4. Localization Error Analysis
We present localization error results based on a real-time positioning system developed for the study and an analysis of the confusion matrices.
Our real-time system correctly recognized the room in which the human subject was holding the phone 29 out of 35 times. The specific reference points were correctly recognized 41 out of 50 times. Since it is not very representative to use location distance error for room identification, we have put effort into using location error for evaluating the specific reference point estimation.
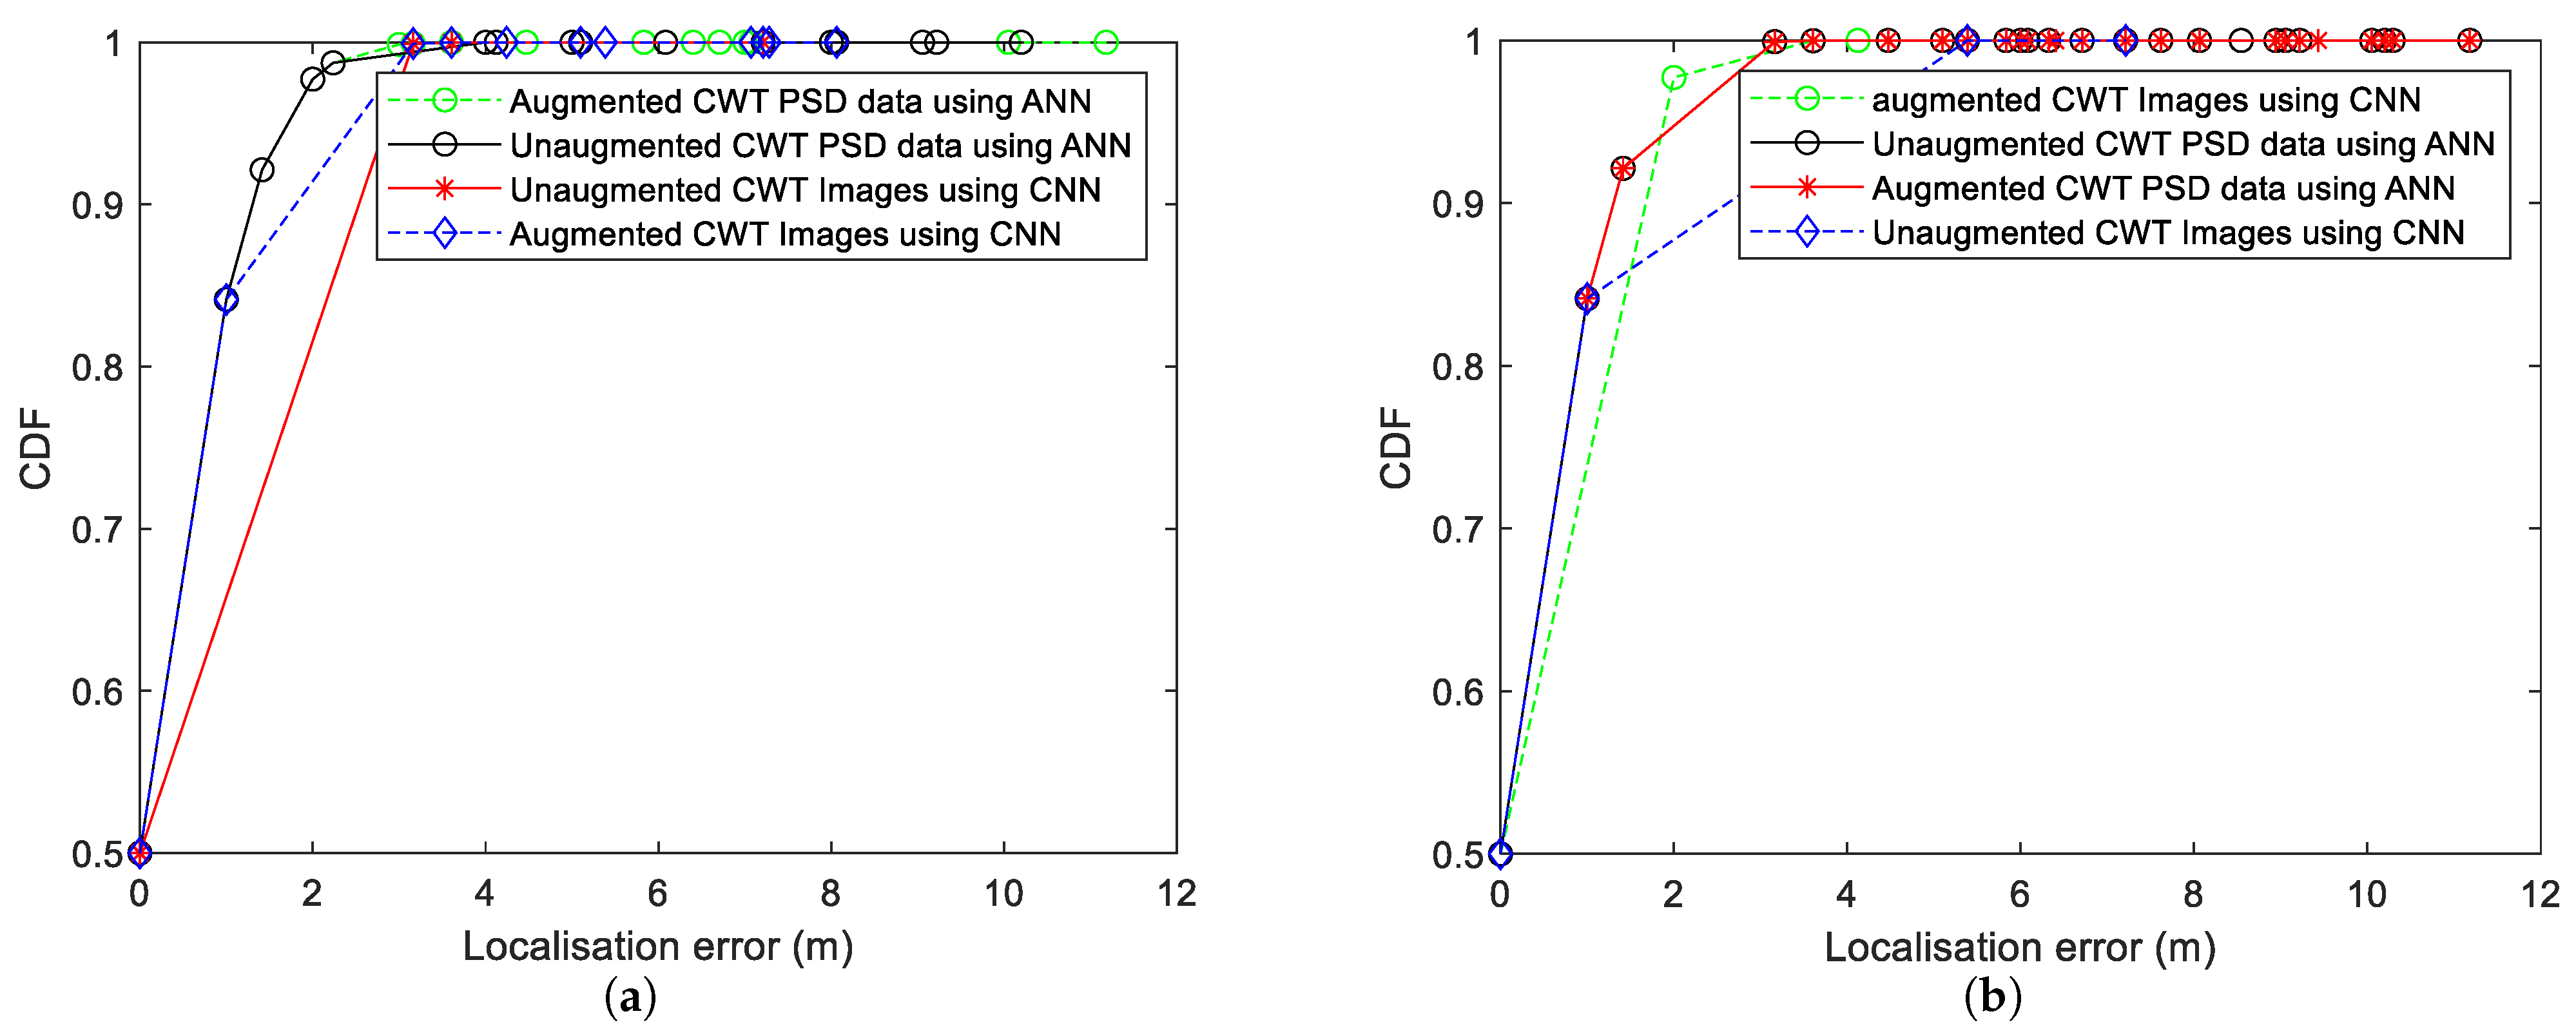
In Hsieh et al., a localization error mathematical model was formulated based on prediction error. In this study, we formulated a Cartesian coordinate system shown in
Figure 11 for the floor plan in
Figure 5 in order to compute the localization error. Basically, we computed the Euclidean distance between two reference points. Once the predicted reference point is the same as the actual reference point, the localization error is zero; if not, then the localization error is the Euclidean distance between the actual and the predicted reference point. The cumulative distribution functions (CDF) of the localization error exhibited for both the Morse and Morlet-based feature sets’ errors are presented in
Figure 12a,b. The CDF results begin showing convergence at about 3 m, indicating a general localization accuracy realized by the CWT features. However, faster convergence was exhibited by the augmented feature sets, and this occurred close to 2 m. Conclusively, our proposed approach provides improved location accuracy compared to a sizable number of existing indoor positioning solutions, some of which were used for validating this study.
7. Conclusions and Future Work
In this study, a new positioning solution for indoor environments was proposed; two deep learning-based algorithms were developed using WiFi RSSI data. The first algorithm uses images generated from received signal strength indicators’ (RSSIs) continuous wavelet transforms with white Gaussian noise, and then trains a convolutional neural network. The second algorithm uses power spectral density data extracted from the CWT images, which is processed and then used to train an artificial neural network (ANN) to determine the position of an object. Position accuracies of 97.3% and 70.6% for CNN and ANN for room identification, and 94.93% and 60.6% for specific reference points were obtained. Due to the fact that CNN’s performance surpasses that of ANN, it is considered as the best algorithm to use in indoor location with Wi-Fi fingerprints in this study, because it achieved better results than the other models did.
In future, we look forward to applying other data augmentation techniques to test whether they can significantly improve on the Morlet-based feature sets when ANN is applied. We also intend to further experiments the Morse wavelet abilities by using various dilating values to generate feature sets for indoor fingerprint data. Additionally, we intend to experiment with the proposed approach on inertial sensor motion (IMU) data for human subject tracking in indoor environments.


