Article

Native Plant Capacity for Gentle Remediation in Heavily Polluted Mines

by
María Noelia Jiménez
1,*,
Gianluigi Bacchetta
2,
Francisco Bruno Navarro
3,
Mauro Casti
2 and
Emilia Fernández-Ondoño
4
1
Department of Botany, Faculty of Pharmacy, Campus de Cartuja, University of Granada, 18071 Granada, Spain
2
Centre for Conservation of Biodiversity (CCB), Life and Environmental Sciences Department, University of Cagliari (DiSVA), Viale S. Ignazio da Laconi 11-13, 09123 Cagliari, Italy
3
Area of Agriculture and Environment, Institute of Agricultural Research and Training of Andalusia (IFAPA), Government of Andalusia, Camino de Purchil s/n, 18004 Granada, Spain
4
Department of Soil Science and Agricultural Chemistry, Faculty of Science, University of Granada, C/Severo Ochoa, s/n, 18071 Granada, Spain
*
Author to whom correspondence should be addressed.
Appl. Sci. 2021, 11(4), 1769; https://doi.org/10.3390/app11041769
Submission received: 8 January 2021 / Revised: 4 February 2021 / Accepted: 10 February 2021 / Published: 17 February 2021

Abstract

:
The use of plant species to stabilize and accumulate trace elements in contaminated soils is considered of great usefulness given the difficulty of decontaminating large areas subjected to mining for long periods. In this work, the bioaccumulation of trace elements is studied by relating the concentrations in leaves and roots of three plants of Mediterranean distribution (Dittrichia viscosa, Cistus salviifolius, Euphorbia pithyusa subsp. cupanii) with the concentrations of trace elements in contaminated and uncontaminated soils. Furthermore, in the case of D. viscosa, to know the concentration of each element by biomass, the pool of trace elements was determined both in the aerial part and in the roots. The bioaccumulation factor was not high enough in any of the species studied to be considered as phytoextractors. However, species like the ones studied in this work that live on soils with a wide range of concentration of trace elements and that develop a considerable biomass could be considered for stabilization of contaminated soils. The plant species studied in this work are good candidates for gentle-remediation options in the polluted Mediterranean.

1. Introduction

Industrial activity, such as mining, has generated large amounts of waste over time, giving rise to major environmental problems worldwide [1]. In the Sulcis-Iglesiente region (Sardinia, Italy), after more than 2000 years of mining activities, numerous spoil heaps of various types of waste material persist from the extraction process as well as the chemical and electrolytic treatments [2]. The trace-metal content is highly variable, as well as the characteristics of the contaminated soils [3]. The most abundant elements in the spoil heaps include Fe, Zn, Mn, Pb, and Cu. The bioavailability of these elements relates to their total concentration and to soil characteristics such as pH, clay content, soil organic matter, CaCO3, Al, Mn and Fe oxides and hydroxides [4]. The use of native plants can be a solution to stabilize these sediments, avoid or minimize erosion and eventually accumulate and eliminate part of the trace elements.
Phytoremediation techniques have been widely studied, giving rise to diverse results and conclusions. Some authors consider this approach ecofriendly and cost efficient, forming part of a new industrial ecology [5,6]. Phytoremediation is a recovery strategy for contaminated soil, where certain plant species (specifically their roots and associated microbial communities) are used to absorb and eliminate trace elements in the soil by transferring them to different plant tissues [7]. According to the part of the plant involved or the procedure used, the technique is called phytovolatization, phytoextraction, phytotransformation, phytodegradation, phytostimulation, phytofiltration, etc. [6]. Occasionally, plants have also been used to extract valuable trace metals, such as gold and mercury, which are found in the soil in such small quantities that they do not allow traditional mining. This technique, called phytomining [8], has the curiosity, according to Robinson et al. [7], of being potentially more polluting even than conventional mining. However, these authors point out the need for new studies that combine the knowledge of the plant-soil relationships by performing a biomass balance in order to demonstrate the effectiveness of phytoextraction or phytomining techniques.
Phytoextraction consists in the absorption of considerable amounts of toxic elements in plant tissues, especially in the aboveground biomass [9]. In this sense, Baker et al. [10] use the term “hyper-accumulating plants” for those that reach values of 100 ppm for Cd; 1000 ppm for Ni, Cu, Co, and Pb; and 10,000 ppm for Zn and Mn in leaves. In addition, these plants must be able to grow under harsh climatic conditions, such as those that characterize the Mediterranean area [11] and develop a large biomass [7].
The capacity of plants to accumulate trace elements in its tissues is usually weighted by concentration factors, also called bioaccumulation factors by some researchers [12,13,14]. This is calculated as the ratio between the concentration of the trace element in the plant vs. the concentration in the soil. However, some researchers [15] have pointed out that the costs of techniques based on the use of plants will not be fully known until the technology matures and is widely applied. Robinson et al. [7] pointed out that under the most optimal phytoextraction growing conditions, a plant with bioaccumulation coefficients > 10 would need some 25 years to reduce the total amount of pollutant in a soil by 50%. However, the use of plants can be oriented towards what has been called "gentle remediation" [16,17], which involves the use of a set of in situ techniques to avoid the spread of contamination by accumulating trace elements in its biomass (phytoextraction) or phyto-stabilizing metals [18]. Gentle Remediation Options (GROs), such as biostimulation, bioaugmentation, phytoremediation, and vermiremediation, are cost-effective and environmentally-friendly solutions for soils simultaneously polluted with organic and inorganic compounds [19]. The technique should not have negative effects on the soil structure or function [20]. This option requires a series of decisions that take into account all the characteristics of the contaminated area [18] in order to achieve a stable, self-supporting biological community [21].
The study of native species in contaminated media has been a topic of interest for many researchers. Parraga-Aguado et al. [22] assessed the criteria for plant species selection for the phytostabilization of mining wastes in semiarid areas using, among other plants, Cistus monspeliensis L. and Dittrichia viscosa. Some of these works have been carried out in mining areas of Sardinia with species common in the area such as Inula viscosa, Euphorbia dendroides, and Poa annua [23]. Recently, studies have been conducted in other industrial and mining areas. In this sense, Golestanifard et al. [24] used Noccaea rotundifolia ssp. cepaeifolia in Austria and Lacalle et al. [19] worked with Brassica napu in Spain.
Plant species such as Dittrichia viscosa (L.) Greuter subsp. viscosa and Cistus salviifolius L. grow spontaneously in a great variability of soils in the Mediterranean area, being well adapted to the climate, as in the case of Sardinia. Euphorbia pithyusa L. subsp. cupanii (Guss. ex Bertol.) Radcl.-Sm. is endemic to Corsica, Sicily, and Sardinia. These three species are able to live in environments with highly variable concentrations of trace elements such as Pb, Zn, Cu, and Mn, which, together with Fe, frequently appear in soils of mine tailings such as those in Sardinia [3]. However, it is unknown how the nature and the amounts of trace elements in the soil can alter the final concentrations in leaves and roots.
Dittrichia viscosa is a pioneer shrub belonging to the Asteraceae family with broad distribution in the Mediterranean region. It develops vigorous biomass and can be considered a metallophyte [10] since it grows in soils both contaminated and not contaminated by heavy metals [25,26]. Cistus salviifolius is a fast-growing chamaephyte adapted to a broad range of environmental stresses [27], which is included in the group of pseudometallophytes and is commonly found in contaminated soils. Moreover, this species has been used in numerous phytoextraction studies [3,4,23,28].
Our hypothesis is that the above three plant species can help stabilize trace elements and therefore can be useful in gentle remediation. In previous works [3], we analyzed the concentration of trace elements in both soil and plant as well as the physical-chemical characteristics of the soils and the bioavailability of trace elements. However, the objective of this work was to test the bioaccumulation of trace elements by relating the concentrations in leaves and roots with the concentrations of trace elements in contaminated and uncontaminated soils. Furthermore, in the case of D. viscosa, to know the concentration of each element by biomass, the pool of trace elements was determined both in the aerial part and in the roots.

2. Material and Methods

2.1. Study Area

The area of Sulcis-Iglesiente (South-western Sardinia, Italy, Figure 1), known as the Metalliferous Ring, was one of the richest deposits of argentiferous lead and zinc exploited since the Roman and Punic period [29,30]. Industrial exploitation started in the 19th century and reached its peak in the 1950s with more than 40 mines in operation distributed over approximately 150 km2 [31]. The cessation of mining activity left large quantities of mine wastes and flotation tailings, estimated at about 45 million m3, which affects the quality of groundwater especially in the Monteponi area [32,33]. The Mediterranean bioclimate of the area [4] is characterized by long-term mean precipitation of 800 mm yr −1 with a mean of 50 rainy days and long summer drought period, mean annual temperature of 17 °C, and evapotranspiration and runoff around 57% and 24%, respectively [31].

2.2. Experimental Design, Sampling, and Monitoring

Three plant species were used in this study (Figure 1): D. viscosa (Asteraceae), E. pithyusa subsp. cupanii (Euphorbiaceae), and C. salviifolius (Cistaceae). All of them can exceed 1 m in height, especially D. viscosa. These plants are widely distributed in mine tailings and are also present in apparently uncontaminated areas. Three individuals of each species growing in mine tailings (contaminated soil, CC) and other three in natural soils outside mine tailings (uncontaminated soil, NC) were harvested. We took soil samples from of 0–30 cm around the root systems of the plants, for each one (Table S1). Both plants (leaves and roots) and soil samples were taken in triplicate for each species. In all cases, the type of soils sampled were classified as Spolic Technosols [34]. In addition, 20 D. viscosa individuals in contaminated soil and 19 in uncontaminated soil were randomly collected. Each was uprooted and divided into leaves, stems, and roots since these species have large aerial biomass and therefore a strong potential for being used as phytoextractors.

2.3. Sampling Preparation and Measurement

2.3.1. Plant Analyses

Plant samples (leaf and roots) were transported in polyethylene bags to the laboratory of the Center for Conservation of Biodiversity of the University of Cagliari (Italy), washed in distilled water, dried at 60 °C in a forced-air oven, then weighed (for dry weight), and subsequently milled. In the Department of Soil Science and Agricultural Chemistry at the University of Granada (Spain), the trace-element levels of Zn, Pb, Cu, Mn, and Fe were determined using a nitric acid/hydrogen peroxide microwave digestion [35] and atomic-absorption spectrophotometry (SpectrAA 220 FS Varian, Agilent Tecnologies Inc., Palo Alto, CA, USA). In the case of D. viscosa, the nutrient pool was calculated in leaves as the product between the nutrient content in the leaves and the biomass measured in dry weight, while the nutrient pool was similarly calculated for the roots [36].

2.3.2. Soil Analyses

The soil samples were collected from the vicinity of the roots of each individual (3 species × 3 individuals × 2 localities), both in contaminated and uncontaminated soils. Soil samples were air dried and sieved through a 2 mm sieve in the laboratory. Gravels (>2 mm) and fine earth (<2 mm) were separated to calculate the percentage of each fraction. The analyses were made with the fine-earth fraction thoroughly homogenized. Samples were placed in plastic bags and measured directly with X-ray fluorescence (XRF) with a NITON XL3t-980 GOLDD + instrument (Termo Fisher Scientific, Tewksbury, MA, USA). The procedure followed the manufacturer’s instructions and the recommendations of the Method 6200 of Certified Reference Material CRM052-050A according to [37]. The accuracy was estimated by the relative percent difference (RPD) between the concentration in the reference material and the concentration measured by PXRF, as has also been done in other studies [38,39,40].
The detailed physicochemical properties are described in [3]. The textures are predominantly loam or clayey loam, the calcium-carbonate contents in the soils is very variable, being in a range from 1% to more than 60%. The pH varies between 7.1 and 8.4. The contaminated soils are lower in OC and phosphorous contents and higher in electrical conductivity tan decontaminated soils.

2.3.3. Evaluation of the Plant Uptake Efficiency

The plant’s metal-uptake efficiency was determined by the metal-bioaccumulation factor (BCF), as the ratio between the metal concentration in plant roots or leaves vs. that in the soil [12,13,14]. The bioaccumulation factor in leaves (BCFl) and roots (BCFr) was calculated for each trace element. BCF as the ratio of metal concentration in leaf o root to that in the soil [41]. The trace elements translocation factor (TF) was calculated for each trace element as the ratio of element concentrations in the leaf to that in the roots [41].

2.4. Statistical Analyses

The effects of soil contamination on the bioaccumulation of trace metal in D. viscosa, E. pithyusa, and C. salviifolius were evaluated with several statistical analyses. The Shapiro–Wilk and Levene tests were applied to check normality and homoscedasticity, respectively. Non-parametric analyses were made as an alternative in case of assumption violation. The nonparametric Kruskal–Wallis test was used in this case. Moreover, statistical comparisons between the three species for mine tailings and outside mine tailings were performed by the two-sample Chi-squared test for the total nutrient content in soil, leaf, root, nutrient pools, bioaccumulation factor in leaves and roots, and translocation factor. The relation among trace metal in leaves, roots, and soils was explored using Spearman correlations. The α level of statistical significance in all cases was 0.05. A spatial-ordination method based on the correlation matrix (principal component analysis, PCA) was used to assess the similarity among the study plots spatially arranged within an ordination diagram according to D. viscosa, C. salviifolius, and E. pithyusa samples on contaminated and uncontaminated soil with regard to leaf, root, and soil trace-element concentrations. The trace-element values were previously standardized. Moreover, a Redundancy analysis (RDA) was performed to examine the relationship between soil concentrations as a whole vs. leaf and root concentrations to determine the degree of variability of the data explained by the soil variables. For this, a Monte Carlo unrestricted permutation test was used. Statistical analyses were performed in Statistix 9.0 (Analytical Software®, Tallahassee, FL, USA). The PCA and RDA were conducted through CANOCO 4.5 (Microcomputer Power, Itahaca, NY, USA) following the criteria of [42,43].

3. Results

3.1. Trace-Element Concentrations in Soils

The element with highest soil concentration was Fe whereas the lowest was Cu in both contaminated and uncontaminated soils (Table 1). In general, for all elements, the concentration was higher in contaminated soils than in non-contaminated soils, although no significant differences were detected for Cu and Fe concentrations under C. salviifolius or for Mn under E. pithyusa. The Zn and Pb concentrations were considerably higher and significantly different in contaminated than uncontaminated soils under the three plant species analyzed. The highest values corresponded mainly to soils under E. pithyusa for all the elements except for Mn, which had a higher concentration in uncontaminated soils under C. salviifolius, and Pb, which was more abundant in soils under D. viscosa.

3.2. Trace-Element Concentrations in Leaves and Roots

The leaves of D. viscosa registered the highest mean concentrations of all trace elements, except for Fe in E. pithyusa growing in contaminated soils, which presented a slightly higher average than did D. viscosa (Table 2). C. salviifolius significantly differed in leaf concentrations of Pb, Mn, and Fe both in contaminated and in uncontaminated soils. The highest mean values were recorded in contaminated soils, except for Cu, which showed similar concentrations. The D. viscosa individuals that grew in contaminated soils invariably had the highest leaf values but showed statistically significant differences only for Zn and Pb concentrations. E. pithyusa significantly differed in the leaf concentrations of Zn, Cu, and Fe, but the mean values in leaf Cu and Fe proved higher in uncontaminated soils. Differences were found only in the concentrations of Zn and Pb in the roots of D. viscosa between contaminated and uncontaminated soils, being higher in the former (Table 3). The Zn concentrations in the roots of E. pithyusa in contaminated soils were also significantly higher. In the rest of the cases analyzed, no significant differences were found.

3.3. Nutrient Pool in Leaf and Root of Dittrichia Viscosa

Significant differences between contaminated and uncontaminated soils were found in the pool of Zn and Pb in leaves and roots (Table 4). For Pb, the pool in the roots was higher in individuals that grew in uncontaminated soils compared with the pool in leaves and the concentrations in leaves and roots (Table 2 and Table 3). Moreover, the Mn and Fe pools were higher in plants under non-contaminated soils than in contaminated soils but only with statistically significant differences for Fe in roots.
The average biomass of leaves was 238.8 g ± 32.3 (SE) and 254.0 g ± 38.7 (SE) of roots for D. viscosa individuals in uncontaminated soil, while in contaminated soil the average biomass of leaves was 204.7 g ± 30.4 (SE) and 117.0 g ± 9.5 (SE) in roots. The species studied accumulated an average of up to 369 g of Zn per kg of aerial biomass and 35 g in the root biomass.

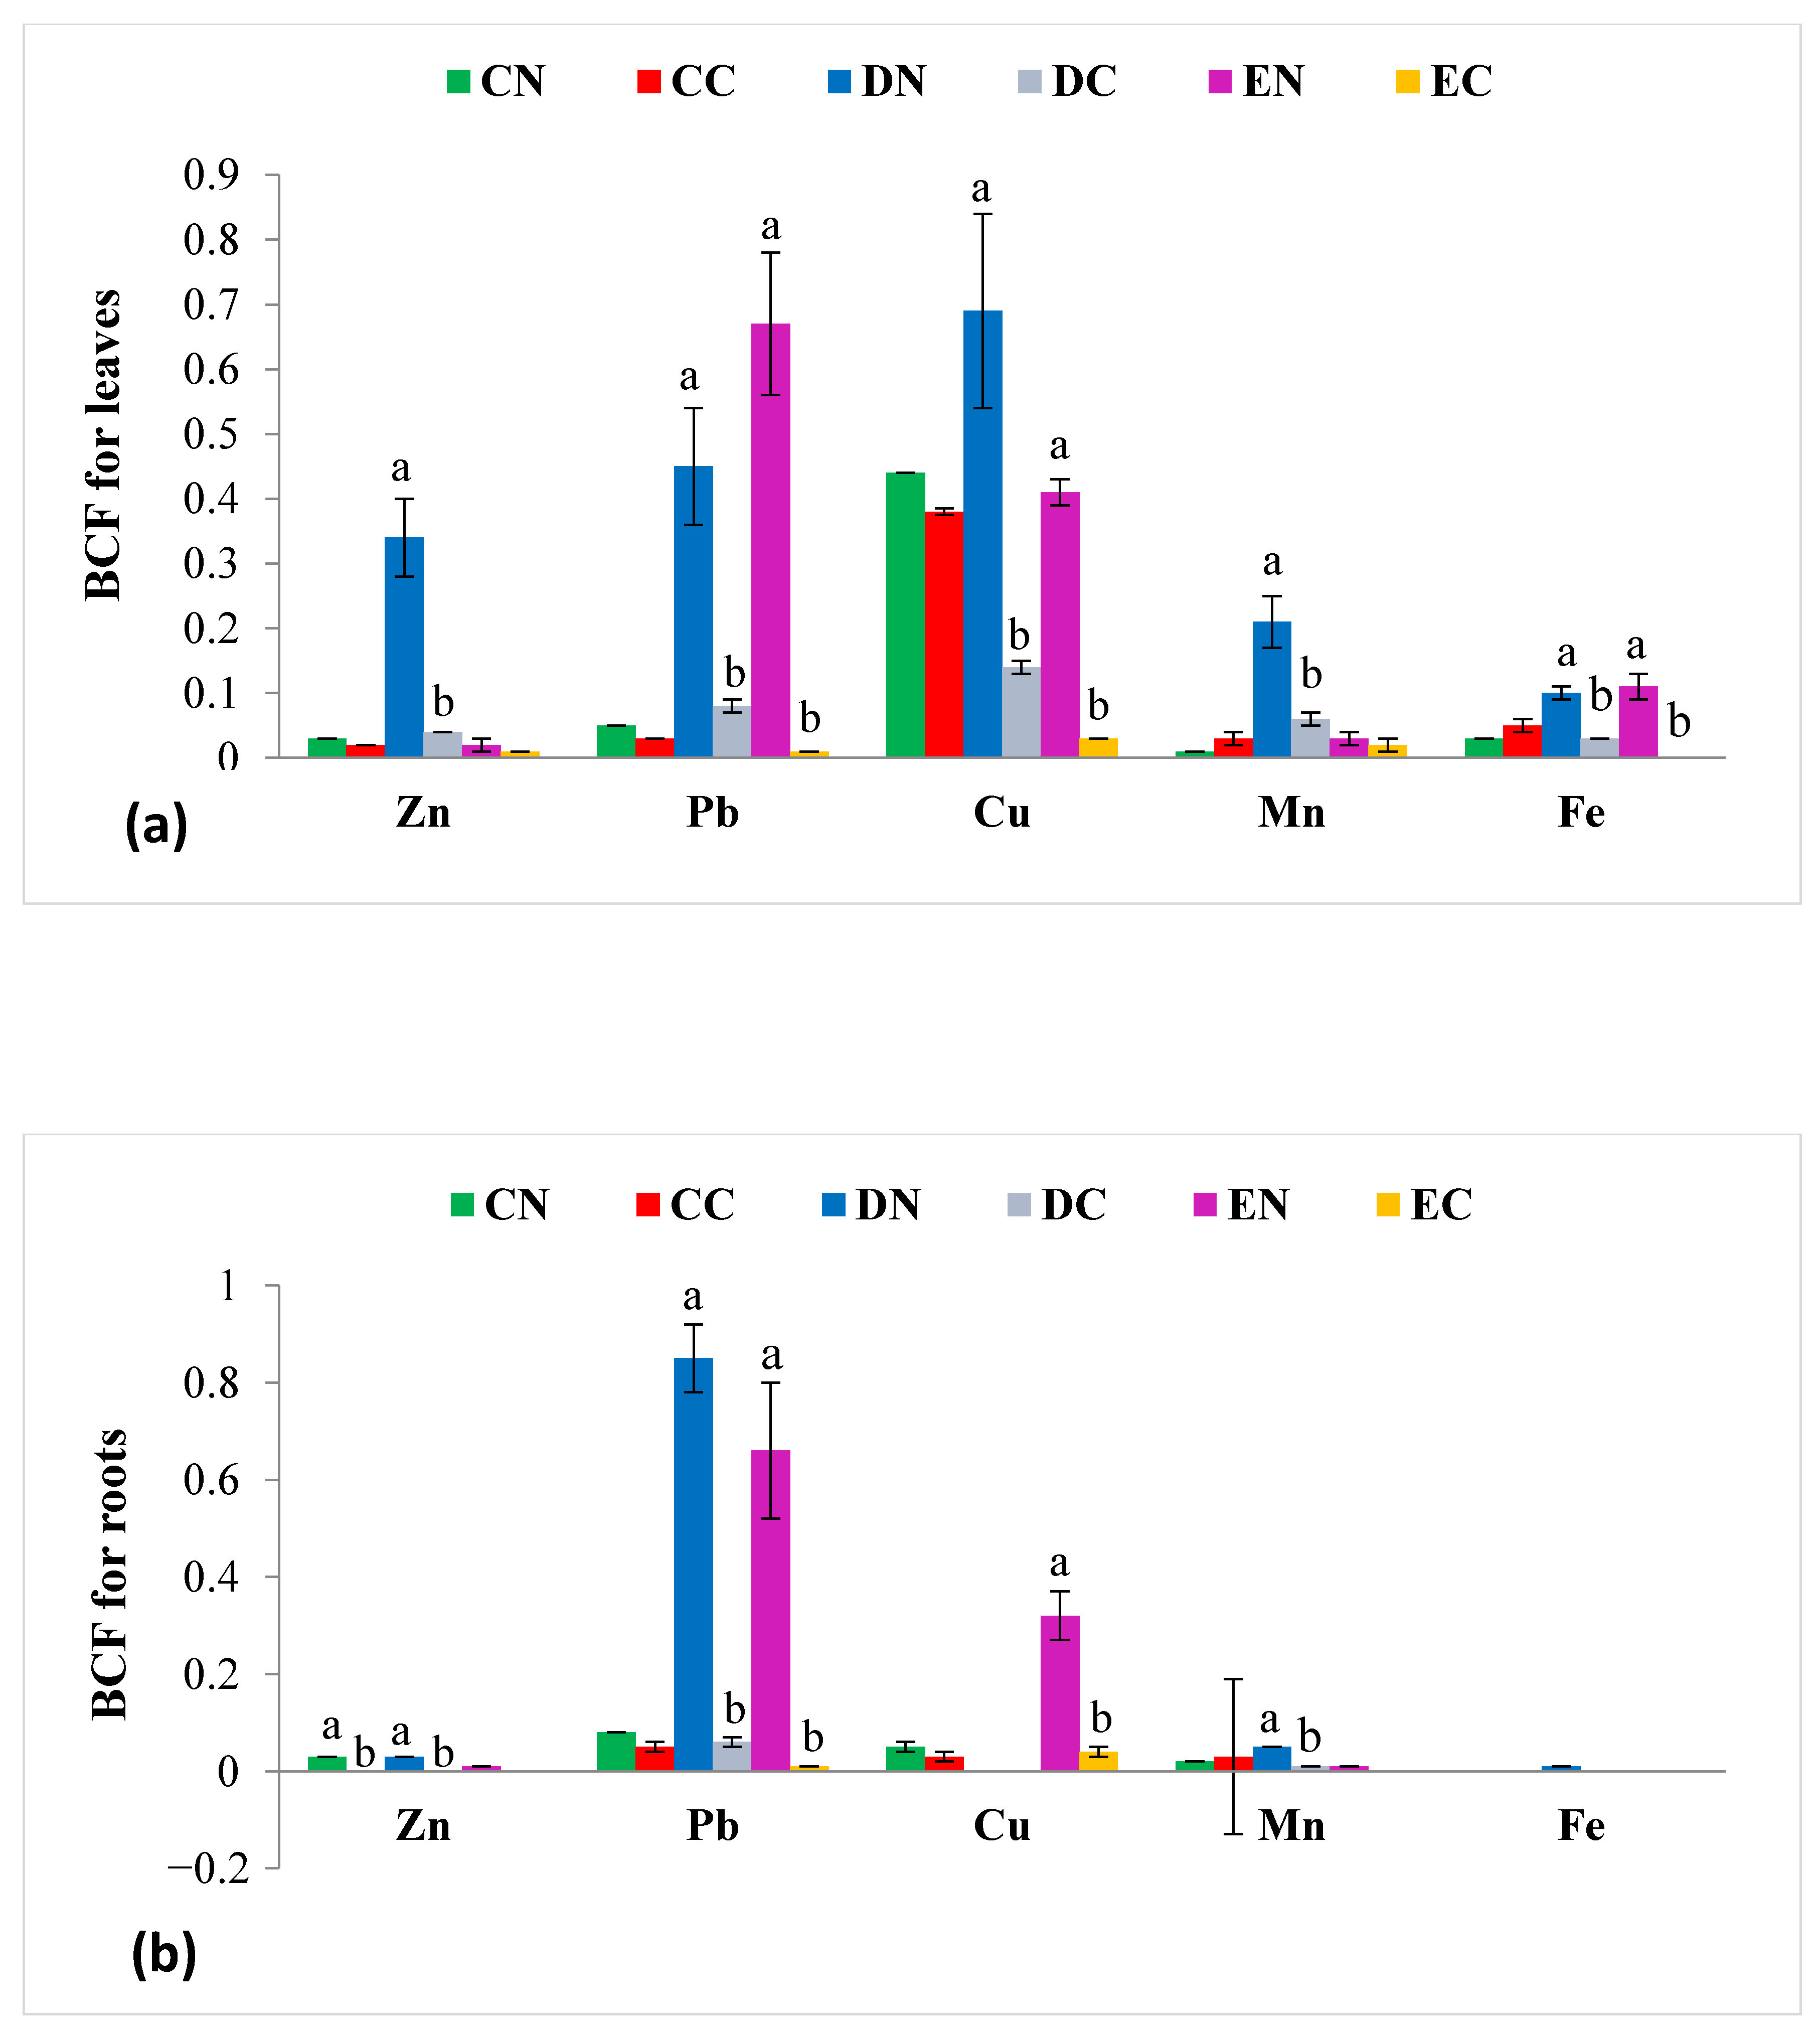
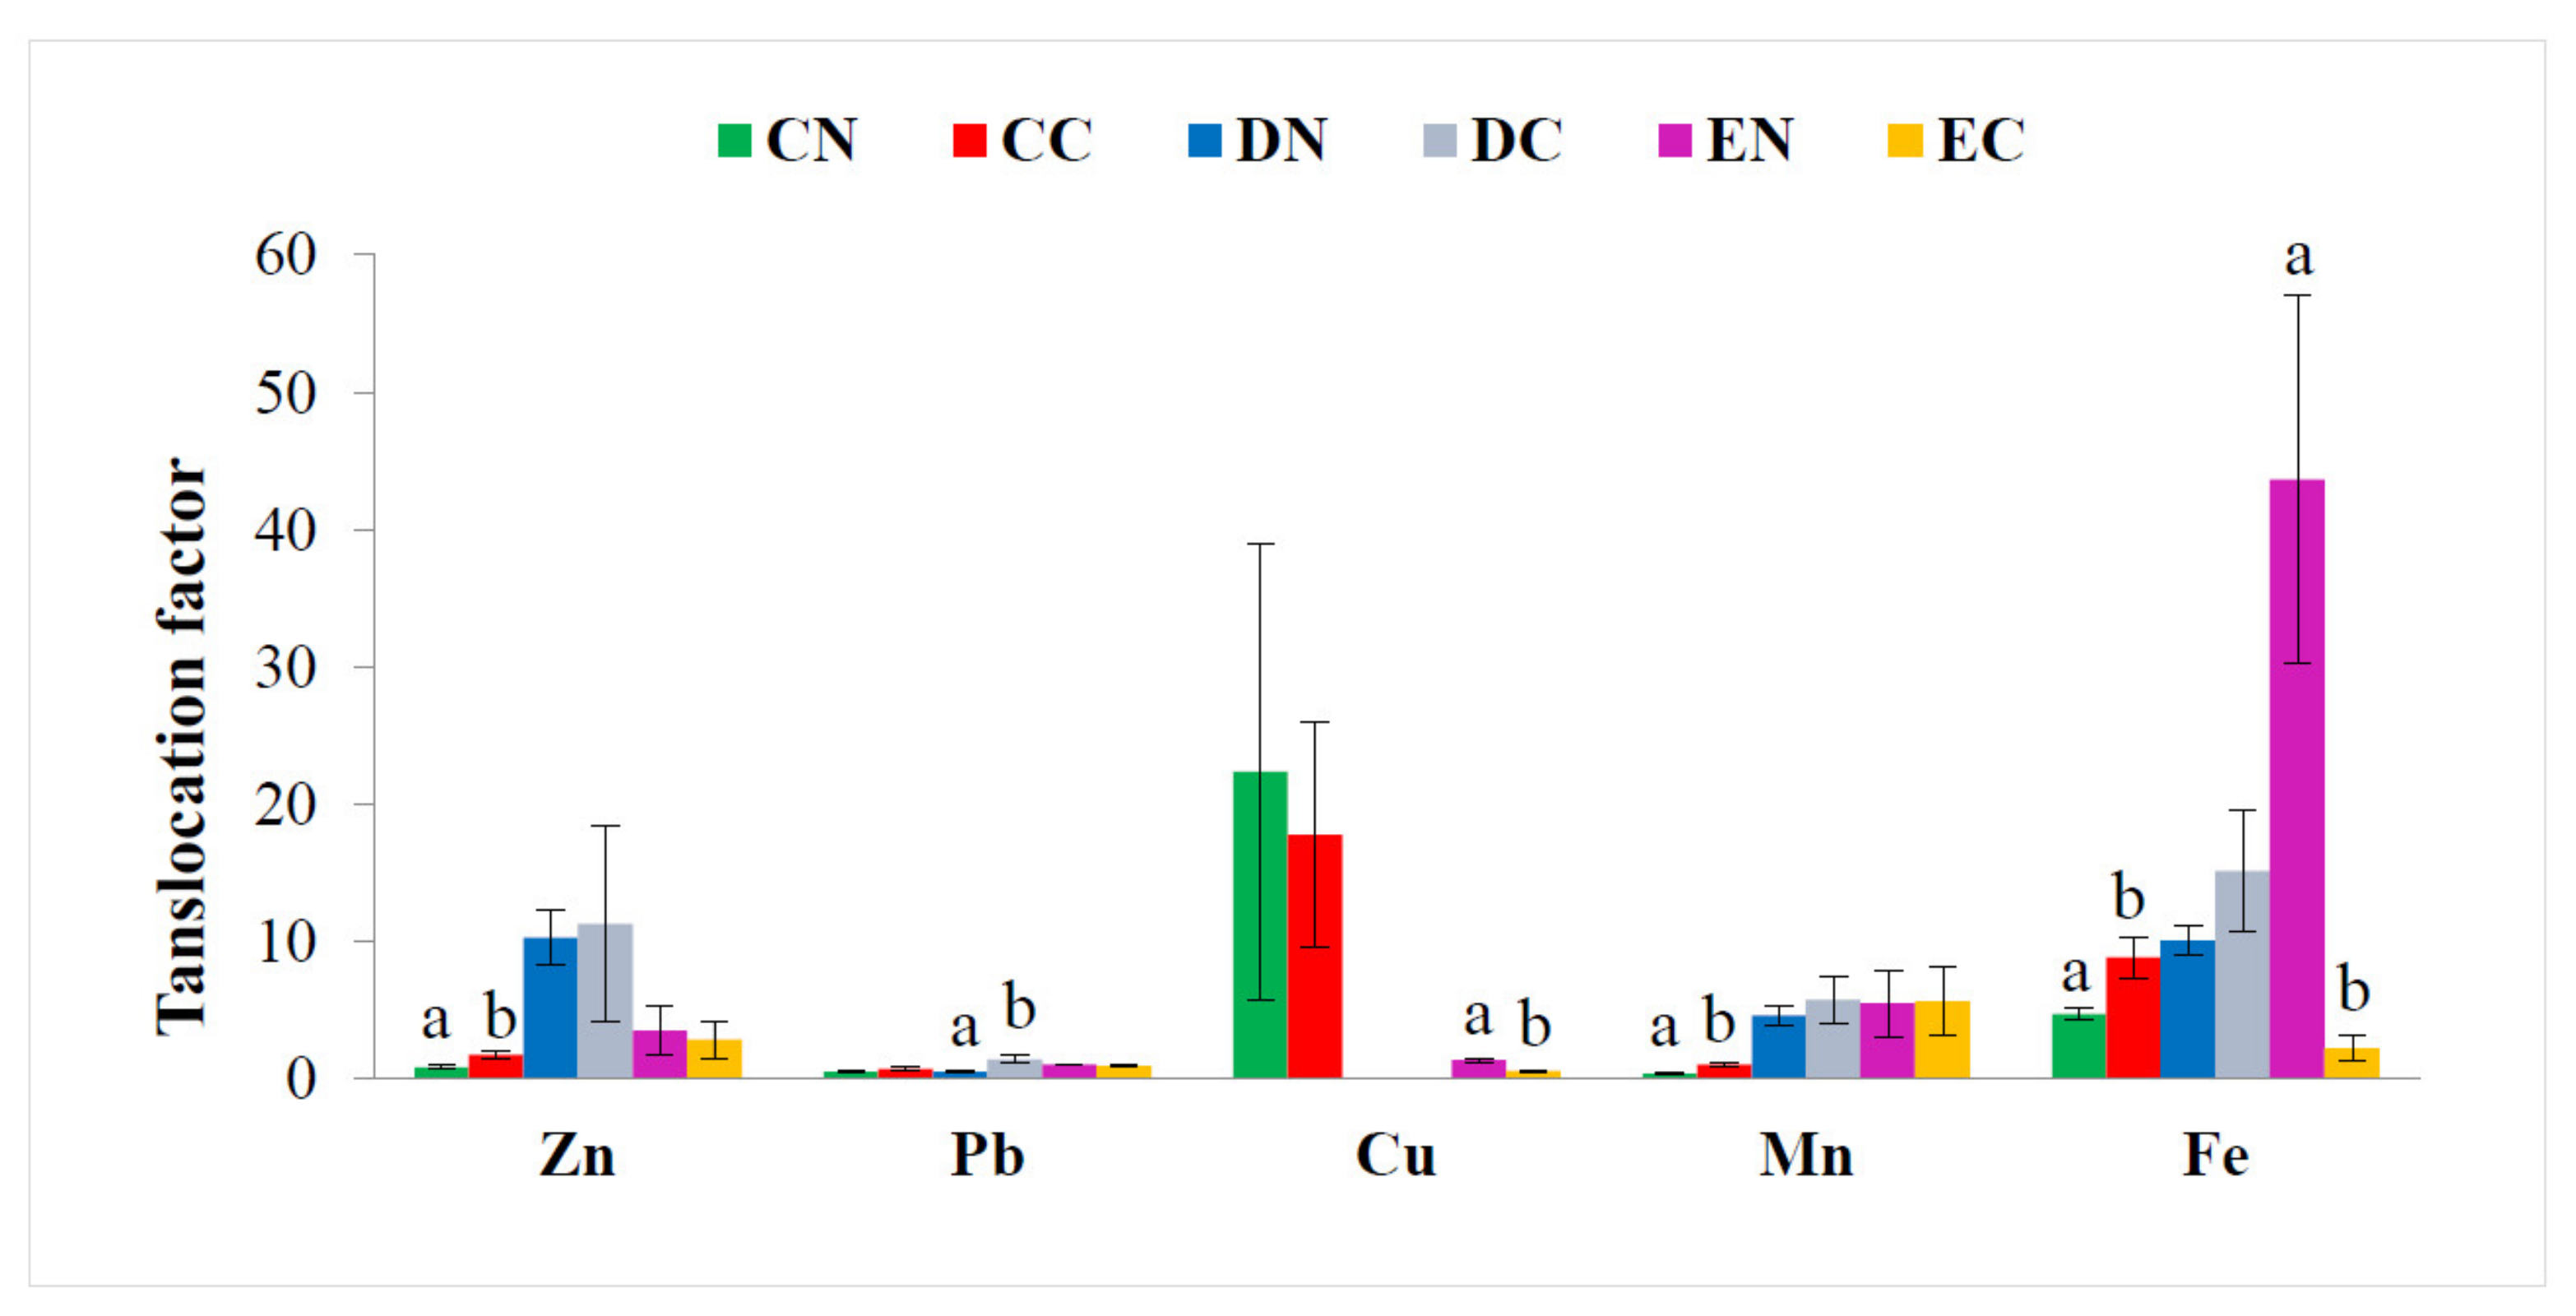
3.4. Efficiency in Plant-Element Accumulation

The values of the bioaccumulation factor in leaves (BCFl) and roots (BCFr) proved very low and in all cases less than 1 (Figure 2). The highest values were found in the samples of uncontaminated soils, both for BCFl and BCFr but only with significant differences for D. viscosa in all the elements analyzed in leaves, and for Zn, Pb, and Mn in roots. On the contrary, the translocation factor (TF) was in general higher in samples collected from contaminated soil than in samples from uncontaminated soils (Figure 3), except for E. pithyusa, in which all TF values were higher in individuals from uncontaminated soils, although significant differences were detected only for Cu and Fe. The TF value for Pb in D. viscosa was notable for being almost three-fold higher in contaminated soils than in non-contaminated ones. It stands out that both in contaminated and uncontaminated soil, the three species showed concentrations of Fe in roots that were considerably lower than in leaves.

3.5. Spearman Correlation

Significant linear correlations appeared among paired leaf, root, and soil concentrations for all samples combined (contaminated and uncontaminated soils; Table S2). These correlations proved more frequent in the soil than in the leaves and roots. The correlations in soil were significantly positive among all the elements, Fe standing out for being correlated with all the elements studied. In leaves and roots, the significant correlations were striking between Fe and Pb and between Cu and Zn. Positive correlations were observed between the concentrations of Pb and Zn in leaves and negative between Pb and Cu in roots. The correlations between the trace elements studied were positive in leaf between Pb and Zn, Mn and Fe, and between Cu and Mn. However, in roots, a lower number of correlations resulted, although Fe continued to be related to Pb, Cu, and Mn.

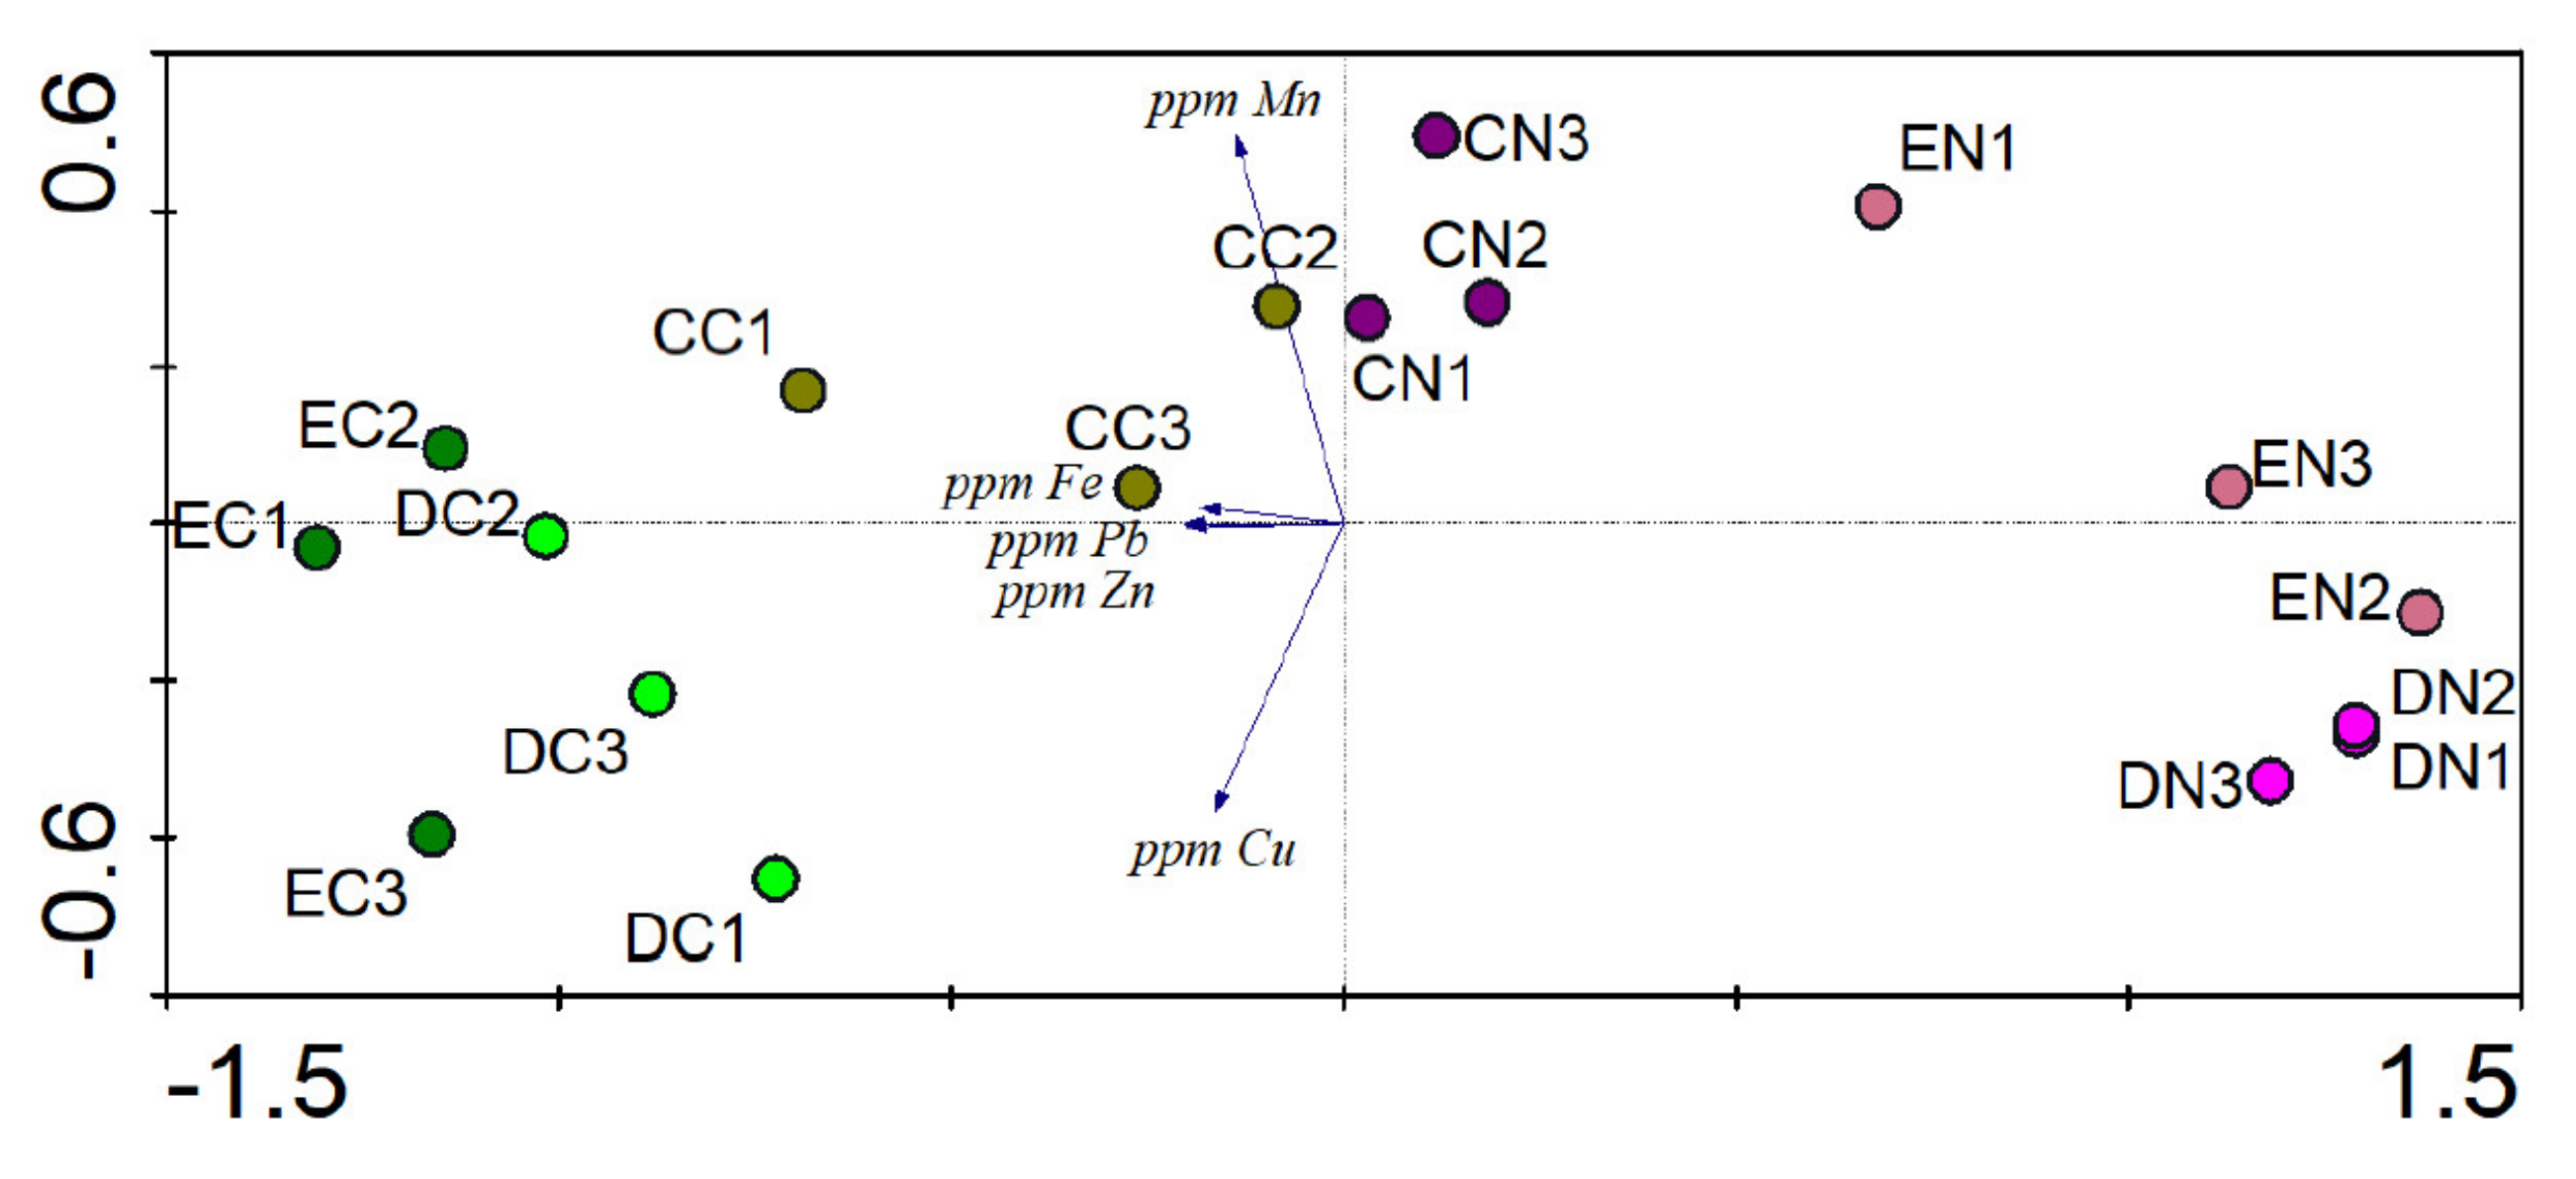
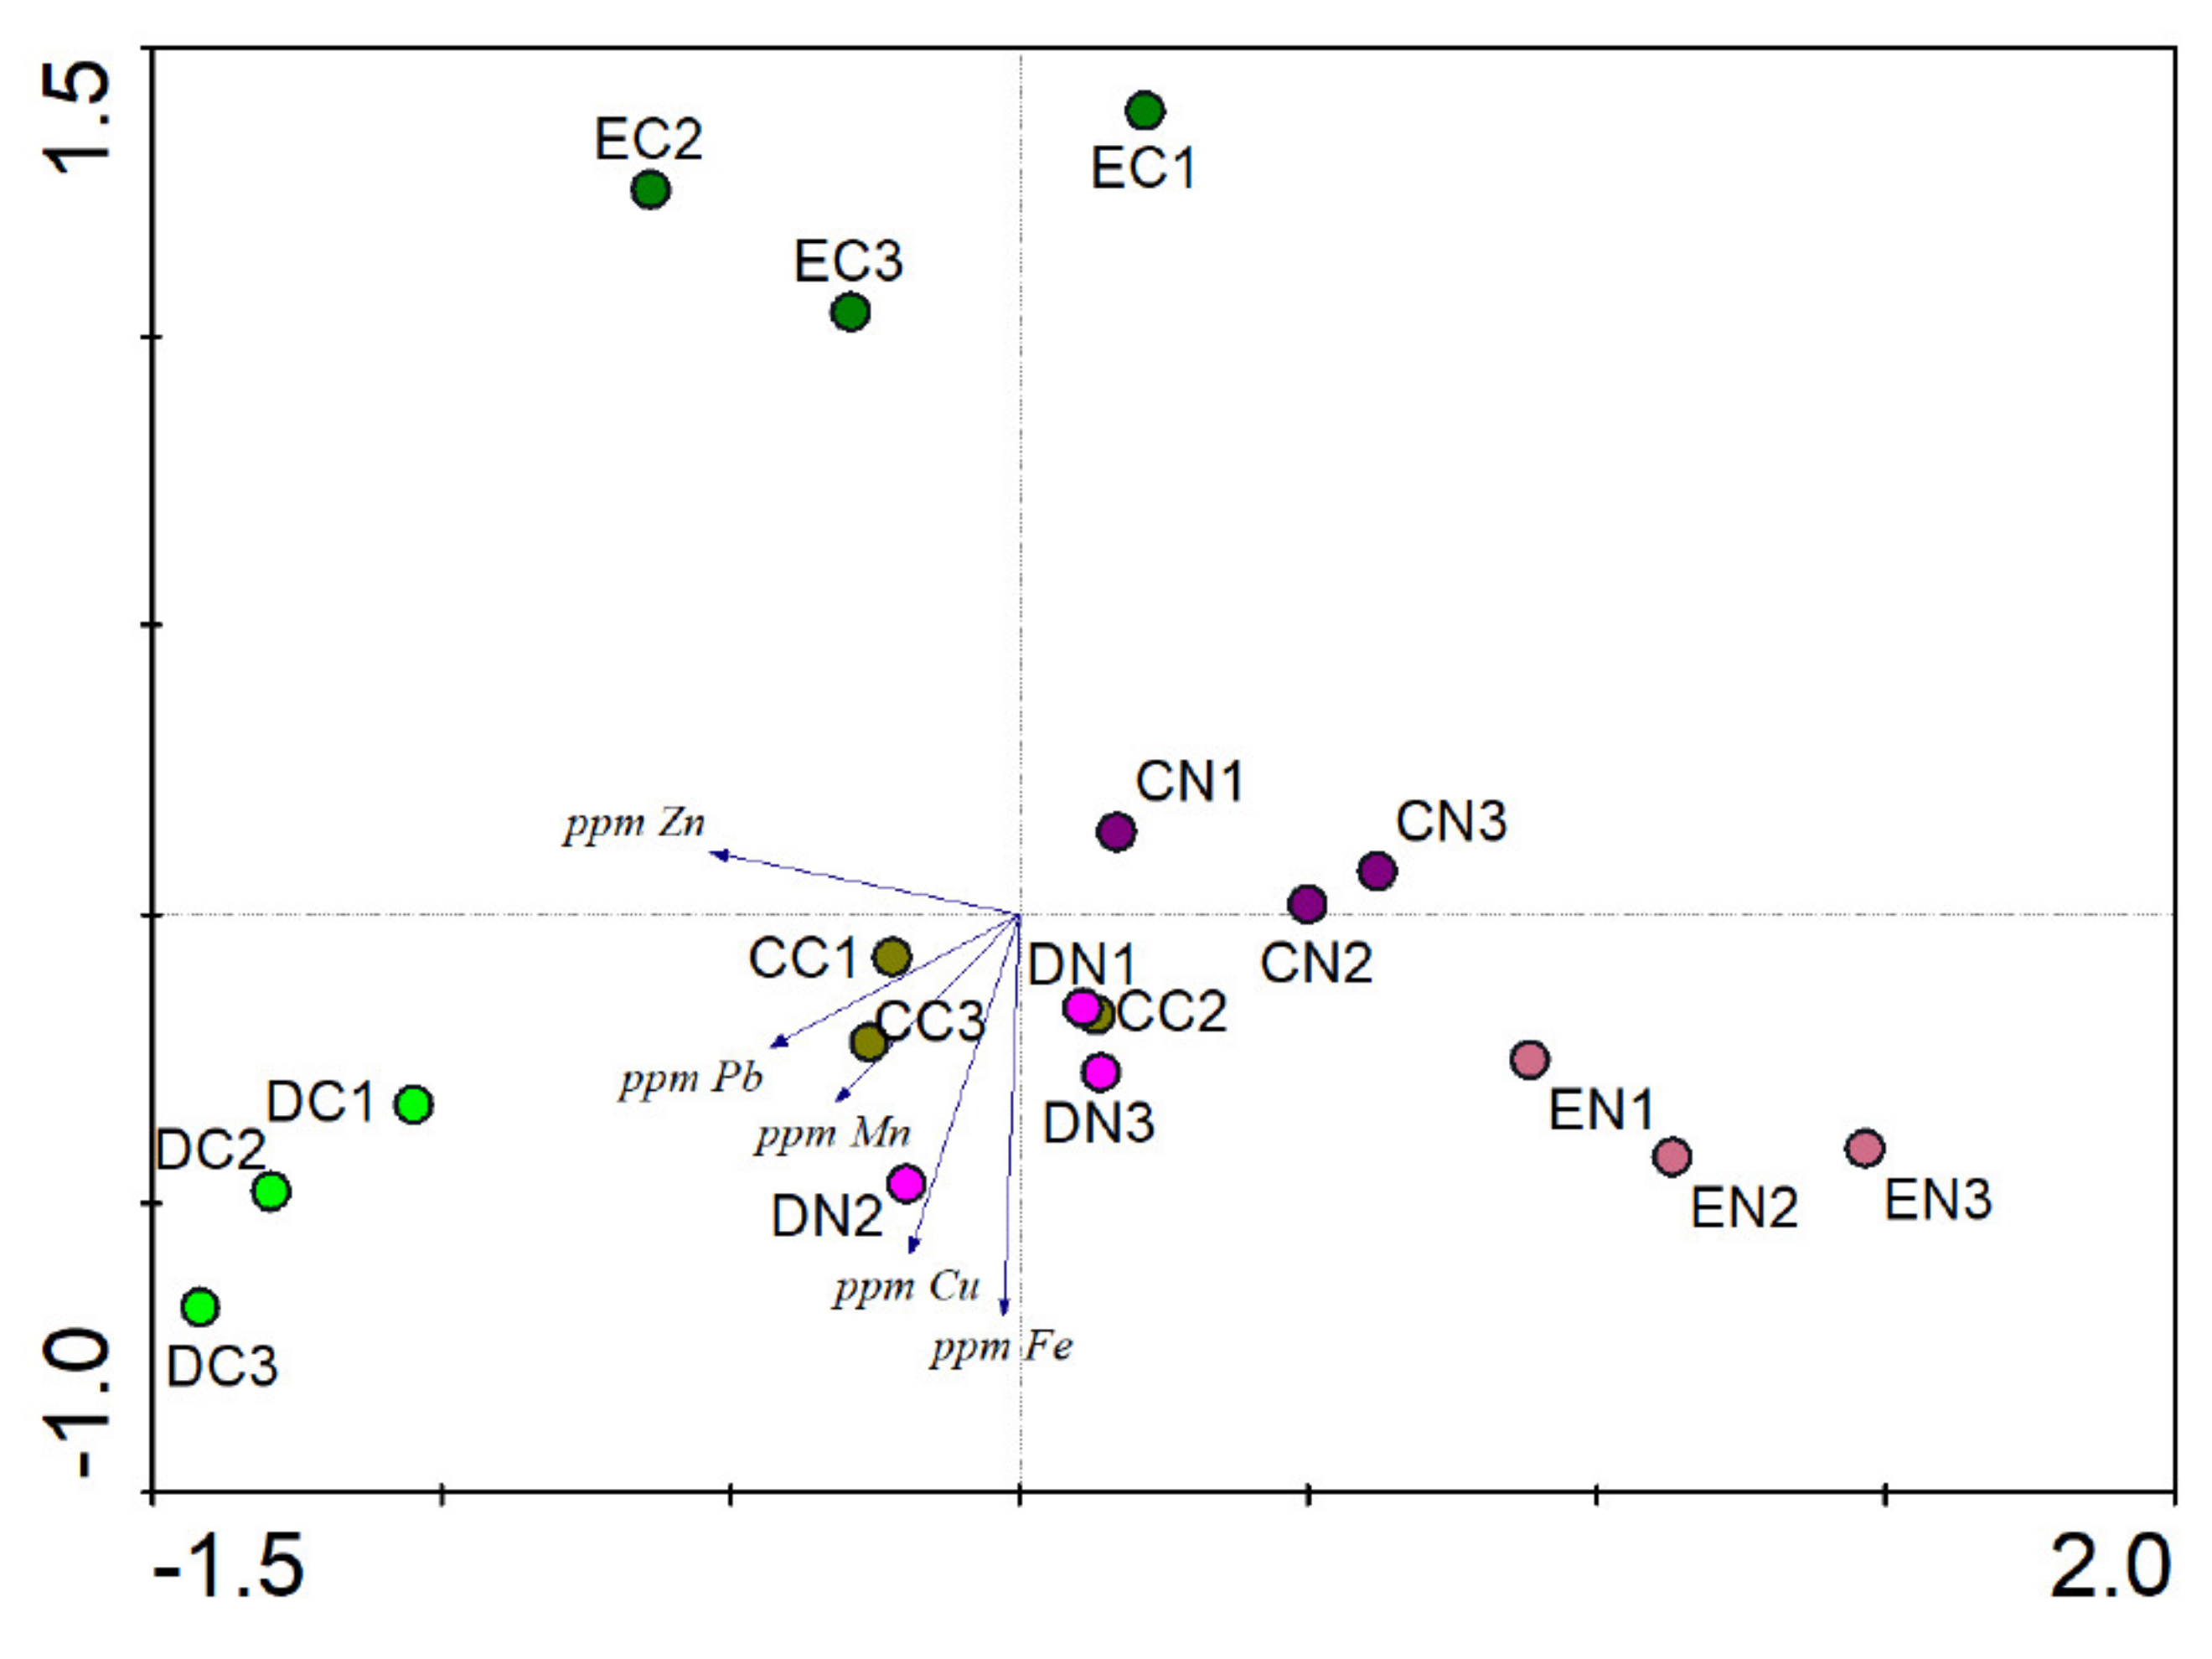
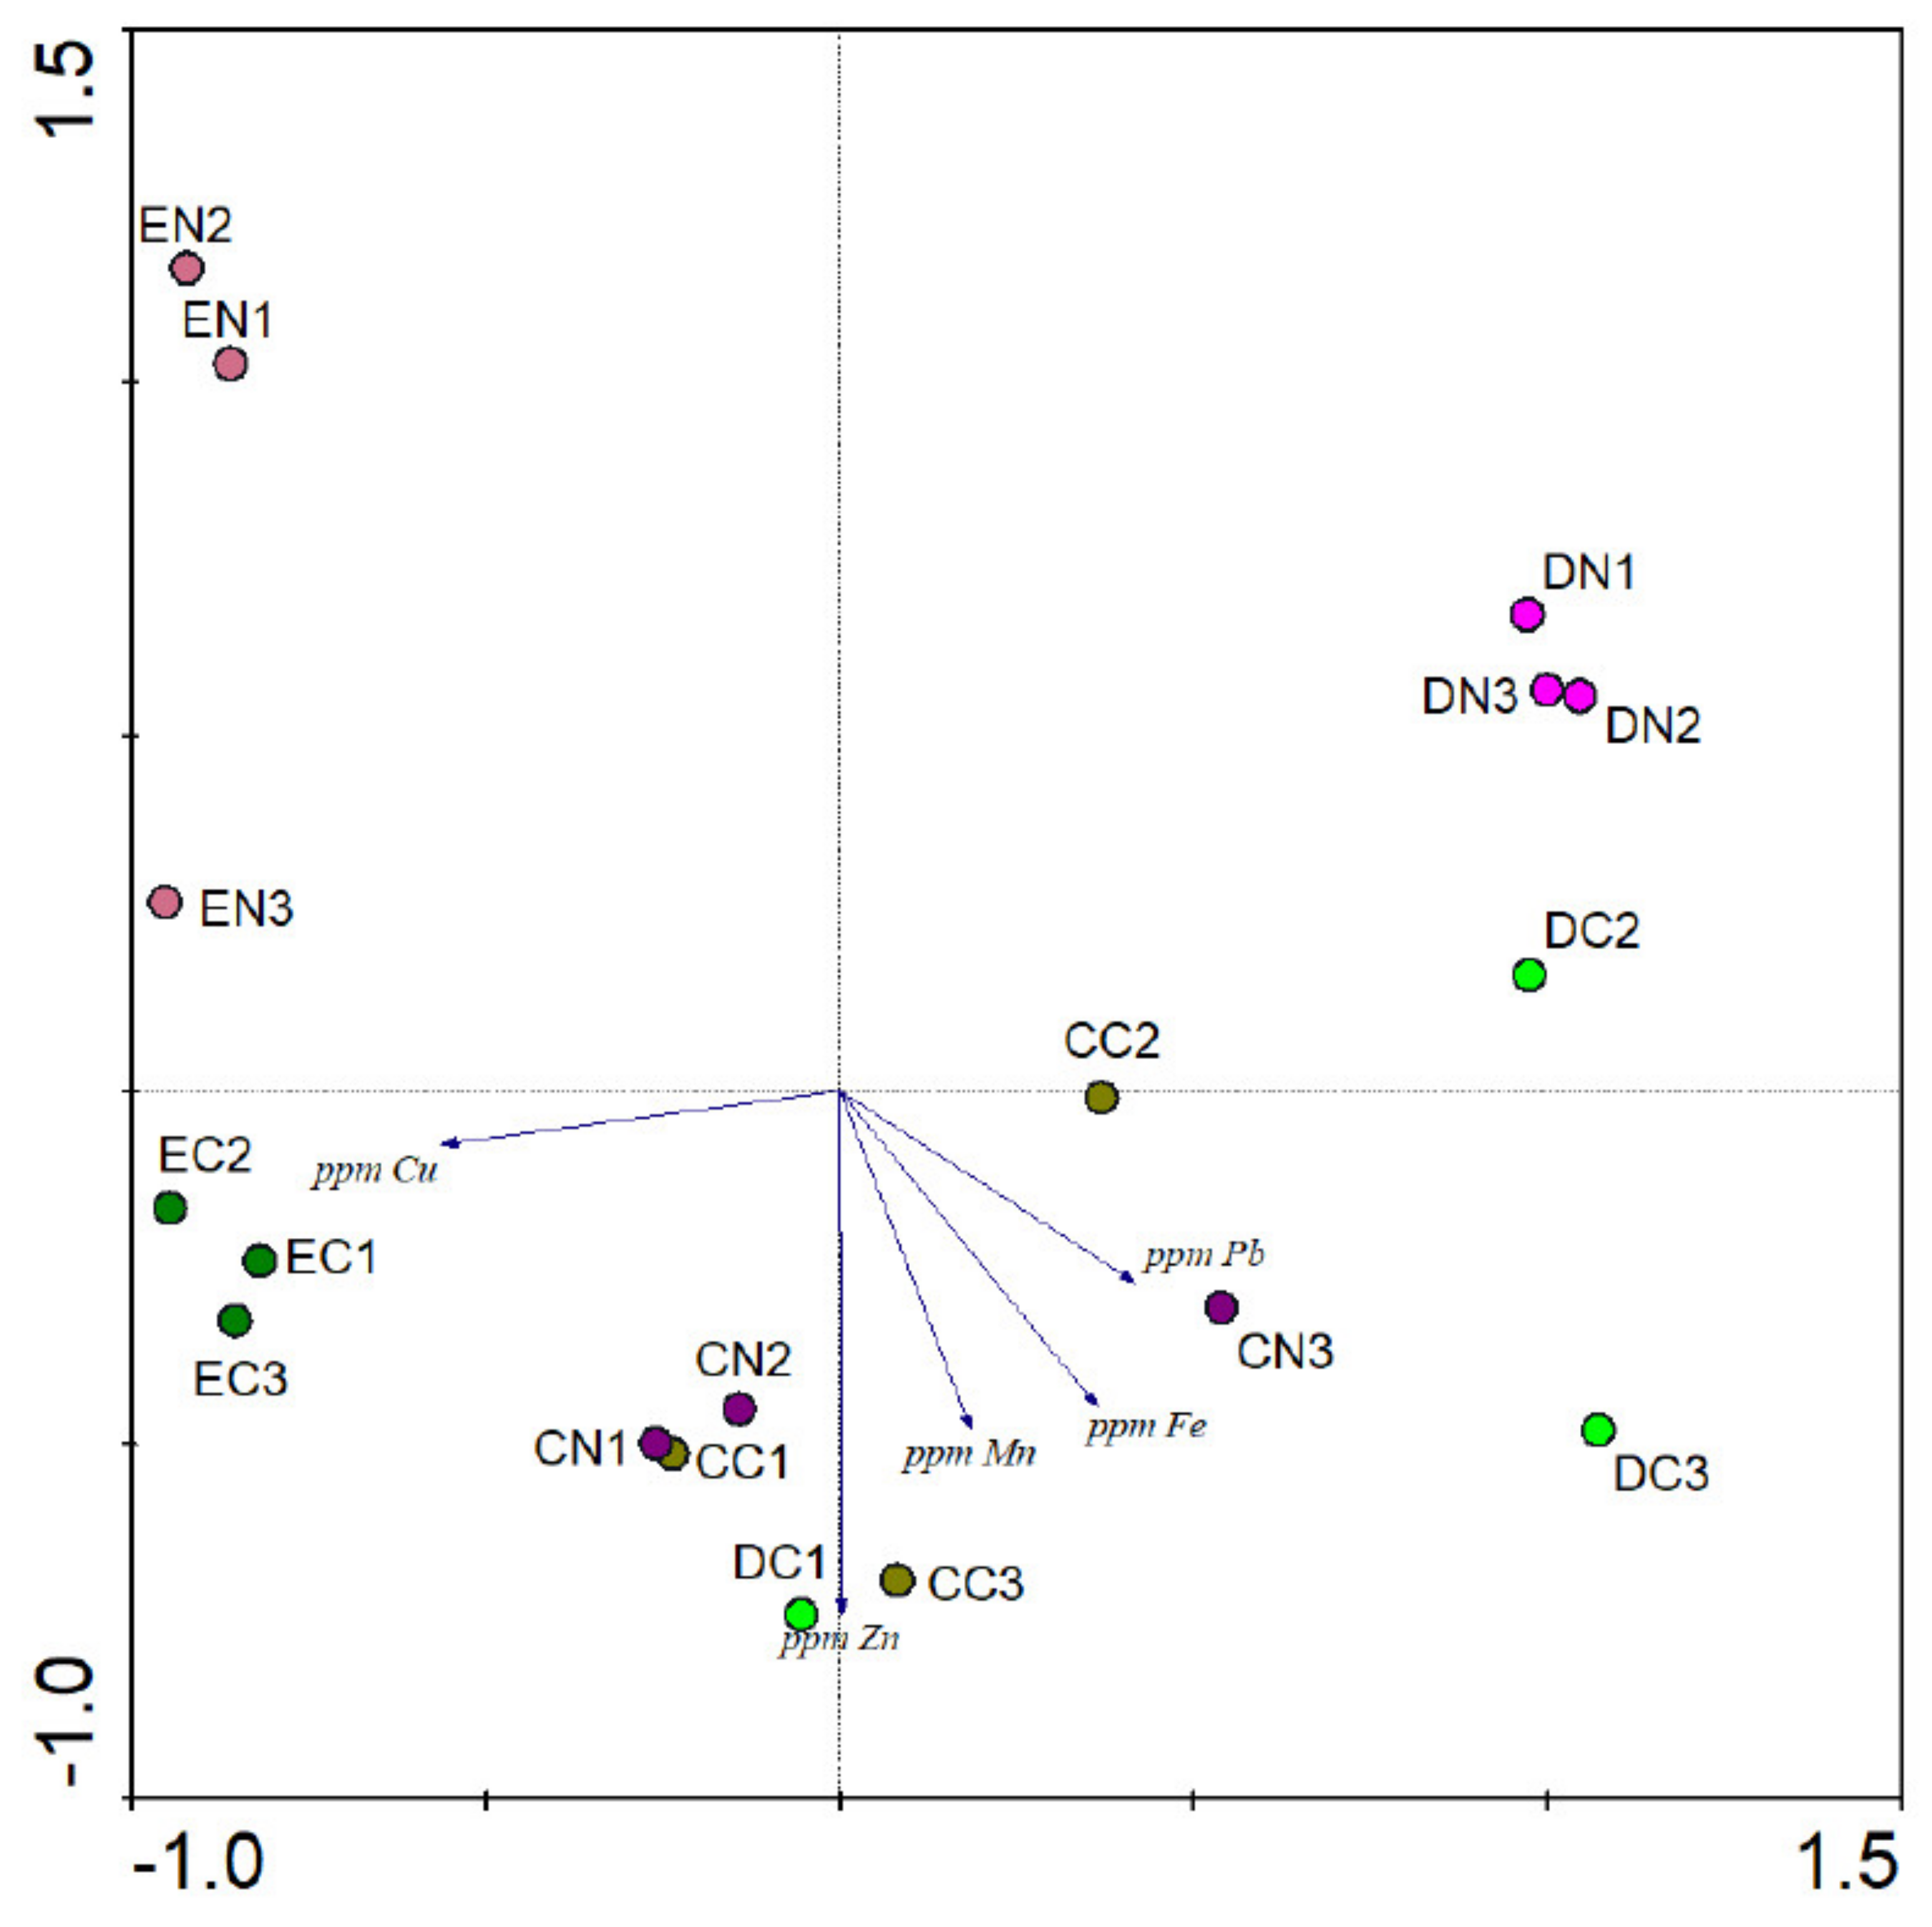
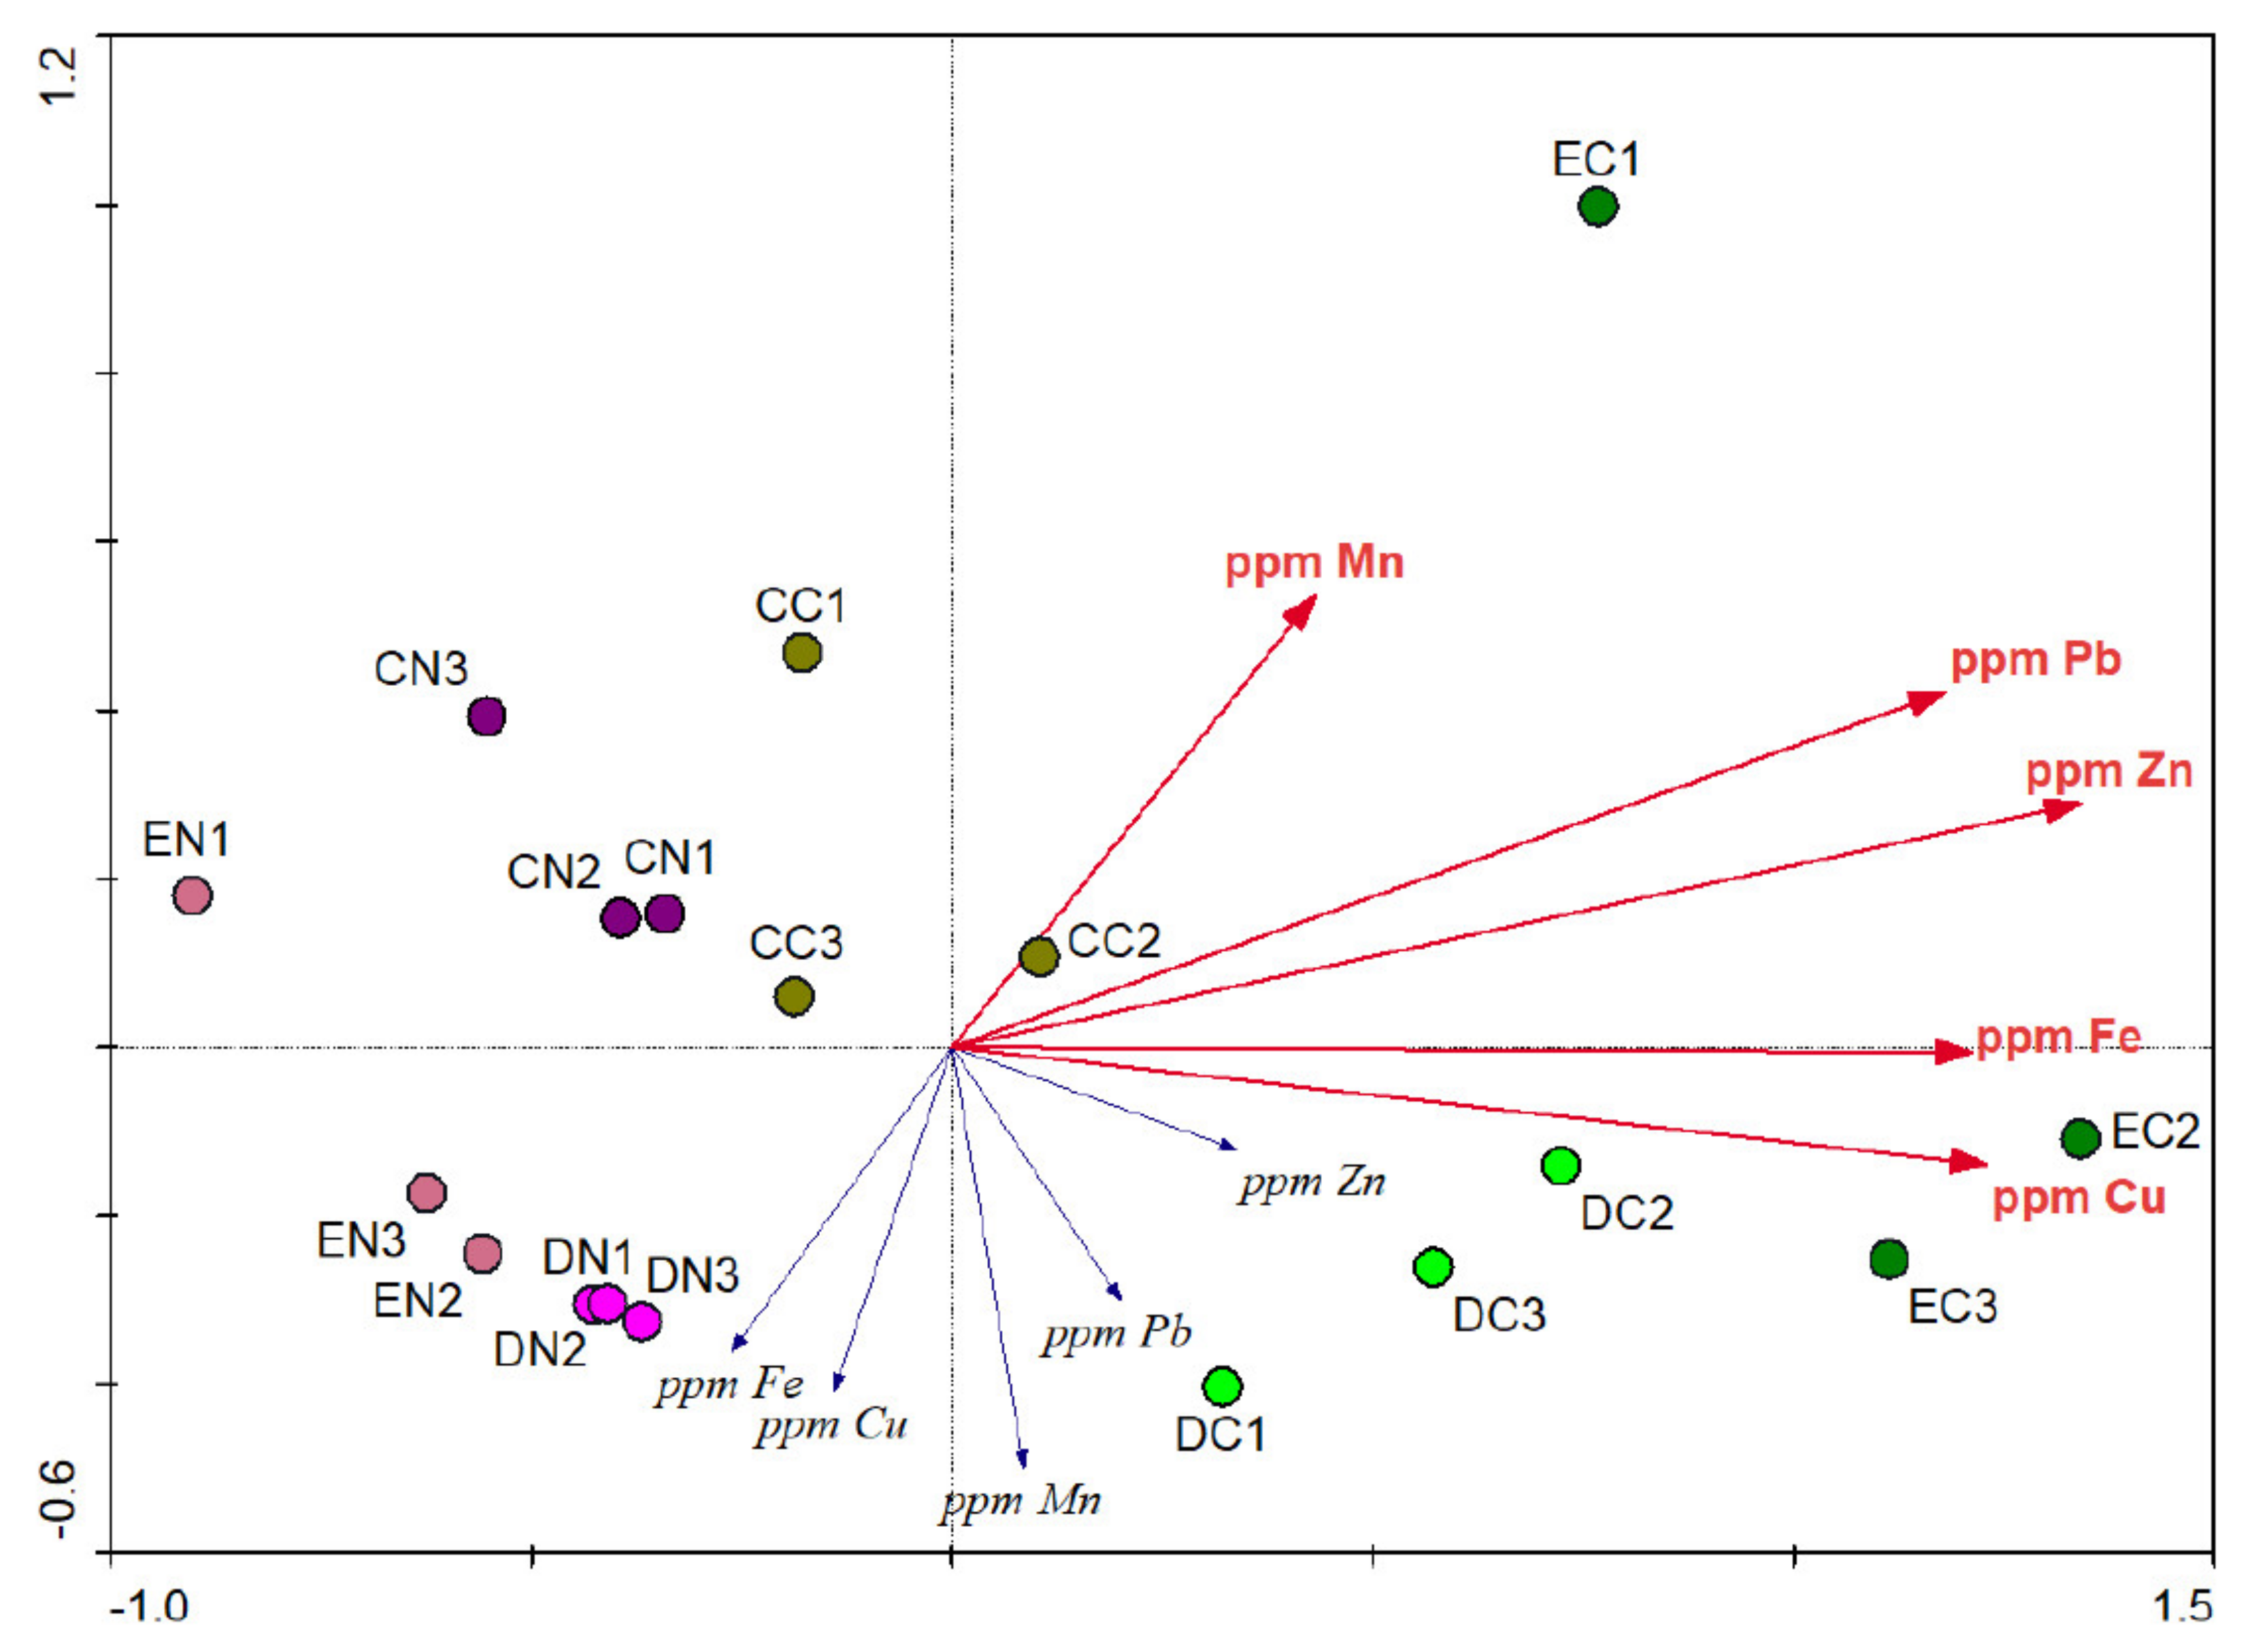
3.6. Spatial Ordination

The principal component analysis (PCA) performed with the all trace-element concentrations of the soils analyzed as a whole clearly separated the contaminated soils from the uncontaminated ones under D. viscosa and E. pithyusa (Figure 4). These contaminated samples had the highest concentrations of Fe, Pb, and Zn with respect to the uncontaminated ones. However, differences among contaminated and uncontaminated soils for C. salviifolius samples were less evident, with high Mn concentrations and low Cu concentrations, than in soils under the other two plant species. The PCA ordination diagram drawn with the concentrations of trace elements in leaves for the three species (Figure 5) reflects again a clear spatial separation between the leaf trace-element samples of D. viscosa and E. pithyusa, while this difference was far less noticeable in the case of C. salviifolius, signifying that the amount of metals in leaves was similar in both cases, although plants growing on contaminated soils displayed slightly higher amounts. D. viscosa accumulated the highest quantities of leaf Pb and Mn in contaminated soils, followed of Zn and Cu, while E. pithyusa accumulated more leaf Zn under contaminated soils, and more Fe and Cu in the uncontaminated ones.
The PCA performed with the concentrations of trace elements in roots for the three plant species (Figure 6) did not show a clear separation between C. salviifolius in contaminated and uncontaminated soils. In general, samples of E. pithyusa and D. viscosa under contaminated and uncontaminated soil were separated although to a lesser extent than for the foliar trace elements. In contaminated soils, D. viscosa was the highest root accumulator of Fe, Pb, Mn, and Zn, while E. pithyusa accumulated the most Cu. These two species growing in uncontaminated soil registered low metal accumulation in the roots while E. pithyusa had the lowest root concentration of Pb.
According to the redundancy analysis (RDA) diagram performed for the trace-element concentration in leaves and in soil (Figure 7), Zn in the soil was the only element that significantly explained the variability in leaf concentrations (Lambda A = 0.33; F = 7.81; P = 0.004). In general, no relationship was found between the soil concentrations and leaf concentrations, taking into account all the samples and plant species as a whole. A negative correlation was established between the Mn concentration in the soil and the concentration of Fe, but the correlation was weaker for Cu in leaves. Zn in leaves appeared to be related to some extent to Cu in soil and somewhat less to Fe. According to the RDA performed for the trace-element concentration in roots and soil, the concentration of the roots could not be explained as a function of the soil concentrations, since no statistical significance was found.

4. Discussion

The content of trace elements in the soils analyzed varied markedly due to the long history of mining in the area [2,3,28]. Meanwhile, plant species that apparently grew in areas outside the spoil heaps accumulated high contents of some trace elements, e.g., Mn in soils under C. salviifolius (see Table 1), which accounts for the high concentrations of this element that were found, especially in its roots (Table 3). The Mn determined the distribution of the C. salviifolius samples in contaminated and uncontaminated soil, as reflected in the PCA ordination diagrams for soils and roots (Figure 4 and Figure 6).
The element with highest soil concentrations of all those analyzed was Fe, which was found mainly in the form of oxides and hydroxides as small particles, or associated in amorphous form with the surfaces of other minerals [4,28,44]. Fe correlated with the rest of the elements studied in the soil (Table S2 in Supplementary Material), linking all the trace elements studied in the mining area. This element was also correlated with Pb, Cu, and Mn in roots and leaves whereas Fe and Zn did not correlate in these plant organs, as pointed out by previous authors [44].
After Fe, the next most concentrated trace elements in the soils were Zn and Mn. The concentrations found in these two elements were, in general, higher than those reported by [28] in soils from sites close to our study area. However, the standard deviation of the means proved similar to ours, confirming again the great heterogeneity of the area, which, on the other hand, made it ideal for this type of study, since it provided highly variable concentrations and gradients. The Zn concentration in all of the contaminated soils under C. salviifolius as well as in uncontaminated soil exceeded 1500 mg Kg −1, the permissible threshold value established for industrial soils in Italy, DLgs 152/06 [17].
Moreover, the Pb concentration in our study was higher than observed by other authors in Sardinia [23,28], values falling within the range indicated by [17] and researchers examining sediments [26]. The concentration of Pb was higher in all the contaminated soils, and in the case of C. salviifolius also in uncontaminated soils, than that established as the permissible threshold value for industrial soils in Italy, DLgs 152/06 [17]. Cu values were low, but similar to those reported by [21] in Naples, or those indicated by [28] in the least polluted places in the Emilia-Romagna region.
The leaves and roots of D. viscosa registered concentrations of Zn and Pb similar to those observed by [23], in plants growing in soils of Sardinia, although in the soils studied by these authors the concentrations were lower. In other studies [28] the concentrations were lower than those found in the present study.
The bioaccumulation factors in leaves and roots (BCFl and BCFr) resembled those noted by other authors [23,28] but were less than 1 in all cases. However, the BCFr values of Pb for D. viscosa in non-contaminated soils were very close to 1. Moreover, in E. pithyusa, higher BCF values for Pb and Cu appeared in non-contaminated soils than in the rest of localities and plant species. This could be due to the high concentrations of trace elements in contaminated soils that saturate the plant’s capacity to store these elements in its tissues. However, when the concentration in soil is lower, the relationship with the concentration in the plant increases and the bioaccumulation factor approaches 1. Although the use of these factors is widespread in the literature, some [17,45] have pointed out the dependence of these accumulation factors with the soil concentrations since they can lead to a false interpretation of the analytical data, especially when the plants grow in highly contaminated soils such as spoil heaps presented in this manuscript. Some authors [44,46] have pointed out that the Zn concentration in the root is usually higher than in the aerial part of the plants, especially in soils with high concentrations of this element. However, our analyses indicated less Zn in roots than in leaves (Table 2 and Table 3; Figure 5 and Figure 6), especially in D. viscosa and E. pithyusa from contaminated soils. This coincides with findings by other authors who have worked at sites close to the study area [3,28] and have indicated high Zn concentrations in leaves.
The translocation factor for Zn was greater than 1 for all the samples studied except for C. salviifolius collected in uncontaminated soils (Figure 3) and with values greater than 10 for D. viscosa in all the soils studied. These values are higher than those found by [28], but the concentrations in soils and plants indicated by these authors were also lower. The translocation factor was also greater than 1 in D. viscosa for the rest of the elements studied, except for Pb in uncontaminated soils. As Pb is hardly mobile in plant tissues and has a tendency to accumulate in the roots, Reference [47] reported that only 3% of the Pb in the roots is transported to the leaves. However, Cu, being an essential element for plants, can be immediately absorbed by the roots and redistributed and forms a component of key enzymes in physiological processes [44]. In fact, our results showed Cu to be one of the elements with the highest translocation factors, especially in C. salviifolius and D. viscosa. The high translocation factors observed in these species make them especially suitable for uses related to the extraction of assimilable elements, since the aerial biomass is easier to eliminate than the roots. On the other hand, the redistribution of trace elements through the plant tissues increases the possibility of their accumulation and stabilization, increasing their value for use in gentle remediation projects.
The Zn pool calculated for D. viscosa reached high values (Table 4). Given the biomass developed by the plant, the total amounts of the other elements studied were also noteworthy. This supports that D. viscosa has suitable traits to be used as a phytoextractor. Although it failed to reach values of BCFl> 1, it did have other characteristics that should be taken into account, such as a high TF for Pb, Cu, and Mn, together with a large biomass that favors a considerable total extraction of trace elements. Moreover, D. viscosa has the ability to adapt to these contaminated areas, as pointed out by other authors [17]. This large biomass makes D. viscosa a good candidate for use in gentle remediation, as plant species from contaminated media frequently have a small biomass since they use more energy in the mechanisms necessary to adapt to the high concentrations of metals in their tissues [44]. In this sense, the effectiveness of phytoremediation depends on multiple factors including soil characteristics and depth [24], degree of contamination, and trace elements involved, as well as on the plant species with large aboveground biomass capable of bioaccumulating metals and vigorously transferring them from roots to the aerial part [6,48].
The management of contaminated soil is one of the environmental priorities and challenges worldwide including Europe [16]. Phytoremediation has been questioned due to the difficulties for its efficiency of use at an industrial level, even if the accumulated metal can be reused (phytomining). In this sense, Reference [49] has pointed out the challenge to the “phyto” community is to find a new “non-phyto” term that describes the betterment of the stressed environments through biological manipulation, perhaps shifting the focus from clean-up to palliative care.

5. Conclusions

Despite being a species with a smaller distribution in the Mediterranean region, E. pithyusa is capable of developing in the soils that presented the highest concentrations of trace metals.
In the leaves of D. viscosa, the highest concentrations were found for all trace elements except for Fe. In general, the concentration of trace elements in roots is lower than in leaves in D. viscosa and E. pithyusa while in C. salviifolius occurs the opposite, especially in uncontaminated soils.
The concentration of all trace elements in leaves was higher in contaminated soil than in uncontaminated soil. However, in roots it was significantly higher in uncontaminated soil except for Zn.
The bioaccumulation factor in both leaves and roots presented values lower than 1, being in most cases higher in uncontaminated soils. Therefore, these plants cannot be used as phyto-extractors, at least in media with concentrations of trace elements as high as those in this study.
The plant translocation factor was in general higher in samples collected from contaminated soil than in samples from uncontaminated soils, except for E. pithyusa. The TF value for Pb in D. viscosa was notable for being almost three-fold higher in contaminated soils than in non-contaminated ones. This specie accumulates high concentrations of trace elements in both leaves and roots, in addition to having a considerable biomass.
The characteristics of the plant species studied in this work make them good candidates for gentle-remediation techniques in polluted areas under Mediterranean climatic. Furthermore, since they are adapted to living in polluted areas with a variable range of elements and concentrations, they develop a considerable biomass that is only slightly affected by pollution and have the ability to accumulate significant amounts of trace elements in their root system and especially in their aerial part.

Supplementary Materials

The following are available online at https://www.mdpi.com/2076-3417/11/4/1769/s1. Table S1: Basic information on the sampling sites. CN= Cistus salviifolius samples from uncontaminated soils, CC= C. salviifolius samples from contaminated soils, DN= Dittrichia viscosa samples from uncontaminated soils, DC= D. viscosa samples from contaminated soils, EN= Euphorbia pithyusa samples from uncontaminated soils EC= E. pithyusa samples from contaminated soils. Table S2: Correlation analyses made using different trace elements (Zn, Pb, Cu, Mn, and Fe) on leaf, root, and soil, showing the Spearman correlation coefficient (r). Statistical significance is indicated by asterisks (* = 0.01–0.05, ** = 0.01–0.001, ***<0.001).

Author Contributions

Conceptualization, M.N.J., G.B., F.B.N., M.C., and E.F.-O. data curation, M.N.J.; formal analysis, M.N.J., F.B.N., and E.F.-O.; methodology, M.N.J., G.B., F.B.N., M.C., and E.F.-O.; writing—original draft, M.N.J. and E.F.-O.; writing—review and editing, M.N.J., G.B., F.B.N., M.C., and E.F.-O. All authors have read and agreed to the published version of the manuscript.

Funding

This research was funded by Research Groups RNM-269 and RNM-207 (Junta de Andalucía, Spain).

Institutional Review Board Statement

Not applicable.

Informed Consent Statement

Not applicable.

Data Availability Statement

Not applicable.

Acknowledgments

The authors would like to thank Francisco J. Martín Peinado for their help with the portable field X-ray fluorescence analyzer NITON XLt 792. We would also like to thank D. Nesbitt for improving the English.

Conflicts of Interest

The authors declare no conflict of interest.

References

  1. Panagos, P.; Liedekerke, M.V.; Yigini, Y.; Montanarella, L. Contaminated sites in Europe: Review of the current situation based on data collected through a European Network. J. Environ. Public Health 2013, 2013, 158764. [Google Scholar] [CrossRef]
  2. Bacchetta, G.; Cao, A.; Cappai, G.; Carucci, A.; Casti, M.; Fercia, M.L.; Lonis, R. A field experiment on the use of Pistacia lentiscus L. and Scrophularia canina L. subsp. bicolor (Sibth. et Sm.) Greuter for the phytoremediation of abandoned mining areas. Plant Biosyst. 2012, 146, 1054–1063. [Google Scholar] [CrossRef]
  3. Jiménez, M.N.; Bacchetta, G.; Casti, M.; Navarro, F.B.; Lallena, A.M.; Fernandez-Ondoño, E. Potential use in phytoremediation of three plant species growing on contaminated mine-tailing soils in Sardinia. Ecol. Eng. 2011, 37, 392–398. [Google Scholar] [CrossRef]
  4. Jiménez, M.N.; Bacchetta, G.; Casti, M.; Navarro, F.B.; Lallena, A.; Fernández-Ondoño, E. Study of Zn, Cu and Pb content in plants and contaminated soils in Sardinia. Plant Biosyst. 2014, 148, 419–428. [Google Scholar]
  5. Bech, J. Phytoremediation of polluted soils. J. Geochem. Explor. 2012, 123, 1–2. [Google Scholar] [CrossRef]
  6. Asad, S.A.; Faroop, M.; Afzal, A.; West, H. Integrated phytobial heavy metal remediation strategies for a sustainable clean environment—A review. Chemosphere 2019, 217, 925–941. [Google Scholar] [CrossRef]
  7. Robinson, B.; Fernandez, J.E.; Madejon, P.; Maranon, T.; Murillo, J.M.; Green, S.; Clothier, B. Phytoextraction: An assessment of biogeochemical and economic viability. Plant Soil 2003, 249, 117–125. [Google Scholar] [CrossRef] [Green Version]
  8. Krisnayanti, B.D.; Anderson, C.W.N.; Utomo, W.H.; Feng, X.; Handayanto, E.; Mudarisna, N.; Ikram, H. Assessment of environmental mercury discharge at a four-year-old artisanal gold mining area on Lombok Island, Indonesia. J. Environ. Monit. 2012, 14, 2598–2607. [Google Scholar] [CrossRef] [PubMed]
  9. Mendez, M.O.; Maier, R.M. Phytostabilization of mine tailings in arid and semiarid environments—An emerging remediation technology. Environ. Health Perspect. 2008, 116, 278–283. [Google Scholar] [CrossRef] [Green Version]
  10. Baker, A.J.M.; Brooks, R.R. Terrestrial higher plants which hyperaccumulate metallic elements—A review of their distribution, ecology and phytochemistry. Biorecovery 1989, 1, 81–126. [Google Scholar]
  11. Poschenrieder, C.; Llugany, M.; Lombini, A.; Dinelli, E.; Bech, J.; Barceló, J. Smilax aspera L. an evergreen Mediterranean climber for phytoremediation. J. Geochem. Explor. 2012, 123, 41–44. [Google Scholar] [CrossRef]
  12. Pérez-Sirvent, C.; Martínez-Sánchez, M.J.; García-Lorenzo, M.L.; Bech, J. Uptake of Cd and Pb by natural vegetation in soils polluted by mining activities. Fresenius Environ. Bull. 2008, 17, 1666–1671. [Google Scholar]
  13. Wu, Q.; Leung, J.Y.S.; Huang, X.; Yao, B.; Yuan, X.; Ma, J.; Guo, S. Evaluation of the ability of black nightshade Solanum nigrum L. for phytoremediation of thallium-contaminated soil. Environ. Sci. Pollut. Res. 2015, 22, 11478–11487. [Google Scholar] [CrossRef] [PubMed]
  14. Guarino, C.; Sciarrillo, R. The effectiveness and efficiency of phytoremediationof a multicontaminated industrial site: Porto Marghera (Venice Lagoon, Italy). Chemosphere 2017, 183, 371–379. [Google Scholar] [CrossRef] [PubMed]
  15. McGrath, S.P.; Chaudri, A.M.; Giller, K.E. Long-term effects of metals in sewage sludge on soils, microorganisms and plants. J. Ind. Microbiol. Biotechnol. 1995, 14, 94–104. [Google Scholar] [CrossRef]
  16. Onwubuya, K.; Cundy, A.; Puschenreiter, M.; Kumpiene, J.; Bone, B.; Greaves, J.; Teasdale, P.; Mench, M.; Tlustos, P.; Mikhalovsky, S.; et al. Developing decision support tools for the selection of “gentle” remediation. Sci. Total Environ. 2009, 407, 6132–6142. [Google Scholar] [CrossRef] [PubMed]
  17. Marchiol, L.; Fellet, G.; Boscutti, F.; Montella, C.; Mozzi, R.; Guarino, C. Gentle remediation at the former “Pertusola Sud” zinc smelter: Evaluation of native species for phytoremediation purposes. Ecol. Eng. 2013, 53, 343–353. [Google Scholar] [CrossRef]
  18. ITRC. Phytotechnology Technical and Regulatory Guidance and Decision Trees, Revised; PHYTO-3. Phytotechnologies Team, Tech Reg Update; Interstate Technology & Regulatory Council: Washington, DC, USA, 2009. [Google Scholar]
  19. Lacalle, R.G.; Aparicio, J.D.; Artetxe, U.; Urionabarrenetxea, E.; Polti, M.A.; Soto, M.; Garbisu, C.; Becerril, J.M. Gentle remediation options for soil with mixed chromium (VI) and lindane pollution: Biostimulation, bioaugmentation, phytoremediation and vermiremediation. Heliyon 2020, 6, e04550. [Google Scholar] [CrossRef]
  20. Bardos, P.; Andersson-Skol, Y.; Blom, S.; Keuning, S.; Pachon, C.; Track, T.; Wagelmans, M.; Cundy, A.; McDaniel, P.; Mahoney, M. Brownfifields, Bioenergy and Biofeedstocks, and Green Remediation. In Proceedings of the 10th International UFZ-Deltares/TNO conference on Soil: Water systems (CONSOIL), Special Sessions, Milan, Italy, 3–6 June 2008; pp. 3–10. [Google Scholar]
  21. Guarino, C.; Zuzolo, D.; Marziano, M.; Baiamonte, G.; Morra, L.; Benotti, D.; Gresia, D.; Robortella Stacul, E.; Cicchella, D.; Sciarrillo, R. Identification of native-metal tolerant plant species in situ: Environmental implications and functional traits. Sci. Total Environ. 2019, 650, 3156–3167. [Google Scholar] [CrossRef]
  22. Parraga-Aguado, I.; González-Alcaraza, M.N.; Álvarez-Rogel, H.; Conesa, H.M. Assessment of the employment of halophyte plant species for thephytomanagement of mine tailings in semiarid áreas. Ecol. Eng. 2014, 71, 598–604. [Google Scholar] [CrossRef]
  23. Barbafieri, M.; Dadea, C.; Tassi, E.; Bretzel, F.; Fanfani, L. Uptake of heavy metals by native species growing in a mining area in Sardinia, Italy: Discovering native flora for phytoremediation. Int. J. Phytoremediat. 2011, 13, 985–997. [Google Scholar] [CrossRef] [PubMed]
  24. Golestanifard, A.; Puschenreiter, M.; Aryan, A.; Jakob Santner, J.; Wenzel, W.W. Metal accumulation and rhizosphere characteristics of Noccaea rotundifolia ssp. cepaeifolia. Environ. Pollut. 2020, 266, 115088. [Google Scholar] [CrossRef]
  25. Melendo, M.; Benítez, E.; Nogales, R. Assessment of the feasibility of endogenous Mediterranean species for phytoremediation lead contaminates areas. Fresenius Environ. Bull. 2002, 11, 1105–1109. [Google Scholar]
  26. Saba, D.; Manouchehri, N.; Besançon, S.; El Samadc, O.; Khozam, R.B.; Kassir, L.N.; Kassouf, A.; Chebib, H.; Ouaini, N.; Cambier, P. Bioaccessibility of lead in Dittrichia viscosa plants and risk assessment of human exposure around a fertilizer industry in Lebanon. J. Environ. Manag. 2016, 250, 109537. [Google Scholar] [CrossRef]
  27. Parolin, P.; Ion-Scotta, M.; Bresch, C.G. Biology of Dittrichia viscosa, a Mediterranean ruderal plant: A review. J. Exp. Bot. 2014, 83, 251–262. [Google Scholar]
  28. Buscaroli, A.; Zannoni, D.; Menichetti, M.; Dinelli, E. Assessment of metal accumulation capacity of Dittrichia viscosa (L.) Greuter in two different Italian mine areas for contaminated soils remediation. J. Geochem. Explor. 2017, 182, 123–131. [Google Scholar] [CrossRef]
  29. Boni, M.; Costabile, S.; De Vivo, B.; Gasparrini, M. Potential environmental hazard in the mining district of southern Iglesiente (SW Sardinia, Italy). J. Geochem. Explor. 1999, 67, 417–430. [Google Scholar] [CrossRef]
  30. Angiolini, C.; Bacchetta, G.; Brullo, S.; Casti, M.; Giusso del Galdo, G.; Guarino, R. The vegetation of the mining dumps in SW Sardinia. Feddes Repert. 2005, 116, 243–276. [Google Scholar] [CrossRef]
  31. Cidu, R.; Biagini, C.; Fanfani, L.; La Ruffa, G.; Marras, I. Mine closure at Monteponi (Italy): Effect of the cessation of dewatering on the quality of shallow groundwater. Appl. Geochem. 2011, 16, 489–502. [Google Scholar] [CrossRef]
  32. RAS Regione Autonoma della Sardegna. Piano di Bonifica Siti Inquinati. 2003. Available online: http://www.regione.sardegna.it/documenti/1_39_20051011121758.pdf (accessed on 10 May 2015).
  33. Cidu, R.; Biddau, R.; Fanfani, L. Impact of past mining activity on the quality of groundwater in SW Sardinia (Italy). J. Geochem. Explor. 2009, 100, 125–132. [Google Scholar] [CrossRef]
  34. IUSS Working Group WRB. World Reference Base for Soil Resources 2015; World Soil Resources Reports No. 103; FAO: Rome, Italy, 2006. [Google Scholar]
  35. Sah, R.N.; Miller, R.O. Spontaneous reaction for acid dissolution of biological tissuesin closed vessels. Anal. Chem. 1992, 64, 230–233. [Google Scholar] [CrossRef]
  36. Jiménez, M.N.; Fernández-Ondoño, E.; Ripoll, M.A.; Navarro, F.B.; Gallego, E.; De Simón, E.; Lallena, A.M. Influence of different post-planting treatments on the development in Holm oak afforestation. Trees 2007, 21, 443–455. [Google Scholar] [CrossRef]
  37. U.S. EPA. Field Portable X-Ray Fluorescence Spectrometry for the Determination of Elemental Concentrations in Soil and Sediment; Method 6200; U.S. EPA: Washington, DC, USA, 1998.
  38. U.S. EPA. XRF Technologies for Measuring Trace Elements in Soil and Sediment, Niton XLt 700 Series XRF Analyzer; Innovative Technology Verification Report EPA/540/R-06/004; U.S. EPA: Washington, DC, USA, 2006.
  39. Martín Peinado, F.; Morales Ruano, S.; Bagur González, M.G.; Estepa Molina, C. A rapid field procedure for screening trace elements in polluted soil using portable X-ray fluorescence (PXRF). Geoderma 2010, 159, 76–82. [Google Scholar] [CrossRef]
  40. Weindorf, D.C.; Bakr, N.; Zhu, Y.; Mcwhirt, A.; Ping, C.L.; Michaelson, G.; Nelson, C.; Shoo, K.; Nuss, S. Influence of Ice on Soil Elemental Characterization via Portable X-Ray Fluorescence Spectrometry. Pedosphere 2014, 24, 1–12. [Google Scholar] [CrossRef]
  41. Brooks, R.R. Plants that Hyperaccumulate Heavy Metals: Their Role in Phytoremediation, Microbiology, Archaeology, Mineral Exploration and Phyto-Mining; CAB International: Wallingford, UK, 1998. [Google Scholar]
  42. Ter Braak, C.J.F.; Smilauer, P. CANOCO Reference Manual and CanoDraw for Windows User’s Guide: Software for Canonical Community Ordination (Version 4.5); Microcomputer Power: Ithaca, NY, USA, 2002. [Google Scholar]
  43. Lepš, J.; Šmilauer, P. (Eds.) Multivariate Analysis of Ecological Data Using CANOCO; Cambridge University Press: Cambridge, UK, 2003. [Google Scholar]
  44. Van der Ent, A.; Baker, A.J.M.; Reeves, R.D.; Pollard, A.J.; Schat, H. Hyperaccumulators of metal and metalloid trace elements: Facts and fiction. Plant Soil 2013, 362, 319–334. [Google Scholar] [CrossRef]
  45. Kabata-Pendias, A.; Pendias, H. Trace Elements in Soils and Plants, 3rd ed.; CRC Press: Boca Raton, FL, USA, 2011. [Google Scholar]
  46. Nogalez, R.; Benítez, E. Absorption of zinc and lead by Dittrichia viscosa growm in acontaminated soil amended with olive-derives wastes. Bull. Environ. Contam.Toxicol. 2006, 76, 538–544. [Google Scholar] [CrossRef] [PubMed]
  47. Fischerová, Z.; Tlustos, P.; Száková, J.; Sichorová, K. A comparison of phytoremediationcapability of selected plant species for given trace elements. Environ. Pollut. 2006, 144, 93–100. [Google Scholar] [CrossRef]
  48. Rascio, N.; Navari-Izzo, F. Heavy metal hyperaccumulating plants: How and why do they do it? And what makes them so interesting? Plant Sci. 2011, 180, 169–181. [Google Scholar] [CrossRef]
  49. Robinson, B.H.; Anderson, C.W.N.; Dickinson, N.M. Phytoextraction: Where’s the action? J. Geochem. Explor. 2015, 151, 34–40. [Google Scholar] [CrossRef]
Figure 1. The location map of the sampling for soils and plants.
Applsci 11 01769 g001
Figure 2. Bioaccumulation factor for leaves (a) and roots (b) of C. salviifolius, D. viscosa, and E. pithyusa in contaminated soil (C) and uncontaminated soil (NC). The mean and standard error bars of the mean are indicated. The non-parametric Kruskal-Wallis test was applied. Different letters indicate significant differences at a significance level <0.05 for the same plant growing on contaminated and uncontaminated soil.
Applsci 11 01769 g002
Figure 3. Translocation factor for leaves and roots of C. salviifolius, D. viscosa, and E. pithyusa in contaminated soil (C) and uncontaminated soil (NC). The mean and standard error bars of the mean are indicated. The non-parametric Kruskal-Wallis test was applied. Different letters indicate significant differences at a significance level <0.05 for the same plant growing on contaminated and uncontaminated soil.
Applsci 11 01769 g003
Figure 4. Principal Components Analysis (PCA) ordination diagram showing soil samples (points) spatially arranged according to the trace-element concentrations (arrows). CC= contaminated soil under C. salviifolius, CN= uncontaminated soil under C. salviifolius, DC= contaminated soil under D. viscosa, DN= uncontaminated soil under D. viscosa, EC= contaminated soil under E. pithyusa, EN= uncontaminated soil under E. pithyusa.
Applsci 11 01769 g004
Figure 5. PCA ordination diagram showing the spatial arrangement of samples (points) with regard to the foliar concentrations in trace elements (arrows), plant species, and soil (contaminated or uncontaminated). CC= contaminated soil under C. salviifolius, CN= uncontaminated soil under C. salviifolius, DC= contaminated soil under D. viscosa, DN= uncontaminated soil under D. viscosa, EC= contaminated soil under E. pithyusa, EN= uncontaminated soil under E. pithyusa.
Applsci 11 01769 g005
Figure 6. PCA ordination diagram showing the spatial arrangement of samples (points) with regard to the root concentrations in trace elements (arrows), plant species, and soil (contaminated or uncontaminated). CC= contaminated soil under C. salviifolius, CN= uncontaminated soil under C. salviifolius, DC= contaminated soil under D. viscosa, DN= uncontaminated soil under D. viscosa, EC= contaminated soil under E. pithyusa, EN= uncontaminated soil under E. pithyusa.
Applsci 11 01769 g006
Figure 7. Redundancy Analysis (RDA) ordination diagram showing the spatial arrangement of samples (points) with regard to the leaf (blue arrows) and soil (red arrows) concentrations in trace elements.
Applsci 11 01769 g007
Table 1. Total trace-metal concentrations in contaminated and uncontaminated soils. The mean ± SE values are shown together with minimum and maximum values in brackets. The non-parametric Kruskal–Wallis test was applied. Different letters indicate significant differences at a significance level < 0.05 within the same trace element and plant species. CC=contaminated soil under C. salviifolius. CN = uncontaminated soil under C. salviifolius. DC = contaminated soil under D. viscosa. DN = uncontaminated soil under D. viscosa. EC = contaminated soil under E. pithyusa. EN = uncontaminated soil under E. pithyusa.
Total Soil Concentrations (ppm)
ZnPbCuMnFe
CC22982 ± 9771.7a
(7668-41154)
5985.0 ± 1466.3a
(4130.1-8879.6)
52.7 ± 7.6a
(43.4-67.9)
4911.3 ± 1057.6a
(2799.4-6088.5)
79097 ± 11232a
(57871-96080)
CN5147.5 ± 699.8b
(4125.6-6486.7)
2400.4 ± 205.4b
(2107.2-2796.2)
45.2 ± 6.5a
(32.3-53.0)
8109.4 ± 1246.2b
(6757.7-10599)
76469 ± 14157a
(60916-104736)
p-value0.0490.0490.8270.0490.827
DC47219 ± 5653.1a
(39601-58263)
71585 ± 327.8a
(6540.3-7656.9)
291.0 ± 31.6a
(227.7-322.9)
4595.2 ± 1501.5a
(1973-7173.7)
260006 ± 92516a
(136747-441147)
DN557 ± 12.3b
(536.3-578.8)
380.4 ± 47.4b
(320.8-474)
42.8 ± 5.1b
(35.7-52.7)
741.7 ± 11.6b
(718.8-756.8)
34272 ± 1116.1b
(32580-36379)
p-value0.0490.0490.0490.0490.049
EC85701 ± 11435a
(71452-108318)
15135 ± 3957.3a
(8517.2-22203)
332.7 ± 112.1a
(198.7-555.3)
6970.8 ± 1718.8a
(3741.9-9606.8)
338155 ± 156244a
(171027-650385)
EN1539.4 ± 673.7b
(525-2814.6)
235.6 ± 66.5b
(153.5-367.4)
39.6 ± 5.1b
(29.6-46.6)
3691.5 ± 1714.6a
(1504.4-7072.5)
40436 ± 10092b
(25117-59477)
p-value0.0490.0490.0490.1260.049
Table 2. Trace-element concentration in leaves. Mean ± SE value is indicated, and minimum and maximum values are shown in brackets. The non-parametric Kruskal–Wallis test was applied. Different letters indicate significant differences at a significance level < 0.05 within the same element and plant species. CC = contaminated soil under C. salviifolius, CN = uncontaminated soil under C. salviifolius, DC = contaminated soil under D. viscosa, DN= uncontaminated soil under D. viscosa, EC = contaminated soil under E. pithyusa, EN = uncontaminated soil under E. pithyusa.
Trace-Element Concentration in Leaves (ppm)
ZnPbCuMnFe
CC290.2 ± 61.4a
(167.9-361.6)
179.5 ± 3.5a
(173.1-185.2)
19.5 ± 1.7a
(16.3-22.1)
105.1 ± 16.3a
(83.6-137.2)
3570.8 ± 171.4a
(3229.5-3769.8)
CN126.4 ± 36.9a
(72.7-197.1)
109.9±10.9b
(88.0-122.3)
19.4 ± 1.7a
(17.2-22.8)
52.6 ± 6.1b
(40.4-59.9)
2238.0 ± 184.7b
(1971.5-2592.9)
p-value0.1260.0490.820.0490.049
DC1807.2 ± 239.6a
(1336.6-2121.1)
592.2 ± 104.4a
(458.2-798.0)
40.1 ± 2.3a
(36.6-44.5)
224.7 ± 78.0a
(109.9-373.7)
6016.5 ± 969.5a
(4178.9-7471.3)
DN188.7 ± 31.9b
(152.5-252.4)
163.0 ± 19.3b
(124.4-183.5)
29.8 ± 7.3a
(16.0-41.2)
156.3 ± 29.9a
(120.8-215.9)
3656.7±543.4a
(2978.7-4731.3)
p-value0.0210.0490.2750.8270.126
EC644.2 ± 325.4a
(223.2-1284.5)
168.1 ± 19.8a
(147.9-207.8)
7.1 ± 0.7a
(6.2-8.5)
95.7 ± 44.7a
(43.8-184.7)
271.6 ± 40.3a
(190.9-614.1)
EN21.3 ± 6.6b
(10.8-33.5)
144.9 ± 12.7a
(126.4-169.3)
16.3 ± 1.5b
(13.3-17.9)
84.4 ± 12.4a
(59.8-100.1)
3884.9 ± 201.0b
(3486.1-4128.0)
p-value0.0490.2750.0490.5120.049
Table 3. Trace-element concentrations in roots. Mean ± SE value is indicated, and minimum and maximum values are shown in brackets. The non-parametric Kruskal–Wallis test was applied. Different letters indicate significant differences at a significance level < 0.0505 within the same element and plant species. CC = contaminated soil under C. salviifolius, CN = uncontaminated soil under C. salviifolius, DC = contaminated soil under D. viscosa, DN = uncontaminated soil under D. viscosa, EC = contaminated soil under E. pithyusa, EN = uncontaminated soil under E. pithyusa.
Trace-Element Concentration in Roots (ppm)
ZnPbCuMnFe
CC188.9 ± 64.5a
(71.6-294)
259.4 ± 47.9a
(196.6-353.5)
1.9 ± 0.9a
(0.5-3.6)
106.0 ± 28.5a
(72.1-162.6)
421.2 ± 52.6a
(321.8-500.8)
CN145.3 ± 16.4a
(124.7-177.7)
200.6 ± 8.5a
(186.6-215.9)
2.4 ± 1.0a
(0.32-3.7)
136.6 ± 7.1a
(127.9-150.8)
490.4 ± 83.9a
(387.6-656.8)
p-value0.5120.2750.8270.5120.827
DC301.2 ± 114.7a
(83.5-472.8)
421.2 ± 51.6a
(349.2-521.3)
0.7 ± 0.7
(0.0-2.3)
41.5 ± 8.8a
(24.1-53.1)
442.6 ± 83.2a
(278.1-547.1)
DN18.6 ± 1.1b
(17.2-20.8)
317.1 ± 10.9b
(296.6-334.1)
033.7 ± 2.2a
(29.3-36.7)
376.2 ± 85.6a
(269.2-545.4)
p-value0.0490.0490.3170.5120.512
EC215.4 ± 15.1a
(186.1-236.4)
174.2 ± 15.4a
(145.4-198.2)
12.2 ± 0.6a
(11.1-13.4)
18.1 ± 3.5a
(12.2-24.5)
149.9 ± 45.4a
(76.7-233.1)
EN14.2 ± 9.0b
(5.1-32.3)
137.2 ± 5.3a
(128.3-146.7)
12.5 ± 2.1a
(10.1-16.6)
22.5 ± 8.5a
(10.2-38.9)
103.5 ± 25.4a
(58.8-146.9)
p-value0.0490.1260.5120.8270.512
Table 4. Trace-element pools (ppm) for leaves and for roots of Dittrichia viscosa in contaminated soil (C) and uncontaminated soil (NC). The mean value ± SE is indicated and as well as the minimum and maximum values in brackets. The non-parametric Kruskal–Wallis test was applied. Different letters indicate significant differences at a significance level < 0.05 within each element and plant fraction.
Trace-Metal Pool for Leaves (ppm)
ZnPbCuMnFe
C369932 ± 49054a
(273599-434192)
121225 ± 21383a
(93807-163357)
8208.1 ± 477.8a
(7504.5-9120.0)
46000 ± 15977a
(22500-76502)
1231575.6 ± 198461a
(855413-1529368)
NC45102 ± 7640.3b
(36464-60337)
38974 ± 4625.1b
(29728-43853)
7139.9 ± 1762.2a
(3837.2-9857.3)
37373 ± 7165.3a
(28888-51614)
873957 ± 129870 a
(711915-779177.6)
P-value0.0490.0490.8270.8270.126
Trace-metal pool for roots (ppm)
C35263 ± 13431a
(97746-55353)
49311 ± 6044a
(40879-61028)
89.000 ± 89.000a
(0.0-267)
4857.1 ± 1033.9a
(2827.2-6213.5)
51810 ± 9746.0a
(32551-64042)
NC4578.1 ± 275.5b
(4239.1-5123.8)
78089 ± 2703.9b
(73030-82273)
08297.2 ± 550.4b
(7220.9-9036.0)
92641 ± 21079b
(66301-134318)
P-value0.0490.0490.3170.490.049
Publisher’s Note: MDPI stays neutral with regard to jurisdictional claims in published maps and institutional affiliations.

