Article

Hot Air and Microwave Combined Drying of Potato Monitored by Infrared Thermography

by
Juan Angel Tomas-Egea
1,
Maria Victoria Traffano-Schiffo
2,
Marta Castro-Giraldez
1 and
Pedro J. Fito
1,*
1
Instituto Universitario de Ingeniería de Alimentos para el Desarrollo, Universitat Politècnica de València, Camino de Vera s/n, 46022 Valencia, Spain
2
Instituto de Química Básica y Aplicada del Nordeste Argentino, IQUIBA-NEA, UNNE-CONICET, Avenida Libertad 5460, Corrientes 3400, Argentina
*
Author to whom correspondence should be addressed.
Appl. Sci. 2021, 11(4), 1730; https://doi.org/10.3390/app11041730
Submission received: 8 January 2021 / Revised: 8 February 2021 / Accepted: 9 February 2021 / Published: 15 February 2021
(This article belongs to the Special Issue Drying Technologies in Food Processing)

Abstract

:
Hot air drying (HAD) at temperatures below the spontaneous evaporation temperature could be combined with microwave (MW) radiation as a thermal energy source in order to reduce the drying time. A photon flux in the microwave range interacts with dipolar molecules (water) through orientation and induction, producing electrical energy storage and thermal energy accumulation and generating an increase in the internal energy of food. The different mechanisms involved in water transport could change when the microwave penetration depth exceeds the sample characteristic dimension of mass transport. The aim of this paper is to determine the effect of MW in the combined HAD-MW drying of raw potato in order to obtain the real driving forces and mechanisms involved in the water transport, with the purpose of optimizing the MW power used. For this purpose, combined drying was carried out on potato samples (0, 4 and 6 W/g). The sample surface temperature was monitored by infrared thermography, and the sample mass was measured continuously through a precision balance. In parallel with continuous drying, another drying treatment was performed at different times (20, 40, 60, 90, 120, 180, 420 min) and conditions (0, 4 and 6 W/g) to analyze the dielectric properties, mass, moisture, volume and water activity. The results show that it is possible to monitor combined drying by infrared thermography, and it can be concluded that the convection heating is mostly transformed into surface water evaporation, with negligible thermal conduction from the surface, and microwave radiation is mostly transformed into an increase in the potato’s internal energy.

1. Introduction

During hot air drying (HAD) at temperatures below the spontaneous evaporation temperature, the main force that drives water removal from the product is the gradient of water chemical potential generated between the air, with a very low relative humidity, and the product, with high water activity, causing a water flux from the product to the air [1]. Liquid water is transported from inside the sample to the surface, where it evaporates [2,3]. This state change requires the input of energy, which is generally obtained from the internal energy of the air in the sample surroundings, decreasing its temperature. However, it can also be obtained from the internal energy of the surface of the product, thus cooling it. The diversity of water molecule interactions that occur inside the potato tissue [4], as well as the different ways that water molecules have to reach the surface, make the internal water transport fast at the beginning of drying, as the water molecules with high mobility are mobilized through the fastest route (apoplastic pathways). In this drying period, surface evaporation is the limiting factor of the overall transport. After this period, more retained molecules (critical moisture) are mobilized through slower routes, causing slower internal transport. In this period, the internal transport becomes the limiting factor [5].
Another possibility is to combine the thermodynamic inertia of HAD with another source of heat, such as microwave radiation [6]. The interaction of photons with biological systems at low frequencies of the electromagnetic spectrum (Hz to GHz) causes orientation and induction phenomena. Gamma (γ) dispersion occurs at microwave frequencies (between MHz and GHz), and it is produced by the orientation and induction of dipolar molecules [7], water being the most important dipolar molecule in biological systems. Gamma dispersion produces the transformation of photonic energy into electrical energy by molecular spin orientation and into thermal energy by molecular collisions and frictions. Many food products have an important aqueous phase; therefore, the application of microwaves in heating processes is a possible source of energy. Microwave radiation has a high penetration depth, producing an internal heating front [8,9]. Therefore, combined HAD-MW drying could reduce the drying time [9,10]. This technique has been applied in different foods: in orange peel [11], in nectarine slices [8] and in shiitake mushrooms [12].
In order to evaluate the effect of HAD and MW, it is necessary to analyze thermal conditions on the surface of the product. Infrared thermography (FTIR) is a technique that measures the surface temperature of materials in a non-destructive way [13,14,15]. This technique has been used in the food industry to evaluate pork quality [16], to detect differences between raw and cooked chicken meat [17,18], to evaluate the freezing process of potato [4], to control disinfection with the steam of carrots [19], to detect the position and depth of bruises in apples [20] and to evaluate injuries of cold-stored guava [14]. Thermal imaging has also been demonstrated to be a useful tool in monitoring the surface temperature in drying processes in the food industry in combined dryings of kiwifruits [21], HAD combined with microwaves to dry mushrooms [22], HAD of corn kernels [23] and vacuum drying of banana slices [24].
The aim of this paper is to determine the effect of MW in the combined HAD-MW drying of raw potato at a drying air temperature below the spontaneous evaporation temperature, with the potato having a smaller characteristic dimension than the MW penetration depth, in order to obtain the real driving forces and the mechanisms involved in the water transport, with the purpose of optimizing the MW power used.

2. Materials and Methods

2.1. Materials

Potatoes (Solanum Tuberosum (L.) cv. Melody) were acquired from the Mercadona supermarket (Valencia, Spain). They were washed and peeled, and spheres of 10 mm diameter were obtained using a stainless-steel core borer.

2.2. Kinetics Experimental Procedure

Potato sample spheres were dried by hot air drying (HAD) and hot air drying assisted by microwaves (HAD + MW) using a specially designed HAD-MW oven [25], connected to a magnetron to provide energy, with a maximum output of 2000 W at 2450 MHz. The oven was connected to a computer to measure the incident and reflected energy using a directional coupler with a power meter in the waveguide of the magnetron. The drying chamber had a mode stirrer to ensure a homogeneous distribution of microwaves. The selected drying conditions were an air velocity of 1.5 m/s, hot air temperature of 40 °C and MW energy of 0, 4 or 6 W/g (referring to the initial mass of the sample). All treatments were carried out for 420 min. The oven door is a ventilation grill with a mesh size of 2 mm, where the air and the infrared radiation can cross without limitation, but the microwave radiation, with a longer wavelength, cannot.
During the HAD treatment (0 W/g), a sample was placed inside the oven to continuously monitor and record the mass using a Mettler Toledo AB304-S balance (precision of ±0.01 g). A second sample (or reference sample) was placed next to the previous one and in front of an infrared camera (Optris PI® 160 thermal imager; Optris GmbH, Berlin, Germany) to record the infrared emission of the surface of the potato. The surface temperature of this sample was measured using a K-thermocouple connected to an Agilent 34901A multiplexer (Agilent Technologies, Malaysia) and recorded by an Agilent 34972A data logger (Agilent Technologies, Malaysia). Finally, a certified emissivity label (ε = 0.95), provided by Optris GmbH, was placed in the same plane as the reference sample, and its temperature was also registered by a K-thermocouple. For HAD-MW treatments (4 and 6 W/g), the experimental procedure was similar, but the surface temperature of the reference samples and the certified emissivity label were monitored only by the infrared camera (Figure 1).
The environmental conditions (relative humidity and temperature) were also registered.

2.3. Static Experimental Procedure

In parallel with continuous drying, drying treatments at different times (20, 40, 60, 90, 120, 180, 420 min) and conditions (0, 4 and 6 W/g) were performed in triplicate. After drying, samples were kept in Aqualab® cups, sealed with Parafilm® and maintained at 4 °C for 24 h in order to reach an internal equilibrium (mechanical and chemical) [1]. The following determinations were performed for raw samples, dried (non-equilibrated) samples and samples after they were left for 24 h at 4 °C (equilibrated samples): permittivity, mass, volume and surface water activity (Figure 1). Considering that moisture is determined using a destructive method, this analysis was carried out only for equilibrated samples.

2.4. Potato Sample Determinations

Every physicochemical property was measured at each drying time explained in Section 2.3. The moisture of the spheres was obtained gravimetrically by drying the samples in a vacuum oven at 60 °C until a constant weight (AOAC, 1990). Water activity was measured with an Aqualab® dew-point hygrometer, series 3 TE (±0.003) (Decagon Devices Inc., Pullman, WA, USA). The volume and surface of the spheres were obtained by image analysis using Adobe® Photoshop® CS6 software (Adobe Systems Inc., San Jose, CA, USA).

2.5. Dielectric Properties

Dielectric properties were measured at each drying time as explained in Section 2.3 by using an Agilent 85070E open-ended coaxial probe (Agilent, Santa Clara, CA, USA) connected to an Agilent E8362B vector network analyzer (Agilent, Santa Clara, CA, USA). The system was calibrated by using three different types of loads: air, short-circuit and 25 °C Milli®-Q water. Once the calibration was completed, 25 °C Milli®-Q water was measured again to check calibration suitability. The dielectric properties were measured by attaching the probe to the surface of the samples. All determinations were made at 500 MHz to 20 GHz. The measurements were made in triplicate.

3. Results

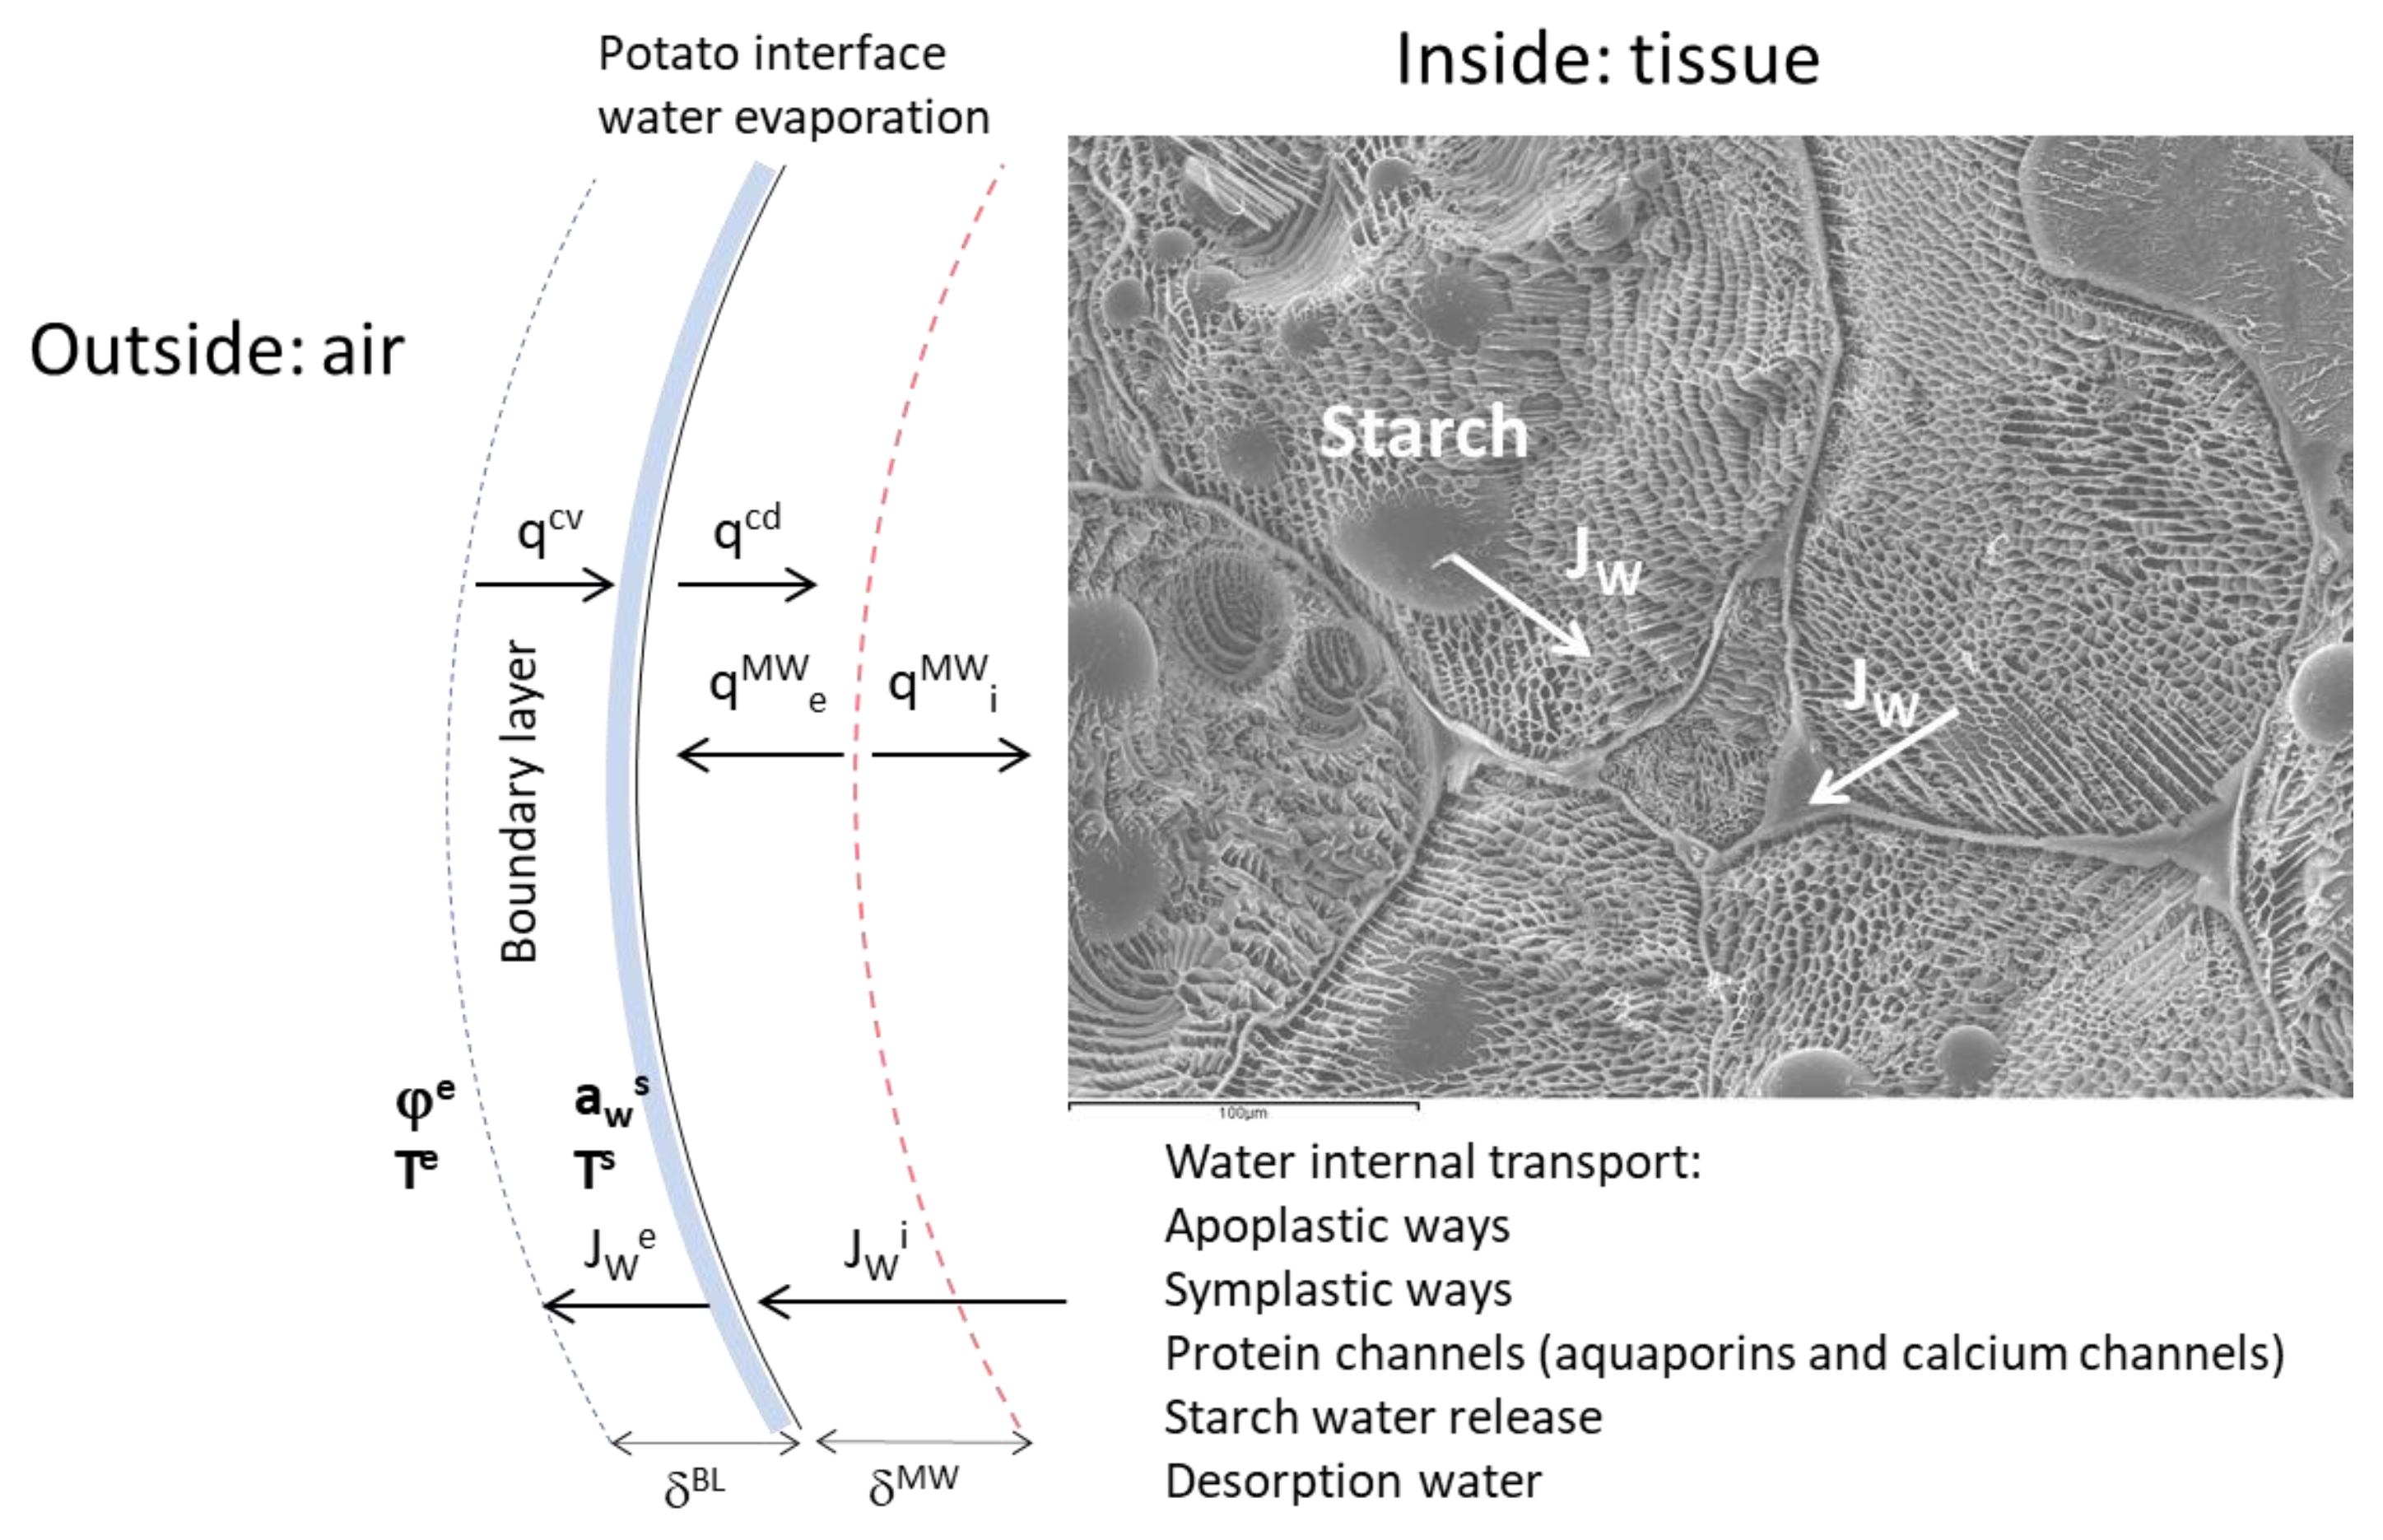
The drying process at temperatures below the spontaneous evaporation temperature implies that evaporation occurs through thermodynamic inertia in the air/sample interface, that is, the gradient of water chemical potential between the air surrounding the sample and its surface. Then, water evaporation occurs from the sample surface, and thus, the water transport inside the sample occurs in the liquid state. The terms of the water chemical potential that drive the water transport are those associated with the difference between the surface water activity of the sample and the relative humidity of the drying air and also the difference between the drying air temperature and the sample surface temperature. These differences are produced in a thin air layer, called a boundary layer, with a thickness dependent on the phenomena of water transfer and heat transmission. Figure 2 shows a scheme of heat and mass exchange throughout the boundary layer. In this figure, it is possible to observe two planes in which some mechanisms converge; the first is the interface between the air and the surface of the sample, where heat convection is used to evaporate water (induced by the water chemical potential) and to heat the surface, and the second is the microwave heating plane, which is defined by the microwave penetration depth.
It is necessary to define the variables that characterize each of these planes in order to quantify the phenomena that occur in the combined process of HAD and MW. As explained in the Materials and Methods section, the surface temperature was obtained by FTIR, with a reference material with known emissivity to remove the effect of the reflected energy from the sample surroundings using the equation of [1]. With this expression, it is possible to obtain the emissivity of the sample and, therefore, its surface temperature. 
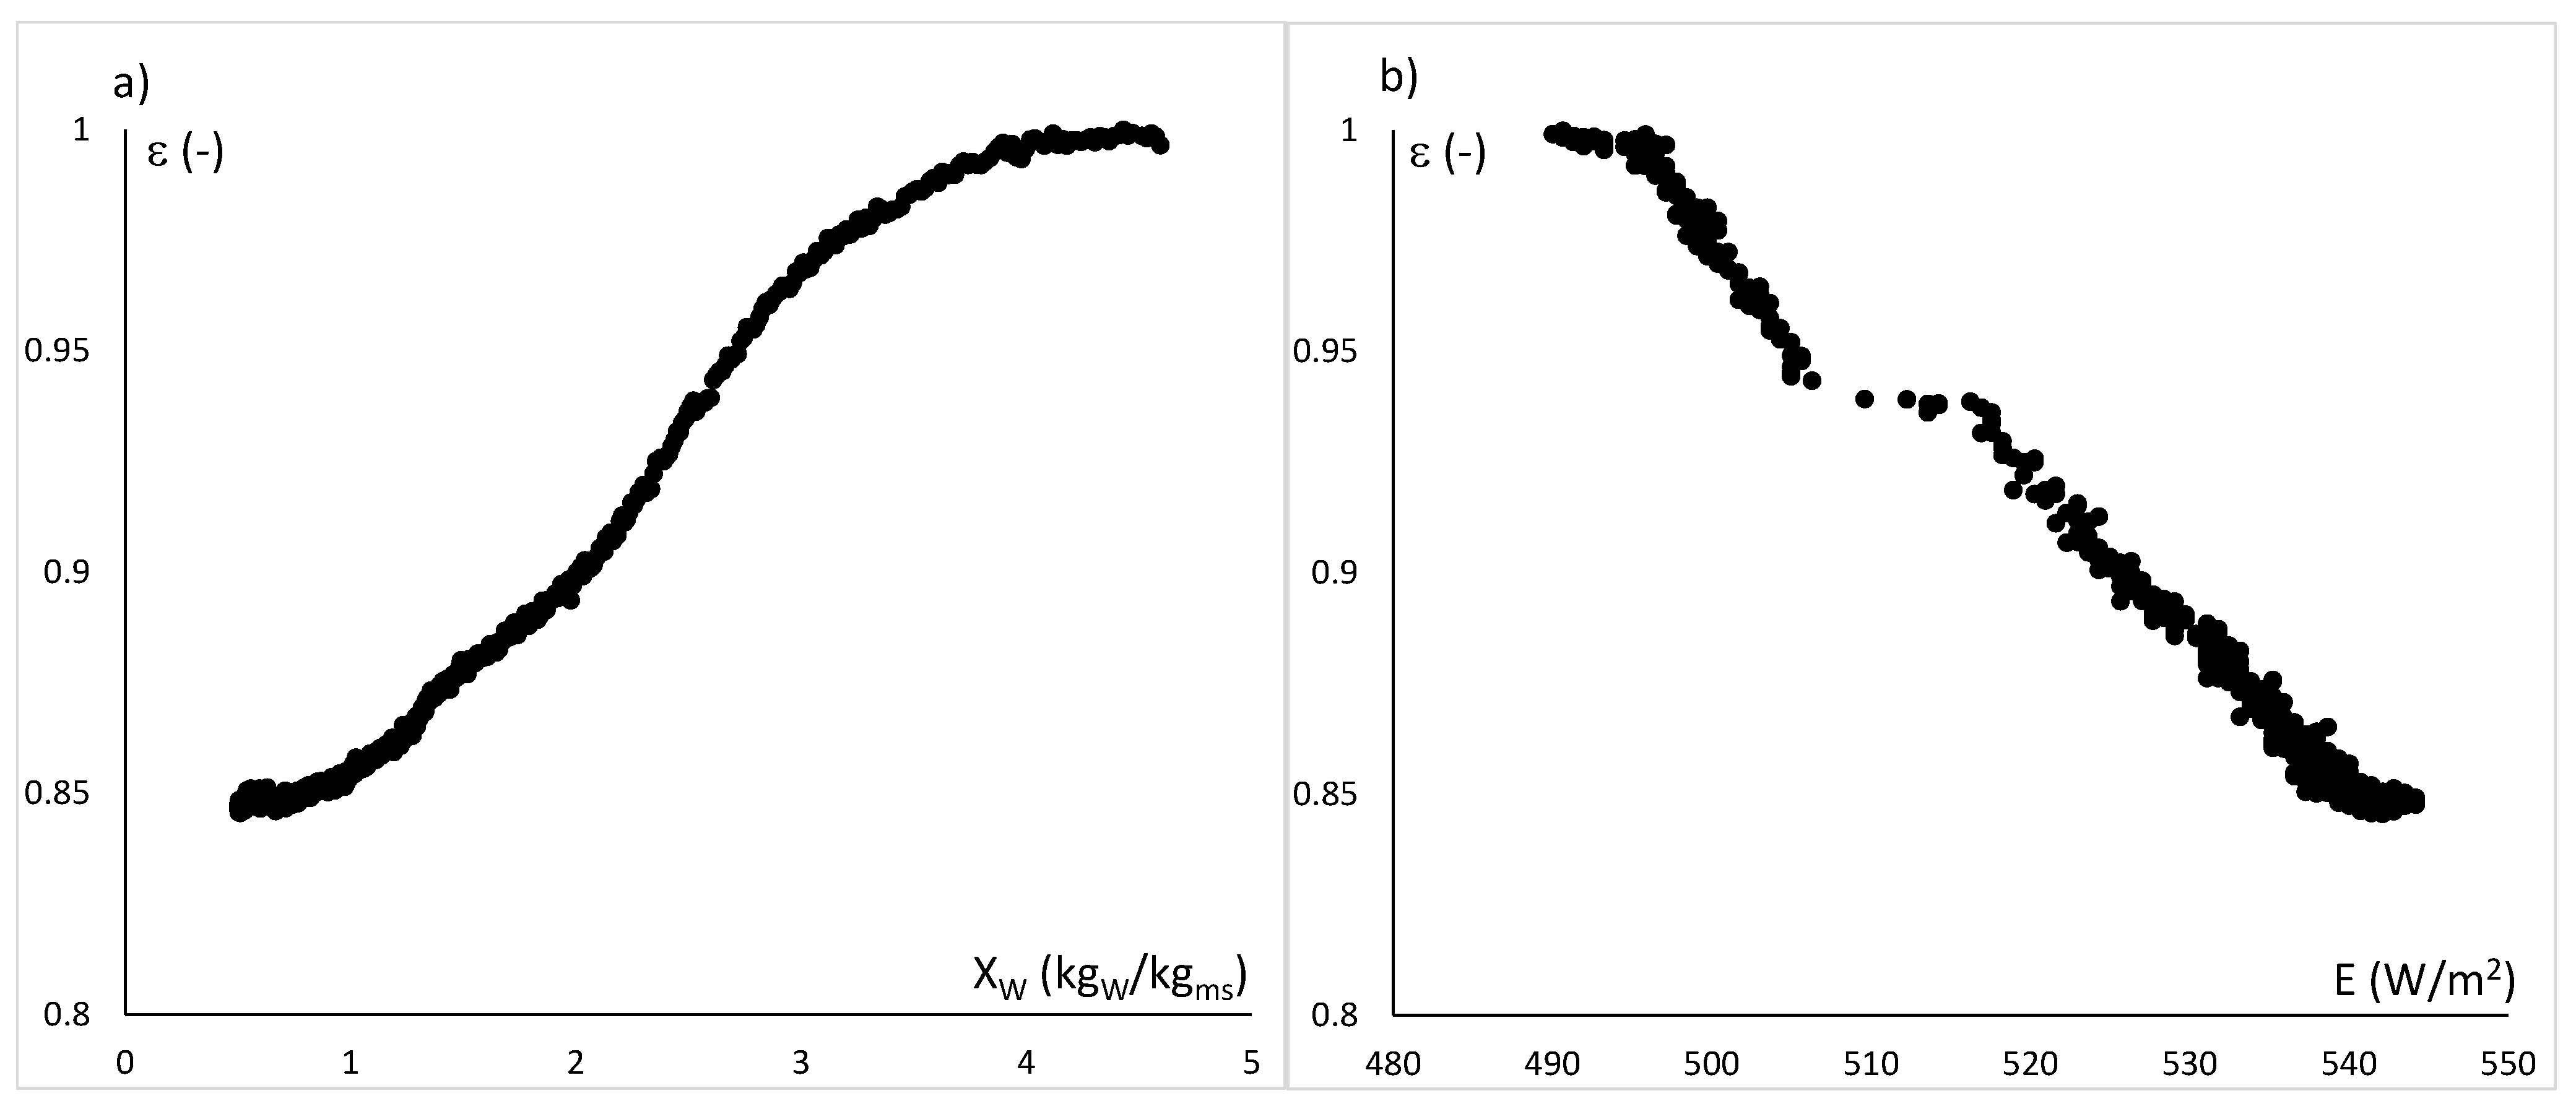
Figure 3a shows the emissivity with respect to the sample moisture (expressed on a dry basis), since in the far IR spectrum, the water molecule proportion is one of the main factors that affect the emissivity [6]. It is possible to observe how the emissivity decreases as the moisture decreases. In Figure 3b, it is possible to observe the relationship between the emissivity and the energy emitted by the sample without the effect of the reflected energy from the surroundings. This energy was estimated with two reference materials, one situated close to the sample and the other situated toward the door of the dryer (the door is a ventilation grill with a mesh size of 2 mm, where the air can cross without limitation, as can photons in the infrared range, but photons in the microwave range cannot pass). This energy is needed to obtain, with the emissivity, the real surface temperature.
Considering that the K-thermocouples could only be used in the HAD experiment, the emissivity obtained in this experiment was used to correct the surface temperature measured by FTIR in combined HAD-MW experiments, using the moisture of the sample to obtain the value. 
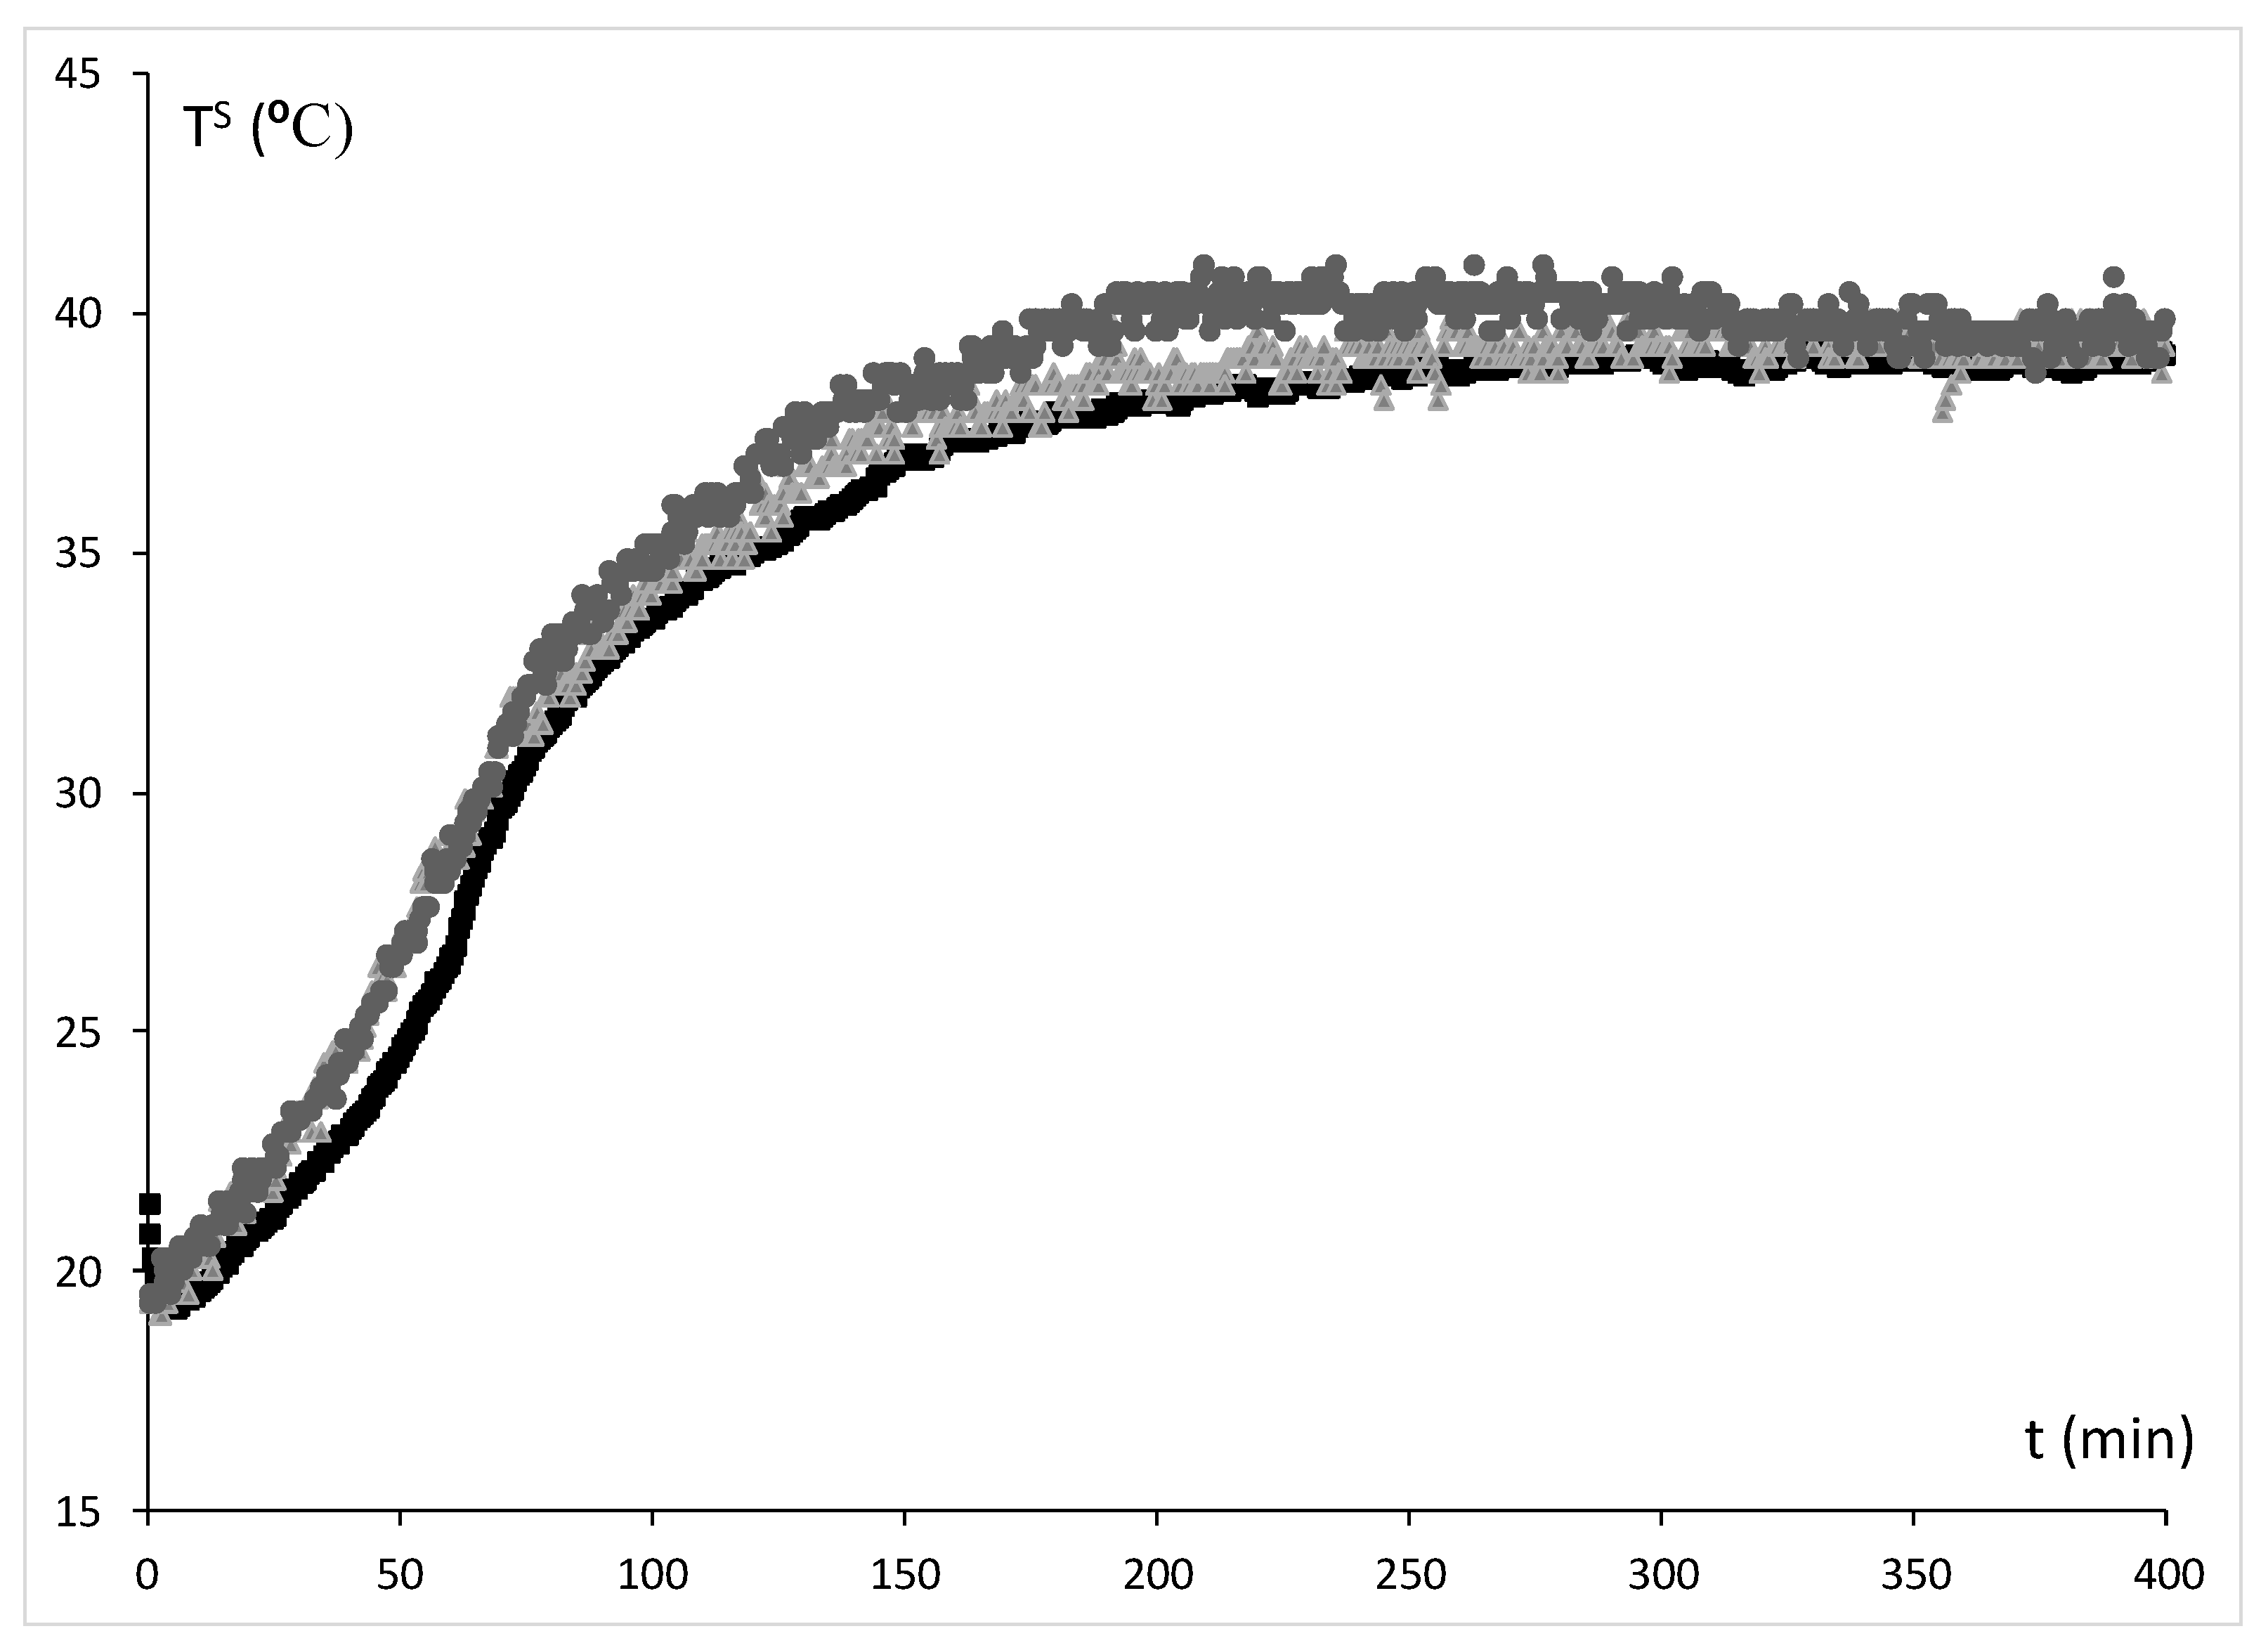
Figure 4 shows the evolution of surface temperature in each treatment. This figure shows how the surface temperature increases, in all treatments, throughout the drying time. In the case of the HAD treatment, the surface temperature increases and reaches equilibrium with the drying temperature; however, the combined HAD-MW treatments increase the surface temperature throughout the drying time to above that in the HAD treatment; that is, the temperature increases beyond the drying temperature. However, at the end of drying, the surface temperature decreases when the product already has low moisture.
In order to understand the phenomena that occur at the sample/air interface, it is necessary to calculate the thermal energy consumed on the potato surface. The convective heat that the surface receives is used to evaporate the water that has reached the sample surface and to heat this interface. Therefore, the thermal energy expended in evaporation (QV) is estimated as (see Equation (1)):
Q v = Δ M w · Δ G v S · Δ t
where ∆Mw is the water loss (g) in ∆t time (s), ∆Gv is the latent heat of water (J/g) and S is the sample surface (m2).
The thermal energy consumed by surface heating (QU) will depend on the increase in surface temperature, the heat flowing to the inside of the sample by conduction (qcd), the specific heat of the sample and the sample mass. The relation between the thermal energy consumed in the interface and the heat flowing to the inside of the sample by conduction can be expressed as follows (see Equation (2)):
Q U q c d = Δ T · M · C P S · Δ t
where ∆T is the surface temperature variation in ∆t time, M is the mass of the sample (g) and CP is the specific heat of the potato, estimated with the water and starch mass fraction (kJ/kgK).
If this calculation is carried out, the thermal energy relation oscillates between 3% and 0.1% of the heat consumed by evaporating water, making it practically negligible.
On the other hand, the heat that reaches the surface can be estimated by the following equation:
q c v = h · S · ( T e T s )
where qcv is the heat by the convective mechanism (W), h is the individual coefficient of heat convection (W/m2K), Te is the external or air-drying temperature (°C) and TS is the surface or interface temperature (°C).
In the case of the HAD treatment, the energy consumption in the interface is equal to the heat received by convection; therefore, it is possible to calculate the individual coefficient of heat convection using the following equation:
h = Q v + Q U q c d S · ( T e T s )
where Te is the air-drying temperature (°C), TS is the surface temperature (°C), QUqcd is estimated using Equation (2) and QV is estimated using Equation (1).
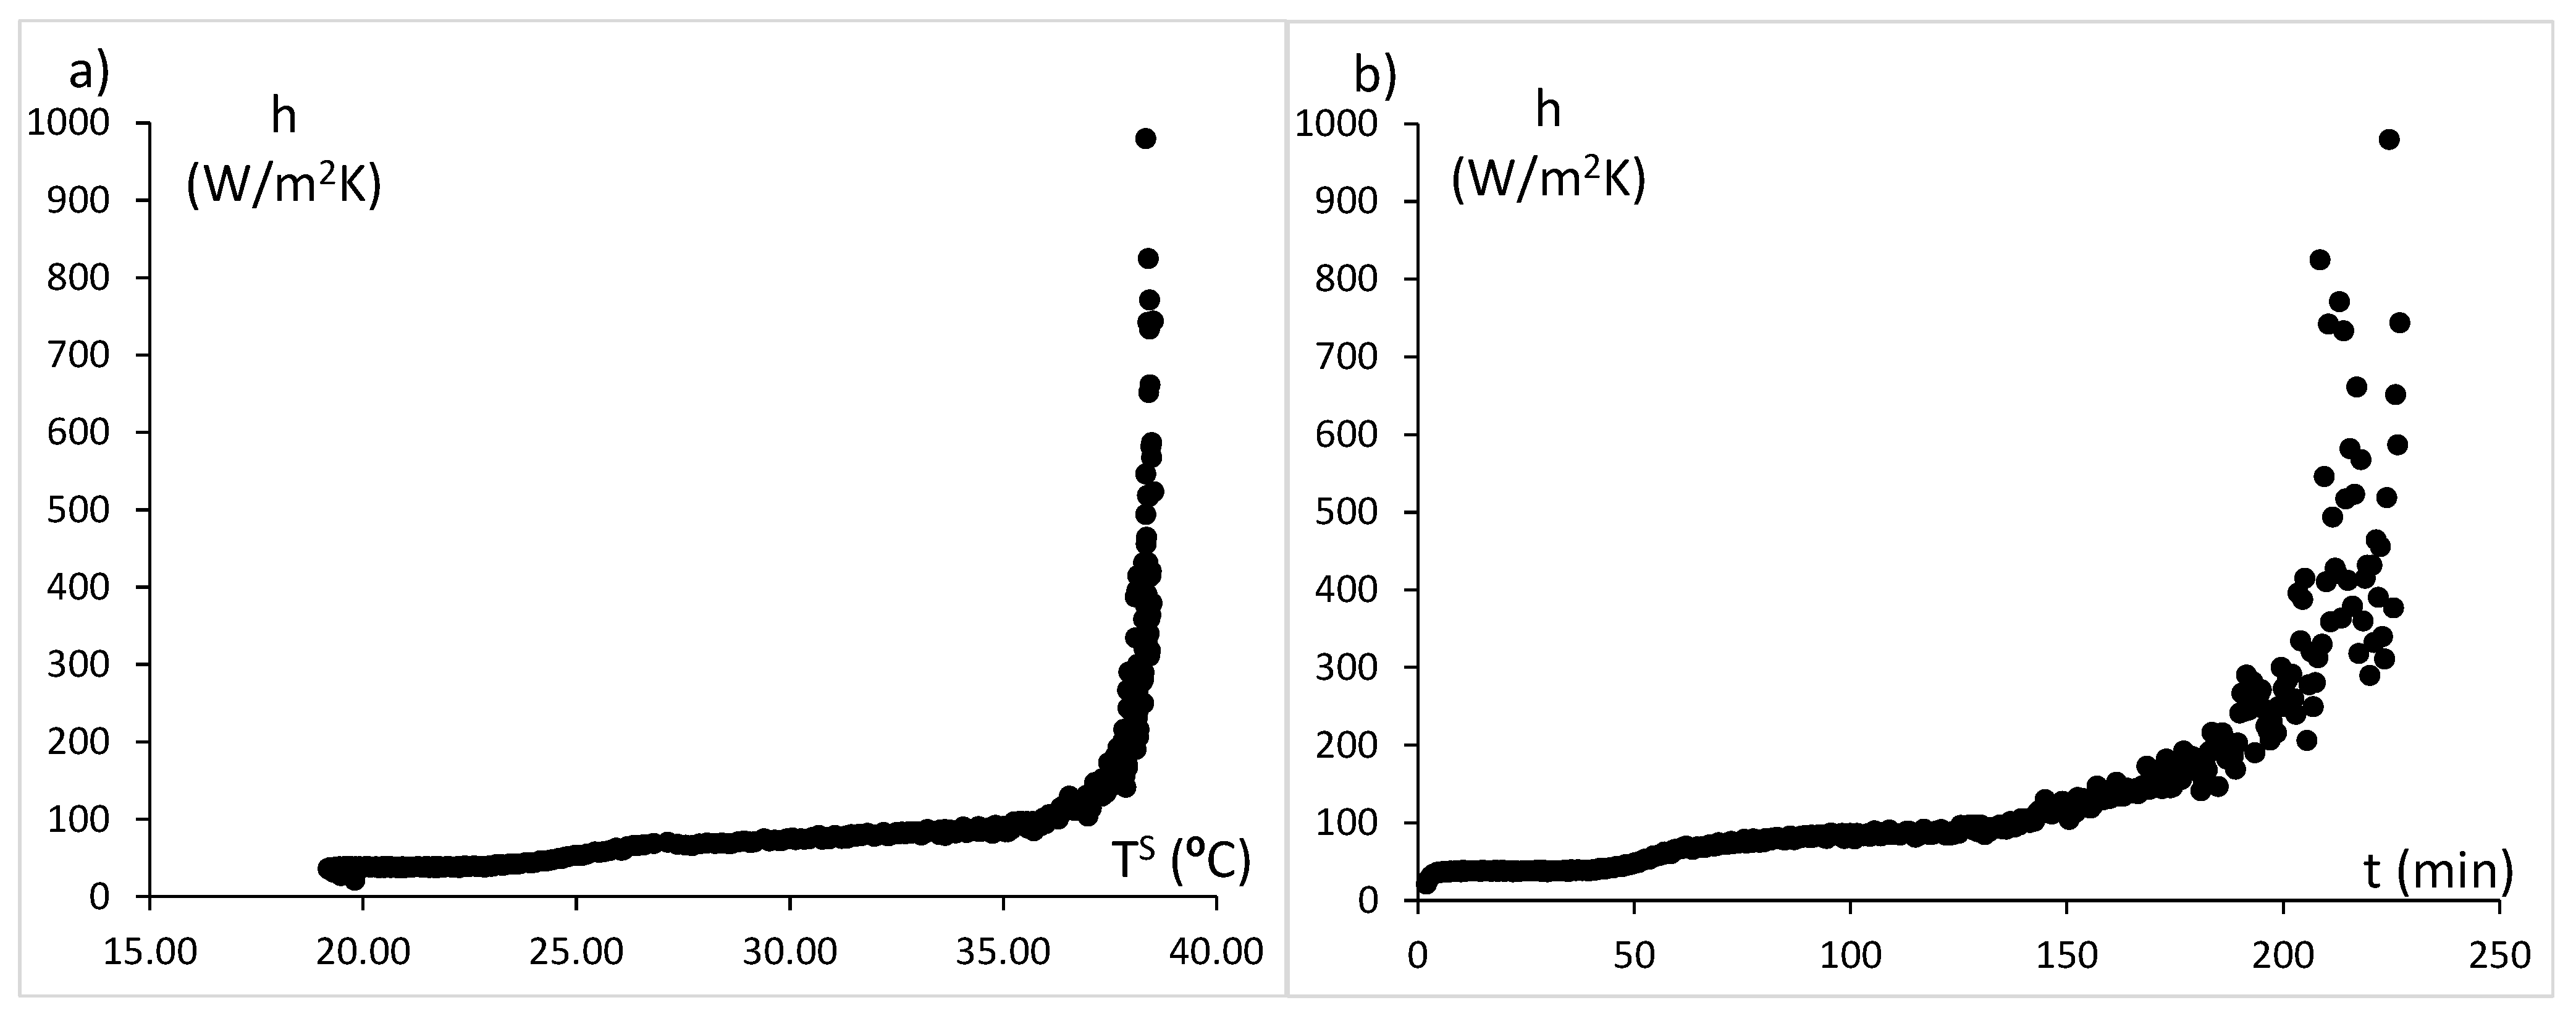
Figure 5 shows the individual coefficient of heat convection estimated by Equation (4) for the HAD treatment. In Figure 5a, it is possible to observe how h increases exponentially when the interface reaches the air-drying temperature. The same occurs in Figure 5b, where the h evolution increases with the treatment time, and the external resistance of heat transmission can be neglected after approximately 230 min. The individual coefficient of heat convection will depend on the turbulence and the interface temperature; thus, it is possible to apply the relation between h and the surface temperature to obtain the h evolution in HAD-MW combined treatments.
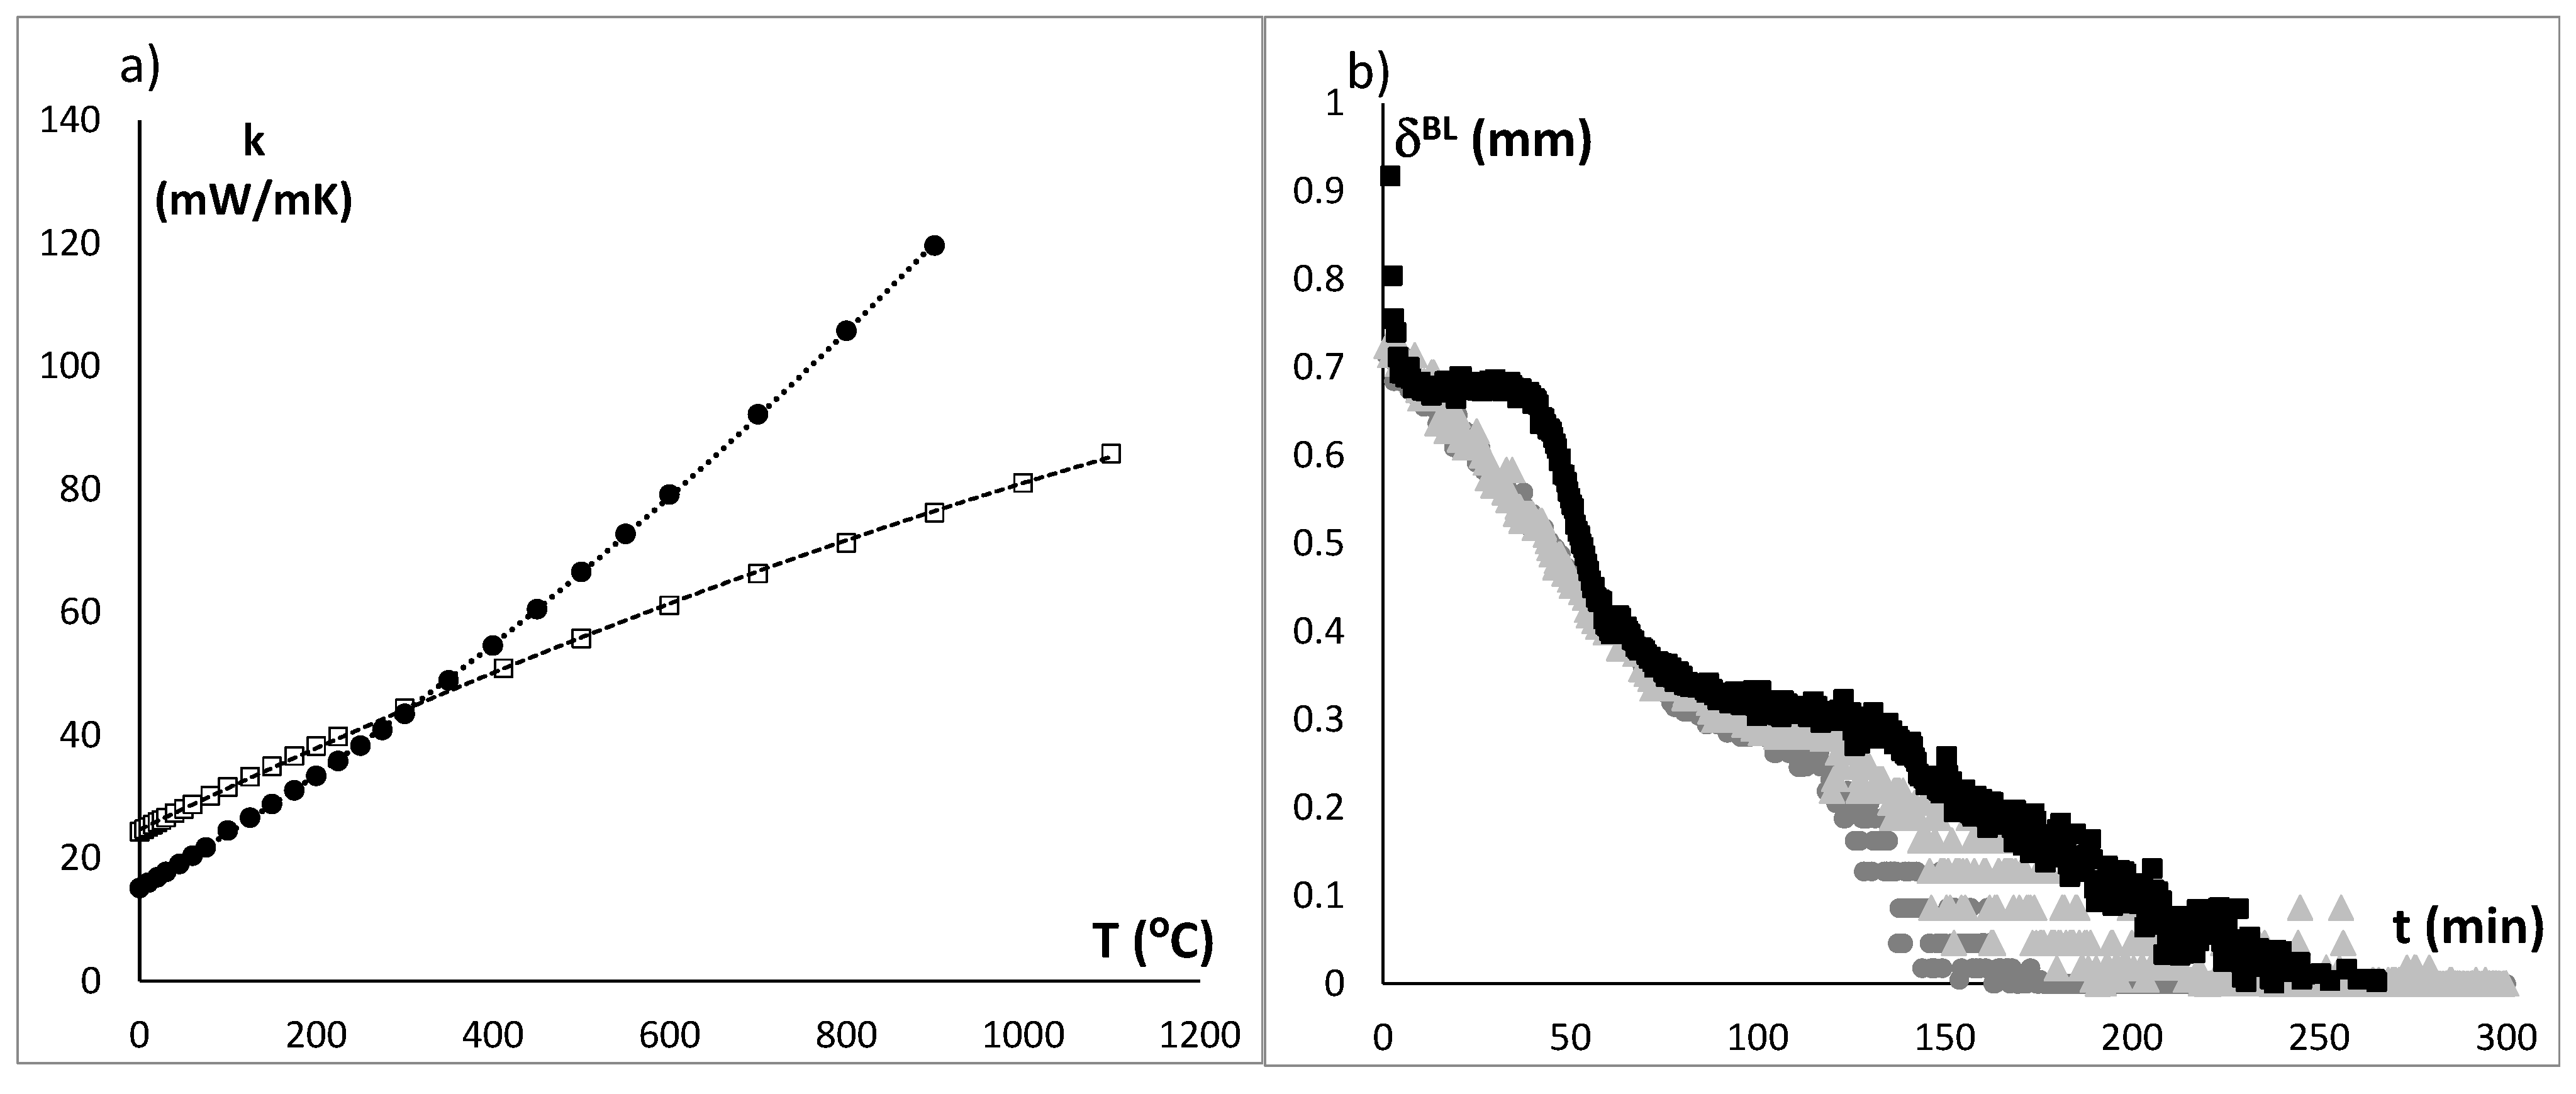
Furthermore, h can be defined by the relation between the thermal conductivity of air and the boundary layer depth. The air thermal conductivity can be estimated with the water mass fraction in air, calculated with the thermodynamic properties of air [11]. Thus, the boundary layer depth can be estimated as follows:
δ B L = k a i r h = k d r y   a i r · ( 1 x v ) + k w · x v h
Figure 6a shows the variation of water and dry air thermal conductivity with the temperature needed in Equation (5). Figure 6b represents the boundary layer depth for all treatments, where it is possible to observe how the thickness decreases faster depending on the power of the MW treatment.
In the case of combined drying methods, the microwaves absorbed by the samples represent the quantity of photonic energy at 2.45 GHz that dissipates in electric and thermal energy throughout the microwave penetration depth (δMW). In this frequency range, the main effect of photon radiation is the gamma dispersion, which consists in the orientation and induction of dipolar molecules, water being the main dipolar molecule in potato tissue. The microwave penetration depth can be estimated as follows [6]:
δ M W = | ε | 2 π f ε ε
where |ε| represents the modulus of permittivity at 2.45 GHz, ε′ is the dielectric constant, ε″ is the loss factor and f is the frequency expressed in Hz (2.45 GHz).
An important characteristic of microwave heating is that when the characteristic dimension of the sample (radius) is less than microwave penetration depth, heating occurs from the center of the sample to the surface [19]. In this experiment, δMW was estimated using Equation (6), obtaining, for raw potato, a value of 1.62 ± 0.06 and decreasing throughout the drying process to 0.83 ± 0.08 at 440 min, always being greater than the radius measured at each time.
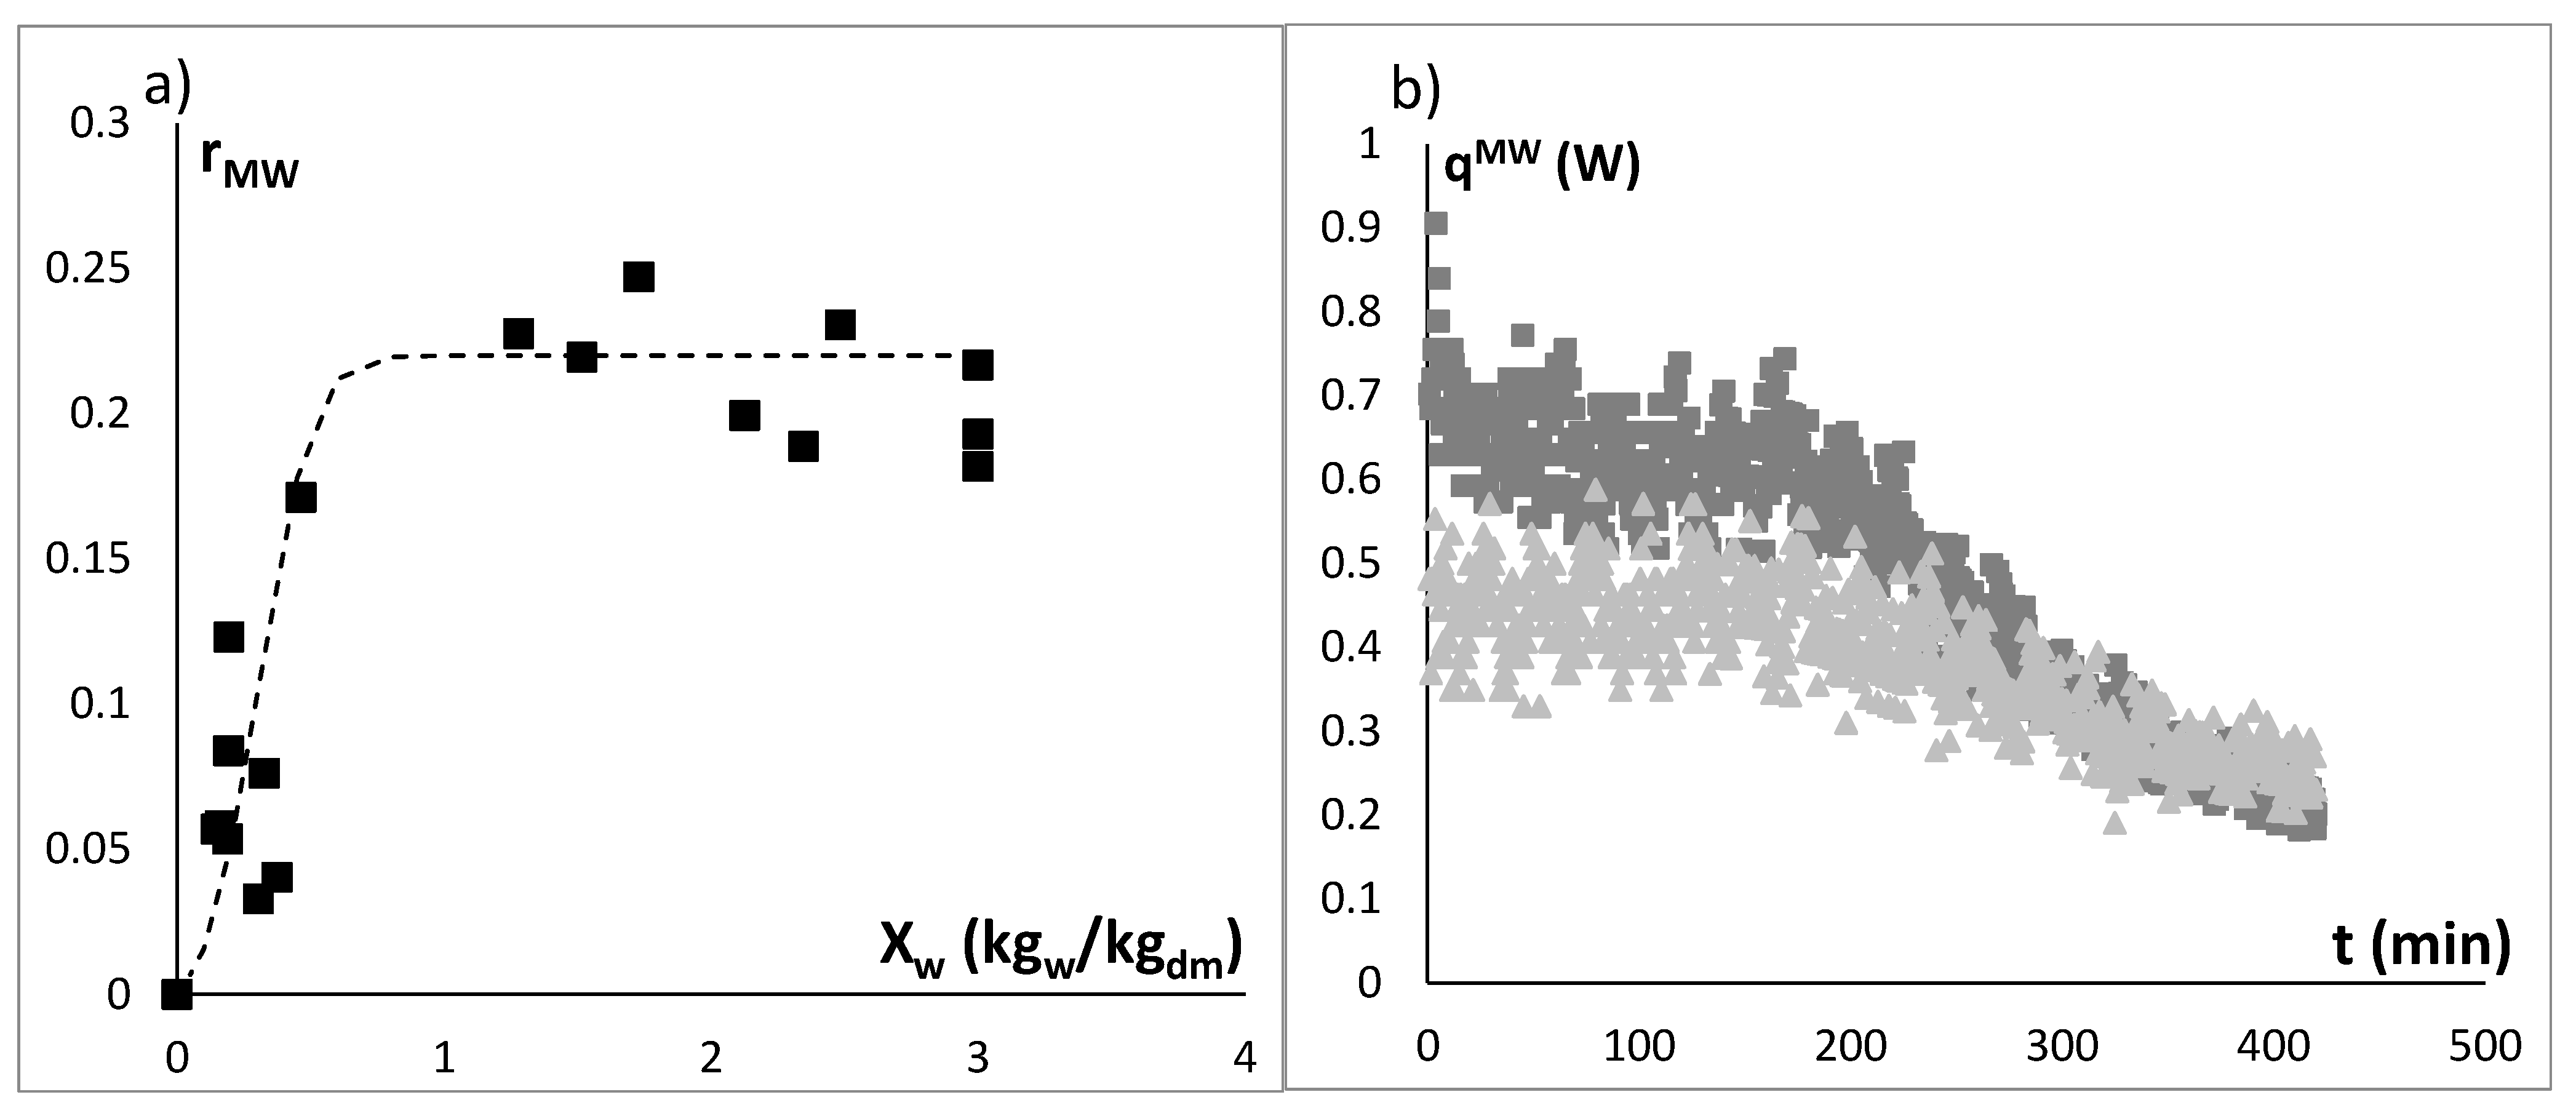
The proportion of microwave energy that has been absorbed and transformed into thermal energy can be estimated by the dielectric properties at 2.45 GHz. In order to estimate the amount of microwave energy absorbed as thermal energy, the microwave energy distribution ratio (rMW) from [6] was used by means of dielectric properties (Equation (7)).
r M W   = ε ε + ε
Figure 7a shows the relationship between rMW and sample moisture expressed on a dry basis, where it is possible to observe that the microwave energy distribution ratio remains constant while the moisture is high, and when it reaches a moisture of around 0.7 on a dry basis, it decreases exponentially. This phenomenon may be because the critical moisture of the potato is approximately 0.7, and with that value, the water that remains in the tissue has less mobility, and the ease of inducing water molecules is less than the ease of orienting them. Consequently, the absorption of energy as electrical energy storage increases compared with the dissipation as thermal energy.
The HAD + MW combined drying equipment measures the total power emitted by the magnetron and the power returned to the emission tube (reflected power). The difference between the two is the microwave power absorbed (Pabs) by the sample. Therefore, with the absorbed power and rMW, the heating by microwaves (qMW) can be calculated with the following equation.
q M W =   P a b s   ·   r M W  
Figure 7b shows the evolution of microwave heating throughout the treatment. It is possible to observe that the heat remains constant until a process time of 180 min, whereupon the microwave heat decreases. This drying time represents the moment when the sample reaches critical moisture, whereupon the water molecules reduce their mobility and hinder the induction phenomena, while their capacity to store electric energy remains, as seen in Figure 7a.
If an energy balance is applied to the total sample (Equation (9)), the heat contribution by convection (qcv) and by microwaves (qMW) will be distributed in heating by conduction from the surface (QUqcd), the internal energy variation associated with microwave heating and surface water evaporation. This balance is shown in the following equation:
q c v + q M W =   Q U q c d + U t | M W + Q V
where U is the internal energy of the sample and Ev is the evaporation energy.
With Equation (9), it is possible to estimate the internal energy variation associated with microwave heating. 
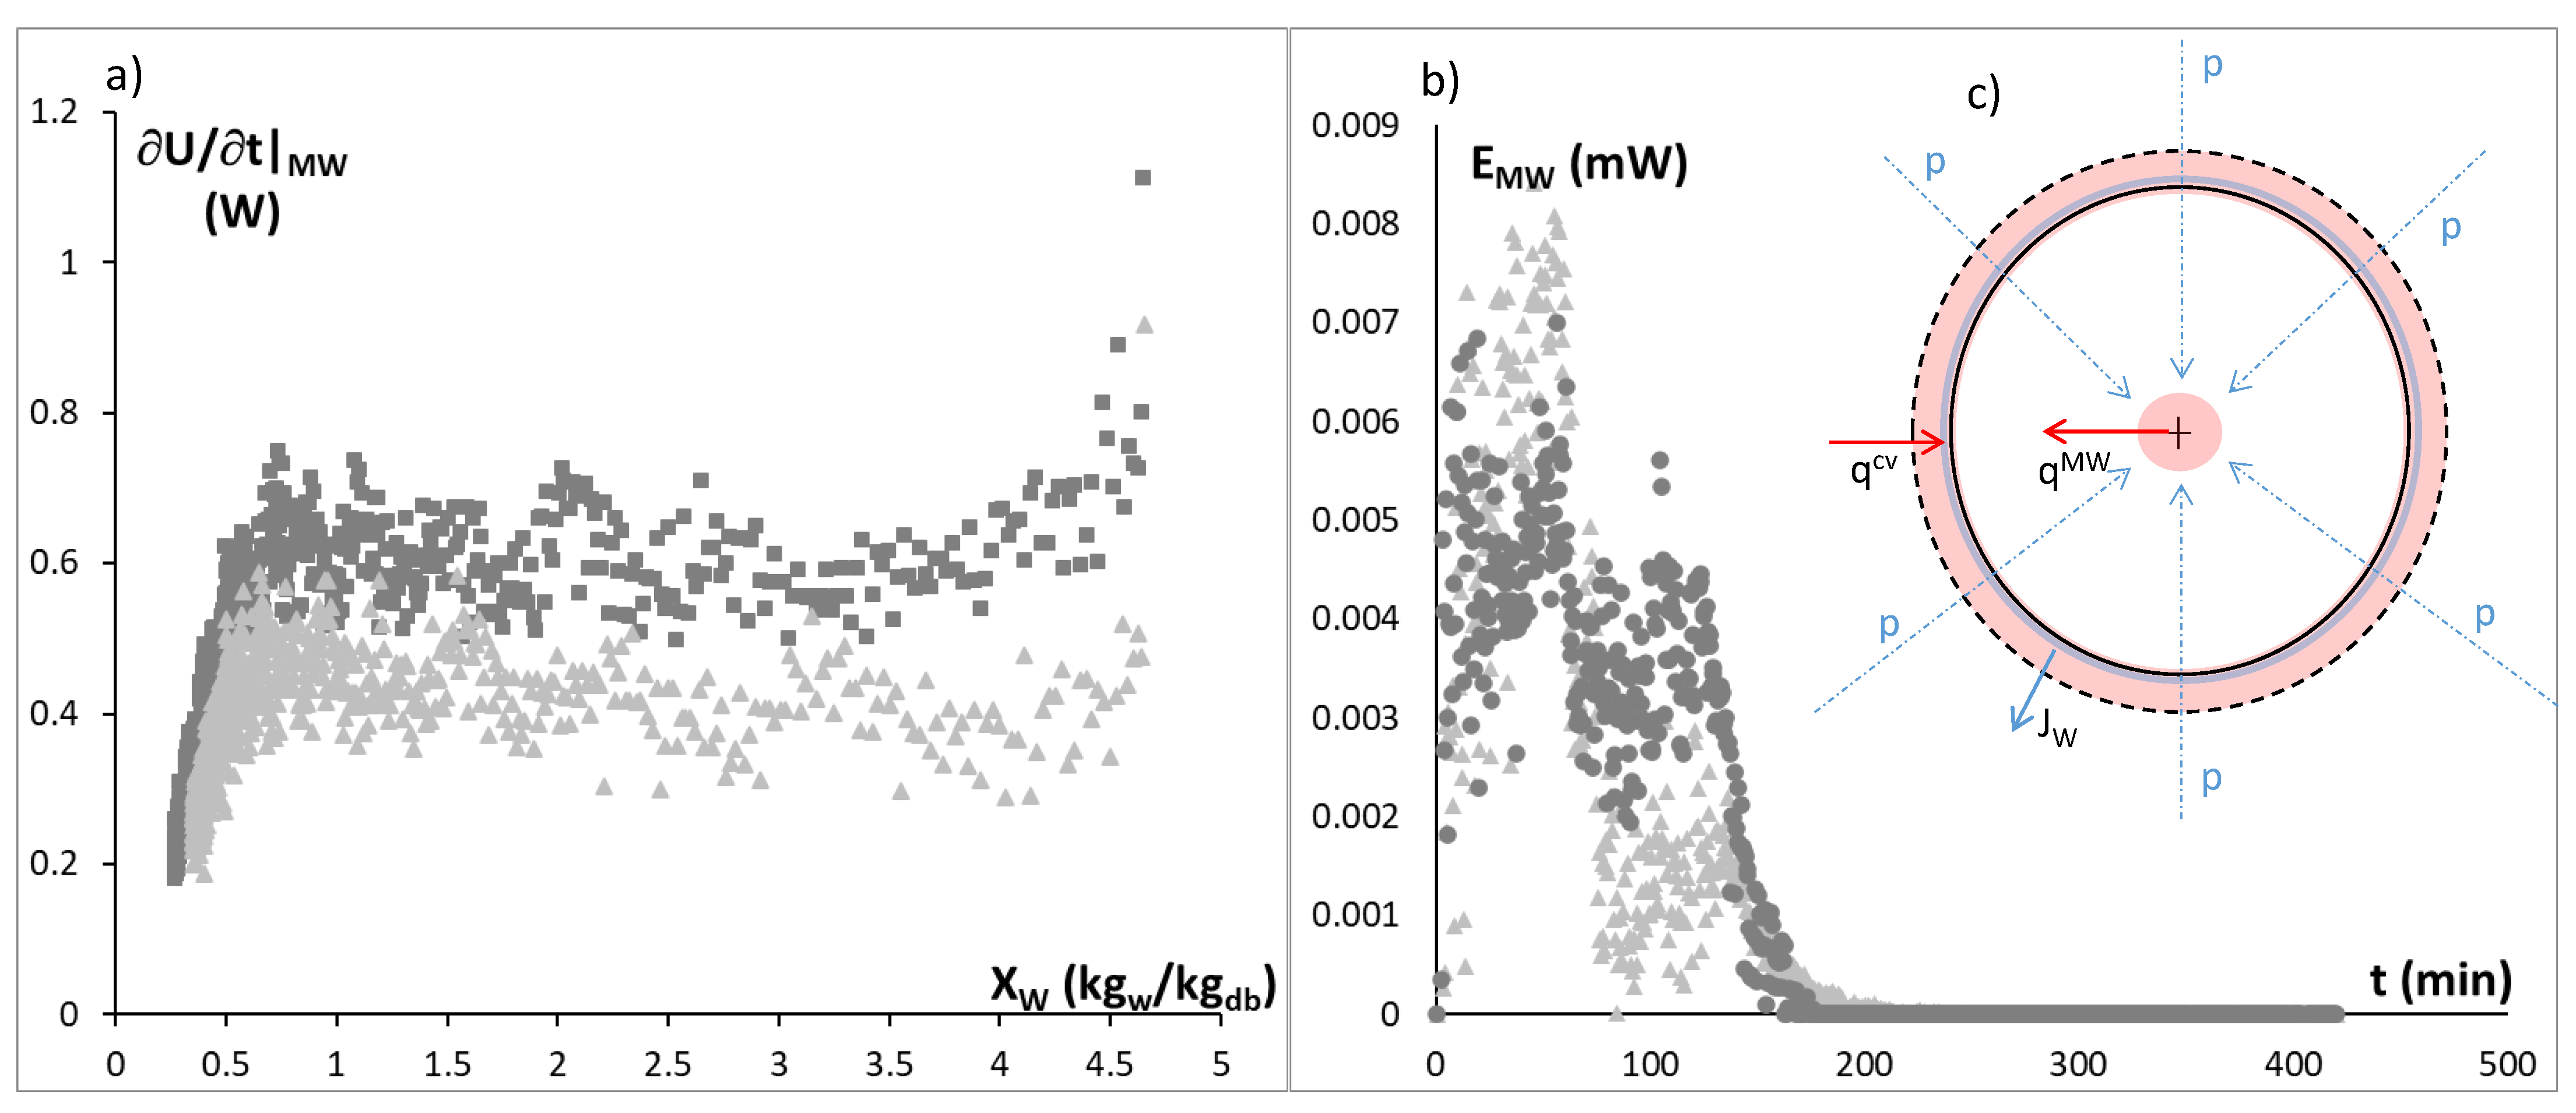
Figure 8a shows the internal energy variation associated with microwave heating, obtained from Equation (9), with regard to the sample moisture on a dry basis.
In order to better understand the heating process of microwave radiation, Figure 8c shows a diagram of the photon input at 2.45 GHz in the potato sphere, with a radius smaller than the microwave penetration depth, producing an accumulation of heat dissipation at the center of the sample. This phenomenon generates heat, which flows by conduction from the center to the surface. However, a small part of the dissipation of the electromagnetic energy of the photons is lost along the way, which is more evident in water molecules in the gas state because of their high mobility, flowing through the boundary layer, increasing the air surface temperature or producing more evaporation.
Considering that the evolution of the individual coefficient of heat convection is similar in all treatments, it is possible to calculate the surface heating by microwaves (EMW) by comparing, at each time, the surface temperature of each combined treatment with the HAD treatment, according to the following equation:
E M W =   S · δ B L · ρ A I R · X · C P v · ( T H A D + M W S T H A D S )
where ρAIR is the air density (kg/m3) obtained by the thermodynamic properties or air [6], X is the absolute moisture of air (kgw/kgdryair) and CPv is the specific heat of vapor at the surface temperature.
Figure 8b shows the surface heating by microwave evolution for combined drying treatments, where it is possible to observe that internal heating (Figure 8a) is 10,000 times higher than the surface heating by microwaves (Figure 8b). Consequently, in a combined drying process of hot air and microwaves at temperatures lower than the spontaneous evaporation temperature and in samples with a characteristic dimension less than the microwave penetration depth, it is possible to conclude that the convection heating is mostly transformed into surface water evaporation, and microwave heating is mostly transformed into an increase in the internal energy of the food, that is, an increase in the internal temperature.
Therefore, the measurement of the surface temperature by FTIR in the HAD process combined with microwave heating allows the HAD process and surface water evaporation to be monitored, but not the microwave heating process, because MW heats with high penetration. Thus, the FTIR technology allows the segregation of the effect of HAD and microwave heating in combined drying processes, making it possible to determine water removal. In the future, IR cameras with a higher frequency spectrum will be able to make direct measurements of the surface water content.

4. Conclusions

It is possible to apply FTIR to a HAD-MW combined drying process using an oven grill door with a mesh size that allows the hot air and photon radiation in the infrared spectrum to cross it, but not the photons in the microwave spectrum. As a result, the evolution of the drying process can be determined through the surface temperature of the sample.
It is shown that the higher effect of microwaves in the drying process occurs at moistures above the drying critical moisture, where the water molecules reduce their mobility and hinder the induction phenomena.
In a combined drying process of hot air and microwaves at temperatures lower than spontaneous evaporation and in samples with a characteristic dimension less than the microwave penetration depth, it is possible to conclude that the convection heating is mostly transformed into surface water evaporation, with negligible thermal conduction from the surface. Furthermore, microwave radiation is mostly transformed into an increase in the internal energy of the food, that is, an increase in the internal temperature, from the center to the surface.

Author Contributions

All authors contributed to the design of the research and wrote the paper. M.C.-G. and P.J.F. analyzed the data. J.A.T.-E. and M.V.T.-S. performed the experiments. All authors have read and agreed to the published version of the manuscript.

Funding

This research received no external funding.

Institutional Review Board Statement

Not applicable.

Informed Consent Statement

Not applicable.

Acknowledgments

The authors acknowledge the financial support from THE SPANISH MINISTERIO DE ECONOMÍA, INDUSTRIA Y COMPETITIVIDAD, Programa Estatal de I+D+i orientada a los Retos de la Sociedad AGL2016-80643-R, Agencia Estatal de Investigación (AEI) and Fondo Europeo de Desarrollo Regional (FEDER). Juan Ángel Tomás-Egea wants to thank the FPI Predoctoral Program of the Universitat Politècnica de València for its support.

Conflicts of Interest

The authors declare no conflict of interest.

Abbreviations

HADHot air drying
MWMicrowave radiation

Notation

φrelative humidity (dimensionless)
awwater activity (dimensionless)
δBLboundary layer depth (m)
δMWmicrowave penetration depth (m)
qcvconvective heat (W)
qMWmicrowave heat (W)
qcdconduction heat (W)
hindividual coefficient of heat convection (W/m2K)
kthermal conductivity (W/mK)
TSsurface or interface temperature (°C)
Teexternal or air-drying temperature (°C)
Jwwater flux (mol/m2s)
Ssurface (m2)
Uinternal energy (J)
ΔGvevaporation latent heat (kJ/kg)
Evevaporation energy (W)
Pabsmicrowave power absorber in potato (W)
εloss factor (dimensionless)
εdielectric constant (dimensionless)

References

  1. Traffano-Schiffo, M.V.; Castro-Giráldez, M.; Fito, P.J.; Balaguer, N. Thermodynamic model of meat drying by infrarred thermography. J. Food Eng. 2014, 128, 103–110. [Google Scholar] [CrossRef]
  2. Dehghannya, J.; Kadkhodaei, S.; Heshmati, M.K.; Ghanbarzadeh, B. Ultrasound-assisted intensification of a hybrid intermittent microwave—Hot air drying process of potato: Quality aspects and energy consumption. Ultrasonics 2019, 96, 104–122. [Google Scholar] [CrossRef]
  3. Turkan, B.; Canbolat, A.S.; Etemoglu, A.B. Numerical investigation of multiphase transport model for hot-air drying of food. J. Agric. Sci. 2019, 25, 518–529. [Google Scholar] [CrossRef] [Green Version]
  4. Cuibus, L.; Castro-Giráldez, M.; Fito, P.J.; Fabbri, A. Application of infrared thermography and dielectric spectroscopy for controlling freezing process of raw potato. Innov. Food Sci. Emerg. Technol. 2014, 24, 80–87. [Google Scholar] [CrossRef]
  5. Castro-Giráldez, M.; Fito, P.J.; Fito, P. Nonlinear thermodynamic approach to analyze long time osmotic dehydration of parenchymatic apple tissue. J. Food Eng. 2011, 102, 34–42. [Google Scholar] [CrossRef]
  6. Talens, C.; Castro-Giraldez, M.; Fito, P.J. A thermodynamic model for hot air microwave drying of orange peel. J. Food Eng. 2016, 175, 33–42. [Google Scholar] [CrossRef]
  7. Markx, G.H.; Davey, C.L. The dielectric properties of biological cells at radiofrequencies: Applications in biotechnology. Enzym. Microb. Technol. 1999, 25, 161–171. [Google Scholar] [CrossRef]
  8. Ashtiani, S.-H.M.; Sturm, B.; Nasirahmadi, A. Effects of hot-air and hybrid hot air-microwave drying on drying kinetics and textural quality of nectarine slices. Heat Mass Transf. 2018, 54, 915–927. [Google Scholar] [CrossRef]
  9. Dehghannya, J.; Bozorghi, S.; Heshmati, M.K. Low temperature hot air drying of potato cubes subjected to osmotic dehydration and intermittent microwave: Drying kinetics, energy consumption and product quality indexes. Heat Mass Transf. 2018, 54, 929–954. [Google Scholar] [CrossRef]
  10. Swain, S.; Samuel, D.V.K.; Bal, L.M.; Kar, A.; Sahoo, G.P. Modeling of microwave assisted drying of osmotically pretreated red sweet pepper (Capsicum annum L.). Food Sci. Biotechnol. 2012, 21, 969–978. [Google Scholar] [CrossRef]
  11. Talens, C.; Castro-Giraldez, M.; Fito, P.J. Effect of microwave power coupled with hot air drying on sorption isotherms and microstructure of orange peel. Food Bioprocess Technol. 2018, 11, 723–734. [Google Scholar] [CrossRef] [Green Version]
  12. Wang, Q.; Li, S.; Han, X.; Ni, Y.; Zhao, D.; Hao, J. Quality evaluation and drying kinetics of shitake mushrooms dried by hot air, infrared and intermittent microwave–assisted drying methods. LWT 2019, 107, 236–242. [Google Scholar] [CrossRef]
  13. Glowacz, A. Fault diagnosis of electric impact drills using thermal imaging. Measurement 2021, 171, 108815. [Google Scholar] [CrossRef]
  14. Gonçalves, B.J.; de Oliveira Giarola, T.M.; Pereira, D.F.; de Boas, E.V.B.V.; de Resende, J.V. Using infrared thermography to evaluate the injuries of cold-stored guava. J. Food Sci. Technol. 2016, 53, 1063–1070. [Google Scholar] [CrossRef] [PubMed]
  15. Gowen, A.A.; Tiwari, B.K.; Cullen, P.J.; McDonnell, K.; O’Donnell, C.P. Applications of thermal imaging in food quality and safety assessment. Trends Food Sci. Technol. 2010, 21, 190–200. [Google Scholar] [CrossRef]
  16. Costa, N.; Stelletta, C.; Cannizzo, C.; Gianesella, M.; Lo Fiego, P.; Morgante, M. the use of thermography on the slaughter-line for the assessment of pork and raw ham quality. Ital. J. Anim. Sci. 2007, 6, 704–706. [Google Scholar] [CrossRef]
  17. Ibarra, J.G.; Tao, Y.; Xin, H. Combined IR imaging-neural network method for the estimation of internal temperature in cooked chicken meat. Opt. Eng. 2000, 39, 3032. [Google Scholar] [CrossRef] [Green Version]
  18. Ibarra, J.G.; Tao, Y.; Cardarelli, A.J.; Shultz, J. Cooked and raw chicken meat: Emissivity in the mid-infrared region. Appl. Eng. Agric. 2000, 16, 143. [Google Scholar] [CrossRef]
  19. Gan-Mor, S.; Regev, R.; Levi, A.; Eshel, D. Adapted thermal imaging for the development of postharvest precision steam-disinfection technology for carrots. Postharvest Biol. Technol. 2011, 59, 265–271. [Google Scholar] [CrossRef]
  20. Baranowski, P.; Mazurek, W.; Wozniak, J.; Majewska, U. Detection of early bruises in apples using hyperspectral data and thermal imaging. J. Food Eng. 2012, 110, 345–355. [Google Scholar] [CrossRef]
  21. Zhou, X.; Ramaswamy, H.; Qu, Y.; Xu, R.; Wang, S. Combined radio frequency-vacuum and hot air drying of kiwifruits: Effect on drying uniformity, energy efficiency and product quality. Innov. Food Sci. Emerg. Technol. 2019, 56, 102182. [Google Scholar] [CrossRef]
  22. Su, D.; Lv, W.; Wang, Y.; Li, D.; Wang, L. Drying characteristics and water dynamics during microwave hot-air flow rolling drying of pleurotus eryngii. Dry. Technol. 2020, 38, 1493–1504. [Google Scholar] [CrossRef]
  23. Wei, S.; Wang, Z.; Wang, F.; Xie, W.; Chen, P.; Yang, D. Simulation and experimental studies of heat and mass transfer in corn kernel during hot air drying. Food Bioprod. Process. 2019, 117, 360–372. [Google Scholar] [CrossRef]
  24. Pu, Y.-Y.; Zhao, M.; O’Donnell, C.; Sun, D.-W. Nondestructive quality evaluation of banana slices during microwave vacuum drying using spectral and imaging techniques. Dry. Technol. 2018, 36, 1542–1553. [Google Scholar] [CrossRef]
  25. Navarrete, N.M.; Maupoey, P.F.; Esparza, M.E.M.; Boix, A.C. Diseño y construcción de una instalación experimental para el estudio de la cinética de secado combinado por aire caliente y microondas. Aliment. Equipos Tecnol. 2003, 22, 101–106. [Google Scholar]
Figure 1. Experimental setup and diagram of the experimental procedure.
Applsci 11 01730 g001
Figure 2. Scheme of heat and water mass transport mechanisms in a combined hot air drying (HAD) and MW drying process, where q represents heat, JW represents water flux, φe is the drying relative humidity, Te is the drying temperature, Ts is the surface of the sample temperature, aws is the water activity of the sample in the surface, the superscript MW means microwave, CV means convective and cd is conduction.
Applsci 11 01730 g002
Figure 3. Emissivity in the HAD treatment with regard to (a) moisture on a dry basis and (b) IR energy emitted by the sample.
Applsci 11 01730 g003
Figure 4. Evolution of surface temperature in the HAD treatment (■), HAD + 4 W/g treatment () and HAD + 6 W/g treatment ().
Applsci 11 01730 g004
Figure 5. The individual coefficient of heat convection with regard to (a) surface temperature in the HAD treatment and (b) drying time.
Applsci 11 01730 g005
Figure 6. (a) Plot of the thermal conductivity of dry air (●) and vapor (□) with regards to the temperature and (b) plot of the boundary layer depth with regards to the drying time: HAD treatment (■), HAD + 4 W/g treatment () and HAD + 6 W/g treatment ().
Applsci 11 01730 g006
Figure 7. Microwave sample effect: (a) The relationship between the microwave energy distribution ratio and the sample moisture expressed on a dry basis and (b) microwave heating throughout the drying time for HAD + 4 W/g () and HAD + 6 W/g () treatments.
Applsci 11 01730 g007
Figure 8. (a) Internal energy accumulation throughout the drying time for HAD + 4 W/g () and HAD + 6 W/g () treatments, (b) microwave heating of the boundary layer throughout the drying time for HAD + 4 W/g () and HAD + 6 W/g () treatments. (c) Scheme of the effect of microwaves in sample heating, where p represents the photon fluxes, qMW represents the heat conduction produced by the microwave heating source in the sample center, Jw is the water flux and qcv is the heat convection.
Applsci 11 01730 g008
Publisher’s Note: MDPI stays neutral with regard to jurisdictional claims in published maps and institutional affiliations.

