1. Introduction
Dental impression-taking is a basic technique of dental treatment used to recreate the oral cavity of individual patients. The obtained dental impression and the model created with it can be used for various tasks such as diagnosis, communication with the patient, treatment plan, restoration, and oral device fabrication [
1,
2,
3,
4,
5]. Therefore, obtaining an accurate dental impression is a very important starting point when providing optimal treatment to the patient [
3,
6,
7]. In particular, in the case of fabricating implant-supported prostheses after taking impressions, the accuracy of recording impressions for obtaining a passive fit is much more important than for a prosthesis fabricated on natural tooth abutments because there is no periodontal ligament between the implant fixture and the bone, and so the elasticity is low [
8,
9]. Proper implant position and restoration are related to the success of implant rehabilitation [
10]. An inaccurate prosthesis will result in tensile, compressive, and bending forces between the implant and the prosthesis, and these stresses can remain even after the prosthesis has functioned for several years [
11,
12,
13]. The increase in the complication rate with the occlusal load may be greater for implant restorations than for tooth-born restorations [
14,
15].
The first computer-aided design (CAD)/computer-aided manufacturing technology was introduced in the early 1980s, and the use of optical scanning equipment has become very widespread in recent years. Digital impressions and restorations can be made by using an intraoral scanner to digitally acquire images of teeth and surrounding tissues directly in the oral cavity, thereby replacing existing impressions (alginic acid, polyvinyl siloxane, or polyether) and eliminating errors that may occur when using other methods [
16,
17]. Consequently, fabrication of various types of implant prosthesis using a digital method has become common [
18,
19,
20]. In the workflow of manufacturing an implant prosthesis, it became possible to acquire digital data and fabricate a prosthesis by capturing an implant scan body (ISB) connected to the implant fixture, surrounding teeth, and soft tissue in three dimensions using an intraoral scanner [
21,
22]. The ISB is attached to the implant fixture placed in the oral cavity, and when it is scanned together with the surrounding structures, information such as the implant placement position and orientation that is not visible from the outside can be stored as a digital impression [
23]. After loading the obtained digital impression into CAD software, the virtual ISB library stored in the software is matched with the previously scanned ISB to store the location. Small inaccuracies may occur during this process [
24]. In particular, a low scan quality of the ISB may result in inaccuracies occurring during the registration process of the library of the ISB, producing errors in the implant fixture position of the virtual model [
24,
25].
Various studies have investigated the reproducibility of the implant position in an optical scan made using an ISB. It has been reported that the accuracy of implant position reproduction is affected by the implant angle [
17,
26], distance between implants [
27], scan body design [
28], and scan body material [
29]. One of these studies [
29] also investigated the accuracy according to the implant placement depth and the exposed length of the ISB, but the authors used implant placement depths of 0 mm, 3 mm, and 6 mm, which did not reflect the diverse range of depths at which implants are actually placed in clinical practice, and so the results were not suitable for utilization in guidelines. Moreover, there was the limitation that it was difficult to evaluate only the change in accuracy according to the exposed length of the ISB, because factors such as the angle, shape, and direction of the ISB were not controlled [
29]. Another previous study found that the accuracy of implant position reproduction differs with the exposed length of the ISB, which was revealed by dividing the exposed length of the ISB into groups from fully exposed to 2.5 mm less exposed [
24]. However, since only one type of tabletop scanner was used in that study, only the errors generated in the process of scanning the model were evaluated.
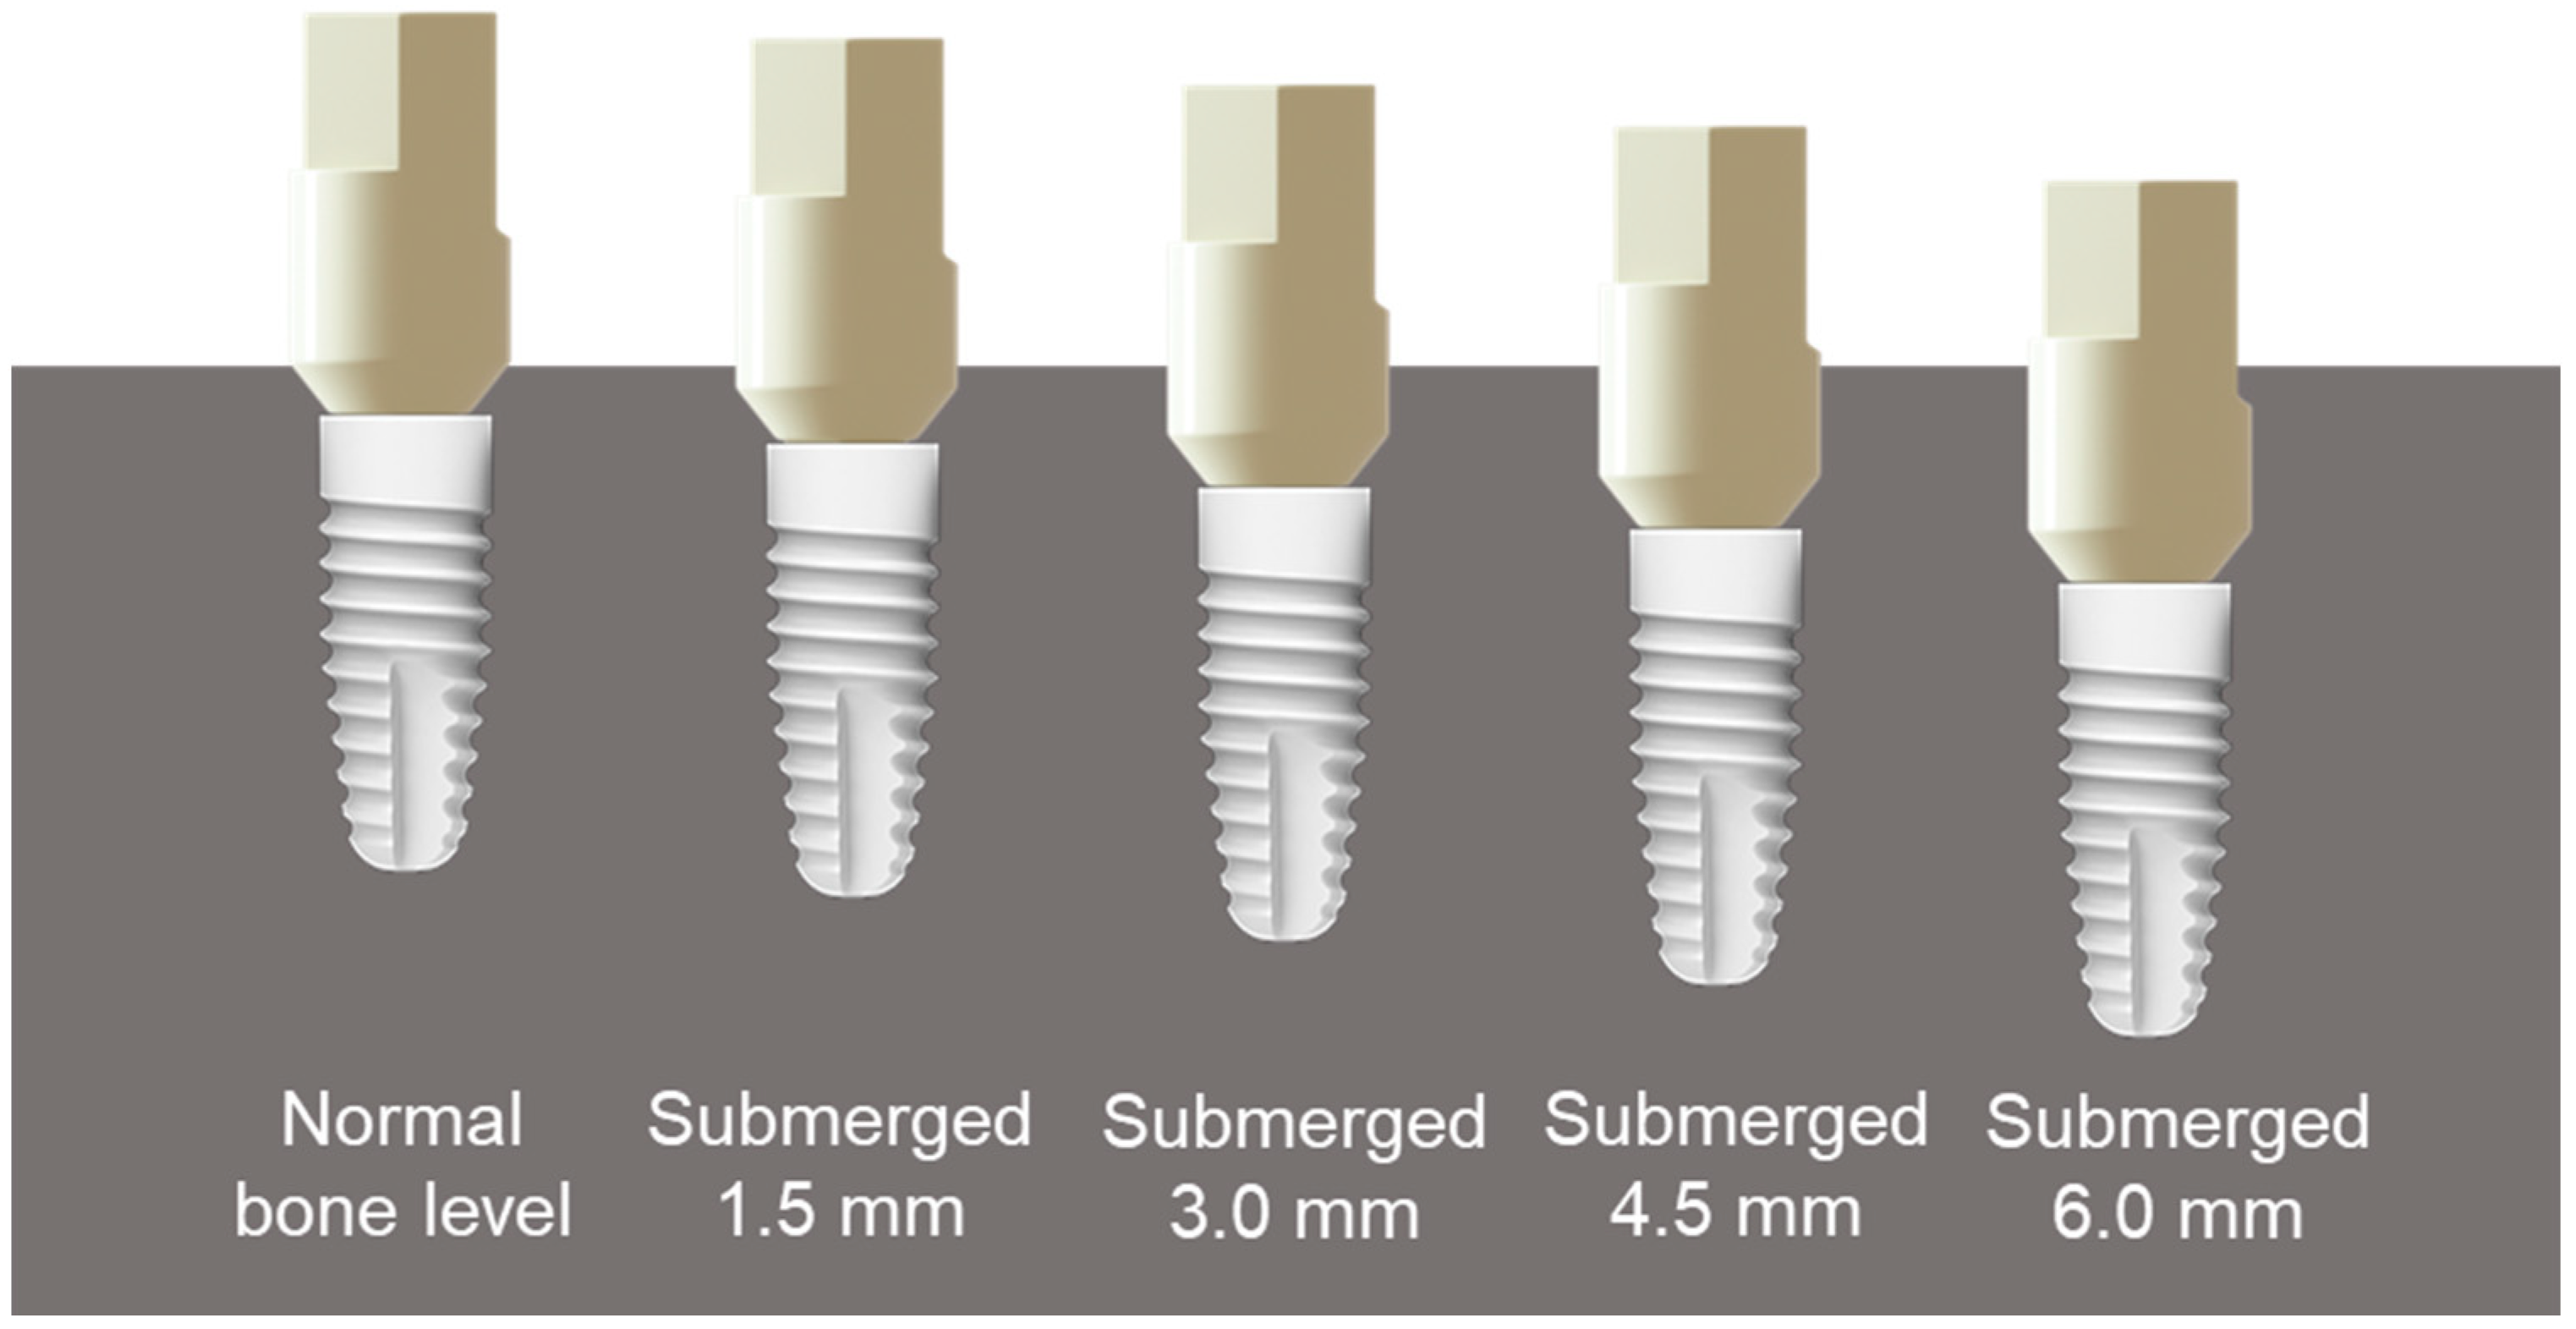
Therefore, the previous studies have had the limitation of the error that occurs when direct digitalization is performed using an intraoral scanner in the oral cavity being unknown. In clinical practice, the implant placement depth can vary greatly depending on the condition of the alveolar bone and surrounding gingiva, and so it is necessary to evaluate how the accuracy of direct digitalization varies with the level of implants and the exposed length of the ISB, and to produce a guideline that can be used by clinicians. Therefore, the purpose of this study was to adjust the exposed length of the ISB in the model by placing implants at the normal bone level, submerged 1.5 mm, submerged 3.0 mm, submerged 4.5 mm, and submerged 6.0 mm at the positions of the lateral incisor, first premolar, and first molar in a maxillary unilateral master model. The accuracy of implant position reproduction of the data scanned with the oral scanner was then evaluated. The null hypothesis of this study was that the accuracy of implant position reproduction does not vary with differences in the exposed length of the ISB, scanner type, or implant placement position.
2. Materials and Methods
The overall experimental workflow is summarized in
Figure 1.
A maxillary model (Dentiform, Nissin Dental Products, Kyoto, Japan) was scanned using a tabletop scanner (T500, Medit, Seoul, Korea), and the created study model was exported as files in Standard Tessellation Language (STL) format. The STL was imported into dental CAD software (Exocad DentalCAD, Exocad, Darmstadt, Germany). The lateral incisor, first premolar, and first molar of the model were removed to create a modified model in the form of an edentulous ridge. Five maxillary master models were printed using a 3D printer (Form 2, Formlabs, Somerville, MA, USA) and light-cured resin (standard gray resin, Formlabs). Screw-typed bone-level implants (10 mm long and diameter of 4.1 mm; Straumann, Basel, Switzerland) were placed where teeth were removed at different levels: Normal bone level, submerged 1.5 mm, submerged 3.0 mm, submerged 4.5 mm, and submerged 6.0 mm. The direction of the internal antirotation structure of the fixture was unified to keep the direction of the ISB the same as that of the implant in the buccal direction (
Figure 2 and
Figure 3).
Prior to scanning, all scanners were calibrated according to the manufacturers’ instructions. One tabletop scanner (T500, Medit) and the following three oral scanners were used: TRIOS 3 (3Shape, Copenhagen, Denmark), i500 (Medit), CS3600 (Carestream, Atlanta, GA, USA) (
Table 1). In order to reduce errors in the fastening direction of each ISB (SC-BLR, Geomedi, Gyeonggi-do, Korea), the flat surfaces of all ISBs were aligned to face the buccal direction. The scan was started from the occlusal surface of the posterior teeth of the model, the anterior teeth were scanned last, and comparison data were generated by scanning eight times for each scanner. After completing the scanning of all experimental groups, T500 reference data (T500-REF) were created using the tabletop scanner as the last step. In order to reduce errors associated with shortening of the exposed length of the ISB during the scanning process, the area around the implant was removed with denture burs from the models of all groups, adjusted to expose the entire ISB, and then scanned eight times.
In order to reproduce the position of the implant in the virtual model, the scanned ISB image was loaded into dental CAD software. The library for the ISB with the same shape as the scanned ISB was selected, and this library was first overlapped manually by clicking on a flat surface. Then, the two images were again superimposed to the optimal position using the best-fit matching function provided by the software. Abutment library data (RC-022.4325, Straumann) were automatically generated based on the location of the scanned ISB image. The replaced file was saved in STL format (
Figure 4). This process was applied to all scanned files.
For analyzing the scan data, 3D analysis software (Geomagic Control X, 3D Systems, Rock Hill, SC, USA) was used to compare all STL files obtained from the tabletop scanner and the intraoral scanners with reference scan STL files. After loading the reference data, the abutment regions were divided using an auto segmentation tool to analyze only the abutment area. This software was used to align the remaining comparison scan files using a best-fit algorithm that overlapped the shortest distance based on the reference data, and then the accuracy errors of the positional reproduction of the abutment library data were evaluated in three dimensions. To obtain data form tooth position, each model was analyzed three times in order of lateral incisor, first premolar, and first molar. The overall surface difference in distance between the reference data and the data from each oral scanner were evaluated by calculating root mean square (RMS) values, which were then displayed as a color map according to the tolerance range (
Figure 5). The RMS value indicates the difference between two surfaces in three dimensions and shows the similarity or disparity between the compared surfaces. Lower values indicate a more similar shape and higher values, greater diversity [
30]. RMS values were calculated using the following formula:
where
is the measurement point of the reference,
is the measurement point of the data set, and
is the total number of points measured in the analysis.
The accuracy of an intraoral scanner can be evaluated by analyzing its trueness and precision according to ISO-5725-1 [
31]. The trueness represents how close a comparison data value is to the reference value, and the precision represents the closeness of the values obtained in the test group [
32,
33]. A best-fit algorithm was used to analyze the trueness and precision of the generated data in three dimensions, as done in several previous studies [
33].
The SPSS statistical analysis software (version 25, IBM, Armonk, NY, USA) was used to analyze the RMS values obtained from the 3D analysis. A pilot study was previously conducted to confirm the sample size. Sample of 8 for each group was required for a statistical test power (1-β) of 90%. Three-way ANOVA was performed to analyze the three-way interactions between scanner, tooth position, and implant level. One-way ANOVA was performed to identify significant differences between groups and within groups in RMS values. Mean ± standard deviation values were calculated for each group, and then the obtained errors were compared and evaluated. Scheffe’s posttest was performed, and the significance cutoff was α = 0.05.
3. Results
Three-way ANOVA revealed significant main effects on trueness of implant level (F = 515.319, p < 0.001), scanner (F = 29.620, p < 0.001), and tooth position (F = 65.780, p < 0.001); significant two-way interaction effects between scanner and implant level (F = 13.122, p < 0.001), tooth position and implant level (7.875, p < 0.001), and scanner and tooth position (F = 2.237, p < 0.039); and a significant three-way interaction effect between scanner, tooth position, and implant level (F = 2.710, p < 0.001).
In order to identify the accuracy in reproducing the implant position according to changes in the exposed length of the ISB, scanner type, and tooth position, three-way ANOVA was performed to compare the average standard deviations of the RMS values (
Figure 6). The RMS values for trueness did not differ significantly between implant depths of normal bone level, submerged 1.5 mm, and submerged 3.0 mm (23.0 ± 12.4 µm, 24.3 ± 14.2 µm, and 27.2 ± 15.6 µm, respectively). However, when the ISB was submerged 4.5 mm, corresponding to deeper implant placement, the deviation increased significantly to 42.8 ± 25.1 µm, while a submersion of 6.0 mm showed the largest deviation of 102.5 ± 29.5 µm, indicating that the accuracy was degraded.
Comparisons of trueness with T500-REF data revealed that the accuracy varied with the type of scanner. The RMS value was 36.9 ± 33.7 µm for the T500 scanner, 50.8 ± 38.2 µm for the i500 scanner, and did not differ significantly between the TRIOS 3 (44.4 ± 41.7 µm) and CS3600 (46.5 ± 32.1 µm) scanners. The RMS value did not differ significantly between the first premolar (36.9 ± 33.8 µm) and the first molar (42.5 ± 36.8 µm), but was significantly higher for the implant placed on the lateral incisor (55.9 ± 37.9 µm), indicating lower accuracy.
One-way ANOVA was performed to evaluate the trueness according to changes in the exposed length of the ISB, scanner type, and tooth position (
Table S1,
Figure 7). The RMS value tended to be low in all of the implanted groups when the implant was installed at the normal bone level. The T500 scanner showed the lowest variance in all groups, and the highest trueness. For this scanner, when the implant was submerged 6.0 mm at the positions of the lateral incisor, first premolar, and first molar, the RMS values increased significantly to 108.0 ± 26.1 µm, 74.4 ± 17.0 µm, and 75.5 ± 30.9 µm, respectively, indicating decreased trueness. In the case of the TRIOS 3 scanner, when the implant was submerged 4.5 mm at the positions of the lateral incisor and first molar, the RMS values increased significantly to 53.4 ± 6.9 µm and 35.9 ± 17.5 µm, respectively. For a submersion of 6.0 mm, the RMS values at the lateral incisor, first premolar, and first molar increased rapidly to 125.8 ± 5.4 µm, 117.2 ± 6.8 µm, and 125.6 ± 2.9 µm, respectively, indicating decreased trueness. In the case of the i500 scanner, the RMS value increased significantly to 43.1 ± 12.0 µm when the implant was submerged 3.0 mm at the position of the lateral incisor. At the positions of the first premolar and first molar, when the ISB was submerged 4.5 mm, the RMS values were significantly higher at 71.3 ± 8.3 µm and 57.8 ± 10.1 µm, respectively. For a submersion of 6.0 mm, the RMS values at the positions of the lateral incisor, first premolar, and first molar were 122.5 ± 4.1 µm, 112.5 ± 14.0 µm, and 118.4 ± 8.7 µm, respectively, indicating sharp increases in the deviation. For the CS3600 scanner, the deviation increased significantly to 93.6 ± 15.0 µm when the implant was submerged 4.5 mm at the position of the lateral incisor. For a submersion of 6.0 mm, the RMS values at the positions of the lateral incisor, first premolar, and first molar were significantly higher, at 107.0 ± 20.4 µm, 65.5 ± 37.9 µm, and 77.3 ± 35.6 µm, respectively.
Three-way ANOVA revealed significant main effects on precision of implant level (F = 37.463, p < 0.001), scanner (F = 711.301, p < 0.001), and tooth position (F = 29.671, p < 0.001); significant two-way interaction effects between scanner and implant level (F = 14.842, p < 0.001), tooth position and implant level (6.035, p < 0.001), and scanner and tooth position (F = 3.809, p < 0.001); and a significant three-way interaction between scanner, tooth position, and implant level (F = 3.660, p < 0.001).
Three-way ANOVA was performed to check the accuracy of reproducibility of the implant position according to changes in the exposed length of the ISB, scanner type, and tooth position (
Figure 8). The RMS values for precision did not differ significantly for implants at the normal bone level and for a submersion of 1.5 mm (21.8 ± 17.5 µm and 22.1 ± 18.2 µm, respectively). When the ISB was submerged 3.0 mm, 4.5 mm, and 6.0 mm, the deviation increased significantly to 26.3 ± 21.9 µm, 31.1 ± 27.9 µm, and 44.0 ± 39.2 µm, respectively, indicating worsening accuracy.
The precision varied with the type of scanner, being highest for T500-REF data (5.1 ± 3.4 µm), followed by the T500 (8.4 ± 8.0 µm), TRIOS 3 (32.0 ± 22.5 µm), i500 (39.0 ± 27.3 µm), and CS3600 (47.5 ± 28.8 µm) scanners. The RMS value did not differ significantly between the first premolar (27.8 ± 25.9 µm) and the first molar (25.6 ± 25.7 µm), but was higher for the lateral incisor (33.7 ± 29.9 µm), indicating relatively low positional reproducibility accuracy.
The average standard deviation of the RMS value was calculated to analyze the precision of the scanner measurements according to changes in the exposed length of the ISB (
Table S2,
Figure 9). The RMS value for precision tended to be low in all groups when the implant depth was at the normal bone level. In the case of T500-REF data, the deviation was low in all groups, indicating the highest precision. In the case of the T500 control group, when the implant was submerged 4.5 mm and 6.0 mm at the positions of the lateral incisor and first premolar, the RMS value increased significantly to 19.8 ± 12.8 µm and 15.4 ± 7.1 µm, respectively, indicating that the precision decreased. With the TRIOS 3 scanner, when the implant depth was 6.0 mm at the positions of the lateral incisor, first premolar, and first molar, the RMS values increased significantly to 62.0 ± 36.8 µm, 46.6 ± 25.6 µm, and 38.8 ± 35.2 µm, respectively. In the case of the i500 scanner, the RMS value increased significantly to 39.4 ± 21.0 µm and 36.4 ± 20.7 µm when the ISB was submerged 3.0 mm at the positions of the first premolar and first molar, respectively. In the case of the CS3600 scanner, the RMS value increased significantly when the implant was submerged 1.5 mm at the positions of the lateral incisor and first premolar, to 43.8 ± 20.1 µm and 40.1 ± 16.3 µm, respectively.
In all of the present analyses, the STL files were superimposed on the reference scan using a best-fit algorithm with the least-squares method. This algorithm first calculated the direction and closest distance from each vertex of a polygon of the reference data to the triangular surface of the corresponding polygon of the comparison data. A representative image was obtained that displayed the absolute deviations using false colors (
Figure 10). That figure shows that the overall deviation in the analyzed abutment area was within 0.05 at the normal bone level, with green color appearing for submersions of 1.5 mm and 3.0 mm, except in a small area of the lateral incisor. However, for a submersion of 4.5 mm, the area of deviation sharply increased, while for a submersion of 6.0 mm the deviation occurred throughout the abutment.
4. Discussion
This in vitro study evaluated the effects of changes in the exposed length of the ISB and implant placement on the image matching process and the accuracy of implant placement when using three oral scanners and one tabletop scanner. The obtained results confirmed that a shorter exposed length of the ISB caused a larger error in the virtual implant location due to inaccuracies in the image matching process performed in the dental CAD software. It was additionally found that the trueness and precision differed with the type of scanner used and the implant placement position. Therefore, the null hypothesis of this study, that the type of scanner used, the exposed length of the ISB, and implant placement position do not affect the accuracy of implant position reproduction was rejected.
The accuracy of implant position reproduction tended to decrease as the exposed length of the ISB decreased in all scanner groups. In the case of trueness, the deviation started to increase at a submersion of 4.5 mm. When the implant was submerged 6.0 mm, which corresponded to the shortest exposed length of the ISB, the RMS value increased rapidly. Additionally, in the case of precision, there was no change in the deviation at the normal bone level and for a submersion of 1.5 mm, but the RMS value started to increase significantly from a submersion of 3.0 mm. The error increased rapidly in the groups with submersion of 4.5 mm and 6.0 mm, and the accuracy of implant position reproduction was affected when the ISB exposed area decreased. When the implant was placed at the normal bone level, submerged 1.5 mm, and 3.0 mm, the deviation was not large. This is because the exposed length of the ISB connected to the implant was sufficient for the area used in image matching to be accurately scanned and created. This indicates that the resulting scan data produced accurate results even in the process of image matching in the dental CAD software and did not affect the reproduction of the implant position.
The accuracy of position reproduction was lower at the lateral incisor than at the first premolar and first molar in terms of both trueness and precision. This may be due to increasing errors during the stitching process in the arch of the canine area of the model during scanning, or errors accumulating with increasing scan area. Gimenez et al. found that the first scanned area was more accurate than the last scanned area due to the accumulation of stitching errors during the scanning process [
34]. Mangano et al. similarly compared the accuracy of implant position reproduction between a single implant model and a model with multiple implants placed, and found that the deviation increased as the scan area lengthened [
35]. The results of these previous studies are consistent with our findings.
Comparing the RMS values between the scanners revealed that the T500 scanner showed the highest accuracy at the normal bone level and for submersions of 1.5 mm, 3.0 mm, and 4.5 mm, whereas for a submersion of 6.0 mm, the RMS value increased rapidly to 86.0 ± 29.0 µm. In the case of tabletop scanners, although it is known that their precision is very high, the accuracy deteriorated as the exposed length of the ISB decreased. This shows that even when accurate scan data are obtained, the error increases when the area for matching the scan-body library is too small [
24]. In addition, the scanning angle is smaller for tabletop scanners than for oral scanners, which also affects the accuracy [
36,
37]. For the TRIOS 3 scanner, the trueness was highest at the normal bone level and for submersions of 1.5 mm, 3.0 mm, and 4.5 mm, and there were no significant differences between the i500 and CS3600 scanners. A similar trend appeared for the precision. The deviation was lowest in the T500-REF group, followed by (in increasing order) the T500, TRIOS 3, i500, and CS3600 scanners.
The trends found in this study are similar to those found in previous studies conducted under similar conditions. Our trueness analysis revealed that the accuracy of position reproduction was affected when the implant placement depth was at least 4.5 mm. Giménez et al. [
17] showed a similar trend, concluding that the accuracy of digital impressions was not affected when implants were placed in the model at 0 mm, 2 mm, and 4 mm, and the ISB is attached. When the exposed length of the ISB was sufficient, a small change in that length did not significantly affect the accuracy. On the other hand, when assessing image matching according to the exposed length of the ISB, Choi et al. [
24] found that for exposed lengths of the ISB of full exposure, 0.5 mm less exposure, 1.0 mm less exposure, 1.5 mm less exposure, 2.0 mm less exposure and 2.5 mm less exposure, the RMS values increased to 16.1 ± 1.1 µm, 93.4 ± 0.8 µm, 158.6 ± 1.2 µm, 300.4 ± 1.0 µm, 606.2 ± 1.3 µm, and 948.4 ± 8.4 µm, respectively, which differed from the results of the present study. This may be due to differences in the designs of the study models used in the experiments, scanning technologies, types of ISB used, algorithm modification methods, and other applied scanning protocols.
The overall deviations of trueness obtained using the CS3600 scanner were 27.0 ± 10.4 µm, 24.7 ± 6.8 µm, and 23.7 ± 15.8 µm at the lateral incisor, first premolar, and first molar, respectively, when the implant was placed at the bone level. Imburgia et al. [
38] found a similar accuracy of 24.8 ± 4.6 µm, and that the RMS tended to increase as the implant depth increased to 4.5 mm and 6.0 mm. The RMS value for precision obtained using the TRIOS 3 scanner was 23.1 ± 10.2 µm at the first premolar when the implant was placed at the bone level, and 25.1 ± 12.4 µm at the first molar, which were similar to the findings of Imburgia et al. The study also analyzed the precision of implant digital impression using a PEEK ISB made in the shape of a unilateral implant cylinder, and found an RMS value of 24.5 ± 3.7 µm. However, in the present study, the accuracy at the position of the lateral incisor was found to decrease significantly, showing a higher RMS value of 38.2 ± 20.0 µm.
The errors found in this study when digital impressions were acquired while the exposed length of the ISB was insufficient can be considered high from a clinical standpoint. An error occurring in the first impression-taking step during the process of manufacturing a prosthesis may affect the accuracy of the implant prosthesis. This study has demonstrated that the exposed length of the ISB connected for digital impression acquisition can affect the positional reproducibility of the implant abutment. It was found that the precision was affected when the implant was submerged by at least 3.0 mm, while the trueness was affected for a submersion of at least 4.5 mm. The study results can be utilized when formulating a guideline on the accuracy of implant position reproduction according to various implant placement depths, implant positions, and types of oral scanners when fabricating implant prostheses with an oral scanner in clinical practice. If the exposed length of the ISB is insufficient when it is being scanned using the digital impression-taking technique in clinical practice, considering the level of the implant, the impression should instead be obtained using the conventional technique. Additionally, it was confirmed that even if an impression is obtained using conventional techniques, if the impression is digitized indirectly with a tabletop scanner, the errors that occur will vary with the exposed length of the ISB. Therefore, extra caution is needed in the digital prosthesis production workflow. Rather than connecting the ISB directly to the fixture, the accuracy can be increased by connecting a component of a supragingival level using a stock abutment or a multiunit abutment first and then performing a digital scan with an ISB. Another approach is to use the conventional method from taking an impression to making prosthesis. In addition, since the present study has confirmed that the accuracy of digital scans of lateral incisors is low, it is necessary to pay more attention to the scanning process when using digital scanning to fabricate an anterior prosthesis.
This study has confirmed that the precision and trueness decrease for implant depths of at least 3.0 mm and 4.5 mm, respectively, and that the implant placement position and the scanner used affect the accuracy of implant position reproduction. However, additional research is needed to determine the effect of the ISB on accuracy when taking digital impressions. When evaluating the accuracy according to changes in the exposed length of the ISB, this study controlled various factors but tested only one type of ISB. It is possible that the material or geometry of the ISB used could affect the accuracy of registration of the library data, and so additional research is needed into the effects of the characteristics of the ISB. Moreover, the accuracy of digital impressions obtained in the real oral cavity may differ from the results obtained in in vitro studies such as the present one, since factors such as blood, saliva, shiny metal restorations, and tongue movement can interfere with the scanning process so as to make data acquisition more difficult. Therefore, deeper insights can be gained by conducting additional clinical studies.


