
Contamination and Potential Risk Assessment of Polycyclic Aromatic Hydrocarbons (PAHs) and Heavy Metals in House Settled Dust Collected from Residences of Young Children


 ,
,
Abstract
:1. Introduction
2. Material and Methods
2.1. Study Design and Dust Sample Collection
2.2. Samples Clean Up and Preparation
2.3. Laboratory Analysis of PAHs
2.4. Laboratory Analysis of Trace Metals
2.5. QA and QC
2.5.1. PAHs
2.5.2. Trace Metals
2.6. Statistical Analysis
2.7. Enrichment Factors
2.8. Cancer Risk Assessment of PAHs in Settled House Dust
2.9. Health Risk Assessment of Metals in Settled House Dust
3. Results and Discussion
3.1. PAH and Trace Metals Concentrations
3.1.1. PAHs
3.1.2. Trace Metals
3.2. Relationship between PAH and Trace Metals Concentrations and Household Characteristics
3.2.1. PAHs
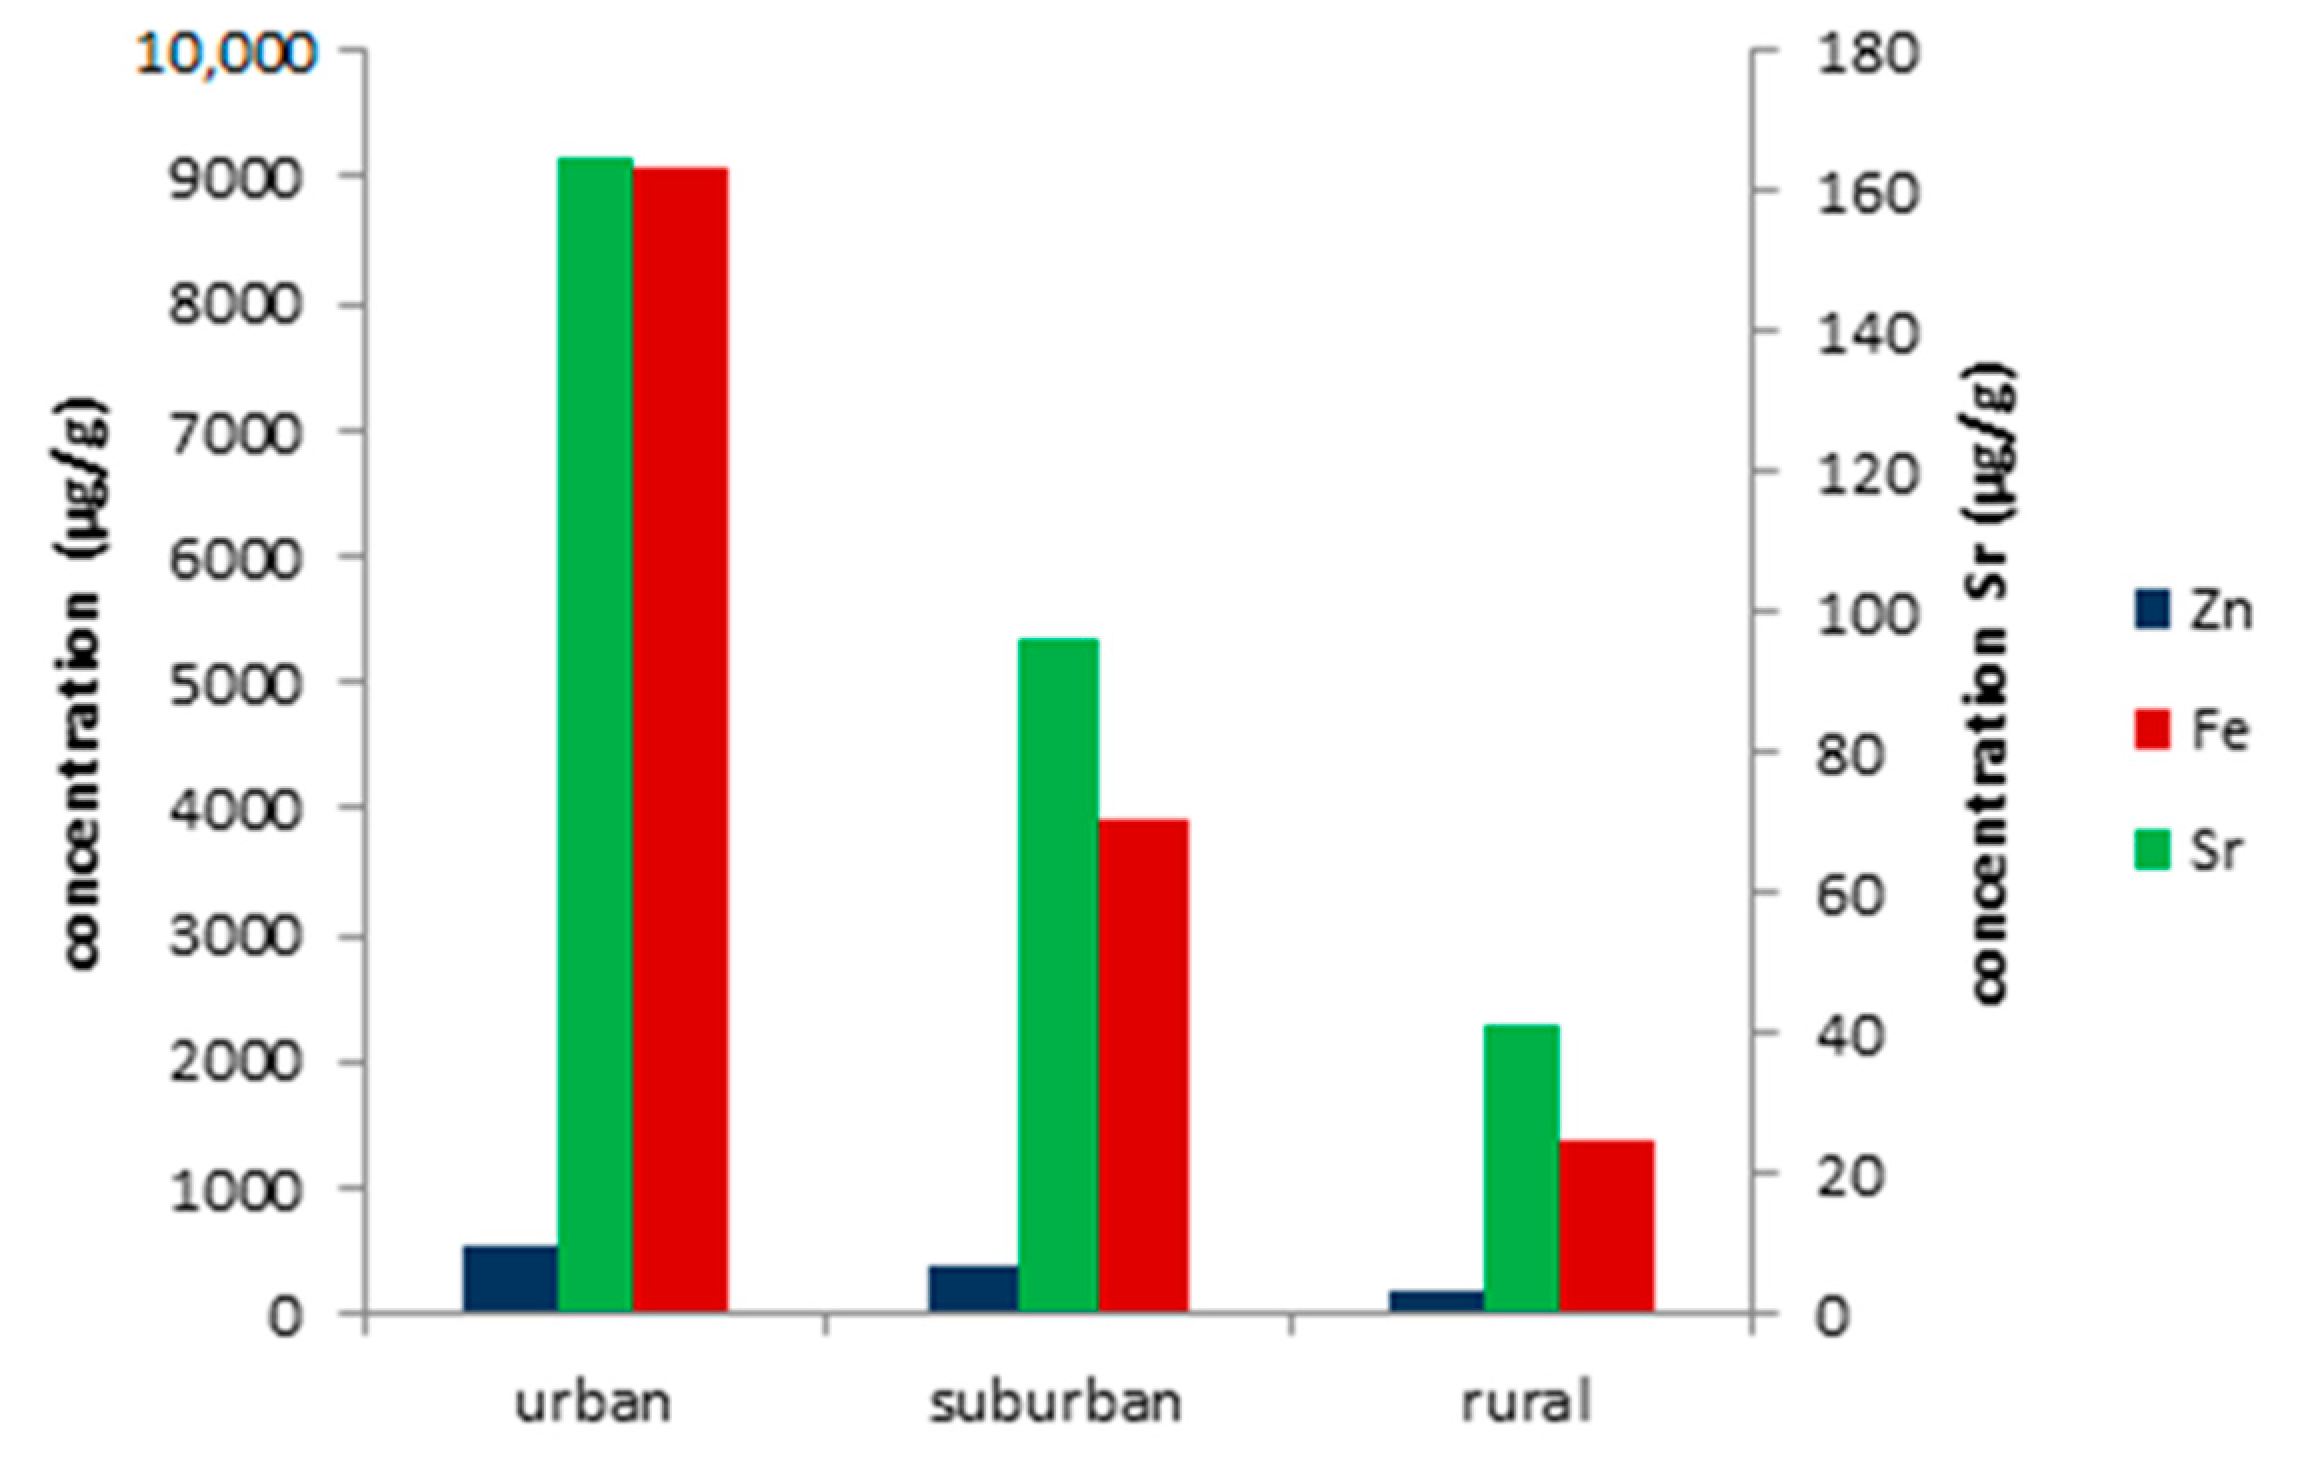
3.2.2. Metals
3.3. Relationship between PAH and Trace Metals Concentrations and Occupant Activities
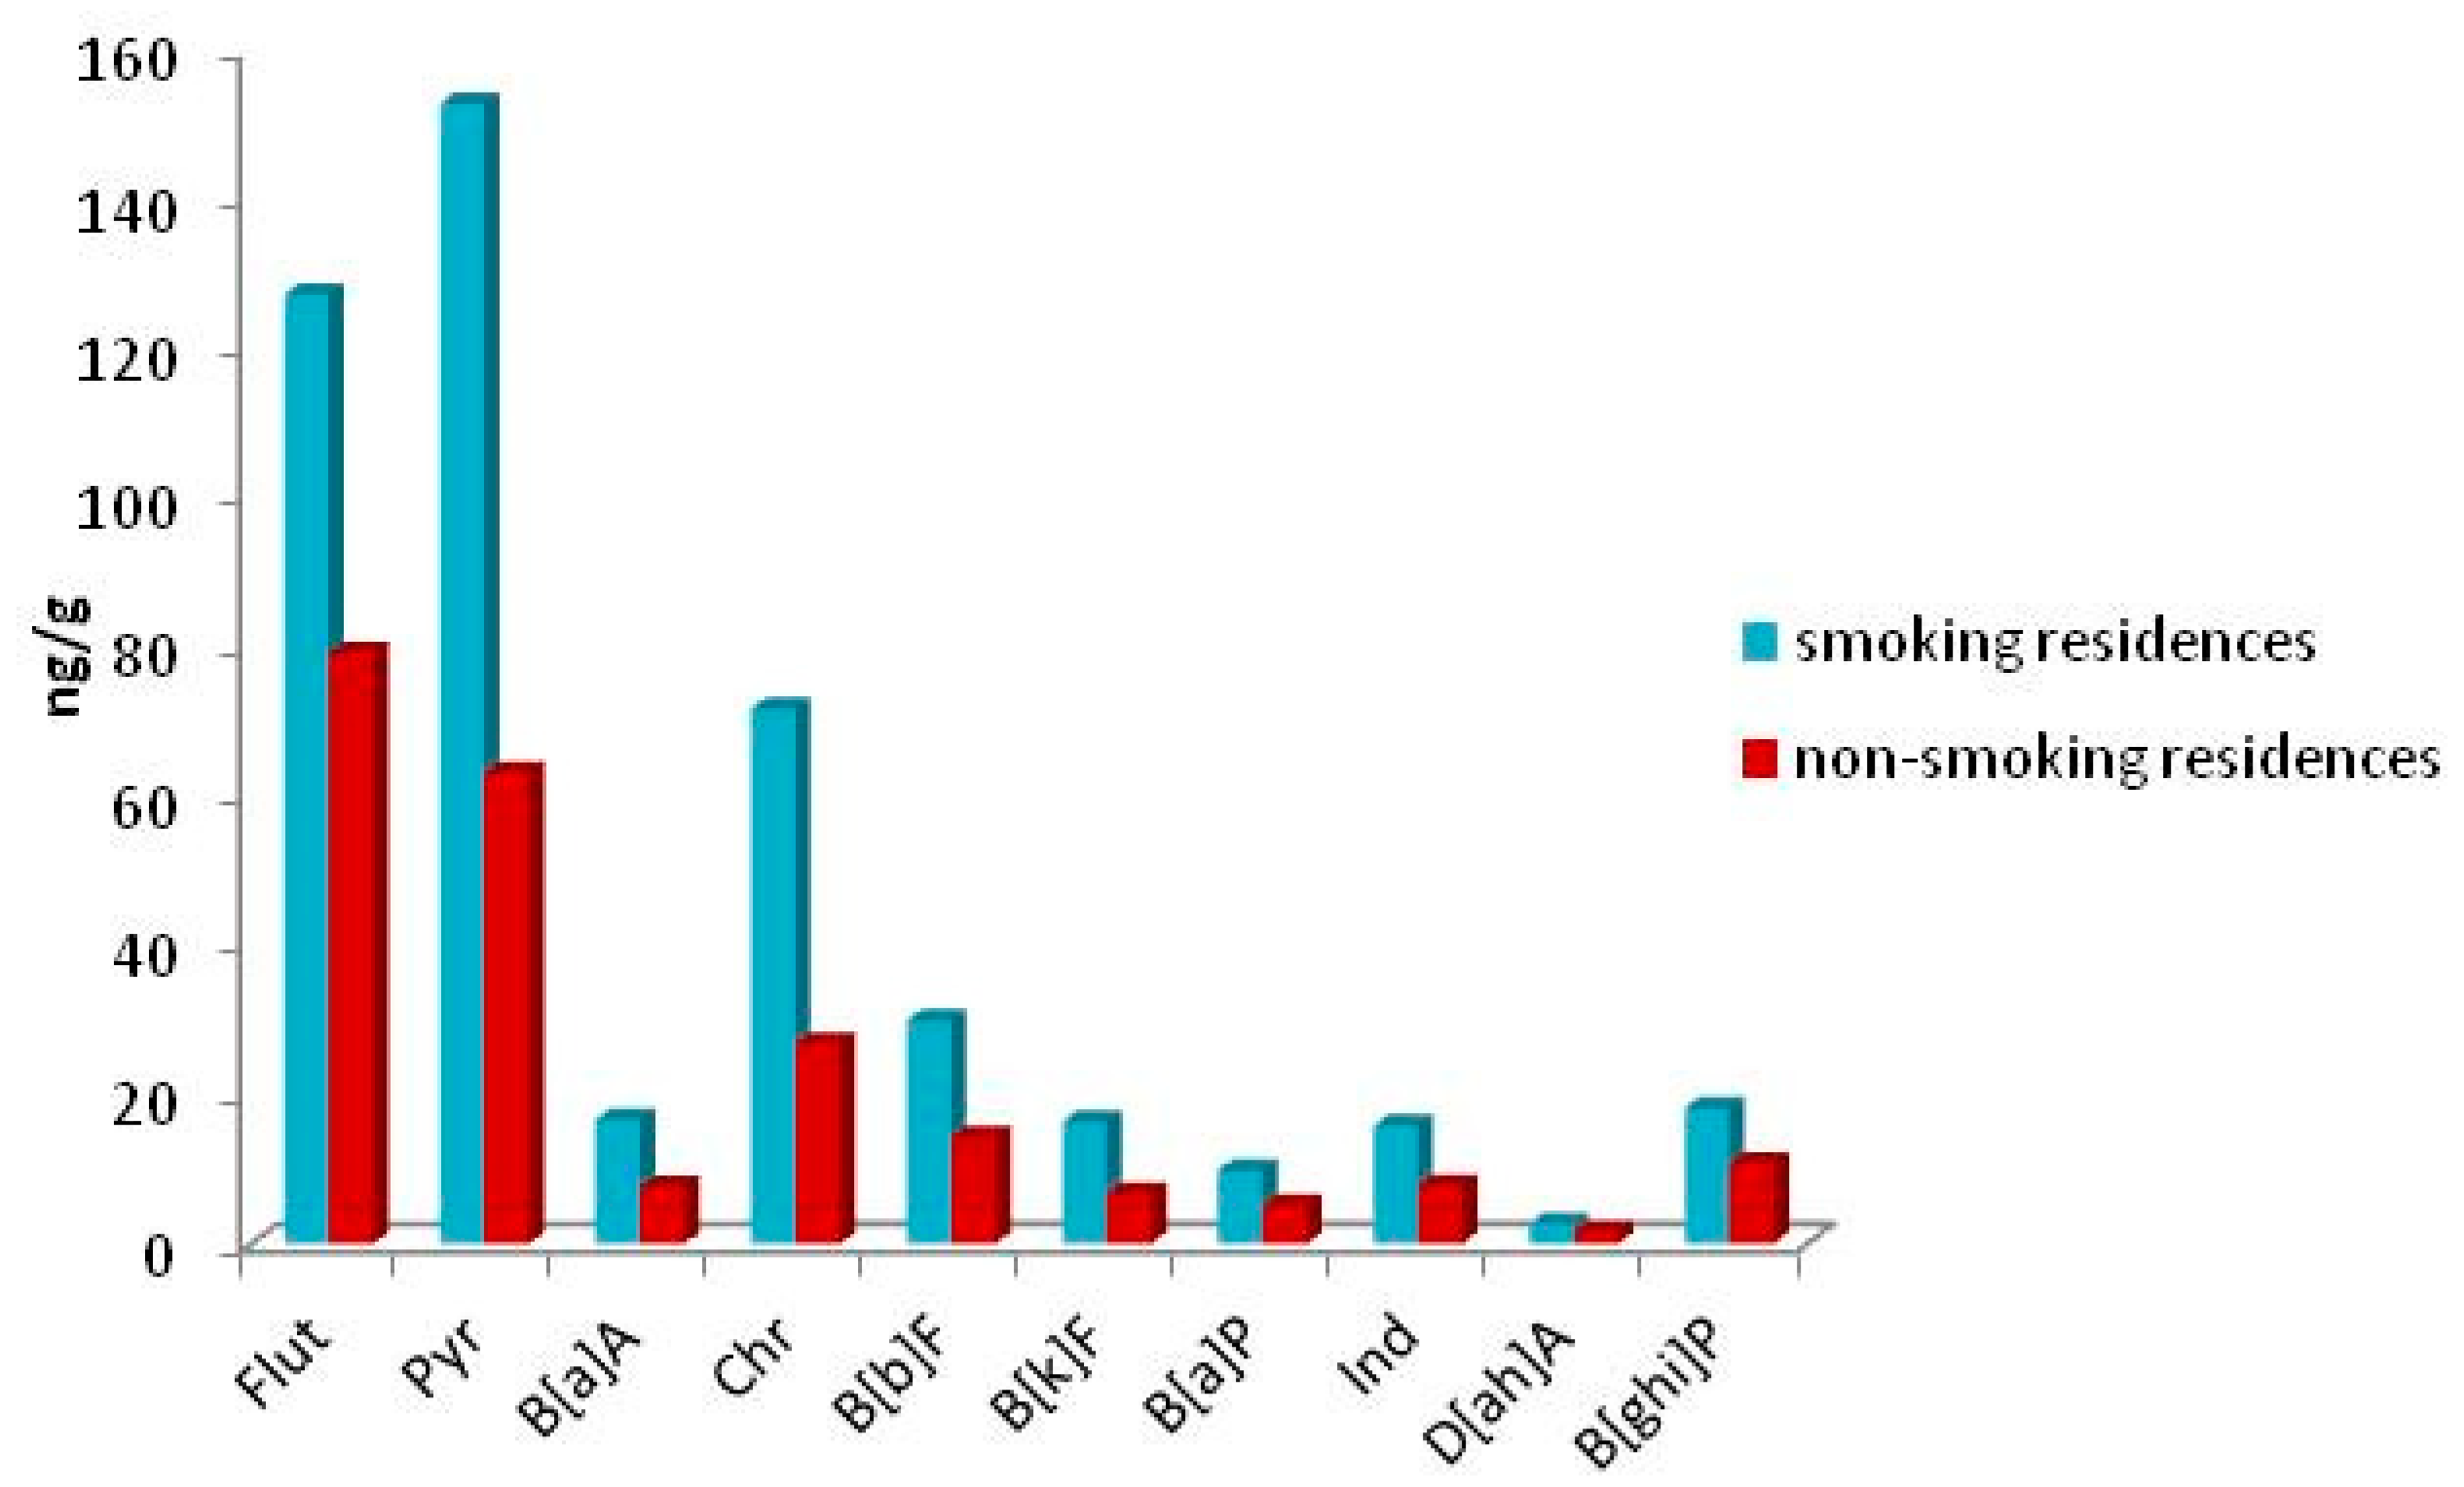
3.3.1. PAHs
3.3.2. Metals
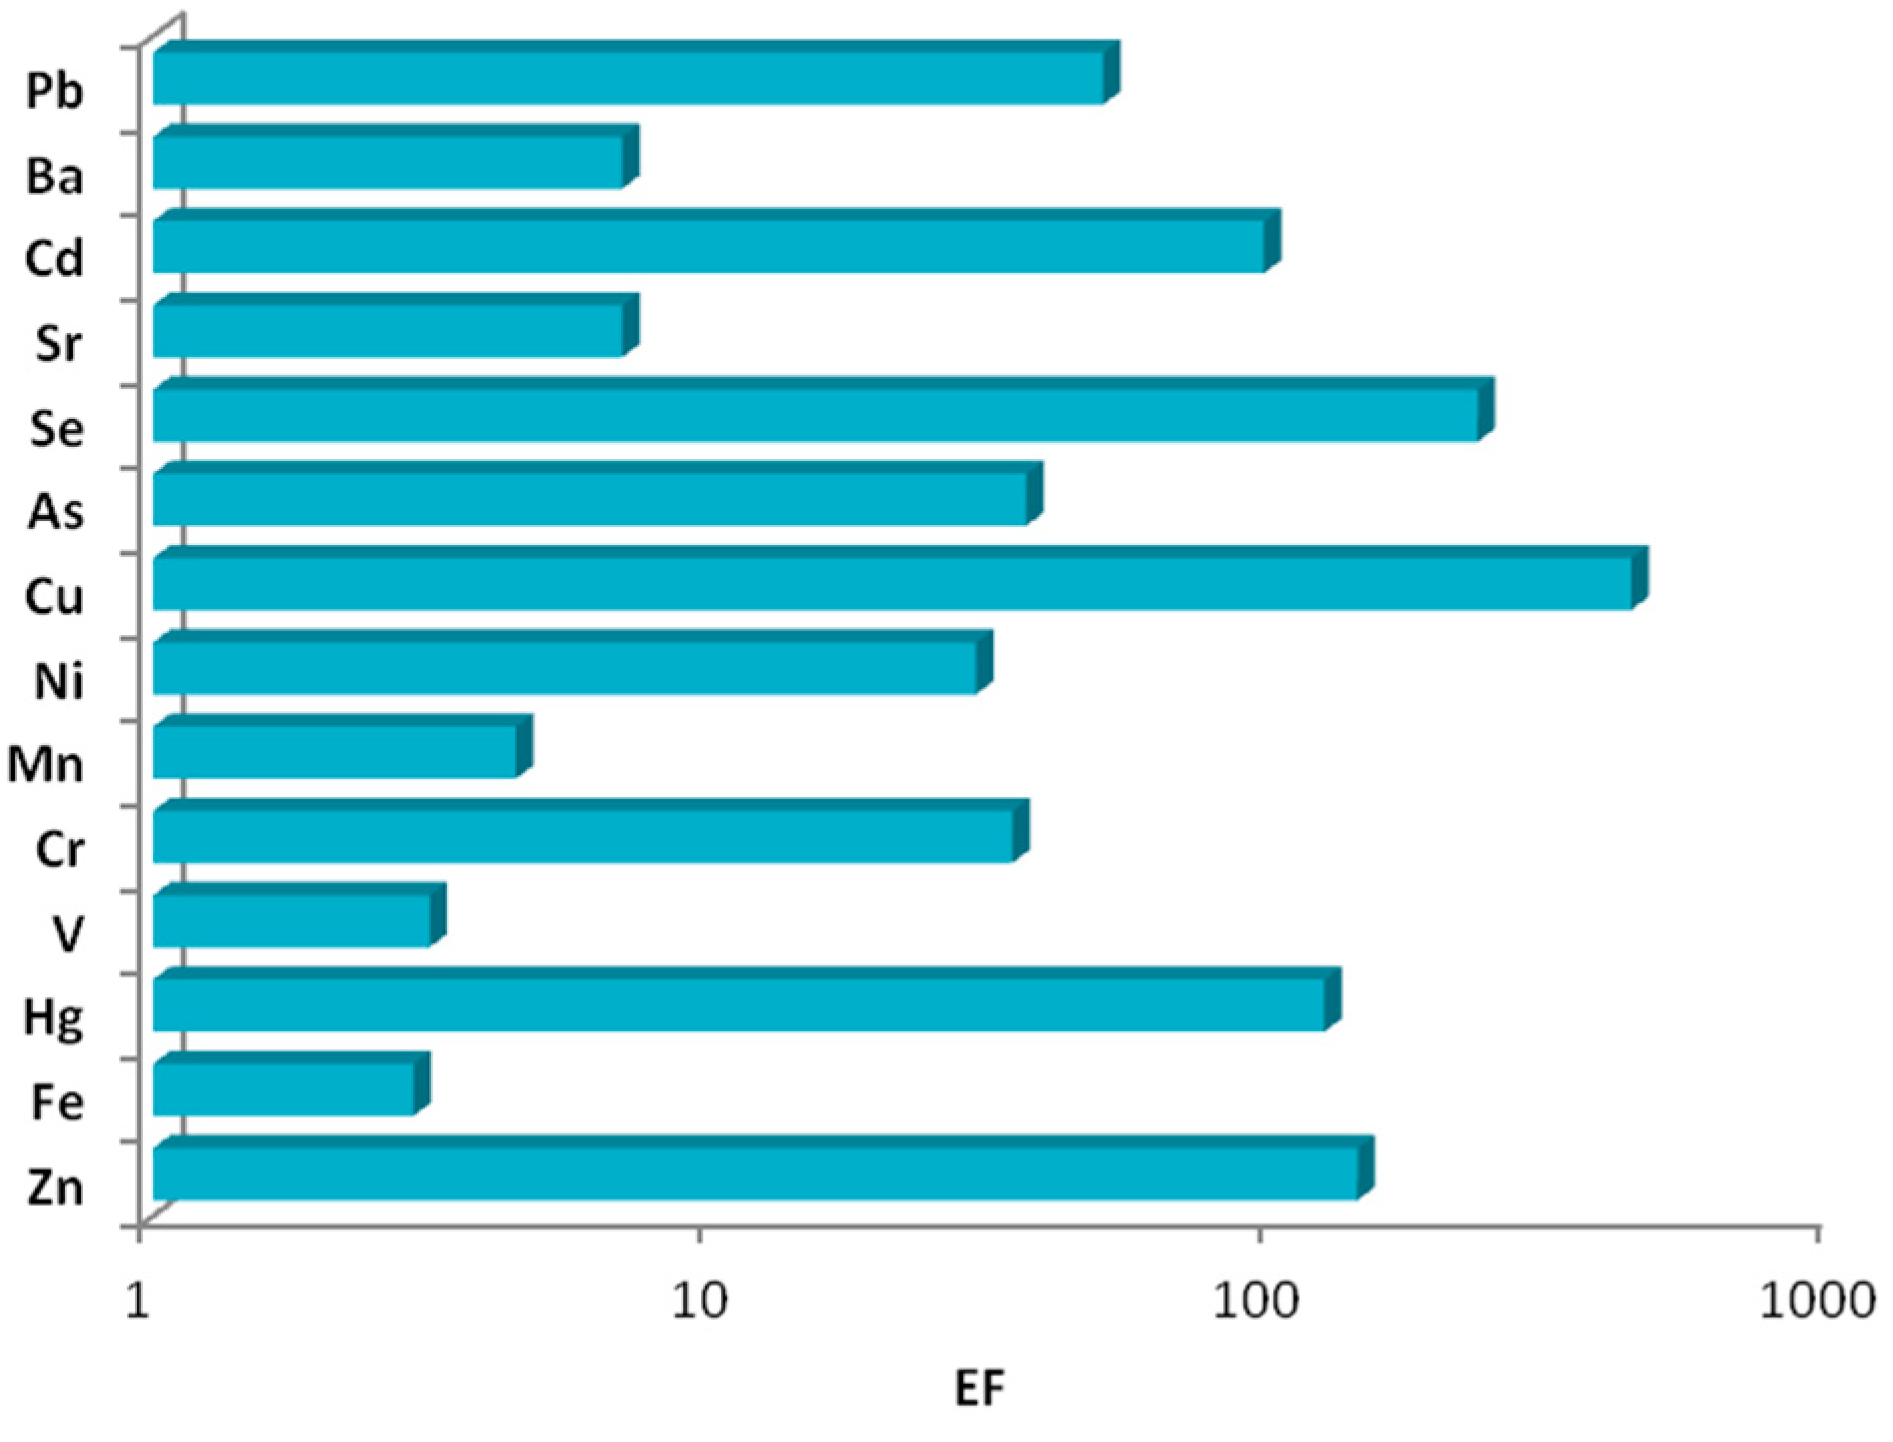
3.4. Enrichment Factors and Principal Component Analysis
3.5. Health Risk Assessment of PAHs and Heavy Metals in Settled House Dust
3.5.1. Cancer Risk Assessment of PAHs in Settled House Dust
3.5.2. Heavy Metal Risk Exposure in Settled House Dust
4. Conclusions
Author Contributions
Funding
Institutional Review Board Statement
Informed Consent Statement
Acknowledgments
Conflicts of Interest
References
- Matz, C.J.; Stieb, D.M.; Davis, K.; Egyed, M.; Rose, A.; Chou, B.; Brion, O. Effects of age, season, gender and urban-rural status on time-activity: CanadianHuman Activity Pattern Survey 2 (CHAPS 2). Int. J. Environ. Res. Public Health 2014, 11, 2108–2124. [Google Scholar] [CrossRef] [Green Version]
- Qi, H.; Li, W.L.; Zhu, N.Z.; Ma, W.L.; Liu, L.Y.; Zhang, F.; Li, Y.F. Concentrations and sources of polycyclic aromatic hydrocarbons in indoor dust in China. Sci. Total Environ. 2014, 491–492, 100–107. [Google Scholar] [CrossRef] [PubMed]
- Stamatelopoulou, A.; Asimakopoulos, D.N.; Maggos, T. Effects of PM, TVOCs and comfort parameters on indoor air quality of residences with young children. Build. Environ. 2019, 150, 233–244. [Google Scholar] [CrossRef]
- Landrigan, P.J.; Kimmel, C.A.; Correa, A.; Eskenazi, B. Children’s health and the environment: Public health issues and challenges for risk assessment. Environ. Health Perspect. 2004, 112, 257–265. [Google Scholar] [CrossRef] [PubMed]
- Pickett, A.R.; Bell, M.L. Assessment of indoor air pollution in homes with infants. Int. J. Environ. Res. Public Health 2011, 8, 4502–4520. [Google Scholar] [CrossRef] [PubMed]
- Stamatelopoulou, A.; Pyrri, I.; Asimakopoulos, D.N.; Maggos, T. Indoor air quality and dustborne biocontaminants in bedrooms of toddlers in Athens, Greece. Build. Environ. 2020, 173, 106756. [Google Scholar] [CrossRef]
- Langer, S.; Weschler, C.J.; Fischer, A.; Bekö, G.; Toftum, J.; Clausen, G. Phthalate and PAH concentrations in dust collected from Danish homes and daycare centers. Atmos. Environ. 2010, 44, 2294–2301. [Google Scholar] [CrossRef]
- Wang, W.; Wu, F.; Zheng, J.; Wong, M.H. Risk assessments of PAHs and Hg exposure via settled house dust and street dust, linking with their correlations in human hair. J. Hazard. Mater. 2013, 263 Pt 2, 627–637. [Google Scholar] [CrossRef]
- Wang, Z.; Wang, S.; Nie, J.; Wang, Y.; Liu, Y. Assessment of polycyclic aromatic hydrocarbons in indoor dust from varying categories of rooms in Changchun city, northeast China. Environ. Geochem. Health 2017, 39, 15–27. [Google Scholar] [CrossRef]
- Pateraki, S.; Bairachtari, K.; Stamatelopoulou, A.; Panagopoulos, P.; Markellou, C.; Vasilakos, C.; Mihalopoulos, N.; Maggos, T. Vertical characteristics of the pm10 and pm2.5 profile in an a real urban street canyon: Concentrations, chemical composition and associated health risks. Fresenius Environ. Bull. 2017, 26, 283–291. [Google Scholar]
- Miller, R.L.; Garfinkel, R.; Horton, M.; Camann, D.; Perera, F.P.; Whyatt, R.M.; Kinney, P.L. Polycyclic aromatic hydrocarbons, environmental tobacco smoke, and respiratory symptoms in an inner-city birth cohort. Chest 2004, 126, 1071–1078. [Google Scholar] [CrossRef] [Green Version]
- Hejami, A.A.; Davis, M.; Prete, D.; Lu, J.; Wang, S. Heavy metals in indoor settled dusts in Toronto, Canada. Sci. Total Environ. 2020, 703, 134895. [Google Scholar] [CrossRef]
- Turner, A. Oral bioaccessibility of trace metals in household dust: A review. Environ. Geochem. Health 2011, 33, 331–341. [Google Scholar] [CrossRef]
- Morawska, L.; Salthammer, T. Indoor Environments: Airborne Particles and Settled Dust; Wiley-VCH: Weinheim, Germany, 2003. [Google Scholar]
- Lu, X.; Zhang, X.; Li, L.Y.; Chen, H. Assessment of metals pollution and health risk in dust from nursery schools in Xi’an, China. Environ. Res. 2014, 128, 27–34. [Google Scholar] [CrossRef]
- Meza-Figueroa, D.; De la O-Villanueva, M.; De la Parra, M.L. Heavy metal distribution in dust from elementary schools in Hermosillo, Sonora, México. Atmos. Environ. 2007, 41, 276–288. [Google Scholar] [CrossRef]
- Saeedi, M.; Li, L.Y.; Salmanzadeh, M. Heavy metals and polycyclic aromatic hydrocarbons: Pollution and ecological risk assessment in street dust of Tehran. J. Hazard. Mater. 2012, 227–228, 9–17. [Google Scholar] [CrossRef]
- Maertens, R.M.; Yang, X.; Zhu, J.; Gagne, R.W.; Douglas, G.R.; White, P.A. Mutagenic and Carcinogenic Hazards of Settled House Dust I: Polycyclic Aromatic Hydrocarbon Content and Excess Lifetime Cancer Risk from Preschool Exposure. Environ. Sci. Technol. 2008, 42, 1747–1753. [Google Scholar] [CrossRef] [Green Version]
- Mannino, M.R.; Orecchio, S. Polycyclic aromatic hydrocarbons (PAHs) in indoor dust matter of Palermo (Italy) area: Extraction, GC–MS analysis, distribution and sources. Atmos. Environ. 2008, 42, 1801–1817. [Google Scholar] [CrossRef]
- Lucas, J.P.; Le Bot, B.; Glorennec, P.; Etchevers, A.; Bretin, P.; Douay, F.; Sebille, V.; Bellanger, L.; Mandin, C. Lead contamination in French children’s homes and environment. Environ. Res. 2012, 116, 58–65. [Google Scholar] [CrossRef] [PubMed]
- Zhu, S.; Cai, W.; Yoshino, H.; Yanagi, U.; Hasegawa, K.; Kagi, N.; Chen, M. Primary pollutants in schoolchildren’s homes in Wuhan, China. Build. Environ. 2015, 93, 41–53. [Google Scholar] [CrossRef]
- Saraga, D.; Maggos, T.; Sadoun, E.; Fthenou, E.; Hassan, H.; Tsiouri, V.; Karavoltsos, S.; Sakellari, A.; Vasilakos, C.; Kakosimos, K. Chemical Characterization of Indoor and Outdoor Particulate Matter (PM2.5, PM10) in Doha, Qatar. Aerosol Air Qual. Res. 2017, 17, 1156–1168. [Google Scholar] [CrossRef] [Green Version]
- Yoshinaga, J.; Yamasaki, K.; Yonemura, A.; Ishibashi, Y.; Kaido, T.; Mizuno, K.; Takagi, M.; Tanaka, A. Lead and other elements in house dust of Japanese residences-source of lead and health risks due to metal exposure. Environ. Pollut. 2014, 189, 223–228. [Google Scholar] [CrossRef]
- Al-Momani, I.F. Trace Elements in Street and Household Dusts in Amman, Jordan. Soil Sediment Contam. Int. J. 2007, 16, 485–496. [Google Scholar] [CrossRef]
- U.S. EPA. ethod 3050B: Acid Digestion of Sediments, Sludges and Soils (Revision 2); U.S. EPA: Washington, DC, USA, 1996.
- Shao, T.; Pan, L.; Chen, Z.; Wang, R.; Li, W.; Qin, Q.; He, Y. Content of Heavy Metal in the Dust of Leisure Squares and Its Health Risk Assessment—A Case Study of Yanta District in Xi’an. Int. J. Environ. Res. Public Health 2018, 15, 394. [Google Scholar] [CrossRef] [PubMed] [Green Version]
- U.S. EPA. Supplemental Guidance for Developing Soil Screening Levels for Superfund Sites; Office of Emergency and Remedial Response: Washington, DC, USA, 2002. [Google Scholar]
- Mahler, B.; Vanmetre, P.; Wilson, J.; Musgrove, M. Coal-Tar-Based Parking Lot Sealcoat: An Unrecognized Source of PAH to Settled House Dust. Environ. Sci. Technol. 2010, 44, 894–900. [Google Scholar] [CrossRef] [PubMed]
- Wilson, N.K.; Chuang, J.C.; Lyu, C.; Menton, R.; Morgan, M.K. Aggregate exposures of nine preschool children to persistent organic pollutants at day care and at home. J. Expo. Anal. Environ. Epidemiol. 2003, 13, 187–202. [Google Scholar] [CrossRef] [Green Version]
- Morgan, M.K.; Wilson, N.K.; Chuang, J.C. Exposures of 129 preschool children to organochlorines, organophosphates, pyrethroids, and acid herbicides at their homes and daycares in North Carolina. Int. J. Environ. Res. Public Health 2014, 11, 3743–3764. [Google Scholar] [CrossRef] [PubMed]
- Amato, F.; Schaap, M.; A.C. Denier van der Gon, Η.; Pandolfi, Μ.; Alastuey, A.; Keuken, M.; Querol, X. Short-term variability of mineral dust, metals and carbon emission from road dust resuspension. Atmos. Environ. 2013, 74, 134–140. [Google Scholar] [CrossRef]
- Shakya, P. Chemical Associations of Lead, Cadmium, Chromium, Nickel and Zinc in Household Dust of Kathmandu Metropolitan Area. Pak. J. Anal. Environ. Chem. 2013, 14, 26–32. [Google Scholar]
- Fromme, H.; Lahrz, T.; Kraft, M.; Fembacher, L.; Mach, C.; Dietrich, S.; Burkardt, R.; Volkel, W.; Goen, T. Organophosphate flame retardants and plasticizers in the air and dust in German daycare centers and human biomonitoring in visiting children (LUPE 3). Environ. Int. 2014, 71, 158–163. [Google Scholar] [CrossRef]
- Manousakas, M.; Papaefthymiou, H.; Diapouli, E.; Migliori, A.; Karydas, A.G.; Bogdanovic-Radovic, I.; Eleftheriadis, K. Assessment of PM2.5 sources and their corresponding level of uncertainty in a coastal urban area using EPA PMF 5.0 enhanced diagnostics. Sci. Total Environ. 2017, 574, 155–164. [Google Scholar] [CrossRef] [Green Version]
- Amato, F.; Alastuey, A.; Karanasiou, A.; Lucarelli, F.; Nava, S.; Calzolai, G.; Severi, M.; Becagli, S.; Gianelle, V.L.; Colombi, C.; et al. AIRUSE-LIFE+: A harmonized PM speciation and source apportionment in five southern European cities. Atmos. Chem. Phys. 2016, 16, 3289–3309. [Google Scholar] [CrossRef] [Green Version]
- Ridley, I.; Fox, J.; Oreszczyn, T.; Hong, S.H. The Impact of Replacement Windows on Air Infiltration and Indoor Air Quality in Dwellings. Int. J. Vent. 2016, 1, 209–218. [Google Scholar] [CrossRef] [Green Version]
- Maertens, R.M.; Bailey, J.; White, P.A. The mutagenic hazards of settled house dust: A review. Mutat. Res. Rev. Mutat. Res. 2004, 567, 401e425. [Google Scholar] [CrossRef]
- Whitehead, T.P.; Metayer, C.; Petreas, M.; Does, M.; Buffler, P.A.; Rappaport, S.M. Polycyclic aromatic hydrocarbons in residential dust: Sources of variability. Environ. Health Perspect. 2013, 121, 543–550. [Google Scholar] [CrossRef]
- Vasilakos, C.; Pateraki, S.; Veros, D.; Maggos, T.; Michopoulos, J.; Saraga, D.; Chelmis, C. Temporal determination of heavy metals in PM2.5 aerosols in a suburban site of Athens, Greece. J. Atmos. Chem. 2007, 57, 1–17. [Google Scholar] [CrossRef]
- Psanis, C.; Triantafyllou, E.; Giamarelou, M.; Manousakas, M.; Eleftheriadis, K.; Biskos, G. Particulate matter pollution from aviation-related activity at a small airport of the Aegean Sea Insular Region. Sci. Total Environ. 2017, 596–597, 187–193. [Google Scholar] [CrossRef]
- Roberts, J.W.; Budd, W.T.; Ruby, M.G.; Camann, D.; Fortmann, R.C.; Lewis, R.G.; Wallace, L.A.; Spittler, T.M. Humanexposure to pollutants in the floor dust of homes and offices. J. Expo. Anal. Environ. Epidemiol. 1992, 2, 127–146. [Google Scholar]


| PAH (ng/g) | Mean | Median | SD | Min | Max |
|---|---|---|---|---|---|
| Nap | 339 | 116 | 609 | 75.2 | 2479 |
| 2M-Nap | 242 | 172 | 198 | 118 | 965 |
| 1M-Nap | 126 | 91.6 | 107 | 61.1 | 518 |
| Acy | 15.7 | 13.2 | 7.82 | 8.24 | 39.4 |
| 1,2 DM-Nap | 49.4 | 40.1 | 30.7 | 29.5 | 158 |
| 2,6 DM-Nap | 11.7 | 9.08 | 7.04 | 6.43 | 33.2 |
| Ace | 94.6 | 78.0 | 69.0 | 60.8 | 353 |
| 2,3,5-TM-Nap | 10.5 | 8.56 | 7.33 | 3.12 | 28.8 |
| Fl | 421 | 424 | 207 | 221 | 1116 |
| DBT | 25.4 | 21.2 | 20.9 | 4.96 | 91.8 |
| Phe | 925 | 905 | 465 | 528 | 2525 |
| 1M-Phe | 67.9 | 45.8 | 79.0 | 14.9 | 358 |
| 3,6 DM-Phe | 42.3 | 21.5 | 75.7 | 7.59 | 334 |
| Ant | 22.6 | 19.4 | 12.7 | 10.3 | 57.3 |
| Flu | 99.0 | 86.0 | 61.8 | 30.2 | 308 |
| Pyr | 100 | 74.4 | 117 | 20.1 | 542 |
| BaA | 11.3 | 8.25 | 12.2 | 1.68 | 54.9 |
| Chr | 45.3 | 27.2 | 72.9 | 4.25 | 325 |
| BbF | 20.7 | 16.9 | 19.9 | 2.01 | 90.4 |
| BkF | 10.7 | 7.22 | 12.3 | 1.01 | 55.7 |
| Bep | 14.0 | 9.79 | 14.8 | 1.49 | 65.9 |
| Bap | 7.06 | 5.45 | 5.69 | 1.05 | 24.0 |
| Per | 1.02 | 1.08 | 1.06 | 0.00 | 3.39 |
| IndP | 11.1 | 8.39 | 10.8 | 1.05 | 49.2 |
| dBaAnt | 2.06 | 1.69 | 1.83 | 0.39 | 8.39 |
| B[ghi]Per | 13.8 | 10.3 | 11.2 | 1.36 | 49.3 |
| Elements | Mean | SD | Min | Max |
|---|---|---|---|---|
| Zn | 401 | 211 | 136 | 1031 |
| Fe | 4913 | 5650 | 851 | 26100 |
| Al | 4217 | 9391 | 269 | 44900 |
| Hg | 0.4 | 0.5 | 0.0 | 2.1 |
| V | 9.0 | 5.4 | 2.4 | 21.3 |
| Cr | 65.2 | 36.4 | 14.2 | 147 |
| Mn | 128 | 67.9 | 28.9 | 272 |
| Ni | 29.9 | 23.9 | 5.2 | 103 |
| Cu | 339 | 711 | 11.8 | 3051 |
| As | 4.0 | 4.4 | 1.3 | 19.8 |
| Se | 1.0 | 0.6 | 0.2 | 2.8 |
| Sr | 118 | 97.6 | 37.7 | 396 |
| Cd | 0.5 | 0.6 | 0.1 | 2.3 |
| Ba | 251 | 237.0 | 35.0 | 1130 |
| Pb | 46.1 | 71.5 | 6.5 | 343 |
| Factor 1 | Factor 2 | Factor 3 | Factor 4 | Factor 5 | Factor 6 | Factor 7 | Factor 8 | |
|---|---|---|---|---|---|---|---|---|
| Smoking | Combustion Processes | Soil Dust | Vehicle Emissions | Road Dust | Abrasion of Plated Surfaces | Soil | Vehicle Emissions | |
| Eigenvalue | 11.522 | 4.840 | 3.540 | 2.127 | 2.051 | 1.269 | 1.160 | 1.056 |
| Cumulative % | 38.41 | 54.54 | 66.34 | 73.43 | 80.27 | 84.50 | 88.36 | 91.88 |
| Acy | 0.187 | 0.951 | −0.005 | −0.035 | 0.068 | −0.058 | −0.108 | 0.132 |
| Ace | −0.104 | 0.962 | 0.093 | −0.025 | −0.120 | 0.028 | 0.037 | 0.052 |
| Fl | 0.088 | 0.973 | −0.026 | −0.063 | −0.030 | −0.060 | −0.087 | −0.065 |
| PH | 0.068 | 0.987 | −0.018 | −0.060 | 0.027 | −0.027 | −0.049 | −0.057 |
| Ant | 0.360 | 0.632 | −0.021 | −0.112 | 0.462 | 0.123 | −0.027 | −0.105 |
| Flu | 0.913 | 0.367 | 0.003 | −0.016 | 0.113 | 0.013 | 0.021 | −0.055 |
| Pyr | 0.975 | 0.115 | 0.071 | −0.007 | −0.027 | 0.035 | −0.047 | −0.007 |
| Ba[A] | 0.987 | 0.008 | 0.026 | 0.064 | 0.067 | 0.002 | 0.057 | 0.037 |
| Chr | 0.974 | 0.058 | 0.086 | −0.001 | −0.058 | 0.052 | 0.032 | −0.042 |
| B[b]F | 0.973 | 0.111 | 0.011 | −0.009 | 0.116 | 0.020 | 0.032 | 0.069 |
| B[k]F | 0.991 | 0.061 | 0.034 | 0.036 | 0.041 | 0.016 | 0.027 | 0.018 |
| B[a]P | 0.929 | −0.049 | −0.047 | 0.020 | 0.133 | 0.018 | 0.123 | 0.128 |
| Ind | 0.986 | 0.050 | 0.004 | 0.011 | 0.077 | −0.003 | 0.061 | 0.041 |
| D[ah]A | 0.971 | 0.033 | −0.070 | 0.004 | 0.033 | 0.053 | −0.006 | −0.023 |
| B[ghi]P | 0.940 | 0.018 | −0.078 | −0.039 | 0.145 | −0.052 | 0.191 | 0.029 |
| Zn | 0.261 | −0.091 | 0.310 | 0.613 | 0.563 | −0.159 | 0.050 | 0.216 |
| Fe | 0.152 | −0.158 | 0.032 | 0.048 | 0.133 | −0.080 | 0.910 | 0.015 |
| Al | −0.078 | −0.166 | 0.933 | −0.056 | 0.202 | 0.032 | −0.131 | 0.037 |
| Hg | 0.883 | −0.016 | 0.013 | −0.039 | −0.069 | 0.383 | 0.044 | −0.048 |
| V | 0.218 | −0.065 | 0.750 | 0.460 | 0.108 | 0.015 | 0.260 | 0.099 |
| Cr | 0.276 | 0.188 | 0.491 | 0.008 | 0.133 | 0.761 | −0.059 | 0.100 |
| Mn | 0.203 | −0.050 | 0.188 | 0.314 | −0.461 | −0.273 | 0.460 | −0.176 |
| Ni | 0.535 | 0.016 | −0.042 | 0.203 | 0.468 | −0.004 | 0.513 | −0.002 |
| Cu | 0.146 | 0.019 | 0.153 | −0.246 | 0.859 | −0.123 | 0.187 | −0.160 |
| As | −0.017 | −0.027 | 0.026 | 0.963 | −0.172 | −0.031 | −0.014 | −0.016 |
| Se | 0.203 | 0.298 | −0.127 | 0.112 | 0.049 | −0.299 | −0.225 | −0.635 |
| Sr | −0.077 | 0.263 | 0.897 | 0.177 | −0.138 | −0.066 | 0.083 | −0.120 |
| Cd | 0.123 | −0.158 | −0.195 | −0.033 | −0.145 | 0.893 | −0.103 | −0.039 |
| Ba | −0.184 | −0.276 | 0.357 | 0.691 | −0.156 | 0.070 | 0.259 | −0.174 |
| Pb | 0.198 | 0.154 | −0.074 | 0.022 | −0.044 | −0.117 | −0.130 | 0.802 |
| Element | Dingestion | Dinhalation | DDermal | Dtotal | ||||
|---|---|---|---|---|---|---|---|---|
| Child | Adult | Child | Adult | Child | Adult | Child | Adult | |
| Cr | 1.00 × 10⁻³ | 9.32 × 10⁻⁵ | 2.11 × 10⁻⁸ | 1.30 × 10⁻⁸ | 1.15 × 10⁻⁶ | 1.40 × 10⁻⁷ | 1.00 × 10⁻³ | 9.33 × 10⁻⁵ |
| Ni | 4.60 × 10⁻⁴ | 4.27 × 10⁻⁵ | 9.65 × 10⁻⁹ | 5.97 × 10⁻⁹ | 5.29 × 10⁻⁷ | 6.41 × 10⁻⁸ | 4.60 × 10⁻⁴ | 4.27 × 10⁻⁵ |
| Cu | 5.22 × 10⁻³ | 4.85 × 10⁻⁴ | 1.10× 10⁻⁷ | 6.78 × 10⁻⁸ | 6.00 × 10⁻⁶ | 7.28 × 10⁻⁷ | 5.22 × 10⁻³ | 4.85 × 10⁻⁴ |
| Cd | 8.23 × 10⁻⁶ | 7.65 × 10⁻⁷ | 1.73 × 10⁻¹⁰ | 1.07 × 10⁻¹⁰ | 9.47 × 10⁻⁹ | 1.15 × 10⁻⁹ | 8.24 × 10⁻⁶ | 7.66 × 10⁻⁷ |
| Pb | 7.09 × 10⁻⁴ | 6.58 × 10⁻⁵ | 1.49 × 10⁻⁸ | 9.20 × 10⁻⁹ | 8.15 × 10⁻⁷ | 9.88 × 10⁻⁸ | 7.09 × 10⁻⁴ | 6.59 × 10⁻⁵ |
| Zn | 6.16 × 10⁻³ | 5.72 × 10⁻⁴ | 1.29 × 10⁻⁷ | 8.01 × 10⁻⁸ | 7.09 × 10⁻⁶ | 8.60 × 10⁻⁷ | 6.17 × 10⁻³ | 5.73 × 10⁻⁴ |
| Hg | 5.79 × 10⁻⁶ | 5.38 × 10⁻⁷ | 1.22 × 10⁻¹⁰ | 7.53 × 10⁻¹¹ | 6.66 × 10⁻⁹ | 8.08 × 10⁻¹⁰ | 5.80 × 10⁻⁶ | 5.39 × 10⁻⁷ |
| As | 6.08 × 10⁻⁵ | 5.64 × 10⁻⁶ | 1.28 × 10⁻⁹ | 7.89 × 10⁻¹⁰ | 6.99 × 10⁻⁸ | 8.47 × 10⁻⁹ | 6.08 × 10⁻⁵ | 5.65 × 10⁻⁶ |
| Se | 1.61 × 10⁻⁵ | 1.50 × 10⁻⁶ | 3.39 × 10⁻¹⁰ | 2.09 × 10⁻¹⁰ | 1.85 × 10⁻⁸ | 2.25 × 10⁻⁹ | 1.61 × 10⁻⁵ | 1.50 × 10⁻⁶ |
| Element | Dtotal | DRef | |
|---|---|---|---|
| Child | Adult | Child & Adult | |
| Cr | 1.00 × 10⁻³ | 9.33 × 10⁻⁵ | 3.0 × 10⁻³ |
| Ni | 4.60 × 10⁻⁴ | 4.27 × 10⁻⁵ | 2.0 × 10⁻² |
| Cu | 5.22 × 10⁻³ | 4.85 × 10⁻⁴ | 2.0 × 10⁻² |
| Cd | 8.24 × 10⁻⁶ | 7.66 × 10⁻⁷ | 1.0 × 10⁻³ |
| Pb | 7.09 × 10⁻⁴ | 6.59 × 10⁻⁵ | 3.0 × 10⁻³ |
| Zn | 6.17 × 10⁻³ | 5.73 × 10⁻⁴ | 3.0 × 10⁻¹ |
| Hg | 5.80 × 10⁻⁶ | 5.39 × 10⁻⁷ | 3.0 × 10⁻⁴ |
| As | 6.08 × 10⁻⁵ | 5.65 × 10⁻⁶ | 3.0 × 10⁻⁴ |
| Se | 1.61 × 10⁻⁵ | 1.50 × 10⁻⁶ | 5.0 × 10⁻³ |
| Element | HQchild | HQadult |
|---|---|---|
| Cr | 0.335 | 0.031 |
| Ni | 0.023 | 0.002 |
| Cu | 0.261 | 0.024 |
| Cd | 0.008 | 0.001 |
| Pb | 0.236 | 0.022 |
| Zn | 0.021 | 0.002 |
| Hg | 0.019 | 0.002 |
| As | 0.203 | 0.019 |
| Se | 0.003 | 0.000 |
| Element | LDinh | SFinh (mg·kg−1·d−1) | Exposure Risk |
|---|---|---|---|
| Cr | 9.43 × 10⁻⁸ | 42.00 | 3.96 × 10⁻⁶ |
| Ni | 4.32 × 10⁻⁸ | 0.84 | 3.63 × 10⁻⁸ |
| Cd | 7.73 × 10⁻¹⁰ | 6.30 | 4.87 × 10⁻⁹ |
| As | 5.71 × 10⁻⁹ | 1.50 | 8.56 × 10⁻⁹ |
Publisher’s Note: MDPI stays neutral with regard to jurisdictional claims in published maps and institutional affiliations. |
© 2021 by the authors. Licensee MDPI, Basel, Switzerland. This article is an open access article distributed under the terms and conditions of the Creative Commons Attribution (CC BY) license (http://creativecommons.org/licenses/by/4.0/).
Share and Cite
Stamatelopoulou, A.; Dasopoulou, M.; Bairachtari, K.; Karavoltsos, S.; Sakellari, A.; Maggos, T. Contamination and Potential Risk Assessment of Polycyclic Aromatic Hydrocarbons (PAHs) and Heavy Metals in House Settled Dust Collected from Residences of Young Children. Appl. Sci. 2021, 11, 1479. https://doi.org/10.3390/app11041479
Stamatelopoulou A, Dasopoulou M, Bairachtari K, Karavoltsos S, Sakellari A, Maggos T. Contamination and Potential Risk Assessment of Polycyclic Aromatic Hydrocarbons (PAHs) and Heavy Metals in House Settled Dust Collected from Residences of Young Children. Applied Sciences. 2021; 11(4):1479. https://doi.org/10.3390/app11041479
Chicago/Turabian StyleStamatelopoulou, A., M. Dasopoulou, K. Bairachtari, S. Karavoltsos, A. Sakellari, and T. Maggos. 2021. "Contamination and Potential Risk Assessment of Polycyclic Aromatic Hydrocarbons (PAHs) and Heavy Metals in House Settled Dust Collected from Residences of Young Children" Applied Sciences 11, no. 4: 1479. https://doi.org/10.3390/app11041479