Article

The Use of the Mixed Bacteria Limosilactobacillus fermentum and Staphylococcus carnosus in the Meat Curing Process with a Reduced Amount of Sodium Nitrite

by
Piotr Szymański
1,*,
Beata Łaszkiewicz
1,
Aneta Kern-Jędrychowska
1,
Urszula Siekierko
1 and
Danuta Kołożyn-Krajewska
2
1
Department of Meat and Fat Technology, Prof. Waclaw Dabrowski Institute of Agricultural and Food Biotechnology, 36 Rakowiecka St., 02-532 Warsaw, Poland
2
Institute of Human Nutrition Sciences, Warsaw University of Life Sciences-SGGW, 166 Nowoursynowska St., 02-787 Warsaw, Poland
*
Author to whom correspondence should be addressed.
Appl. Sci. 2021, 11(3), 904; https://doi.org/10.3390/app11030904
Submission received: 29 December 2020 / Revised: 17 January 2021 / Accepted: 18 January 2021 / Published: 20 January 2021
(This article belongs to the Special Issue New Frontiers in Meat Science and Technology)

Abstract

:
The aim of the research was to estimate the possibility of using mixed bacteria cultures consisting of Lactobacillus fermentum S8 and Staphylococcus carnosus ATCC 51365 in the meat curing process with a reduced amount of sodium nitrite and to study the effect of bacteria on residual nitrites and nitrates, nitrosyl pigments content, colour, pH, redox potential, microbiologic, and the sensory quality of a cooked meat product. The study was performed on heat treated three-model meat treatments in cans: (C) a control treatment with NaNO2 at 100 mg/kg, (M) a treatment with NaNO2 at 50 mg/kg and (SL) a treatment with NaNO2 at 50 mg/kg and L. fermentum S8 at about 107 cfu/g and S. carnosus ATCC 51365 at about of 107 cfu/g. The research was performed after production and after cold storage. It was shown that using a mixed bacteria culture for meat curing had an influence (p < 0.05) on reducing nitrite and nitrate levels and increasing the amount of nitrosyl pigments in the SL treatment compared to the M treatment. Applying mixed bacteria in curing meat with NaNO2 at 50 mg/kg allowed for obtaining a higher redness in the cooked meat product after production, storage and exposure to light than in the product cured with NaNO2 at 100 mg/kg, with similar sensory and microbiological quality in both products.

1. Introduction

Nitrite is a key ingredient in meat curing. It may react with myoglobin (Mb) to nitrosyl myoglobine (MbFeIINO), which is responsible for the typical pink cured meat colour in meat products, and for inhibiting the growth of some undesirable microorganisms. Nitrite is also involved in the formation of the taste and flavour of meat products and slowing down the oxidation processes [1,2]. One of the stages of forming MbFeIINO in meat is reactions that lead to nitrogen oxide production based on nitrites that have been added (NO2). NO2 has unpaired electrons and due to that fact are chemically highly reactive [3,4]. Nitrites added to meat take part also in many competitive chemical reactions binding to non-heme proteins, glycerides and sulfhydryl groups. Meat that is free from quality defects (RFN meat: red, firm, normal) has a slightly acidic pH. NO2 in such an environment is usually in a dissociated form [4,5]. From the part of nitrites added to the meat, the nitrous acid (HNO2) is formed. HNO2 in an acid environment that may create anhydride (N2O3), which is in balance with NO and NO2 oxides. NO reacts with myoglobin (Mb) or amino acids such as cysteine, whereas NO2 is transformed in water and oxidized to NO3 or takes part in other reactions with meat or fat tissue compositions [3,4]. Nitrates may also be formed from nitrites added to meat and their interaction with myoglobin appears as a result of metmyoglobin reduction (MetMb) with ascorbic acid [6]. The nitrites dismutation process is also observed during the heat treating of meat products. It was shown that the heat-treating temperature influences the oxidation dynamics of nitrites to nitrates [5]. In the studies on nitrite added to the meat balance, it was observed that 1 to 10% of added nitrites oxidises to nitrates [7,8]. Other authors estimate that the amount of nitrites being transformed into nitrates during curing may be higher and may reach even 40% [4].
Recently, there has been an increase in consumer demand for foods with fewer chemical additives that are perceived to be healthier. Therefore, meat products without or reduced added nitrite/nitrate are characterized by high consumer acceptance. For that reason, in the industry, there are increased demands to reduced nitrite and nitrate in the processing of meat products [9,10]. There is now an EU law regulation aiming to reduce the use of nitrites in producing meat products [11]. In addition, some countries e.g., Denmark, previously implemented internal regulations, reducing the maximum level of nitrites permitted in the European Union from 150 to 60 mg/kg in chosen processed meat groups [12].
Selected coagulase-negative nonpathogenic species of the Staphylococcus genus and lactic acid bacteria strains (LAB) used as starter cultures in fermented processed meat production are responsible for the colour, taste and flavour of these products [13]. In the process of anaerobic respiration Staphylococcus bacteria use nitrates as the final electron acceptors. The electrons detached from the respiration substrate are bonded by the nitrate reductase enzyme to nitrates and form nitrites [14]. Proper use of selected strains of the Staphylococcus carnosus bacteria in the meat curing process may be useful in reducing the amount of sodium nitrite added into heat treated meat products by reducing nitrates formed from oxidized nitrite [15]. On the other hand, using only Staphylococcus carnosus bacteria in nitrite meat curing may not bring about the intended effects. In the case of the insufficient reduction potential of the meat environment NO2 formed as a result of NO3 bacterial reduction will not be chemically reduced to NO [5]. After depleting NO3 by bacteria, NO2 cumulated in the environment will be absorbed by cells, reduced to ammonia (NH3) and excreted into the environment [16,17]. Cumulated NH3 may have a destructive effect on MbFeIINO and meat colour. The lactic acid bacteria may be useful in optimizing the process of meat curing with a reduced amount of sodium nitrite for producing cooked meat products. Some LAB strains are able to reduce NO2 to NO by producing acid and nitrate reductase activity depending on heme or independence from heme [18]. Studies on the biochemical attributes of LAB isolated from ecological acidic whey indicate that selected bacteria strains Limosilactobacillus fermentum could be useful in optimizing the meat curing process [19].
The goal of this research was to estimate the possibility of using a mixed culture consisting of Limosilactobacillus fermentum S8 and Staphylococcus carnosus ATCC 51365 in meat curing with a reduced amount of sodium nitrite and to estimate the effect of bacteria on nitrites and nitrates residues, nitrosyl pigments content, colour, pH, redox potential, microbiological and the sensory quality of the model cooked meat product.

2. Materials and Methods

2.1. Materials

2.1.1. The Lactic Acid Bacteria Strain (LAB) and Its Preparation

The Limosilactobacillus fermentum S8 bacteria strain isolated from ecological acid whey was used in the research [19]. For the experiment, the bacteria cells from the second inoculation were multiplied on MRS broth (150 mL) (Merck KGaA, Darmstadt, Germany) for 22 h at a temperature of 37 °C to reach the cells concentration of approximately 109. Then, the cells were centrifuged (10 min, 5500 RPM, 2827× g) in a J2-21 centrifuge (Beckman, Birkerřd, Denmark) The bacterial biomass obtained was suspended in 0.9% physiological saline solution and applied into the meat batter to reach the bacteria concentration of approx. 107 cfu/g.

2.1.2. The Staphylococcus Carnosus Bacteria Strain and Its Preparation

The Staphylococcus carnosus (ATCC 51365) bacteria strain isolated from dried sausage was used in the research. For the experiment, the bacteria cells from the second inoculation were multiplied on tryptic soy broth (150 mL) (Becton, Dickinson and Company (BD), Le Pont de Claix Cedex, France) for 20 h at a temperature of 30 °C to reach the cells concentration of approximately 109. Then, the cells were centrifuged (10 min, 4500 RPM, 2313× g) in a J2-21 centrifuge (Beckman, Birkerřd, Denmark) The bacterial biomass obtained was suspended in 0.9% physiological saline solution and applied into the meat batter to reach a bacteria concentration of approximately 107 cfu/g.

2.1.3. Model Meat Product

The research material was pork (chosen muscle of pork ham: m. semimembranosus) from commercial industrial cutting performed in an average size cutting plant in Poland. The meat was obtained from chilled pork carcasses 48 h after slaughter and was free from quality defects.
Fifteen semimembranous pork muscles (obtained from 15 pigs) were minced in a meat grinder using a net with a 3 mm mesh diameter, and the meat was then mixed. The three meat batters’ treatments were prepared: (C) control treatment cured with sodium nitrite in an amount of 100 mg/kg (typical amount used in the meat industry for meat curing used for producing cooked sausage), (M) a treatment cured with sodium nitrite in an amount of 50 mg/kg and (SL) a treatment cured with sodium nitrite in an amount of 50 mg/kg and with the addition of bacteria L. fermentum S8 at about 107 cfu/g and S. carnosus ATCC 51365 at about 107 cfu/g. The recipe of the meat batters consisted of 6.5 kg of pork meat (m. semimembranosus), 0.65 kg of water/ice, 78 g of glucose (Cargill, Incorporated, Minneapolis, MN, USA), 13 g of sodium triphosphate (57% P2O5, BK Giulini Chemie GmbH and OHG, Ludwigshafen/Rhein, Germany), 3.9 g of sodium ascorbate (Hebei Welcome Pharmaceutical Co., Ltd., Hebei, Shijiazhuang, China), 0.13 kg of NaCl (Salt Mine Kłodawa, Kłodawa, Poland), 0.747 g NaNO2 in the C treatment and 0.371 g NaNO2 in the M and SL treatment (Chempur, Piekary Śląskie, Poland), 18 g of bacterial biomass L. fermentum S8 with physiological salt solution (NaCl 0.9%) in the SL treatment, 18 g of bacterial biomass S. carnosus ATCC 51365 with physiological salt solution (NaCl 0.9%) in the SL treatment, 36 g of physiological salt solution (NaCl 0.9%) in the C and M treatments. The total salt content in the model meat products was at the level of 1.8%.
The minced meat and other ingredients were mixed for 5 min. with the mixer (Keripar, Troy, OH, USA) and 190 g portions were canned. The next step was to store the cans at 4 °C for a 24 h (curing period). Then, the 38 cans with the raw meat batter of each treatments (C, M, SL) (in total 114 cans) were cooked in stages so that the temperature in the centre of the can was at the 40 °C level for 1 h (to extend the time activity of added bacteria) and then reached 70 °C inside the can. The heat treatment of cans was performed in the boiling pan B type 200l/E (Brokelmann, Ense-Höingen, Germany). Next, the cans were chilled in ice water to 10 to 15 °C, and then they were chilled with cold air in the chiller to 4 to 6 °C. The meat products in cans were stored in cold storage conditions (4 °C) for 8 weeks. Consequently, the products were studied after production (after chilling the product to 4 °C), at four and eight weeks of storage.
The experiment was performed four times at different times using four pork batches (4 × 15 pieces of semimembranous pork muscle). The experimental production of the meat products was performed in the half-technical hall in the Department of Meat and Fat Technology prof. Waclaw Dabrowski Institute of Agricultural and Food Biotechnology (IBPRS) in Warsaw (Poland).

2.2. Methods

2.2.1. pH Determination

The pH value of the experimental treatments was evaluated according to the method described in PN-ISO 2917:2001. Measuring the pH was done in a homogenate prepared with meat samples (10 g) and distilled water (50 mL). The samples were homogenized for 1 min in an 800 W blender at a speed equal to 14.000 RPM (Bosch, Munich, Germany). Measuring the pH value was determined with a digital pH meter with an automatic compensation temperature (Delta 350, Mettler Toledo, Schwerzenbach, Switzerland) and a glass-calomel electrode (In Lab Cool, Mettler Toledo, Greifensee, Switzerland). The measurement was performed at 20 °C ± 2 °C.

2.2.2. Redox Potential Determination

Measurement of redox potential was done in a homogenate prepared with meat samples (10 g) and distilled water (50 mL) (1 min, 14.000 RPM). The measurement was performed using a digital pH meter (Delta 350, Mettler Toledo, Schwerzenbach, Switzerland), with an In Lab Redox Pro electrode (Mettler Toledo, Greifensee, Switzerland). The obtained measurement result (mV) was converted into the value of redox potential relative to the standard hydrogen electrode EH (mv). The value of the reference electrode potential at a temperature of 20 °C − Eref = 210 mV was added to the value read from the equipment. The measurement was performed at 20 °C ± 2 °C.

2.2.3. Determination of Nitrate and Nitrite Content

The level of residual nitrites and nitrates was performed according to EN 12014-4:2005 changed by Siu and Henshall [20]. The 10 g of homogenized meat product in a volumetric flask was heated for 20 min with deionized water added to the volume of 50 mL at a temperature between 70 and 80 °C. After heating, the samples were cooled and deionized water was added to make up to 100 mL. The samples were shaken, and the resultant suspension was filtered through 0.45 µm Cellulose Acetate (CA) syringe filters (Alfatec Technology, Zagreb, Croatia). The obtained filtrates were analyzed by HPLC (high-performance liquid chromatography).
In order to perform the test of the samples an Agilent 1200 HPLC (Agilent Technologies, Waldbronn, Germany) with a detector UV was used. The ion chromatography separation column was a Thermo Scientific Dionex IonPac AS11-HC-4 μm (4 × 250 mm) with a guard column Dionex IonPac AG11-HC-4 μm (4 × 50 mm) maintained at 30 °C (Thermo Fisher Scientific, Sunnyvale, CA, USA). The column was eluted isocratically at 1.5 mL/min with 10 mM/L NaOH (Chempur, Piekary Śląskie, Poland) and held for 20 min. Afterwards a column was rinsed with 50 mM/L NaOH for 10 min, and balanced with 10 mM/L NaOH for 5 min. Then, 25 µL of the sample solution was injected. The UV detector was set at 225 nm.
The results were expressed as NaNO2 and NaNO3 in mg/kg.

2.2.4. Nitrosyl Pigments Determination

The nitrosyl pigments content was determined by the Hornsey method [21]. The 5 g homogenized meat products were added into dark glass bottles with 21.5 mL aqueous acetone solution acetone (Chempur, Piekary Śląskie, Poland) and distilled water was mixed at a ratio of 40:3. After shaking (3 min) the bottles were placed in the dark (30 min, 20 ± 1 °C) and stirred regularly. Then, the mixtures were filtered with a two quantitative GF/A Whatman filter paper (Lab-Sysytem-Service, Szczecin, Poland). The absorbance was read at 540 nm in the Q104 semi-micro quartz cuvette (Alchem, Toruń, Poland) using a Hitachi spectrophotometer (U-2900, Tokyo, Japan). The nitrosyl pigments content was calculated according to the equation:
Nitrosyl   pigments   ( ppm   of   haematin )   =   Abs 540   nm 290 .

2.2.5. Instrumental Measurement of Colour

Measuring the colour components in the CIELab system, where L* stands for (lightness), a* (chromaticity from green (−a) to red (+a)), b* (chromaticity from blue (−b) to yellow (+b)), was performed using a retro-reflective Minolta CR-300 spectrophotometer (Konica Minolta, Tokyo, Japan). During the measurements, a standard CIE observer was used: 2°, illuminant D65, measurement area 8 mm, calibration was done using the white tile standard (L* 99.18, a* −0.07, b* −0.05) (CIE, 1976). L* a* b* colour components were determined in meat products receiving illumination at 0, 2, 5, 24, and 48 h. Exposure to light was performed in the refrigerated counter at a temperature of 7 °C. Fluorescent white light with 180 to 190 lx intensity was applied. Preserved blocks cut across were the research samples. During exposure to light the samples were wrapped in cling film in order to prevent the surface of the product from drying. The studies on model products were performed after production (time 0) and 8 weeks of storage at 4 °C.
The measurement was performed in a room at 24 °C ± 2 °C. Four measurements were carried out for each of the four replicates of the treatment (C, M, SL).
The hue angle (h°) was calculated according to Equation (1),
h ° = tan 1 b * a * ,
and chroma (C*-saturation index) was calculated according to Equation (2),
C * = a * 2 + b * 2 ,
where a* and b* were data from an instrumental measurement of colour.
The total change in colour (∆E*) was calculated after storage according to Equation (3),
E * = ( L 1 L 2 ) 2 + ( a 1 a 2 ) 2 + ( b 1 b 2 ) 2 ,
where 1 is the value before storage or illumination; 2 is the value after storage or illumination [22].

2.2.6. Microbiological Analysis

Meat samples (20 g) were collected aseptically into plastic bags. Then, after adding 180 mL of buffered peptone water, they were homogenized for 2 min in a Stomacher (Seward Ltd., London, UK). Appropriate decimal dilutions were made, and microorganisms were grown on Petri dishes on different media and incubation conditions. The total aerobic bacteria count (ACC—aerobic colony count) was determined on a Tryptone Soya Agar (Oxoid, Basingstoke, UK) incubated at 30 °C for 72 h. MRS agar (Merck KGaA, Darmstadt, Germany) was used to evaluate the number of lactic acid bacteria (LAB). For the Staphylococcus genus enumeration, the Staphylococcus Medium 110 (BD, Le Pont de Claix Cedex, France) was used. MRS agar and Staphylococcus Medium 110 were incubated at 30 °C for 48 h. After that, the plates with the number of colonies equal to 15 to 300 (at least on one plate from two successive dilutions) were considered in the calculations. The bacteria enumeration in the meat products was performed following the PN-ISO 7218:2008 method and expressed as the log of a colony-forming unit per one gram of meat product (cfu/g).

2.2.7. Sensory Evaluation

The sensory evaluation was performed using the Quantitative Descriptive Analysis (QDA) according to ISO 13299:2003. The assessment team determined the intensity of the chosen quality features and put the assessment result on a proper graphic scale (0–10). To compare the sensory quality of the meat products, the following discriminants were used: salty flavour (0 = not very strong–10 = very strong), acid/sharp flavour (0 = not intensive–10 = very intensive), sterilization flavour (0 = not intensive–10 = very intensive), metallic flavour (0 = not very strong–10 = very strong), cured meat flavour (0 = not intensive–10 = very intensive), fatty flavour (0 = not intensive; 10 = very intensive), acid/sharp odour (0 = not intensive–10 = very intensive), cured meat odour (0 = not intensive–10 = very intensive), sterilization odour (0 = not intensive–10 = very intensive), fatty odour (0 = not intensive–10 = very intensive), colour tone (0 = light pink–10 = dark pink), tenderness (0 = not very tender–10 = very tender), juiciness (0 = not very juicy–10 = very juicy), overall quality (0 = low–10 = very high). The meat products before evaluation were kept in the laboratory at 24 °C ± 1 °C for 40 min. Samples for the tests were prepared by cutting the 50 mm × 30 mm × 20 mm blocks of preserve and placed in closed plastic 250 mL containers. Each time, professional evaluators obtained coded samples of meat products and a dish with water to rinse their mouths. The assessments were performed by a 10-person trained IBPRS team. The sensory quality evaluation of the model products was performed at eight weeks of storage.

2.3. Statistical Analysis

All observations composing the experiment (three treatments × four batches × three storage periods) were included in the statistical analysis. The experiment was performed in four replications (n = 4) at different times in the same location, using four lots of pork meat (batches) and a completely randomized design was used. The results obtained from the physicochemical and microbiological analyses were evaluated by ANOVA with a general linear model, the treatments or storage/illumination time as a fixed effect, and the replicates (n = 4) as a random effect. For analyzing data from a sensory evaluation, the treatments as a fixed factor (three levels) and panelists (10 persons) as a random factor were used. The significance of the differences between the means of treatments was performed with the Fisher’s least significant difference test at a 5% level (LSD0.05). The level of significance p < 0.05 was used for all comparisons. Data analyses were conducted using the STATGRAPHICS v. 4.1 statistical program (Manugistics Inc., Rockville, MD, USA).

3. Results and Discussion

3.1. Analysis of pH and Redox Potential

The SL treatment, in which the S. carnosus ATCC 51365 and L. fermentum S8 were used for curing, was of the significantly (p < 0.05) lowest pH (6.36) after production. The acidity of the C and M treatments was at a similar level (6.53–6.55) (Table 1). Similar differences between the treatments were found at four weeks of storage. Higher acidity of the SL treatment was most likely a result of meat saccharides fermentation caused by L. fermentum S8 during the curing and production of lactic acid or other organic acids [13,18,23]. Slima et al. [23] reported a decrease in the pH of cured raw sausages with L. plantarum TN8 addition after five days of refrigerated storage (4 °C). After the first day of the storage of raw sausages, the authors showed no changes in pH, but the experimental model used did not assume heating the sausages, so the conditions for bacterial activity and acid production were different than in our experiment. Furthermore, different strains of lactic acid bacteria may have different rates of fermentation and acid production [13,18].
After four weeks of storage, a lower pH by 0.13 to 0.15 (p < 0.05) was observed in all of the treatments (C, M, SL). After eight weeks of storage, the pH went slightly up by 0.2 to 0.4 units (Table 1). A similar decrease in the pH of the products during storage was reported by Shin et al. [24] in cured pork patés and by Wójciak et al. [25] in cured cooked pork sausage. The main factor that had an influence on pH decrease was the metabolic activity of environmental bacteria or LAB added to raw meat batter and CO2 production, which dissolves in the product after cooking and during storage, creating acid [24,26]. A slight pH increase after eight weeks of storage could be the result of hydrolytic protein transformations that run in the heat treated product and microorganisms enzymes activity [27].
After production, the highest redox potential value (246.5 mV) was found in the SL treatment. The C and M treatments were of similar redox potential (235.2–238.3 mV). After four and eight weeks of storage, no significant differences were found in the redox potential between the variants (p > 0.05).
The dynamic of changes in the redox potential of the experimental treatments during storage was diverse. In the case of control treatment C, a statistically significant increase of redox potential was observed by 18.1 mV after four weeks of storage and after eight weeks of storage it went down by 6.8 mV. The redox potential value in the C treatment (246.5 mV) after eight weeks of storage was significantly higher from the value after production (235.2 mV). The redox potential in the M treatment increased significantly during eight weeks of cold storage from 238.3 to 263.0 mV. The most stable redox potential was observed in the SL treatment, in which no significant redox value changes were observed during eight weeks of storage (Table 1).
Lower redox potential value was reported in the C and M treatments after production, which could be the result of lower residual nitrite that is strongly anti-oxidative [28]. Along with a lower NaNO2 level in the product, higher redox potential was observed (Table 1, Figure 1a).
LAB are relatively anaerobic bacteria. In unfavourable conditions, LAB may use oxygen as a terminal electron acceptor. One of the products occurring due to oxygen reduction by bacteria within the respiratory chain strongly oxidises hydrogen peroxide (H2O2) [29,30]. H2O2 is toxic also for bacteria itself and is usually quickly secreted into the environment [31]. H2O2 produced by bacteria in raw meat batter could have an effect on higher redox potential value in SL treatment after cooking compared to other variants. Pyruvic acid is an intermediate product of each of the carbohydrates’ metabolism processes of Lactobacillus bacteria. This chemical compound plays the role of an electron acceptor, but it also enables keeping oxidation and reduction balance in the cell [32]. This acid could occur in the product after cooking and have an effect on redox potential stability in the SL variant during storage.

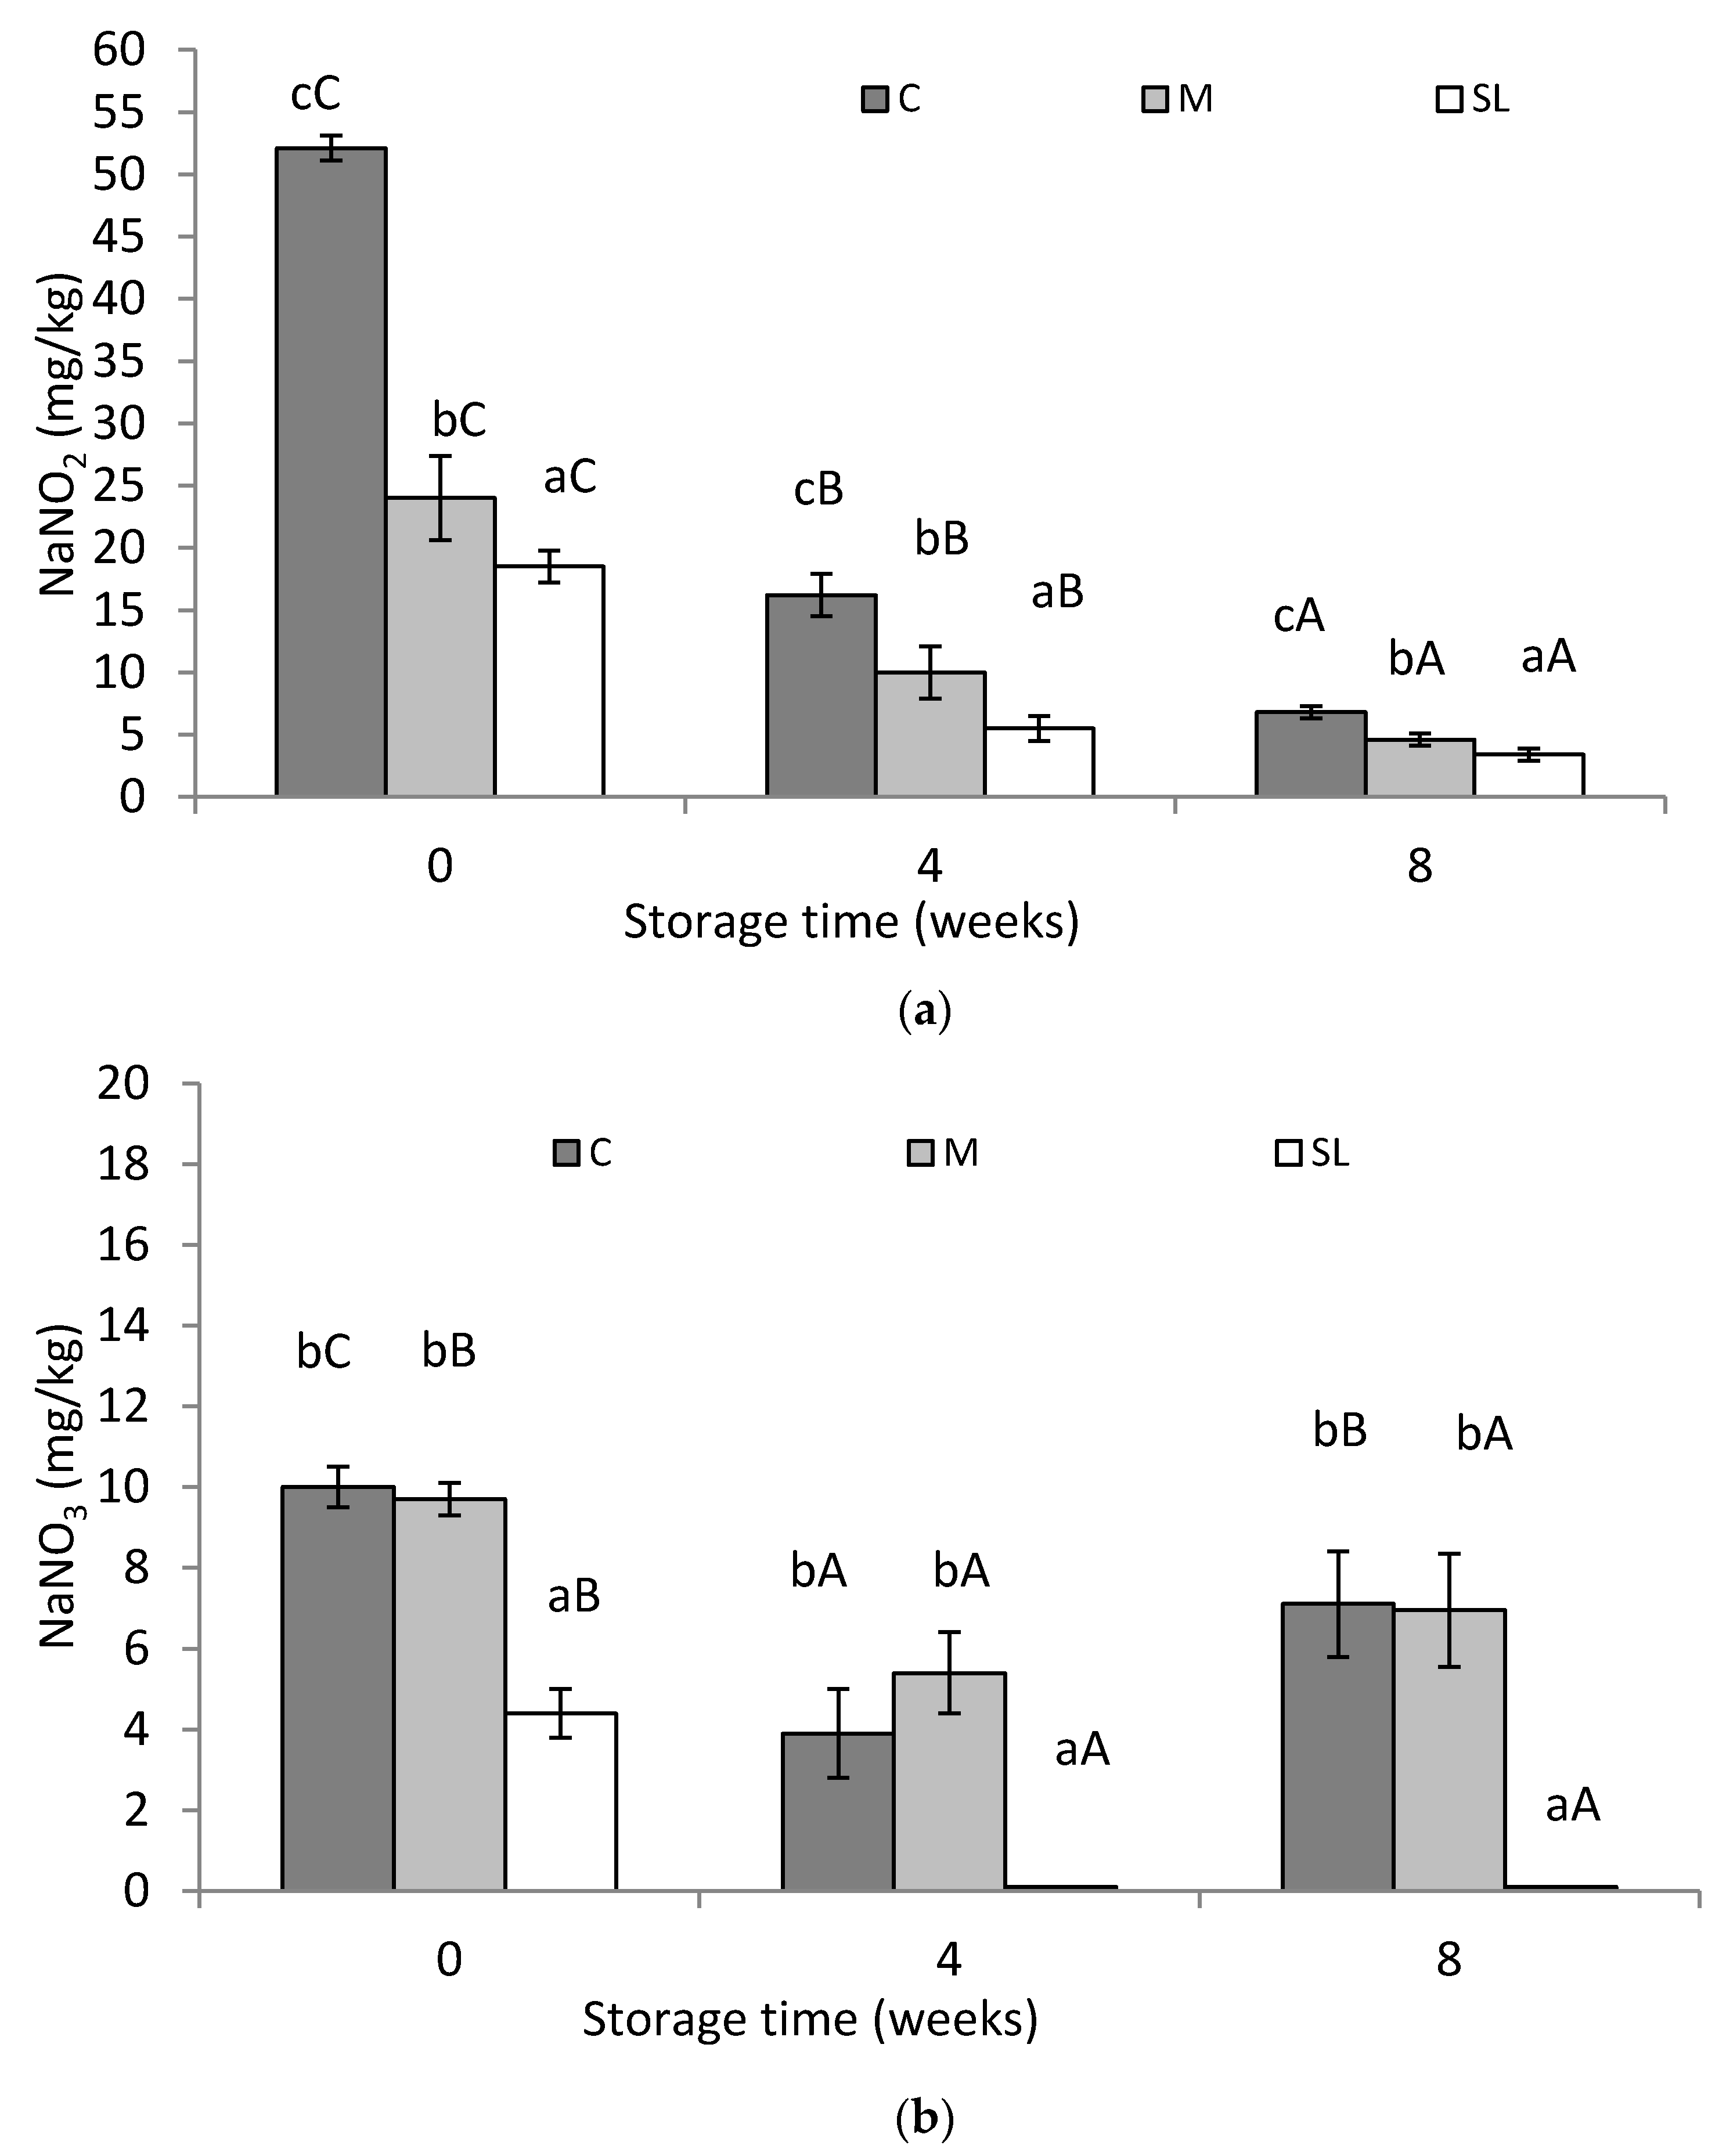
3.2. Nitrites and Nitrates Content

In the case of reducing the amount of nitrite added to meat in order to keep an acceptable curing effect, it is crucial to keep unreacted nitrite and nitrate as low as possible [5]. The highest residual nitrites level (52.1 mg/kg) in the model meat products after production was determined in the control variant (C); it was related to the dose of NaNO2 applied to the meat. The residual sodium nitrite content in the M treatment was significantly lower (16.2 mg/kg) (p < 0.05). The difference in the amount of residual nitrite between the C and M treatment resulted from the amount of nitrite introduced into the meat batters. Statistically, the lowest sodium nitrite level was found in the SL treatment (6.8 mg/kg) in which the mixed bacteria culture was used for meat curing. The same trend was observed after storage (Figure 1a). The factor influencing the level of residual nitrites in the product is the pH. pH value lower by 0.2 units doubles the reduction of nitrites [33]. Moreover, the level of nitrites in the SL treatment could also be influenced by bacterial activity in the raw meat batter before cooking during the 24 h period of curing the meat. S. carnosus bacteria produce the nitrite reductase enzyme that takes part in the reduction of nitrites to ammonia in the anaerobic respiratory process [17,34]. Some of the Lactobacillus bacteria strains may reduce nitrites to ammonia in a process called fermentative nitrate reduction or ammonification. The second nitrite reduction type processed by lactic acid bacteria has been observed in the case of some bacteria strains that present heme independent nitrite reductase activity. In this case, the NO2 bacteria reduction results in NO and N2O [14]. Dodds and Collins-Thompson [35] estimated that LAB is responsible for 30% of nitrites concentration reduction in the Bologna cooked sausage. Other research has proved that the reduction of residual nitrites concentration in the samples of fermented sausages implanted with L. fermentum totalled 76.1% of the initial nitrite’s concentration [36].
Nitrite reduction was observed during the model product storage (p < 0.05). It is an issue known and described in many papers [37,38,39]. Significantly, the lowest nitrates content (4.4 mg/kg) after production was found in the SL treatment where the mixed bacteria culture was used in the curing process (p < 0.05). A significantly higher level of nitrate was reported in the M treatment (9.7 mg/kg) and C treatment (10.0 mg/kg) (Figure 1b). The lower content of nitrates in the SL variant after heat treatment may be related to the use of these compounds by bacteria in anaerobic respiration during growth in raw meat batter before cooking. During these processes, electrons that separate from the respiration substrate are connected to nitrates by the nitrate reductase enzyme and create nitrites [14]. Nitrate content in the SL treatment was reduced during storage (p < 0.05). After four weeks of storage, a reduction of the amount of nitrates was observed in the M and C treatments to the levels of 5.4 mg/kg and 3.9 mg kg, respectively. After eight weeks of storage, the nitrate level increased to 6.9 mg/kg in the M treatment and 7.1 mg/kg in the C treatment. Nitrate reduction in the product may happen with the use of bacteria enzymes. The microbiological analysis showed that total aerobic bacteria count (ACC) was at the level of 102 cfu/g in all of the experimental treatments after cooking and storage. The nitrate increase observed after storage in the M and C treatments are most likely the result of nitrite residual oxidation [4]. In the SL variant, the nitrates level did not increase after eight weeks of storage, which could be the result of the observed redox potential stability (Table 1, Figure 1b).

3.3. Nitrosyl Pigments Content

The highest amount of nitrosyl pigment content after production (48.5 ppm) was observed in the SL treatment (p < 0.05). The amount of nitrosyl pigments in the C and M treatments after production was similar and reached 43.0 and 42.4 ppm respectively. The same tendency was observed after storage (Figure 2). Posthuma et al. [40] determined the nitrosyl pigments level at 74.7 ppm in heat-treated pork ham cured with NaNO2 at 150 mg/kg. However, Sindelar et al. [9] reported 36.3 ppm of nitrosyl pigments in homogenized beef sausage cured with NaNO2 at 200 mg/kg.
A lower pH in the SL treatment was due to the metabolic activity of L. fermentum S8 in raw meat batter during 24 h curing time and could have an influence on the reaction level of heme pigments with NO and thus leading to a higher amount of nitrosyl pigments in the SL treatment after cooking [3,41]. S. carnosus ATCC 51365 could take part in the curing process in raw meat batter reducing nitrate formed in the nitrite dismutation reaction. In addition, nitrite could react again with meat heme pigments in raw meat batter. This process could take place many times during the 24 h of curing the meat and affect the amount of nitrosyl pigments in the SL treatment after cooking [15].
Lactobacillus bacteria are microorganisms that are relatively independent from iron. Independence from iron could most likely explain the capability of being able to grow in milk, in which the availability of this element is limited due to the presence of lactoferrin [42]. It is known that Lactobacillus bacteria that are heme independent may reduce NO2 and form NO and N2O [14]. Limosilactobacillus fermentum used within this experiment was isolated from acidic whey and thus the capability to reduce NO2 to NO in raw meat batter by bacteria cannot be excluded. NO may react with deoxymyoglobin (MbFe2+) and form nitrosylmyoglobin. The NO reaction with metmyoglobin (MbFe3+) is also possible and forms the nitrosyl metmyoglobin complex [4].

3.4. Colour Analysis after Production and Storage

The highest value of a* colour compound (10.55) after production was confirmed in the SL treatment (p < 0.05), which was due to nitrosyl pigment levels in the product [43,44] (Table 2, Figure 2). Decreasing sodium nitrite to 50 mg/kg and using S. carnosus ATCC 51,365 and L. fermentum S8 bacteria for curing meat enabled obtaining higher redness in the product after cooking than in the control treatment in which NaNO2 at the level of 100 mg/kg was added. No statistically significant (p > 0.05) differences were found between the C (a* = 10.02) and M (a* = 10.09) treatments. It indicates that decreasing the initial amount of sodium nitrite from 100 mg/kg to 50 mg/kg applied in the model composition did not have any effect on the red colour share in the final product. The negative influence of reducing the dose of nitrite used in meat curing on the colour of the final product has been indicated in a great deal of research [1,43,45,46].
However, apart from nitrite added to meat, there are a number of factors (a number of heme being pigments in meat, amount of connective tissue, redox of meat, application of antioxidants and others) that may have an influence on curing process effectiveness, nitrosyl pigments level, and the products colour [1,3,4,41,43,44]. Wójciak et al. [47] observed that decreasing sodium nitrite from 100 to 50 mg/kg in roasted beef did not have a significant effect on the a* parameter value of the products. Whereas Heaton et al. [43] reported that decreasing the nitrite amount from 16 to 13 mg/kg had a significant effect on redness (a*) in cooked poultry rolls. In other research performed on finely ground cooked pork batters it was proved that when using 100 mg/kg of added sodium nitrite a significantly higher a* parameter value in the product was reported compared to a lower sodium nitrite amount (15 mg/kg) [15]. In other studies, sodium nitrite added in the production of Asian sausages (120 mg/kg), has been replaced with cochineal (0.05%), vitamin C (0.05%), vitamin E (0.05%), and celery (1%), which can be a natural source of nitrites and nitrates. The content of residual nitrites in the control sausage after heat processing was 88.7 mg/kg, while in the sample without the addition of nitrites it was 23.2 mg/kg. The redness (a*) of the sausage where nitrite was added was significantly higher than in the sample without nitrite [46].
After production, all treatments were of a similar b* colour parameter (4.85–4.95). The C treatment significantly (p < 0.05) stood out with the highest L* (64.93) (Table 2). It was proved that SL treatment statistically (p < 0.05) had the highest colour saturation (C* = 11.65). No statistically significant differences (p > 0.05) were found between the C (C* = 11.13) and M (C* = 11.21) treatments (Table 2). At the same time, and significantly, the lowest value of the hue angle was hº = 25.05, proving a general colour tone shift towards the red colour, which was confirmed in the SL treatment. The average values of the hº parameter for the C (25.77) and M (25.79) treatments were not statistically significantly different (p > 0.05).
After eight weeks of storage, statistically (p < 0.05) the highest value of the a* colour parameter (10.94) and b* parameter (5.08) were confirmed in the SL. Significantly lower a* and b* parameters values were reported in the C and M treatments (Table 3). The C treatment had significantly (p < 0.05) the highest L* parameter value (65.30) (Table 3). The SL treatment after storage was of the highest (p < 0.05) colour saturation (C* = 12.06). No statistically significant differences were found in the hº values between treatments (p > 0.05).

3.5. Colour Analysis during Exposure to Light

During exposure to white fluorescent light and after production and eight weeks of storage, the model products showed a lower redness (a*). Together with lower redness in the product colour tone during light exposure the yellow (b*) colour share increased and sample lightness increased (L*) (Table 2 and Table 3). Light has a negative influence on the colour of meat products surfaces due to oxidation processes [48,49]. Iron oxide formed during heme pigments light exposure is responsible for a greenish or grey-brown colour due to different forms of myoglobin, and mainly metmyoglobin [50,51].
The effect of light on the products surface caused lower colour saturation (C*) and colour tone change (higher hº value) of the model products. The hue angle value change (hº) was caused by the higher yellow colour share (b*) and lower red colour share (a*) in the tones of the tested samples (Table 2 and Table 3).
The differences were proved (p < 0.05) in the total colour change (∆E*) of products being the subject of light exposure after production. The highest ∆E* value was observed in all experimental treatments after 2 h of light exposure, which indicates the biggest dynamics of colour change in this period. In the further hours of light exposure, colour change of the model products was less intense (Table 2 and Table 3). A similar dependence was reported in previous research [15].
After production and 5 h after light exposure the highest ∆E* value was reported in the SL treatment (p < 0.05). It indicates that this treatment was of lower colour stability after 5 h of light exposure than in the C and M treatments. Such dependence was not observed in the remaining light exposure periods of the tested samples both after production and after storage (Table 2 and Table 3). Lower SL treatment stability after 5 h of light exposure was most likely the result of lower residual nitrite content in the product. Nitrites and their derivates may react with free iron and other metals present in meat, blocking their prooxidative functions [1,3]. The products of nitrogenous compounds transformations may react with muscle tissue elements forming nitrosyl compounds with antioxidative activities [3] that could slower the nitromiochromogen oxidation process.
All treatments (C, M, SL) after production exposed to light were of a similar value of yellowness (b*). After eight weeks of storage, the b* parameter value after exposure to light was the highest in the SL treatment (p < 0.05). After production and eight weeks after storage, the highest L* parameter after light exposure was reported in the C treatment. The L* parameter value in the M and SL treatments were similar (Table 2 and Table 3).
Changes in colour parameters (a* and b*) during light exposure influenced the saturation and hue angle values of the model products. The SL treatment was of the highest colour saturation (C*) after light exposure. No statistically significant differences between the C and M treatments were found (p < 0.05). The highest red colour share in the product (the lowest hº value) after light exposure was found in the SL treatment. Nevertheless, statistically significant differences (p < 0.05) between variants were not confirmed in all periods of light exposure. A similar relation was reported after production and storage (Table 2 and Table 3).

3.6. Microbiological Quality of the Experimental Meat Products

In the conducted studies, no statistical differences between the treatments in terms of microbiological quality during storage were found (Table 4).
Total aerobic bacteria count (ACC) was at a similar level in all of the experimental treatments and varied from 2.34 to 2.72 log cfu/g. The enumeration of lactic acid bacteria (LAB) and Staphylococcus in all of the model meat products was below 1.2 log cfu/g throughout the experiment.
The main reason of the reduction in the number of microorganisms was the heating treatment in these experimental products. Furthermore, a relatively low ACC level observed in the products may be the result of using whole ham muscles in the recipe. Whole muscles are generally of lower microbiological load compared to trimmings meat [52]. Meat batter used in the experiment had a relatively low fat content (2.0%) and high average water content (75.5%) which could cause the high effectiveness of heat destruction on the Staphylococcus and Lactobacillus bacteria cells.
Szymański et al. [15] determined ACC, LAB, and Staphylococcus bacteria <1.2 log cfu/g in a heat-treated pork product cured with NaNO2 at 15 and 100 mg/kg after production and eight weeks of storage. Similar results in terms of total bacteria counts (<2 log cfu/g) in heat-treated sausages with low fat content were reported by Jeong [53]. Ruiz-Capillas et al. [46] determined ACC < 3 log cfu/g in Asian nitrite free hot dog sausages reformulation with cochineal, celery, and vitamin C and E after production. Wójciak et al. [47] determined LAB on a level ranging from 7.89 to 8.20 cfu/g in minced beef roast with pork fat added and cured with a different sodium nitrite dose (50, 75, 100, 150 mg/kg) after 21 days of storage.

3.7. Sensory Quality

The sensory evaluation performed after eight weeks of storage showed significant statistical differences (p < 0.05) in the model products colour tone. The most intense pink colour was observed in the SL treatment, which was similar to the instrumental measurement of the colour of the product (Figure 3).
Significantly lower (p < 0.05) values in the product colours were reported in the C and M treatments. In the SL treatment, panelists identified a metallic hint of low intensity. Nevertheless, it did not have an effect on the overall quality of the product (p > 0.05). The highest average note for acid flavour was found in the SL treatment, but no statistically significant differences of this factor between variants was observed (p > 0.05). It seems that the pH of the SL treatment observed in the tests performed with tools was not low enough to cause significant sensory variations. Similar observations were confirmed by Vermeiren et al. [54] in model cooked ham implanted with selected Lactobacillus bacteria. The pH decreased by 0.2 to 0.4 units and did not have a significant influence on the products sensory acceptability. In the case of other sensory quality discriminants analyzed within this research, no differences were shown (p > 0.05).
In previous research, in which the S. carnosus ATCC 51365 monoculture was used for meat curing with a lower NaNO2 dose, no statistically significant differences in the product taste profile were found [15]. The research of other authors indicates that adding Lactobacillus bacteria to meat or meat products may have an impact on sensory quality [23,54,55,56]. The research of Vermeiren et al. [54] proved that cured cooked ham with L. plantarum applied on the product surface was of an atypical (unacceptable) taste after 13 days of storage. Adding LAB to the tested sausages did not have a negative effect on colour and the overall look of the product. Victoria-León et al. [55] reported taste improvement and overall acceptance in sausages after heat treatment with the addition of L. lactis and L. piscicola after two days of cold storage, whereas after 12 days of storage of sausage with LAB addition they obtained lower scores in the sensory tests compared to the control sample. Pérez-Chabela et al. [56] reported higher scores in the sensory tests of cooked sausage with the addition of thermotolerant lactic acid bacteria isolated from commercial meat products than in the variant without bacteria. It is known that together with the increase of heterofermentative LAB content apart from lactic acid, other organic acids are formed as well, i.e., acetic or propanoic acids [57]. In our experiment, the model product was in tin cans. It is possible that SL treatment acidity and the interaction of other products of bacteria metabolites which could be produced in raw meat batter with the canning material caused a metallic change in the SL treatment taste.

4. Conclusions

The performed research indicates the possibility of using a lower amount of sodium nitrite (50 mg/kg) in producing cooked meat products using the mixed bacteria culture Limosilactobacillus fermentum S8 and Staphylococcus carnosus ATCC 51365 for curing. Applying Staphylococcus carnosus ATCC 51365 in the curing process expanded the nitrites availability in raw meat by batter reducing nitrates formed in the dismutation reaction. It can be assumed that the metabolic activity of Limosilactobacillus fermentum S8 in raw meat batter influenced the level of the reaction between nitrites and meat heme pigments as well as the amount of formed nitrosyl myoglobin. Implementing bacteria to the meat curing process with a lower amount of sodium nitrite (50 mg/kg) was the most effective and enabled obtaining a higher red colour share in the meat product after cooking, storage and exposure to light than in the case of the product cured with a higher amount of sodium nitrite (100 mg/kg), which maintained a similar sensory and microbiological quality. The research indicates that using Limosilactobacillus fermentum S8 and Staphylococcus carnosus ATCC 51365 together in the meat curing process is a promising direction for research, aiming to reduce the ingoing nitrite to meat and to obtain heat-treated meat products that have a lower residual nitrite content. Nevertheless, a more detailed study of the sensory characteristics of the product to which the Limosilactobacillus fermentum S8 bacteria were applied in the meat curing process should be performed. In addition, studies on product microbiological stability produced with a lower amount of sodium nitrite and with Limosilactobacillus fermentum S8 and Staphylococcus carnosus ATCC 51365 added to meat curing should be continued.

Author Contributions

Conceptualization, P.S. and D.K.-K.; formal analysis, P.S.; methodology, P.S., B.Ł., A.K.-J. and U.S.; writing-original draft, P.S. and D.K.-K.; writing—review and editing, P.S. and B.Ł. All authors have read and agreed to the published version of the manuscript.

Funding

This research received no external funding.

Institutional Review Board Statement

Not applicable.

Informed Consent Statement

Not applicable.

Data Availability Statement

The data presented in this study are available on request from the corresponding author.

Conflicts of Interest

On behalf of all authors, the corresponding author states that there are no conflicts of interest.

References

  1. Sindelar, J.J.; Milkowski, A.L. Sodium Nitrite in Processed Meat and Poultry Meats: A Review of Curing and Examining the Risk/Benefit of Its Use. Am. Meat Sci. Assoc. AMSA White Pap. Ser. 2011, 3, 1–14. [Google Scholar]
  2. Majou, D.; Christieans, S. Mechanisms of the bactericidal effects of nitrate and nitrite in cured meats. Meat Sci. 2018, 145, 273–284. [Google Scholar] [CrossRef] [PubMed]
  3. Sebranek, G.J.; Bacus, J.N. Cured meat products without direct addition of nitrate or nitrite: What are the issues? Meat Sci. 2007, 77, 136–147. [Google Scholar] [CrossRef] [PubMed]
  4. Honikel, K.O. The use and control of nitrate and nitrite for the processing of meat products. Meat Sci. 2008, 78, 68–76. [Google Scholar] [CrossRef]
  5. Barbieri, G.; Bergamaschi, M.; Barbieri, G.; Franceschini, M. Kinetics of nitrite evaluated in a meat product. Meat Sci. 2013, 93, 282–286. [Google Scholar] [CrossRef]
  6. Arneth, W. Chemische Grundlagen der Umrötung. [Chemical principles of reddening]. Fleischwirtschaft 1998, 78, 868–874. [Google Scholar]
  7. Cassens, R.G. Use of sodium nitrite in cured meats today. Food Technol. 1995, 49, 72–80. [Google Scholar]
  8. Cassens, R.G.; Ito, I.; Lee, M.; Buege, D. The use of nitrite in meat. Bioscience 1978, 28, 633–637. [Google Scholar] [CrossRef]
  9. Sindelar, J.J.; Cordray, J.C.; Sebranek, J.G.; Love, J.A.; Ahn, D.U. Effects of varying levels of vegetable juice powder and incubation time on color, residual nitrate and nitrite, pigment, pH, and trained sensory attributes of ready-to-eat uncured ham. J. Food Sci. 2007, 72, 388–395. [Google Scholar] [CrossRef]
  10. Riazi, F.; Zeynali, F.; Hoseini, E.; Behmadi, H. Effect of Dry Red Grape Pomace as a Nitrite Substitute on the Microbiological and Physicochemical Properties and Residual Nitrite of Dry-cured Sausage. Nutr. Food Sci. Res. 2016, 3, 37–44. [Google Scholar] [CrossRef]
  11. European Commission. Ad-Hoc Study on the Monitoring of the Implementation of Directive 2006/52/EC as Regards the Use of Nitrites by Industry in Different Categories of Meat Products; Revised Interim Report; European Commission: Brussels, Belgium, 2015. [Google Scholar]
  12. Commission Decision (EU) 2018/702 of 8 May 2018 concerning national provisions notified by Denmark on the addition of nitrite to certain meat products (notified under document C(2018) 2721). Off. J. Eur. Union 2018, L118, 7–15.
  13. Cocconcelli, P.S.; Fontana, C. Characteristics and Applications of Microbial Starters in Meat Fermentation. In Meat Biotechnology; Toldrá, F., Ed.; Springer: New York, NY, USA, 2008; pp. 129–147. [Google Scholar]
  14. Hammes, W.P. Metabolism of nitrate in fermented meats: The characteristic feature of a specific group of fermented foods. Food Microbiol. 2012, 29, 151–156. [Google Scholar] [CrossRef] [PubMed]
  15. Szymański, P.; Łaszkiewicz, B.; Siekierko, U.; Kołożyn-Krajewska, D. Effects of the Use of Staphylococcus carnosus in the Curing Process of Meat with a Reduced Amount of Sodium Nitrite on Colour, Residue Nitrite and Nitrate, Content of Nitrosyl Pigments, and Microbiological and the Sensory Quality of Cooked Meat Product. J Food Qual. 2020, 7, 6141728. [Google Scholar] [CrossRef]
  16. Löfblom, J.; Rosenstein, R.; Nguyen, M.T.; Ståhl, S.; Götz, F. Staphylococcus carnosus: From starter culture to protein engineering platform. Appl. Microbiol. Biotechnol. 2017, 101, 8293–8307. [Google Scholar] [CrossRef] [PubMed] [Green Version]
  17. Mainar, M.M.; Stavropoulou, D.A.; Leroy, F. Exploring the metabolic heterogeneity of coagulase-negative staphylococci to improve the quality and safety of fermentem meats: A review. Int. J. Food Microbiol. 2017, 247, 24–37. [Google Scholar] [CrossRef] [PubMed]
  18. Chen, X.; Li, J.; Zhou, T.; Li, J.; Yang, J.; Chen, W.; Xiong, Y.L. Two efficient nitrite-reducing Lactobacillus strains isolated from traditional fermented pork (Nanx Wudl) as competitive starter cultures for Chinese fermented dry sausage. Meat Sci. 2016, 121, 302–309. [Google Scholar] [CrossRef]
  19. Rzepkowska, A.; Zielińska, D.; Ołdak, A.; Kołożyn-Krajewska, D. Organic whey as a source of Lactobacillus strains with selected technological and antimicrobial properties. Int. J. Food Sci. Technol. 2017, 52, 1983–1994. [Google Scholar] [CrossRef]
  20. Siu, D.; Henshall, A. Ion chromatographic determination of nitrate and nitrite in meat products. J. Chromatogr. A 1998, 804, 156–160. [Google Scholar] [CrossRef]
  21. Hornsey, M. The colour of cooked cured pork. J. Agric. Sci. 1956, 9, 534–540. [Google Scholar] [CrossRef]
  22. Hunt, M.; King, A. AMSA Meat Color Measurement Guidelines; American Meat Science Association: Savoy, IL, USA, 2012. [Google Scholar]
  23. Slima, S.B.; Ktari, N.; Trabelsi, I.; Triki, M.; Feki-Tounsi, M.; Moussa, H.; Makni, I.; Herrero, A.; Jiménez-Colmenero, F.; Ruiz-Capillas Perez, C.; et al. Effect of partial replacement of nitrite with a novel probiotic Lactobacillus plantarum TN8 on color, physico-chemical, texture and microbiological properties of beef sausages. LWT Food Sci. Technol. 2017, 86, 219–226. [Google Scholar] [CrossRef]
  24. Shin, D.M.; Hwang, K.E.; Lee, Ch.W.; Kim, T.K.; Park, Y.S.; Han, S.G. Effect of Swiss Chard (Beta vulgaris var. cicla) as Nitrite Replacement on Color Stability and Shelf-Life of Cooked Pork Patties during Refrigerated Storage. Korean J. Food Sci. Anim. 2017, 37, 418–428. [Google Scholar] [CrossRef] [Green Version]
  25. Wójciak, K.M.; Karwowska, M.; Dolatowski, Z.J. Use of acid whey and mustard seed to replace nitrites during cooked sausage production. Meat Sci. 2016, 96, 750–756. [Google Scholar] [CrossRef]
  26. Rubio, B.; Martínez, B.; Sánchez, M.J.; García-Cachán, M.A.D.; Rovira, J.; Jaime, I. Study of the shelf life of a dry fermented sausage “salchichon” made from raw material enriched in monounsaturated and polyunsaturated fatty acids and stored under modified atmospheres. Meat Sci. 2007, 76, 128–137. [Google Scholar] [CrossRef]
  27. Kumar, D.; Tanwar, V.K. Effects of incorporation of ground mustard on quality attributes of chicken nuggets. J. Food Sci. Technol. 2011, 48, 759–762. [Google Scholar] [CrossRef] [Green Version]
  28. Feng, X.; Li, Ch.; Jia, X.; Guo, Y.; Lei, N.; Hackman, R.M.; Chen, L.; Zhou, G. Influence of sodium nitrite on protein oxidation and nitrosation of sausages subjected to processing and storage. Meat Sci. 2016, 116, 260–267. [Google Scholar] [CrossRef]
  29. Bolotin, A.; Mauger, S.; Malarme, K.; Ehrlich, S.D.; Sorokin, A. Low-redundancy sequencing of the entire Lactococcus lactis IL1403 genome. Antonie Leeuwenhoek 1999, 76, 27–76. [Google Scholar] [CrossRef]
  30. Bolotin, A.; Wincker, P.; Mauger, S.; Jaillon, O.; Malarme, K.; Weissen-Bach, J.; Ehrlich, S.D.; Sorokin, A. The complete genome sequence of the lactic acid bacterium Lactococcus lactis ssp. lactis IL1403. Genome Res. 2001, 11, 731–753. [Google Scholar] [CrossRef] [Green Version]
  31. O’Bryan, C.A.; Crandall, P.G.; Ricke, S.C.; Ndahetuye, J.B. Lactic acid bacteria (LAB) as antimicrobials in food products: Analytical methods and applications. In Handbook of Natural Antimicrobials for Food Safety and Quality; Taylor, M., Ed.; Woodhead Publishing: Cambridge, UK, 2014; Volume 7, pp. 117–151. [Google Scholar] [CrossRef]
  32. Vinderola, G.; Ouwehand, A.; Salminen, S.; von Wright, A. Lactic Acid Bacteria. Microbiological and Functional Aspects, 5th ed.; Vinderola, G., Ouwehand, A., Salminen, S., von Wright, A., Eds.; CRC Press: Boca Raton, FL, USA, 2019. [Google Scholar] [CrossRef]
  33. Sebranek, J.G. Advances in the technology of nitrite use and consideration of alternatives. Food Technol. 1979, 33, 58–62. [Google Scholar]
  34. Gøtterup, J.; Olsen, K.; Knochel, S.; Tjener, K.; Stahnke, L.H.; Møller, J.K.S. Relationship between nitrate/nitrite reductase activities in meat associated staphylococci and nitrosylmyoglobin formation in a cured meat model system. Int. J. Food Microbiol. 2007, 120, 303–310. [Google Scholar] [CrossRef]
  35. Dodds, K.L.; Collins-Thompson, D.L. Incidence of nitrite depleting lactic acid bacteria in cured meats and in meat starter cultures. J. Food Prot. 1984, 47, 7–10. [Google Scholar] [CrossRef]
  36. Esmaeilzadeh, P.; Darvishi, S.; Mazaheri Assadi, M.; Mirahmadi, F. Effect of Lactobacillus plantarum and Lactobacillus fermentum on Nitrite Concentration and Bacterial Load in Fermented Sausage during Fermentation. World Appl. Sci. J. 2012, 18, 493–501. [Google Scholar] [CrossRef]
  37. Terns, M.J.; Milkowski, A.L.; Claus, J.R.; Sindelar, J.J. Investigating the effect of incubation time and starter culture addition level on quality attributes of indirectly cured, emulsified cooked sausages. Meat Sci. 2011, 88, 454–461. [Google Scholar] [CrossRef]
  38. Hospital, X.F.; Carballo, J.; Fernandez, M.; Arnau, J.; Gratacos, M.; Hierro, E. Technological implications of reducing nitrate and nitrite levels in dry-fermented sausages: Typical microbiota, residual nitrate and nitrite and volatile profile. Food Control 2015, 57, 275–281. [Google Scholar] [CrossRef]
  39. Jin, S.K.; Choi, J.S.; Yang, H.S.; Park, T.S.; Yim, D.G. Natural curing agents as nitrite alternatives and their effects on the physicochemical, microbiological properties and sensory evaluation of sausages during storage. Meat Sci. 2018, 146, 34–40. [Google Scholar] [CrossRef]
  40. Posthuma, J.A.; Rasmussen, F.D.; Sullivan, G.A. Effects of nitrite source, reducing compounds, and holding time on cured color development in a cured meat model system. LWT 2018, 95, 47–50. [Google Scholar] [CrossRef]
  41. Benjamin, N.; Collins, J. Nitrite. In Food Preservatives; Russell, N.J., Gould, G.W., Eds.; Kluwer Academic/Plenum Publishers: New York, NY, USA, 2003; pp. 102–118. [Google Scholar]
  42. Weinberg, E.D. The Lactobacilli anomaly: Total iron abstinence. Perspect. Biol. Med. 1997, 40, 578–583. [Google Scholar] [CrossRef]
  43. Heaton, K.M.; Cornforth, D.P.; Moiseev, I.V.; Egbert, W.R.; Carpenter, C.E. Minimum sodium nitrite levels for pinking of various cooked meats as related to use of direct or indirect-dried soy isolates in poultry rolls. Meat Sci. 2000, 55, 321–329. [Google Scholar] [CrossRef]
  44. Fernandez-Gines, J.M.; Fernandez-Lopez, J.; Sayas-Barbera, E.; Sendra, E.; Perez-Alvarezj, A. Effect of storage conditions on quality characteristics of Bologna Sausage made with citrus fiber. Food Sci. 2003, 68, 710–716. [Google Scholar] [CrossRef]
  45. Eyiler, E.; Oztan, A. Production of frankfurters with tomato powder as a natural additive. LWT 2011, 44, 307–311. [Google Scholar] [CrossRef]
  46. Ruiz-Capillas, C.; Tahmouzi, S.; Triki, M.; Rodríguez-Salas, L.; Jiménez-Colmenero, F.; Herrero, A.M. Nitrite-free Asian hot dog sausages reformulated with nitrite replacers. J. Food Sci. Technol. 2015, 52, 4333–4341. [Google Scholar] [CrossRef] [Green Version]
  47. Wójciak, K.M.; Stasiak, D.M.; Kęska, P. The Influence of Different Levels of Sodium Nitrite on the Safety, Oxidative Stability, and Color of Minced Roasted Beef. Sustainability 2019, 11, 3795. [Google Scholar] [CrossRef] [Green Version]
  48. Ismail, H.A.; Lee, E.J.; Ko, K.Y.; Ahn, D.U. Effects of aging time and natural antioxidants on the colour, lipid oxidation and volatiles of ground beef. Meat Sci. 2008, 80, 582–591. [Google Scholar] [CrossRef] [PubMed]
  49. Munk, M.B.; Huvaere, K.; Bocxlaer, J.V.; Skibsted, L.H. Mechanism of light-induced oxidation of nitrosylmyoglobin. Food Chem. 2010, 121, 472–479. [Google Scholar] [CrossRef]
  50. Kim, Y.H.; Nam, K.C.; Ahn, D.U. Color, oxidation-reduction potential, and gas production of irradiated meats from different animal species. Food Sci. 2002, 67, 1692–1695. [Google Scholar] [CrossRef]
  51. Ahn, D.U.; Nam, K.C. Use antioxidants to reduce lipid oxidation and off-odor volatiles of irradiates pork homogenates and patties. Meat Sci. 2003, 63, 1–8. [Google Scholar] [CrossRef]
  52. Cerveny, J.; Meyer, J.D.; Hall, P.A. Microbiological spoilage of meat and poultry products. In Food Microbiology and Food Safety; Sperber, W.H., Doyle, M.P., Eds.; Springer Science Business Media: New York, NY, USA, 2009; pp. 69–85. [Google Scholar] [CrossRef]
  53. Jeong, J.Y. Alternative curing technology in meat products. Anim. Food Sci. Ind. 2016, 5, 77–84. [Google Scholar]
  54. Vermeiren, L.; Devlieghere, F.; Debevere, J. Evaluation of meat born lactic acid bacteria as protective cultures for the biopreservation of cooked meat products. Int. J. Food Microbiol. 2004, 96, 149–164. [Google Scholar] [CrossRef]
  55. Victoria-León, T.; Totosaus, A.; Guerrero, I.; Pérez-Chabela, M.L. Efecto de bacterias ácido lácticas termoresistentes en salchichas cocidas. Cienc. Tecnol. Aliment. 2006, 5, 135–141. [Google Scholar] [CrossRef]
  56. Perez-Chabela, M.L.; Totosaus, A.; Guerrero, I. Evaluation of thermotolerant capacity of lactic acid bacteria isolated from commercial sausages and the effects of their addition on the quality of cooked sausages. Ciênc. Tecnol. Aliment. Camp. 2008, 28, 132–138. [Google Scholar] [CrossRef] [Green Version]
  57. Ruiz-Moyano, S.; Martín, A.; Benito, M.J.; Hernández, A.; Casquete, R.; Córdoba, M.G. Application of Lactobacillus fermentum HL57 and Pediococcus acidilactici SP979 as potential probiotics in the manufacture of traditional Iberian dry-fermented sausages. Food Microbiol. 2011, 28, 839–847. [Google Scholar] [CrossRef]
Figure 1. Means (bars) and SD (line segments) of residual nitrites (a) and nitrates (b) in model meat products during storage. a–c: means with different letters differ significantly among treatments (p < 0.05); A–C: means with different letters differ significantly among timepoints (p < 0.05). C—control treatment with NaNO2 in an amount of 100 mg/kg; M—treatment with NaNO2 in an amount of 50 mg/kg; SL—treatment with NaNO2 in an amount of 50 mg/kg and L. fermentum S8 at about 107 cfu/g, and S. carnosus ATCC 51365 at about 107 cfu/g.
Applsci 11 00904 g001
Figure 2. Means (bars) and SD (line segments) of nitrosyl pigments in model meat products. a–b: different letters indicate significant differences among treatments (p < 0.05). C—control treatment with NaNO2 in an amount of 100 mg/kg; M—treatment with NaNO2 in an amount of 50 mg/kg; SL—treatment with NaNO2 in an amount of 50 mg/kg and L. fermentum S8 at about 107 cfu/g and S. carnosus ATCC 51,365 at about 107 cfu/g.
Applsci 11 00904 g002
Figure 3. Sensory profile of experimental treatments after eight weeks of storage. C—control treatment with NaNO2 in an amount of 100 mg/kg; M—treatment with NaNO2 in an amount of 50 mg/kg; SL—treatment with NaNO2 in an amount of 50 mg/kg and L. fermentum S8 at about 107 cfu/g and S. carnosus ATCC 51,365 at about 107 cfu/g; * Mean values of these attributes differ significantly (p < 0.05).
Applsci 11 00904 g003
Table 1. Values of pH and oxidation-reduction potential (redox) of the model meat products (means ± standard deviation).
TreatmentStorage Time (Weeks)
048
pHC6.53 ±0.10 bB6.38 ± 0.06 bA6.42 ± 0.09 bAB
M6.55 ± 0.09 bB6.41 ± 0.07 bA6.43 ±0.08 bAB
SL6.36 ± 0.09 aB6.23 ± 0.06 aA6.25± 0.05 aA
redox (mV)C235.2 ± 5.1 aA253.3 ± 3.9 aC246.5 ± 6.2 aB
M238.3 ± 4.6 aA247.7 ± 5.6 aB263.0 ± 3.4 aC
SL246.5 ± 2.6 bA249.5 ± 4.8 aA257.5 ± 4.5 aA
a,b Means within the same columns with different letters differ significantly (p < 0.05); A–C Means within the same row with different letters differ significantly (p < 0.05); C—control treatment with NaNO2 in an amount of 100 mg/kg; M—treatment with NaNO2 in an amount of 50 mg/kg; SL—treatment with NaNO2 in an amount of 50 mg/kg and L. fermentum S8 at about 107 cfu/g and S. carnosus ATCC 51365 at about 107 cfu/g.
Table 2. The colour parameters (L*, a*, b*, hº, C*, ΔE*) of the model meat products tested after exposure to light after production (means ± standard deviation).
TreatmentTime of Exposure to Light (Hours)
0252448
L*C64.93 ± 0.49 bA65.47 ± 0.32 bB65.68 ± 0.42 bB66.06 ± 0.43 bC66.66 ± 0.31 bD
M64.45 ± 0.40 aA65.20 ± 0.36 aB65.31 ± 0.25 aB65.60 ± 0.34 aC66.39 ± 0.43 bD
SL64.49 ± 0.32 aA65.16 ± 0.37 aB65.40 ± 0.37 aB65.71 ± 0.40 aC66.03 ± 0.50 aD
a*C10.02 ± 0.25 aE8.36 ± 0.20 aD7.14 ± 0.17 aC5.69 ± 0.14 aB5.48 ± 0.15 aA
M10.09 ± 0.18 aE8.43 ± 0.17 aD7.17 ± 0.12 aC5.68 ± 0.11 aB5.46 ± 0.14 aA
SL10.55 ± 0.20 bD8.81 ± 0.23 bC7.37 ± 0.18 bB5.78 ± 0.15 aB5.67 ± 0.18 bA
b*C4.85 ± 0.17 aA6.66 ± 0.21 aB7.46 ± 0.21 aC7.77 ± 0.30 aD7.60 ± 0.22 aC
M4.89 ± 0.12 aA6.80 ± 0.13 abB7.56 ± 0.10 aC7.81 ± 0.19 aD7.66 ± 0.27 abC
SL4.95 ± 0.20 aA6.76 ± 0.14 bB7.54 ± 0.174 aC7.93 ± 0.34 aE7.76 ± 0.20 bD
hºC25.77 ± 0.61 bA37.95 ± 0.78 bB44.68 ± 0.70 bC50.28 ± 0.67 aD50.32 ± 0.38 aD
M25.79 ± 0.59 bA38.26 ± 0.50 bB44.89 ± 0.41 bC50.39 ± 0.48 aD50.74 ± 0.69 bD
SL25.05 ± 0.91 aA37.00 ± 0.63 aB44.18 ± 0.56 aC50.36 ± 0.50 aD50.31 ± 0.37 aD
C*C11.13 ± 0.28 aE10.69 ± 0.24 aD10.33 ± 0.21 aC9.63 ± 0.28 aB9.29 ± 0.24 aA
M11.21 ± 0.18 aE10.83 ± 0.19 aD10.41 ± 0.12 aC9.65 ± 0.18 aB9.40 ± 0.24 aA
SL11.65 ± 0.22 bE11.11 ± 0.23 bD10.55 ± 0.21 bC9.81 ± 0.34 aB9.61 ± 0.25 bA
∆E*C-2.59 ± 0.19 aC1.57 ± 0.23 aB1.67 ± 0.32 abBC0.85 ± 0.52 aA
M-2.68 ± 0.21 aC1.54 ± 0.18 aB1.59 ± 0.13 aB0.94 ± 0.55 aA
SL-2.65 ± 0.35 aC1.75 ± 0.22 bB1.75 ± 0.18 bB0.79 ± 0.37 aA
a–c Means within the same columns with different letters differ significantly (p < 0.05); A–E Means within the same row with different letters differ significantly (p < 0.05); C—control treatment with NaNO2 in an amount of 100 mg/kg; M—treatment with NaNO2 in an amount of 50 mg/kg; SL—treatment with NaNO2 in an amount of 50 mg/kg and L. fermentum S8 at about 107 cfu/g and S. carnosus ATCC 51365 at about 107 cfu/g.
Table 3. The colour parameters (L*, a*, b*, hº, C*, ΔE*) of the model meat products tested after exposure to light after eight weeks of refrigerated storage (means ± standard deviation).
TreatmentTime of Exposure to Light (Hours)
0252448
L*C65.30 ± 0.35 bA65.60 ± 0.38 bB65.69 ± 0.29 bB66.47 ± 0.36 bC66.75 ± 0.42 bD
M64.96 ± 0.42 aA65.28 ± 0.45 aB65.32 ± 0.25 aB65.94 ± 0.32 aC66.03 ± 0.33 aC
SL64.85 ± 0.50 aA65.15 ± 0.51 aA65.13 ± 0.45 aA65.82 ± 0.48aB66.15 ± 0.39 aC
a*C10.35 ± 0.23 aE8.87 ± 0.23 aD7.30 ± 0.14 aC5.56 ± 0.15 aB5.31 ± 0.16 aA
M10.38 ± 0.16 aE8.81 ± 0.19 aD7.22 ± 0.10 aC5.59 ± 0.07 aB5.35 ± 0.13 aA
SL10.94 ± 0.22bE9.00 ± 0.77 bD7.66 ± 0.18 bC5.80 ± 0.14 bB5.53 ± 0.15 bA
b*C4.77 ± 0.13 aA6.35 ± 0.21 aB7.21 ± 0.14 aC7.31 ± 0.20 aC7.67 ± 0.19 aD
M4.88 ± 0.13 bA6.48 ± 0.18 abB7.36 ± 0.15 bC7.36 ± 0.13 aC7.69 ± 0.25 aD
SL5.08 ± 0.18 cA6.50 ± 0.22 bB7.53 ± 0.27 cC7.59 ± 0.22 bC8.02 ± 0.22 bD
hºC24.70 ± 0.70 aA35.21 ± 0.88 bB43.32 ± 0.63 aC49.56 ± 0.57 aD51.26 ± 0.42 aE
M24.73 ± 0.53 aA35.90 ± 0.90 bB44.10 ± 0.51 bC49.63 ± 0.32 aD51.16 ± 0.41 aE
SL24.63 ± 0.68 aA34.96 ± 1.16 aB43.21 ± 0.90 aC49.49 ± 0.39 aD51.11 ± 0.56 aE
CC11.40 ± 0.22 aE10.91 ± 0.26 aD10.26 ± 0.15 aC9.19 ± 0.21 aA9.33 ± 0.22 aB
M11.63 ± 0.18 aE10.94 ± 0.19 aD10.31 ± 0.15 aC9.24 ± 0.12 aA9.37 ± 0.26 aB
SL12.06 ± 0.25 bE11.23 ± 0.29 bD10.74 ± 0.26 bC9.56 ± 0.24 bA9.75 ± 0.22 bB
∆E*C-2.25 ± 0.31 aC1.83 ± 0.20 aB1.95 ± 0.29 bB0.70 ± 0.30 aA
M-2.36 ± 0.28 aC1.91 ± 0.24 aB1.78 ± 0.20 aB0.64 ± 0.25 aA
SL-2.37 ± 0.32 aC1.93 ± 0.30 aB2.05 ± 0.26 bB0.76 ± 0.35 aA
a–c Means within the same columns with different letters differ significantly (p < 0.05); A–E Means within the same row with different letters differ significantly (p < 0.05); C—control treatment with NaNO2 in an amount of 100 mg/kg; M—treatment with NaNO2 in an amount of 50 mg/kg; SL—treatment with NaNO2 in an amount of 50 mg/kg and L. fermentum S8 at about 107 cfu/g and S. carnosus ATCC 51,365 at about 107 cfu/g.
Table 4. Microbiological quality of experimental treatments during storage (means).
(log CFU/g)TreatmentStorage Time (Weeks)
048
Total aerobic bacteria count *C2.652.722.34
M2.582.522.51
SL2.692.612.40
Lactic acid bacteria *Cndndnd
Mndndnd
SLndndnd
Staphylococcus *Cndndnd
Mndndnd
SLndndnd
* Differences were not statistically significant (p > 0.05); C—control treatment with NaNO2 in an amount of 100 mg/kg; M—treatment with NaNO2 in an amount of 50 mg/kg; SL—treatment with NaNO2 in an amount of 50 mg/kg and L. fermentum S8 at about 107 cfu/g and S. carnosus ATCC 51,365 at about 107 cfu/g; nd—not detected (the number of bacteria <1.20 log cfu/g).
Publisher’s Note: MDPI stays neutral with regard to jurisdictional claims in published maps and institutional affiliations.

