Article

Multidimensional Emotion Recognition Based on Semantic Analysis of Biomedical EEG Signal for Knowledge Discovery in Psychological Healthcare

Department of Computer Science and Technology, School of Computer Science, Northeast Electric Power University, Jilin 132013, China
*
Author to whom correspondence should be addressed.
Appl. Sci. 2021, 11(3), 1338; https://doi.org/10.3390/app11031338
Submission received: 19 November 2020 / Revised: 28 January 2021 / Accepted: 29 January 2021 / Published: 2 February 2021
(This article belongs to the Special Issue Data Technology Applications in Life, Diseases, and Health)

Abstract

:
Electroencephalogram (EEG) as biomedical signal is widely applied in the medical field such as the detection of Alzheimer’s disease, Parkinson’s disease, etc. Moreover, by analyzing the EEG-based emotions, the mental status of individual can be revealed for further analysis on the psychological causes of some diseases such as cancer, which is considered as a vital factor on the induction of certain diseases. Therefore, once the emotional status can be correctly analyzed based on EEG signal, more healthcare-oriented applications can be furtherly carried out. Currently, in order to achieve efficiency and accuracy, diverse amounts of EEG-based emotions recognition methods generally extract features by analyzing the overall characteristics of signal, along with optimization strategy of channel selection to minimize the information redundancy. Those methods have been proved their effectiveness, however, there still remains a big challenge when applied with single channel information for emotion recognition task. Therefore, in order to recognize multidimensional emotions based on single channel information, an emotion quantification analysis (EQA) method is proposed to objectively analyze the semantically similarity between emotions in valence-arousal domains, and a multidimensional emotion recognition (EMER) model is proposed on recognizing multidimensional emotions according to the partial fluctuation pattern (PFP) features based on single channel information, and result shows that even though semantically similar emotions are proved to have similar change patterns in EEG signals, each single channel of 4 frequency bands can efficiently recognize 20 different emotions with an average accuracy above 93% separately.

1. Introduction

Emotions as the reaction to the internal or external incident, is consisted with multiply feelings, thoughts and actions, which mixed up with psychological and physiological respondence [1]. Therefore, the emotions which caused by the internal or external stimuli can then be observed through the biological signals such as electrocardiogram (ECG), electromyogram (EMG), galvanic skin response (GSR), electroencephalogram (EEG) and etc. [2,3,4,5], which directly reflect on the emotional status of individuals. And different emotions might cause different changes in the biological signals. Homeostasis is been studied to prove that different emotions might be caused by internal or external stimuli, emotions such as love, anger and fear might be activated by the environment stimuli, while fatigue, pain and hunger are due to the body needs. Moreover, neurologist discovered that anger, fear, sadness and disgust have their own nervous system activities [6], moreover, emotions are associated with neurotransmitters, such as anger is caused by the combination of low serotonin, high dopamine and high norepinephrine, yet when experiencing the feeling of shame, those three neurotransmitters are in a low level, and all three in a high level when excitement is felt [7]. Moreover, evidence shows that the positive emotions are more active in the left prefrontal cortex [8], interestingly, anger which regarded as negative emotion, also activates the left prefrontal cortex [9]. Some neuropsychologists suggest that the both regions of the brain are responsible for the emotions, however, the left frontal brain is more associated with positive emotions and social functions, while the right frontal brain is dealing with the emotions that related to survival, which caused the asymmetric frontal brain activity [10].
Since evidences support that diverse emotions might be caused by different brain activities, from the characteristic of EEG, emotions can be recognized by the differentia of respondence. Nowadays, the wearable EEG devices contained with one or several electrodes that attached on the individual’s skin can precisely record the electrical activity from the brain which can be convenient for further analysis. Generally, the analysis of EEG signal is based on different frequency bands as: delta, theta, alpha, beta and gamma. Each frequency band represents different function of body [11,12] as delta is regarded associated with sleep and concentrated task, theta is associated with inhibition of elicited responses, alpha can represent the status of relaxation and also the inhibition control, beta ranges from calm to stressed and obsessive, including thinking, focus, alert and anxious, while gamma is associated with cognitive competence and revealed a denser network connection when involved with different emotional states than other frequency bands. Studies show that the beta and gamma have been observed with a higher performance on recognizing emotions compared to other three bands. Other than the different frequency bands, selection of electrodes also might bring about different results.
Expect EEG signal, the diversity of emotion itself is also complex. Plutchik [13] once proposed an emotional wheel which suggests that emotions are formable, with eight basic emotions placed on the emotional wheel, and each two as the polarity of one and another, the follow-up emotions can be then combined within those basic emotions in different degree. Therefore, emotions are regarded as relatable to each other, and psychologists attempt to quantify emotions by using methods such as factor analysis to map those emotions into a more limited dimension [14]. Generally, a two-dimensional coordinate map is applied with valence and arousal to quantify emotion, where valence is to describe the emotion degree of negative to positive, while arousal is to describe how energized or dispassionate the emotion is.
In this paper, we aim to explore the correlation between emotion and EEG signal, and which can be furtherly applied on the healthcare of individual. Since some complex emotions are regarded as combination of basic emotions, which indicts the existence of similarity between them. Therefore, we mainly focus on the following questions:
  • Whether there are similar brain activities when similar emotions occurred?
  • Can those similar emotions be correctly distinguished based on EEG signal?
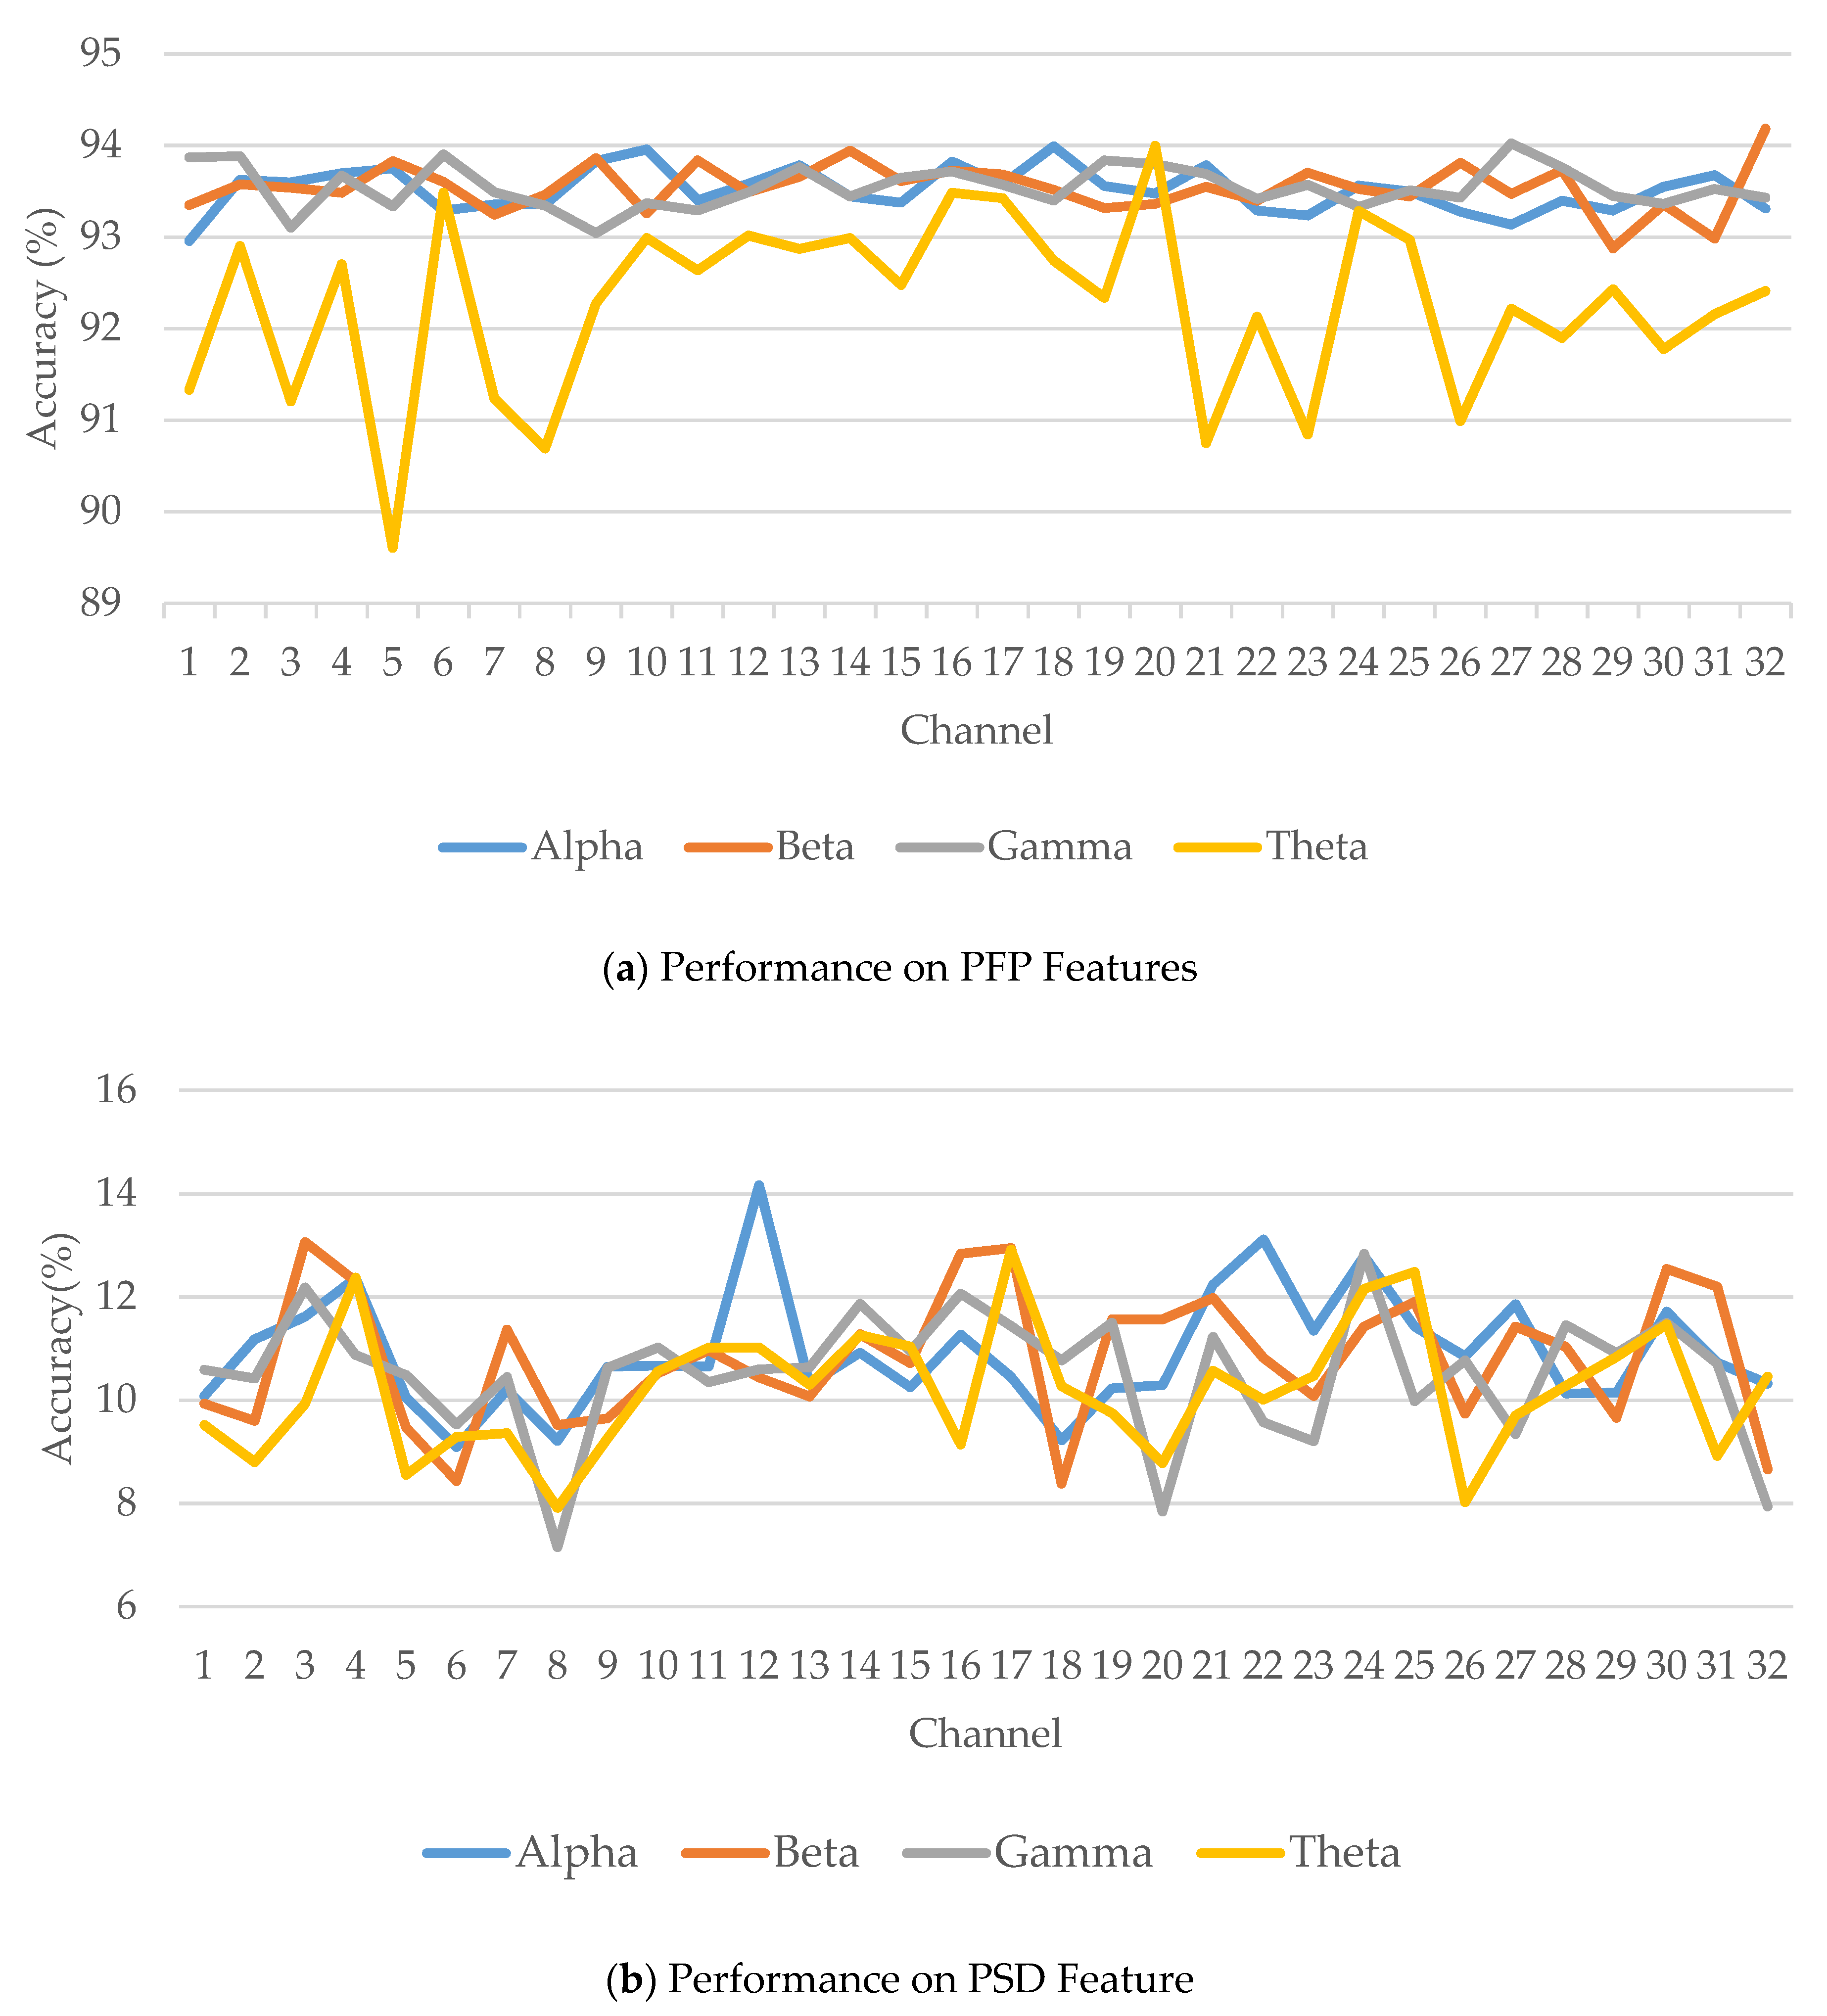
  • Can each electrode successfully recognize different emotions?
  • Are only high frequency bands suitable for recognizing emotions?
  • Can partial fluctuation pattern (PFP) features be efficient on recognition of emotions?
To resolve those questions above, the emotion quantification analysis (EQA) method is proposed, which can objectively map emotion on the valence-arousal domains and reflect the relevance of similar emotions. Then an EEG-based Multidimensional Emotion Recognition (EMER) model is proposed to analyze the composition of EEG signal, and conducted a pattern approach on recognition of emotions based on PFP features.

2. Related Work

Currently, most studies on EEG-based emotion recognition are focusing on selection of features, classification methods, optimization of channel selection and emotion categories which can be recognized by EEG signal.
Related studies have proved that diverse features and multiple machine learning methods are efficient on the classification task. Chen et al. [15] proposed a combination method of spatial pattern and wavelet packet decomposition on recognition of EEG-based emotions, which is aim for reducing fluctuations and differences on the signals, the data contain with sad and happy labels, as a result, it reaches accuracy of 86.2%. Doma et al. [16] compared several performances of machine learning methods on recognition of EEG-based emotions, including support vector machine (SVM), k-nearest neighbor (KNN), linear discriminant analysis (LDA), logistic regression (LR) and decision tree (DT), and as a result, SVM has a better performance with accuracy ranges from 54% to 71%. Ali et al. [17] proposed a combination method contains with wavelet energy, modified energy and wavelet entropy features on detection of emotion for analysis the possibility of ambient assisted living. The labels of emotion are divided into four types as HVHA, HVLA, LVHA and LVLA according to the distribution of valence-arousal model. And in the experiment, three classification methods including quadratic discriminant analysis (QDA), KNN, SVM are applied, and as a result, SVM has a higher performance of the accuracy rate on recognition of the emotion at averagely 83%. Yin et al. [18] proposed a feature selection approach due to the combination of heterogeneous features might on the other hand reduce the accuracy, 440 features are adopted into the feature ranking method as transfer recursive feature elimination (T-RFE), and result shows that, only 10 features are significant for classification of emotions. Murugappan et al. [19] used different classification methods on the feature extraction of EEG as fuzzy C-means (FCM) and fuzzy K-means (FKM), six emotions including: anger, disgust, fear, happy, sad and surprise are labeled in the dataset, and features are selected with energy and entropy, as a result, those methods performed well on the clustering emotions. Li et al. [20] explored the performance of different features on classification of emotions, 18 features of two types including time-frequency domain feature and non-linear dynamical system features are analyzed on different datasets. As a result, Hjorth parameter: mobility, Hjorth parameter: complexity and maximum power spectral frequency performed well in beta band, and the combination of linear features is better compared to non-linear features in each band. Asghar et al. [21] proposed a feature selection approach based on bag of deep features, which can reduce the features of data according to the k-mean clustering, as a result, when the clustering group is 10, the SVM has reached separately 77% and 93% of accuracy on recognition of emotions based on DEAP dataset and SEED dataset, where DEAP dataset contains with EEG signals with self-rating emotion values of valence-arousal domain, and SEED dataset contains with EEG signals with three different emotion labels as “Positive”, “Negative” and “Neutral”. Zhuang et al. [22] proposed a method based on empirical mode decomposition (EMD) to extract the multidimensional information features on Intrinsic Mode Functions (IMFs) for EEG emotion recognition, and result shows that those three features as the first difference of IMF’s times series, the first difference of IMF’s phase and the normalized energy of IMF are proved to be efficient on recognition of EEG-based emotion based on DEAP dataset.
Mainly, multi-channel is applied on EEG-based emotion recognition due to the combination of different channel can outcome great results. However, single channel is more application-oriented which has an affordable price and convenient usage in daily life. Jalilifard et al. [23] conducted an experiment on the classification of emotion based on the recorded signals from FP1 channel with the stimuli of horror and relaxing movies. Three emotions status are observed as neutral, relaxation and fear. And by using the KNN classification method, the result shows that with 46 features, the accuracy has reached averagely 94%. Taran et al. [24] used a correlation analysis and frequency-based filtering method on emotion recognition of happy, fear, sad and relax status from single-channel signals, electrodes of FP1, FP2, F3, F4, F7, F8, T3, T4, T5 and T6 are selected as single-bipolar channel, furtherly, the result shows that the proposed method has an overall accuracy of 90.63%. Wu et al. [25] analyzed the functional connectivity pattern of emotion recognition based on EEG signals and eye movements, also, pointed out that the strength feature is proved to be outperformed than the differential entropy in single channel, as a result, that emotions of happiness, disgust, fear, sadness, and neutrality have detected significant functional connectivity, and the accuracy on DEAP, SEED and SEED-V are separately reached at 86%, 95% and 84%. Wan et al. [26] conducted an experiment that used the single-channel signal to detect major depressive disorder with machine learning methods, the result shows that signals collected from FP1 electrode is outperformed than FP2 electrode in prescreening of major depression disorder, and the Classification and Regression Tree combining with genetic algorithm (CART-GA) has a great performance than other machine learning methods. Song et al. [27] proposed a dynamical graph convolutional neural networks on EEG emotion recognition, by analyzing the intrinsic correlation between different electrodes, discriminative features can be discovered and performed efficiently on emotion recognition task.
Generally, studies based on emotion types are mainly discrete or quantified in valence-arousal domains, for some experiments only recorded the objectively self-rating emotion values instead of emotion labels. Ismail et al. [28] analyzed four emotions as anger, sad, happy and surprise with the characteristic of different frequency bands, and the result shows that anger is associated with right side of brain in theta band, sad is related to right posterior region of brain with delta and theta bands, happy is noticeable in the middle region with alpha band, and surprise is clearly observed in delta and theta bands. Hu et al. [29] analyzed ten positive emotions in EEG signal as: amusement, awe, gratitude, hope, inspiration, interest, joy, love, pride and serenity, cluster analysis is conducted on those ten emotions with three cluster groups as encouragement, playfulness and harmony based on the objective rating of valence, arousal, familiarity and liking. As a result, the playfulness group has reached the highest accuracy of nearly 90%, while encouragement and harmony have separately 84% and 85% of accuracy. Li et al. [30] used KNN to cluster the emotional value of valence-arousal in DEAP dataset as several emotion categories, and analyzed the performance of channel combination with number of 10, 14, 18 and 32. As a result, 32 number of channels has the highest accuracy. Generally, studies of EEG-based emotion recognition mainly analyzed several emotions such as neutral, positive and negative, or happy, sad, anger and etc. [31,32,33,34,35]. Other than the self-conducted experiments to analyze EEG-based emotions, the DEAP and SEED datasets are wildly applied [36,37,38,39,40], SEED datasets have given the exact emotion labels, but the categories of emotions are generally within 5, on the other hand, DEAP dataset uses valence and arousal to quantify the emotion value, and cluster analysis methods are commonly applied to group those coordinate into several emotion labels.
Even though a quantity of studies has proved the accuracy on recognition EEG-based emotion, but generally applied with channel combination strategy, along with feature selection of overall evaluation on the signal [41]. Moreover, the emotion categories that have been recognized based on EEG are quite few and blurry in clustered groups. Therefore, a thorough study based on single channel of recognition on diverse emotion categories can give more insights into this field, and more applications such as healthcare of individuals can be extended.

3. Motivation

Compared with question-answering approach of emotion recognition, EEG-based emotion recognition can be more objective, which can avoid certain occasions where individuals might not be fully comprehended or expressed on how they feel which compromise the recognition accuracy. Therefore, from the physiology signa, more information and features can be analyzed to better interpret the actual emotional status of individual. Once the feelings of individual are truly recognized, applications such as music therapy, healthcare robot, etc. can be more efficiently applied for the healthcare of individual.
Currently the mainstream approaches on recognition of EEG-based emotions conducted an overall evaluation on the signal, however, which might cause the loss of partial features on the signal, therefore, we come up with a hypothesis that brain activities might occur same or similar fluctuation patterns when individuals are experiencing the same or similar emotional status, however, some complex emotions which influenced by external factors such as morality might be insignificant for observation. Therefore, we proposed an EMER model which applied with PFP features on recognizing EEG-based emotions. Moreover, in order to objectively evaluate the emotional status, the emotion quantification analysis (EQA) method is proposed to map emotions on valence-arousal domains.
Firstly, similarity matrixes are obtained which contain with questionnaire and semantics analysis about the correlation between emotions, and the emotional mapping is conducted based on emotional similarity quantification (ESQ) algorithm to obtain the emotion distribution in valence-arousal domains. Secondly, data preprocessing is conducted including emotion quantification and signal decomposition. Then, the criterial rules for recognition multidimensional emotions are discovered for the extraction of PFP features. Lastly, the support vector machine (SVM) is applied to verify the pattern approach for recognition of EEG-based emotions. The procedure of the novel pattern approach is shown at Figure 1.

4. Emotional Quantification Analysis

In this section, the emotional quantification analysis (EQA) method is conducted based on the emotional similarity quantification (ESQ) algorithm which is proposed to analyze the correlation between emotions, in which each emotion is mapped in the valence-arousal domains according to the emotional similarity matrixes including a questionnaire and a lexicon-based semantic analysis about the emotional similarity.

4.1. Emotional Similarity Matrixes

In this section, the emotional similarity matrixes are obtained as the foundation of emotional quantification. Two emotional domains as valence and arousal are selected for further emotion mapping process. Valence represents the negative or positive degree of emotion, and arousal represents the intensity of emotion. According to our previous work [42,43,44], a 21-dimensional emotion wheel is proposed with a lexicon-based semantic analysis method. The 21 emotions are: “Joy”, “Intimacy”, “Trust”, “Confidence”, “Concentration”, “Anxiety”, “Insecurity”, “Fear”, “Surprise”, “Sadness”, “Pain”, “Despair”, “Tired”, “Shame”, “Disgust”, “Anger”, “Passion”, “Gratitude”, “Hope”, and “Relaxation”.
To be more precise and objective on quantifying those emotions, an online questionnaire on the similarity of those 21 emotions is conducted with 151 participants (79 males and 75 females), and 134 of them have obtained the bachelor degree or beyond, aged between 20 and 35, and none of the participants have been majored in any courses that related to psychology. In the questionnaire, we adopted the same procedure as Russell proposed [45] that for each one of the 21 emotions, participant is required to select the most relatable or similar category among eight basic emotions based on their first impression. The eight basic emotion categories are: “Pleasure”, “Excitement”, “Arousal”, “Distress”, “Misery”, “Depression”, “Sleepiness”, and “Contentment”. The questionnaire result of the emotional similarity is shown at Table 1. It can be observed from the Table 1 that 21 emotions have been closely chosen within adjacent categories.
The semantic similarity matrix of those 21 emotions and 8 basic emotion categories is based on the emotional lexicon-based corpus from our previous work, semantic similarity is calculated according to synonym set which labels emotion words as a synonymous set when those words are under the same or similar definition. The similarity value is between 0 and 1.

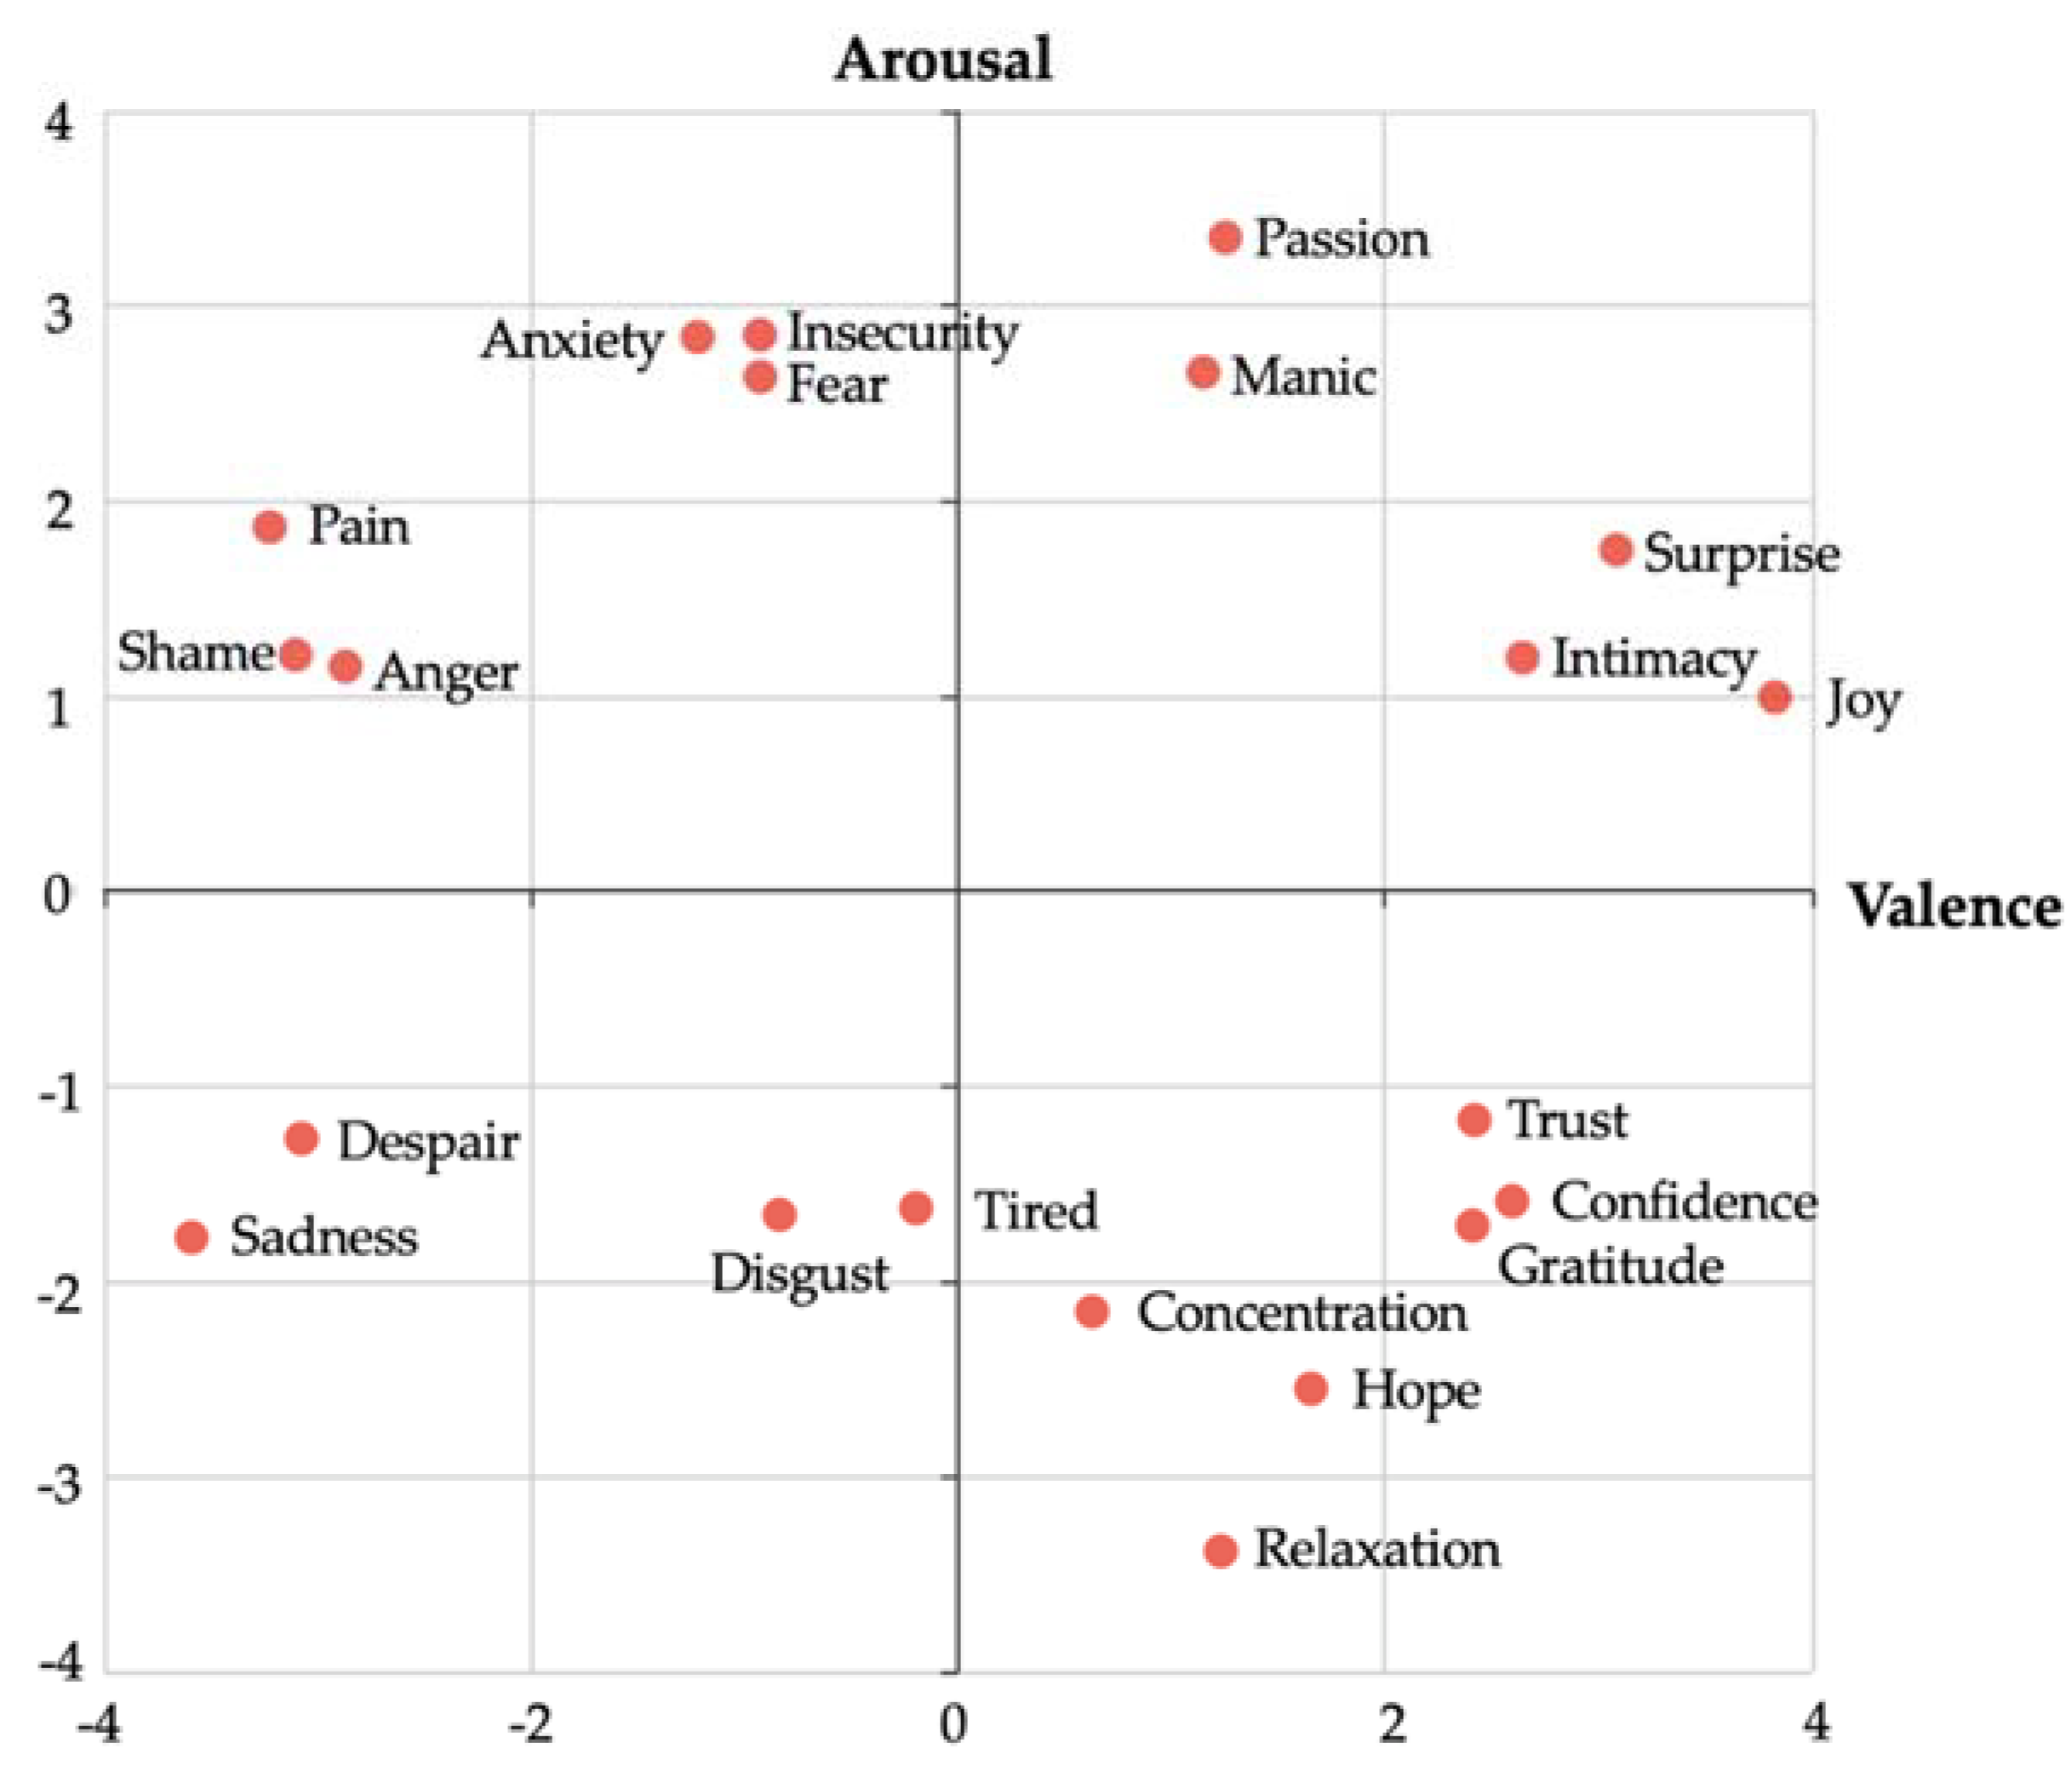
4.2. Emotion Mapping

In this section, the 21 emotions are quantified and mapped into valence-arousal domains based on the similarity matrixes. The parameters that involved in the quantification process are listed in Table 2.
Firstly, the matrixes of questionnaire and semantic similarity as QS and SS are multiplicated to form the final similarity matrix FS according to Equation (1):
F S ( i , j ) = Q S ( i , j ) × S S ( i , j ) ,
where FS(i,j) represents the similarity value of ith emotion in jth categories from the final similarity matrix, QS(i,j) represents the similarity value of ith emotion in jth categories from the questionnaire similarity matrix, and SS(i,j) represents the similarity value of ith emotion in jth categories from the semantic similarity matrix.
Secondly, since the valence-arousal domains is divided into 8 octants based on the basic categories, each emotion is distributed into one of octant area according to the top two maximum values in FS, and the angle of each emotion as Ang in valence-arousal domains is calculated based on the octant angle of most similar category as OA and the similarity ratio of adjacent categories according to Equation (2):
A n g = O A + 45 ( M P 1 M P 2 + 1 ) ,
where MP1 and MP2 are referred to the top two maximum similarity values of emotion of adjacent categories in FS clockwise.
Thirdly, in order to analyze more objective coordinate of emotion in valence-arousal domains, two reference coordinates as RQ(x,y) and RS(x,y) are calculated based on Ang and similarity matrixes of QS and SS according to Equations (3) and (4):
R Q ( x , y ) = ( Q S ( i , j ) , Q S ( i , j ) × tan ( A n g 180 × π ) ) ,
R S ( x , y ) = ( S S ( i , j )   cos ( 45 A n g 180 × π ) × cos ( A n g 180 × π ) , S S ( i , j )   cos ( 45 A n g 180 × π ) × sin ( A n g 180 × π ) ) ,
Finally, the actual coordinate of emotion as AQ(x,y) is calculated based on RQ(x,y) and RS(x,y) according to Equation (5):
A Q ( x , y ) = ( m i n ( R Q ( x ) , R S ( x ) ) + | R Q ( x ) R S ( x ) | 2 , m i n ( R Q ( y ) , R S ( y ) ) + | R Q ( y ) R S ( y ) | 2 ) ,
where function min() is to select the minimum value.
Once the actual coordinate of each emotion is calculated, all 21 emotions can be mapped in the valence-arousal domains, as seen from the Figure 2.

4.3. Emotional Similarity Quantification Algorithm

The emotional similarity quantification (ESQ) algorithm is designed to map the emotion based on similarity matrix, and with a great adaptability to applied it on other emotions, the ESQ algorithm can efficiently map them on the valence-arousal domains. The pseudo code of ESQ is shown at Algorithm 1.
Algorithm 1. ESQ
Input:
QS, SS, OA
Output:
AQS
1:  Begin
2:  FS = new array [length(QS)[0], length(QS)[1]];
3:  OAs = new array[8];
4:  for i = 0, i < length(QS)[0], i++ do
5:   for j = 0, j < length(QS)[1], j ++ do
6:    FS += [QS(i,j) * SS(i,j)];
7:    OAs[j] = j * (360/length(QS)[1]);
8:   end for
9:   MP = [max(FS(i,j))[0], max(FS(i,j))[1]];
10:    OA = OAs[index(max(FS(i,j)))];
11:    Ang = OA + 45/(MP[0]/MP[1] + 1);
12:    RQ(x,y) = (QS(i,j), QS(i,j) * tan(Ang/180 * π);
13:    RS(x) = SS(i,j)/cos((45-Ang)/180 * π) * cos(Ang/180 * π);
14:    RS(y) = SS(i,j)/cos((45-Ang)/180 * π) * sin(Ang/180 * π);
15:    AQ(x, y) = (min(RQ(x), RS(x)) + |RQ(x) − RS(x)|/2, min(RQ(y), RS(y)) + |RQ(y) − RS(y)|/2);
16:    AQS += [AQ(x, y)];
17:  end for

5. EEG-Based Multidimensional Emotion Recognition Model

In this section, the EEG-based multidimensional emotion recognition (EMER) model is proposed based on the PFP features, in which, the significant serial change patterns of amplitude in EEG signal are analyzed and obtained to train for the recognition criteria rules of multidimensional emotions. Instead of analyzing the overall features in each signal, the EEG signal is split into segments where each part contains single or continuous wave crests and wave troughs. Furthermore, the PFP features are extracted based on the criterial rules for the recognition of emotion.

5.1. Data Preprocessing

In this section, the EEG signals are preprocessed for further analysis. Firstly, wavelet transform is applied to obtain the separate frequency bands as: alpha, beta, gamma and theta (DEAP does not contain with delta band). Secondly, the detection technique of wave crest and trough is adopted on each frequency band, amplitude information about the wave crest and trough of each signal are reserved, therefore, signal is split into multiple segments, and each contains one or continuous wave crest or trough. Thirdly, amplitude information on each segment is evaluated according to its amplitude value, 5 evaluation levels are proposed to rank each wave crest and trough from “A” to “E”, where “A” represents the highest level of amplitude value, and accordingly to the other 4 levels. The evaluation levels are depended on the highest absolute amplitude value of each signal, and equally distributed as adding 20% of the amplitude value accordingly to 5 levels. For example, when a signal with highest absolute amplitude value of 1, those wave crests or troughs of which have reached at or above absolute amplitude value of 0.8, will be evaluated as level “A”, and so to other levels, therefore, each segment is transformed into sequence of “A” to “E”. However, in order to discover more significant partial fluctuation patterns of EEG signal on each emotion, denoising is conducted to remove the low amplitude information which remains an abundant amount in the sequences and yet might be insignificant in the classification and compromised to its performance, therefore, each sequence is split into partial fluctuation patterns once “E” occurred, then each partial fluctuation pattern is formed with 4 evaluation level of “A” to “D”. Lastly, the valence and arousal value of each signal is calculated with the coordinate distance to each of 21 emotions, and each signal is signed to emotion label with the minimal distance, also the partial fluctuation patterns within the signal are attached with the same emotion label.

5.2. Recognition Criteria of Multidimensional Emotions

In this section, the criteria rules of recognition on each EEG-based emotion are trained based on association rule learning, the frequent pattern growth (FP-growth) algorithm is conducted to discover the criteria rules of emotions among partial fluctuation patterns. Firstly, each partial fluctuation pattern is calculated with its frequency that appeared in dataset, and for those patterns which have a greater support value than the threshold are reserved. Secondly, reserved patterns are formed as multiple serial sequences, and the frequency of each sequence is calculated, for those which have a greater confidence value than the threshold are reserved as criteria rules, and the confidence is regarded as the intensity value of the rule. Thirdly, the relevance value between each reserved pattern is calculated which refers to the possibility that a former pattern and a latter pattern occurred at the same time. Therefore, for the possibility value is greater than the threshold, and the former one is already existed in the criteria rule set, then those two pattern are combined as a potential rule to the criteria rule set, and the multiplication of the confidence of former one and the possibility value is regarded as the intensity value of the potential rule.
Once all the criteria rules are obtained, clustering is conducted due to some rules have attached with multiple emotion labels. Firstly, for rules only attached with single emotion, are labeled as the “Representative”. Secondly, for rules contained with all emotions, the standard deviation of rule intensity is calculated, if the standard deviation is smaller than the threshold, those rules are labeled as “Common”, which refers to that the rule is commonly occurred among all emotions. Thirdly, for rest of the rules, the emotion distance and standard deviation of those distance values are calculated, if the average distance and standard deviation are smaller than the thresholds, those rules are labeled as “Similar”. And to furtherly refine the “Similar” label, 9 subcategories are designed according to the valence-arousal domains, the definitions of those 9 subcategories are listed at Table 3.

5.3. Extraction of Partial Fluctuation Patterns Features

In this section, partial fluctuation pattern (PFP) features of each EEG signal are analyzed based on the criterial rule set. Due to the partial fluctuation patterns under each signal is existed as single sequence, which only represents a partial change pattern in the signal, however, the criterial rules contain with combination of several sequences. Therefore, the sliding window technique is applied to form the partial fluctuation pattern sequences where the partial fluctuation patterns of each signal are combined orderly. The maximum combination number of partial fluctuation patterns is based on the maximum number of jointed sequences in criteria rule. Once all combinations of partial fluctuation pattern sequences of each signal are obtained, a bidimensional hash searching strategy is conducted to optimize the matching process. And 5 PFP features as: the quantity of PFP, the intensity of PFP, the density of PFP, the repetition rate of PFP, and the polynomial rate of PFP are extracted for further recognition process. The parameters that involved in the calculation of PFP features are listed at Table 4.
The quantity of PFP as MN is referred to the matched number of partial fluctuation pattern sequences among the criterial rules.
The intensity of PFP as Acc is referred to the accumulation of intensity values in matched partial fluctuation pattern sequences, and the calculation is according to Equation (6):
A c c = i = 1 M N I n t i
The density of PFP as Den is referred to the ratio of the MN to the total combined number of partial fluctuation pattern sequences, and the calculation is according to Equation (7):
D e n = 2 × M N ( 2 × I t m M x ) × ( I t m M x + 1 )
The repetition rate of PFP as Rep is referred to the ratio of the number of same matched partial fluctuation pattern sequences to MN, and the calculation is according to Equation (8):
R e p = S m M N
The polynomial rate of PFP Pol is referred to the ratio of the number of matched polynomial partial fluctuation pattern sequences to MN, and the calculation is according to Equation (9):
R o l = j = 2 M x M l j M N

5.4. Partial Fluctuation Pattern Quantification Algorithm

The partial fluctuation pattern quantification (PFPQ) algorithm is applied to discover the criteria rules of recognition of EEG-based emotions. The pseudo code of PFPQ is shown at Algorithm 2.
Algorithm 2. PFPQ
Input:
EEG signals as ES
Output:
Criteria rule for recognition of emotions as RR and PFP features as PFPs
1:  Begin
2:  for c = 0, c < 32, c++ do
3:   Transform ESc with Wavelet transform into 4 bands as WESc;
4:   for i = 0, i < 4, i++ do
5:    Detect wave crest and trough of WESc,i as WCTc,i;
6:    Transform WCTc,i according to the amplitude to A-E as AEc,i;
7:    REc,i = AEc,i.split(“E”);
8:    Build tree structure of REc,i based on frequency as RETreec,i;
9:    Set support threshold as stc,i, confidence threshold as ctc,i;
10:        for k = 0, k < length(RETreec,i), k ++ do
11:    Search sequence on tree structure as seq, and frequency of seq as fseq;
12:    if fseq > stc,i then
13:     RR += [seq, fseq];
14.     Add next tree node to seq as seq-nod, the frequency of seq-nod as fnod;
15:     if fnod > ctc,i then
16:      AR += [seq-nod, fnod];
17:     end if
18:    end if
19:   end for
20:   RR += AR;
21:   srt = new array[9];
22:   for p = 0, p < length(RR), r ++ do
23:    if length (RRp) == 1 then
24:     Label RRp as “Representative” rule;
25:    else do Calculate emotional similarity of RRp as es;
26:     if es matches threshold value in srt then
27:      Label RRp as subcategory of similar rule;
28:     end if
29:    end if
30:  end for
31:  PFPs = new array [];
32:  Joint REc,i as a bidimensional hash set of combined sequences CSS;
33:  for s = 0, s < length(CSS), s++ do
34:   for r = 0, r < length(RR), r++ do
35:    for ss = 0, ss < length(CSS[s]), ss++ do
36:     if CSS[s][ss] == RRr[0] then
37:      MN++;
38:      Acc += RRr[1];
39:      MR[s] += [RRr[0]]
40:      if CSS[s][ss] in MR then
41:       Sm++;
42:      end if
43:     end if
44:    end for
45:   end for
46:  end for
47:  Den = (2*MN)/((2*length(REc,i) − length(CSS)) * (length(REc,i) − length(CSS) + 1));
48:  Rep = Sm/MN;
49:  Pol = (MN-MR[0])/MN;
50:  PFPs = [MN, Acc, Den, Rep, Pol]
51: end for
52: return RR

6. Experiment

In this section, the experiments are based on DEAP dataset [46]. The evaluation of similarity of partial fluctuation patterns is conducted to verify the objective correlation between emotions from the semantic level and physiological level. Meanwhile, the PFP features are extracted into EMER model to evaluate the model performance and feasibility of the novel pattern approach on recognition of emotions, the power spectral density (PSD) feature of EEG signal is also calculated for a comparison experiment. Moreover, the brain activities of multidimensional emotions are analyzed for further correlation analysis on the similarity of emotions.

6.1. Evaluation of Similar Fluctutation Patterns

In this section, the evaluation of similarity of partial fluctuation patterns is conducted to verify the hypothesis that whether semantically similar emotions reveal similar change patterns in signal. As the criteria rules under each emotion have already been clustered into 9 subcategories according to the similarity matrixes with EQA method, the intensity value of those criteria rules which represents the frequency of the partial fluctuation pattern occurred under each emotion, therefore, if the occurrence appeared equally among the emotions that under same subcategory, the existence of similar changes among similar emotion can be verified. The standard deviation of intensity values under each subcategory is calculated, and of which is smaller than the threshold is regarded as commonly occurred patterns under each subcategory, and the similarity proportion of each subcategory is calculated based on the ratio of the number of commonly occurred patterns to the number of criterial rules. The similarity proportion of emotion subcategories are shown at Figure 3.
From Figure 3, it can be observed that all nine groups have the similarity proportion above 92%, which indicates that for those similar emotions, a large quantity of partial fluctuation patterns occurred equally among those emotions. To a certain extent, the proportion can verify the hypothesis that those semantically similar emotions have similar change patterns in EEG signal.

6.2. Evaluation of EMER Model

In this section, the evaluation of EMER model is conducted to verify the pattern approach for recognition of EEG-based multidimensional emotions. An optimized SVM method is applied to evaluate this novel approach. Firstly, the emotional valence and arousal values on DEAP dataset are mapped into emotion labels based on EQA method, and 20 emotions are obtained including: “Anger”, “Anxiety”, “Concentration”, “Confidence”, “Despair”, “Disgust”, “Fear”, “Gratitude”, “Hope”, “Insecurity”, “Intimacy”, “Joy”, “Manic”, “Pain”, “Passion”, “Relaxation”, “Sadness”, “Surprise”, “Tired” and “Trust”, however, emotion “Shame” is not detected from the DEAP dataset. Secondly, the data size of each emotion is balanced, where each emotion contains 250 EEG signals. Thirdly, 5 PFP features of each signal are calculated according to the EMER model. Lastly, a 10-fold cross validation with 80% training set and 20% testing set is conducted on a grid research optimal SVM method. Moreover, PSD feature is calculated for a comparative experiment. The evaluation result on the feature performance can be seen from the Figure 4.
It can be observed from Figure 4a that, by selecting the PFP features, the prediction accuracy is averagely above 90%, the alpha, beta and gamma bands have the average accuracy about 93.5%, however, theta band reveals an unstable prediction performance, but still, the averagely accuracy is about 92.25%, and channel 20 (F4 electrode) of theta band has detected the highest prediction performance of 93.99%. The result indicts that the PFP features can highly distinguish the differentia of those emotions. However, when dealing with single channel recognition task, it can be observed from Figure 4b that the PSD feature of which only reveals the distribution of power over frequency is not efficient enough to performance the recognition task, the maximum accuracy when applied with PSD is only 14%. Instead, the PFP features reserve more information on the partial variation in signal, which is differed from the analysis strategy of overall or average feature of each signal.
Except for the accuracy, other evaluation indexes on the performance of EMER model are also analyzed as F1-score, Precision and Recall which listed at Table 5. It can be observed that EMER model has separately reached 0.9364 of F1-score, 0.9654 of precision and 0.9317 of recall, which has proved its efficiency.
The average prediction accuracy of overall channels and frequency bands on each of emotions is shown at Table 6. It can be observed that the accuracy values of 18 emotions have reached above 90%, and the standard deviation values have revealed that each channel and each frequency band can be efficient on recognizing emotions. The recognition results on “Hope” and “Sadness” might be overfitting due to the original data size of those two emotions are rather a few, however, “Surprise” has the largest data size among 20 emotions of 242 signals are obtained originally, and as a result, the performance on “Surprise” has reached at averagely 96.62%, and the standard deviation is only 2.53.
Furthermore, the prediction accuracy values on each single channel and each frequency band of 20 emotions are shown at Figure 5. It can be observed that most emotions have been accurately predicted with accuracy ranges from 80% to 100% with single channel and single band information. Interestingly, intimacy has the lowest prediction rate at averagely 43%, and manic is remained between 60% and 80%. However, from the confusion matrix of “Intimacy”, all wrongfully predicted data are classified as “Surprise”. The semantically similarity is further analyzed on those emotions, which shows that “Intimacy” and “Surprise” are closely mapped in valence-arousal domains where the distance is only 0.7. As for “Manic”, the confusion matrix also shows that a large part of wrongfully predictions are labeled as “Surprise”, the distance between “Manic” and “Surprise” is 2.1, which larger than the distance of “Intimacy” and “Surprise” but closer than other emotions. It can be assumed that, those emotions such as “Intimacy” and “Manic” might have overlapped in some parts of signal with “Surprise” especially the emotion “Intimacy”.

6.3. Occurrence of Significant Flutuation Patterns

In this section, the brain activities among different emotions is visualized based on the occurrence of significant fluctuation patterns, which referred to the amount of those fluctuation patterns that only detected on single or similar emotions among the criteria rules set. The matched number of “Representative” and nine subcategorized “Similar” rules is calculated along in the EMER model. The occurrence number of those fluctuation patterns can be more objectively on reflexing the area where more significant brain activities are detected when individuals are experiencing different emotions. A normalization process is conducted for some emotions have been detected with over thousand patterns while some might only have detected with a rather insignificant amount. The visualization of the brain activities based on the occurrence of significant pattern fluctuation pattern under each emotion is shown at Figure 6.
From Figure 6, it can be seen that four bands react differently when experiencing different emotions. For example, “Surprise” has detected a significant amount of fluctuation changes in all four frequency bands, especially the right anterior region and left posterior region, the left anterior region is more actively responded in alpha and beta bands. “Intimacy” and “Manic” are also detected high activity in four bands with the similar areas. “Trust” is responded differently in each band, “Gratitude” is extremely inactive both in theta and beta bands. “Hope” is relatively active in gamma band compared to other bands, on the contrary, “Fear” is relatively inactive in gamma band compared to other bands, and “Relaxation” is relatively inactive in theta band compared to other bands.
Some similar emotions groups such as: “Fear”, “Anxiety” and “Insecurity”; “Despair” and “Sadness”; “Surprise” and “Intimacy”; “Confidence” and “Trust” are all observed with the slightly different degree of activity but similar brain area in all four bands.

7. Discussion

The EMER model performed splendidly on recognition of emotions, this novel approach gives an insight on emotion recognition that the partial fluctuation pattern of EEG signal is suitable on interpreting emotions, when experiencing certain emotion, the EEG signals occurred significant change patterns, which can be more directly on recognizing emotional status. And among the 20 emotion categories, each emotion has detected significant and particular change patterns even for those complex emotions, as for some semantically similar emotions which are regarded as partially overlapped in physiological signal, EMER model can still distinguish them correctly based on PFP features. Moreover, the 4 frequency bands as alpha, beta, gamma and theta have proved its efficiency on recognition emotions when applied with PFP features, which reveals the potential of theta and alpha bands on recognizing emotions.
Also, some interesting phenomena are occurred when distinguishing similar emotions. The prediction results of “Intimacy” and “Manic” which indict that: some basic emotions such as “Surprise” might have a greater range of affection on those similar overlapped complex emotions, for example, for “Manic” when it has a farther distance with “Surprise”, the prediction accuracy has increased compared to the prediction accuracy of “Intimacy” which is much closer to “Surprise”. Those complex emotions which are acquired by learning, external factors such as morality might have different influence on individuals when cognizing emotions [47], this theory can be also applied to the result of “Gratitude”, which is semantically similar with “Confidence” and “Trust”, however, inactivity in brain area is observed which is opposite from “Confidence” and “Trust”. Another possibility might be data itself that the distribution of the data size under each emotion is uneven, which causes that some emotions have detected less criterial rules for classifying the differentia among similar emotions. For example, “Surprise” has the largest data size compared to other emotions, 242 signals are obtained originally, therefore, more criterial rules are discovered to generate more significant PFP features, as a result, it has reached an average accuracy of 96.62%. Furthermore, the number of criterial rules for “Manic” and “Intimacy” are relatively lesser than “Surprise”, the significance of those two emotions might not be fully discovered.
Our proposed approach is to discover the relevance on the fluctuation patterns among EEG signals for emotion recognition task in each frequency bands by using single channel information, which is differed from the general strategies which focused on particularly high frequency bands or optimization of channel selection for recognition of EEG-based emotions. Furtherly, the recognition task is extended into 20 different emotion categories, the differentia of those emotions can be successfully distinguished based on the PFP features. Moreover, the semantically similarity among emotions is proved as physiologically similar among similar emotion groups. However, the limitations in differentiation of similar emotions are mainly due to the overlapping issue occurred among complex emotions, which is restricted by the data size of each emotion. Therefore, we will continuously collect more EEG signals by our own in our future work for further analysis. Moreover, the external factors that might have an influence on those complex emotions will be taken into consideration.

8. Conclusions

In this paper, we proposed a novel pattern approach based on PFP features for recognition of EEG-based multidimensional emotions. The EQA method is proposed to quantify the multidimensional emotional statue, questionnaire and semantic analysis about the correlation between emotions are obtained for objectively reflexing on the correlation between emotions. The EMER model is proposed to discover the criterial rules for recognition of multidimensional emotions, furthermore, the PFP features are extracted to classify the differentia of emotions. Lastly, the evaluation is conducted to verify the pattern approach on emotion recognition, also, the correlation between semantically similar emotions are analyzed. As a result, the novel pattern approach has proved its efficiency on recognition task.
The overall prediction accuracy of all emotions on theta, alpha, beta and gamma bands have all reached above 92%, which proved that not only high frequency bands as beta and gamma are better for recognizing emotions, theta and alpha bands have also performed greatly. Moreover, each electrode of 32 channels has reached a rather steady accuracy, at averagely 93.5%, which indicts that the potential of single channel on recognizing different emotions. Particularly, theta band is outperformed unexpectedly when only based on single EEG channel, the accuracy ranges from 89% to 93%, and except for channel 5 (FC5), the rest channels have reached the accuracy above 90% separately.
The recognition accuracy of 18 emotions have averagely reached above 90%, except for “Intimacy” and “Manic”, where the recognition accuracy of “Intimacy” is 43% and 73% for “Manic”. The confusion matrixes of those two emotions show that all wrongfully predicted signals are classified as “Surprise”, moreover, those three emotions are semantically similar from the valence-arousal domains, which might indicates that the complex emotions as “Intimacy” and “Manic” might be overlapped in a certain extent to the basic emotion “Surprise”. Other than those two emotions, our model can classify the rest emotions with a great result.
Semantically similar groups of emotions are proved to appear similar partial fluctuation patterns in the EEG signals. Moreover, for groups such as: “Fear”, “Anxiety” and “Insecurity”; “Despair” and “Sadness”; “Surprise”, “Intimacy” and “Manic”; “Confidence” and “Trust”, similar occurrence pattern of significant fluctuation patterns is observed in similar brain area.
Above all, the EMER model has verified the novel pattern approach for recognition task from EEG signal when based on the PFP features with a high recognition accuracy on each frequency band and each single channel.

Author Contributions

Conceptualization, L.W.; methodology, H.L. and L.W.; software, T.Z. and W.L.; validation, T.Z. and H.L.; formal analysis, T.Z. and H.L.; investigation, L.W. and M.S.; resources, T.Z.; data curation, L.W. and M.S.; writing—original draft preparation, H.L.; writing—review and editing, L.W. and H.L.; visualization, H.L. and W.L.; supervision, T.Z.; funding acquisition, T.Z. and L.W. All authors have read and agreed to the published version of the manuscript.

Funding

This work was supported by the Science and Technology Development Plan of Jilin Province, China (No.20200403039SF).

Informed Consent Statement

Informed consent was obtained from all subjects involved in the study. Written informed consent has been obtained from patients to publish this paper.

Data Availability Statement

Publicly available dataset was analyzed in this study. This data can be found here: [http://www.eecs.qmul.ac.uk/mmv/datasets/deap/].

Conflicts of Interest

The authors declare no conflict of interest.

References

  1. Cabanac, M. What is emotion? Behav. Process. 2002, 60, 69–83. [Google Scholar] [CrossRef]
  2. Goshvarpour, A.; Abbasi, A.; Goshvarpour, A. An accurate emotion recognition system using ECG and GSR signals and matching pursuit method. Biomed. J. 2017, 40, 355–368. [Google Scholar] [CrossRef] [PubMed]
  3. Abtahi, F.; Ro, T.; Li, W.; Zhu, Z. Emotion analysis using audio/video, EMG and EEG: A dataset and comparison study. In Proceedings of the IEEE Winter Conference on Applications of Computer Vision (WACV 2018), Lake Tahoe, NV, USA, 12–15 March 2018; pp. 10–19. [Google Scholar]
  4. Udovičić, G.; Ðerek, J.; Russo, M.; Sikora, M. Wearable emotion recognition system based on GSR and PPG signals. In Proceedings of the 2nd International Workshop on Multimedia for Personal Health and Health Care, Mountain View, CA, USA, 23 October 2017; pp. 53–59. [Google Scholar]
  5. Oude Bos, D. EEG-based emotion recognition. The Influence of Visual and Auditory Stimuli. Capita Sel. (MSc Course) 2006, 56, 1–17. [Google Scholar]
  6. Ekman, P.; Levenson, R.W.; Friesen, W.V. Autonomic nervous system activity distinguishes among emotions. Science 1983, 221, 1208–1210. [Google Scholar] [CrossRef] [PubMed] [Green Version]
  7. Lövheim, H. A new three-dimensional model for emotions and monoamine neurotransmitters. Med. Hypotheses 2012, 78, 341–348. [Google Scholar] [CrossRef] [PubMed]
  8. Kringelbach, M.L.; O’Doherty, J.; Rolls, E.T.; Andrews, C. Activation of the human orbitofrontal cortex to a liquid food stimulus is correlated with its subjective pleasantness. Cereb. Cortex 2003, 13, 1064–1071. [Google Scholar] [CrossRef] [PubMed]
  9. Harmon-Jones, E.; Vaughn-Scott, K.; Mohr, S.; Sigelman, J.; Harmon-Jones, C. The effect of manipulated sympathy and anger on left and right frontal cortical activity. Emotion 2004, 4, 95. [Google Scholar] [CrossRef] [PubMed]
  10. Kalin, N.H.; Larson, C.; Shelton, S.E.; Davidson, R.J. Asymmetric frontal brain activity, cortisol, and behavior associated with fearful temperament in rhesus monkeys. Behav. Neurosci. 1998, 112, 286. [Google Scholar] [CrossRef] [PubMed]
  11. Kirmizi-Alsan, E.; Bayraktaroglu, Z.; Gurvit, H.; Keskin, Y.H.; Emre, M.; Demiralp, T. Comparative analysis of event-related potentials during Go/NoGo and CPT: Decomposition of electrophysiological markers of response inhibition and sustained attention. Brain Res. 2006, 1104, 114–128. [Google Scholar] [CrossRef] [PubMed]
  12. Yang, K.; Tong, L.; Shu, J.; Zhuang, N.; Yan, B.; Zeng, Y. High Gamma Band EEG Closely Related to Emotion: Evidence From Functional Network. Front. Hum. Neurosci. 2020, 14. [Google Scholar] [CrossRef] [PubMed]
  13. Plutchik, R. The nature of emotions: Human emotions have deep evolutionary roots, a fact that may explain their complexity and provide tools for clinical practice. Am. Sci. 2001, 89, 344–350. [Google Scholar] [CrossRef]
  14. Osgood, C.E.; Suci, G.J.; Tannenbaum, P.H. The Measurement of Meaning; University of Illinois Press: Champaign, IL, USA, 1957. [Google Scholar]
  15. Chen, J.; Jiang, D.; Zhang, Y. A common spatial pattern and wavelet packet decomposition combined method for EEG-based emotion recognition. J. Adv. Comput. Intell. Intell. Inform. 2019, 23, 274–281. [Google Scholar] [CrossRef]
  16. Doma, V.; Pirouz, M. A comparative analysis of machine learning methods for emotion recognition using EEG and peripheral physiological signals. J. Big Data 2020, 7, 1–21. [Google Scholar] [CrossRef] [Green Version]
  17. Ali, M.; Mosa, A.H.; Al Machot, F.; Kyamakya, K. EEG-based emotion recognition approach for e-healthcare applications. In Proceedings of the 8th International Conference on Ubiquitous and Future Networks (ICUFN 2016), Vienna, Austria, 5–8 July 2016; pp. 946–950. [Google Scholar]
  18. Yin, Z.; Wang, Y.; Liu, L.; Zhang, W.; Zhang, J. Cross-subject EEG feature selection for emotion recognition using transfer recursive feature elimination. Front. Neurorobotics 2017, 11, 19. [Google Scholar] [CrossRef] [PubMed] [Green Version]
  19. Murugappan, M.; Rizon, M.; Nagarajan, R.; Yaacob, S.; Zunaidi, I.; Hazry, D. EEG feature extraction for classifying emotions using FCM and FKM. Int. J. Comput. Commun. 2007, 1, 21–25. [Google Scholar]
  20. Li, X.; Song, D.; Zhang, P.; Zhang, Y.; Hou, Y.; Hu, B. Exploring EEG features in cross-subject emotion recognition. Front. Neurosci. 2018, 12, 162. [Google Scholar] [CrossRef] [Green Version]
  21. Asghar, M.A.; Khan, M.J.; Amin, Y.; Rizwan, M.; Rahman, M.; Badnava, S.; Mirjavadi, S.S. EEG-based multi-modal emotion recognition using bag of deep features: An optimal feature selection approach. Sensors 2019, 19, 5218. [Google Scholar] [CrossRef] [Green Version]
  22. Zhuang, N.; Zeng, Y.; Tong, L.; Zhang, C.; Zhang, H.; Yan, B. Emotion recognition from EEG signals using multidimensional information in EMD domain. BioMed Res. Int. 2017, 2017. [Google Scholar] [CrossRef]
  23. Jalilifard, A.; Rastegarnia, A.; Birgante Pizzolato, E.; Md Kafiul, I. Classification of emotions induced by horror and relaxing movies using single-channel EEG recordings. Int. J. Electr. Comput. Eng. 2020, 10, 3826–3838. [Google Scholar] [CrossRef]
  24. Taran, S.; Bajaj, V. Emotion recognition from single-channel EEG signals using a two-stage correlation and instantaneous frequency-based filtering method. Comput. Methods Programs Biomed. 2019, 173, 157–165. [Google Scholar] [CrossRef]
  25. Wu, X.; Zheng, W.-L.; Lu, B.-L. Investigating EEG-Based Functional Connectivity Patterns for Multimodal Emotion Recognition. arXiv 2020, arXiv:2004.01973. [Google Scholar]
  26. Wan, Z.; Zhang, H.; Huang, J.; Zhou, H.; Yang, J.; Zhong, N. Single-channel EEG-based machine learning method for prescreening major depressive disorder. Int. J. Inf. Technol. Decis. Mak. 2019, 18, 1579–1603. [Google Scholar] [CrossRef]
  27. Song, T.; Zheng, W.; Song, P.; Cui, Z. EEG emotion recognition using dynamical graph convolutional neural networks. IEEE Trans. Affect. Comput. 2018, 11, 532–541. [Google Scholar] [CrossRef] [Green Version]
  28. Ismail, W.W.; Hanif, M.; Mohamed, S.; Hamzah, N.; Rizman, Z.I. Human emotion detection via brain waves study by using electroencephalogram (EEG). Int. J. Adv. Sci. Eng. Inf. Technol. 2016, 6, 1005–1011. [Google Scholar] [CrossRef] [Green Version]
  29. Hu, X.; Yu, J.; Song, M.; Yu, C.; Wang, F.; Sun, P.; Wang, D.; Zhang, D. EEG correlates of ten positive emotions. Front. Hum. Neurosci. 2017, 11, 26. [Google Scholar] [CrossRef] [Green Version]
  30. Li, M.; Xu, H.; Liu, X.; Lu, S. Emotion recognition from multichannel EEG signals using K-nearest neighbor classification. Technol. Health Care 2018, 26, 509–519. [Google Scholar] [CrossRef]
  31. Wei, C.; Chen, L.-l.; Song, Z.-z.; Lou, X.-g.; Li, D.-d. EEG-based emotion recognition using simple recurrent units network and ensemble learning. Biomed. Signal Process. Control 2020, 58, 101756. [Google Scholar] [CrossRef]
  32. Zheng, W.-L.; Zhu, J.-Y.; Lu, B.-L. Identifying stable patterns over time for emotion recognition from EEG. IEEE Trans. Affect. Comput. 2017, 10, 417–429. [Google Scholar] [CrossRef] [Green Version]
  33. Jatupaiboon, N.; Pan-ngum, S.; Israsena, P. Real-time EEG-based happiness detection system. Sci. World J. 2013, 2013. [Google Scholar] [CrossRef]
  34. Lin, Y.-P.; Wang, C.-H.; Jung, T.-P.; Wu, T.-L.; Jeng, S.-K.; Duann, J.-R.; Chen, J.-H. EEG-based emotion recognition in music listening. IEEE Trans. Biomed. Eng. 2010, 57, 1798–1806. [Google Scholar]
  35. Balasubramanian, G.; Kanagasabai, A.; Mohan, J.; Seshadri, N.G. Music induced emotion using wavelet packet decomposition—An EEG study. Biomed. Signal Process. Control 2018, 42, 115–128. [Google Scholar] [CrossRef]
  36. Al Machot, F.; Elmachot, A.; Ali, M.; Al Machot, E.; Kyamakya, K. A deep-learning model for subject-independent human emotion recognition using electrodermal activity sensors. Sensors 2019, 19, 1659. [Google Scholar] [CrossRef] [PubMed] [Green Version]
  37. Li, Y.; Huang, J.; Zhou, H.; Zhong, N. Human emotion recognition with electroencephalographic multidimensional features by hybrid deep neural networks. Appl. Sci. 2017, 7, 1060. [Google Scholar] [CrossRef] [Green Version]
  38. Cimtay, Y.; Ekmekcioglu, E. Investigating the use of pretrained convolutional neural network on cross-subject and cross-dataset EEG emotion recognition. Sensors 2020, 20, 2034. [Google Scholar] [CrossRef] [PubMed] [Green Version]
  39. Lee, M.S.; Lee, Y.K.; Pae, D.S.; Lim, M.T.; Kim, D.W.; Kang, T.K. Fast Emotion Recognition Based on Single Pulse PPG Signal with Convolutional Neural Network. Appl. Sci. 2019, 9, 3355. [Google Scholar] [CrossRef] [Green Version]
  40. Torres, E.P.; Torres, E.A.; Hernández-Álvarez, M.; Yoo, S.G. EEG-Based BCI Emotion Recognition: A Survey. Sensors 2020, 20, 5083. [Google Scholar] [CrossRef]
  41. Al-Nafjan, A.; Hosny, M.; Al-Ohali, Y.; Al-Wabil, A. Review and classification of emotion recognition based on EEG brain-computer interface system research: A systematic review. Appl. Sci. 2017, 7, 1239. [Google Scholar] [CrossRef] [Green Version]
  42. Wang, L.; Liu, H.; Zhou, T. A Sequential Emotion Approach for Diagnosing Mental Disorder on Social Media. Appl. Sci. 2020, 10, 1647. [Google Scholar] [CrossRef] [Green Version]
  43. Zhou, T.H.; Hu, G.L.; Wang, L. Psychological disorder identifying method based on emotion perception over social networks. Int. J. Environ. Res. Public Health 2019, 16, 953. [Google Scholar] [CrossRef] [Green Version]
  44. Wang, L.; Hu, G.; Zhou, T. Semantic analysis of learners’ emotional tendencies on online MOOC education. Sustainability 2018, 10, 1921. [Google Scholar] [CrossRef] [Green Version]
  45. Russell, J.A. A circumplex model of affect. J. Personal. Soc. Psychol. 1980, 39, 1161. [Google Scholar] [CrossRef]
  46. Koelstra, S.; Muhl, C.; Soleymani, M.; Lee, J.-S.; Yazdani, A.; Ebrahimi, T.; Pun, T.; Nijholt, A.; Patras, I. Deap: A database for emotion analysis; using physiological signals. IEEE Trans. Affect. Comput. 2011, 3, 18–31. [Google Scholar] [CrossRef] [Green Version]
  47. Burnett, S.; Bird, G.; Moll, J.; Frith, C.; Blakemore, S.-J. Development during adolescence of the neural processing of social emotion. J. Cogn. Neurosci. 2009, 21, 1736–1750. [Google Scholar] [CrossRef] [PubMed] [Green Version]
Figure 1. The Novel Pattern Approach for Recognition of EEG-based Emotion.
Applsci 11 01338 g001
Figure 2. Emotion Mapping in Valence-Arousal Domains.
Applsci 11 01338 g002
Figure 3. Similarity Proportion of Emotion Subcategories.
Applsci 11 01338 g003
Figure 4. Evaluation on Feature Performance. (a) Performance on PFP Features; (b) Performance on PSD Feature.
Applsci 11 01338 g004
Figure 5. Prediction Accuracy of 20 Emotions on Single Channel and Single Frequency Band.
Applsci 11 01338 g005
Figure 6. 2D Scalp Map of Brain Activities.
Applsci 11 01338 g006
Table 1. Questionnaire Result of Emotional Similarity.
EmotionCategory
PleasureExcitementArousalDistressMiseryDepressionSleepinessContentment
Joy87407////17
Intimacy47638//1230
Trust526112/683
Confidence33822221/83
Concentration119202236539
Anxiety3344471440//
Insecurity265640123311
Fear26733424111/
Surprise427232112/1
Sadness2111255782/
Pain1136942323/
Despair1/13357572/
Tired2119236100/
Shame3355258273/
Disgust223182261421
Anger2224495221/1
Manic764539710/1
Passion76468331/5
Gratitude3752/1/3103
Hope267172//3168
Relaxation3361//15060
Table 2. Parameters in Emotion Mapping Process.
ParameterDefinition
FSThe final similarity matrix.
QSThe questionnaire similarity matrix.
SSThe semantic similarity matrix.
MPjThe top jth similarity value.
AngThe angle of emotion in valence-arousal domains
OAThe angle of basic emotion category in valence-arousal domains.
RQ(x,y)Reference coordinate based on QS.
RS(x,y)Reference coordinate based on SS.
AQ(x,y)The actual coordinate of emotion in valence-arousal domains.
Table 3. Subcategories of “Similar” Rules.
SubcategoryDefinition
HAEmotions clustered in the first and second quadrant
LAEmotions clustered in the third and fourth quadrant
HVEmotions clustered in the first and fourth quadrant
LVEmotions clustered in the second and third quadrant
HVHAEmotions clustered in the first quadrant
HVLAEmotions clustered in the second quadrant
LVLAEmotions clustered in the third quadrant
LVHAEmotions clustered in the fourth quadrant
SimilarityEmotions clustered in one quadrant with close distance
Table 4. Parameters in Calculation of PFP Features.
ParameterDefinition
MNThe matched number of PFP sequences.
AccThe accumulation of intensity values in matched PFP sequences.
DenThe ratio of the MN to the number of PFP sequences.
RepThe repetitive rate of the same matched rules.
PolThe occurred rate of matched polynomial rules.
IntiIntensity value of ith matched PFP sequence.
ItmThe number of PFP in signal.
MxThe maximum length in criterial rule.
SmThe number of same matched PFP sequences.
MljThe number of matched PFP sequences with combination length of j.
Table 5. Overall Performance of EMER Model.
F1-ScorePrecisionRecall
0.93640.96540.9317
Table 6. The Average Performance on Recognition of 20 Emotions.
EmotionAccuracyStandard Deviation
Anger99.77%1.20
Anxiety96.56%3.96
Concentration90.20%6.03
Confidence99.31%1.91
Despair99.96%0.44
Disgust95.99%4.05
Fear85.48%5.95
Gratitude99.86%1.58
Hope100.00%0
Insecurity99.77%1.33
Intimacy43.45%5.81
Joy95.18%4.10
Manic73.39%6.38
Pain99.70%1.19
Passion93.24%5.08
Relaxation99.15%3.07
Sadness100.00%0
Surprise96.62%2.53
Tired99.55%1.56
Trust92.09%4.99
Anger99.77%1.20
Publisher’s Note: MDPI stays neutral with regard to jurisdictional claims in published maps and institutional affiliations.

