
Development of a Maintenance and Spare Parts Distribution Model for Increasing Aircraft Efficiency


Abstract
:Featured Application
Abstract
1. Introduction
- United States airlines spend 9 billion dollars, approximately 11% of their operating costs, on maintenance;
- The military sector has even higher concern for the maintenance cost that accounts for about 30% of the life cycle cost of weapon system. In 1987/88 the Royal Air Force spent around 1.9 billion pounds on the maintenance of aircraft and equipment.
- The Boeing 777 Airplane has been designed for a useful life of 20 years. This involves defining what minimum scheduled and unscheduled maintenance must be performed in order to continue flying. Scheduled maintenance is performed at certain intervals based on the number of flight hours and, cycles. It consists primarily of inspections followed by maintenance, corrosion prevention, etc. Unscheduled maintenance is performed after a failure occurs. Depending on the nature of the failure, maintenance is accomplished either before the airplane is returned to revenue service or within a specified interval.
- The relationship between how often the fleet of airplanes meet scheduled take-off-time versus cost reductions are key parameters for decision-making, knowing that the delivery reliability of take-off-time is 97.8% for initial delivery and 98.8% for fleet maturity.
- Critical components of the airplane present double or triple redundancy.
- When the total cost is considered over the life cycle, it is evident that the operating and support costs of the airplane will eventually exceed the initial acquisition cost. For Boeing to make the airplane attractive to airlines, engineers must include maintenance cost savings in the design. Increased reliability means fewer failures to repair and an increased maintainability means shorter maintenance times.
2. Materials and Methods
2.1. Materials
2.2. Methods
2.2.1. Phases of the Life Cycle
- The decision regarding a new investment is followed by a rough planning phase of the plant with its basic parameters, followed by a detailed planning, construction, and engineering phase.
- Construction and commissioning of the production plant.
- After handing over the system to the operator, the longest life cycle phase starts.
- During the operational phase, the conditions of use, the operating regime, and maintenance interventions determine the condition of a technical system. Operating conditions influence, for example, the rate of aging and corrosion.
- At the end of the operational phase, possibilities for modernizationare technically exhausted or the ongoing maintenance costs exceed those of a new purchase and the decision is made to separate the system and dismantle it. Here, maintenance can determine the cause–effect relationship in the operating and failure behavior of the old system and document this as an experience for a new system.
- Conceptual development: Needs and risks are identified. Logistics and maintenance support are established. Mission details and lifecycle duration are evaluated.
- Validation: Large-scale development is ensured considering costs, actions, supports, and planning.
- The maintenance program, reliability determination, validation procedures, and preparation of data collection plans are prepared.
- Production: In this third phase the system is manufactured, examined, and shipped. Production is monitored, and process controls are established.
- Operation: This is the most crucial phase where it is demonstrated whether the system iscost-effective in terms of logistical support, maintenance, and operation.
2.2.2. Maintenance and Spare Parts Management
- Item A: High priority items. They are in high demand and waiting times are minimized to acquire them.
- Item B: Items of medium priority. They are used regularly and require standardized care.
- Item C: These are low priority items. Simple but safe controls are enough to meet the demand.
2.2.3. Distribution Network Design and Management
- New design or re-design.
- Structure-oriented, i.e., based on the choice and quantity of locations; or resource-oriented, i.e., based on when the production, warehouse or transport capacities change.
- Static or a dynamic design.
- Cost efficiency vs. responsiveness.
- Centralized vs. decentralized.
- “Push” vs. “pull”.
3. Conceptual Model Design
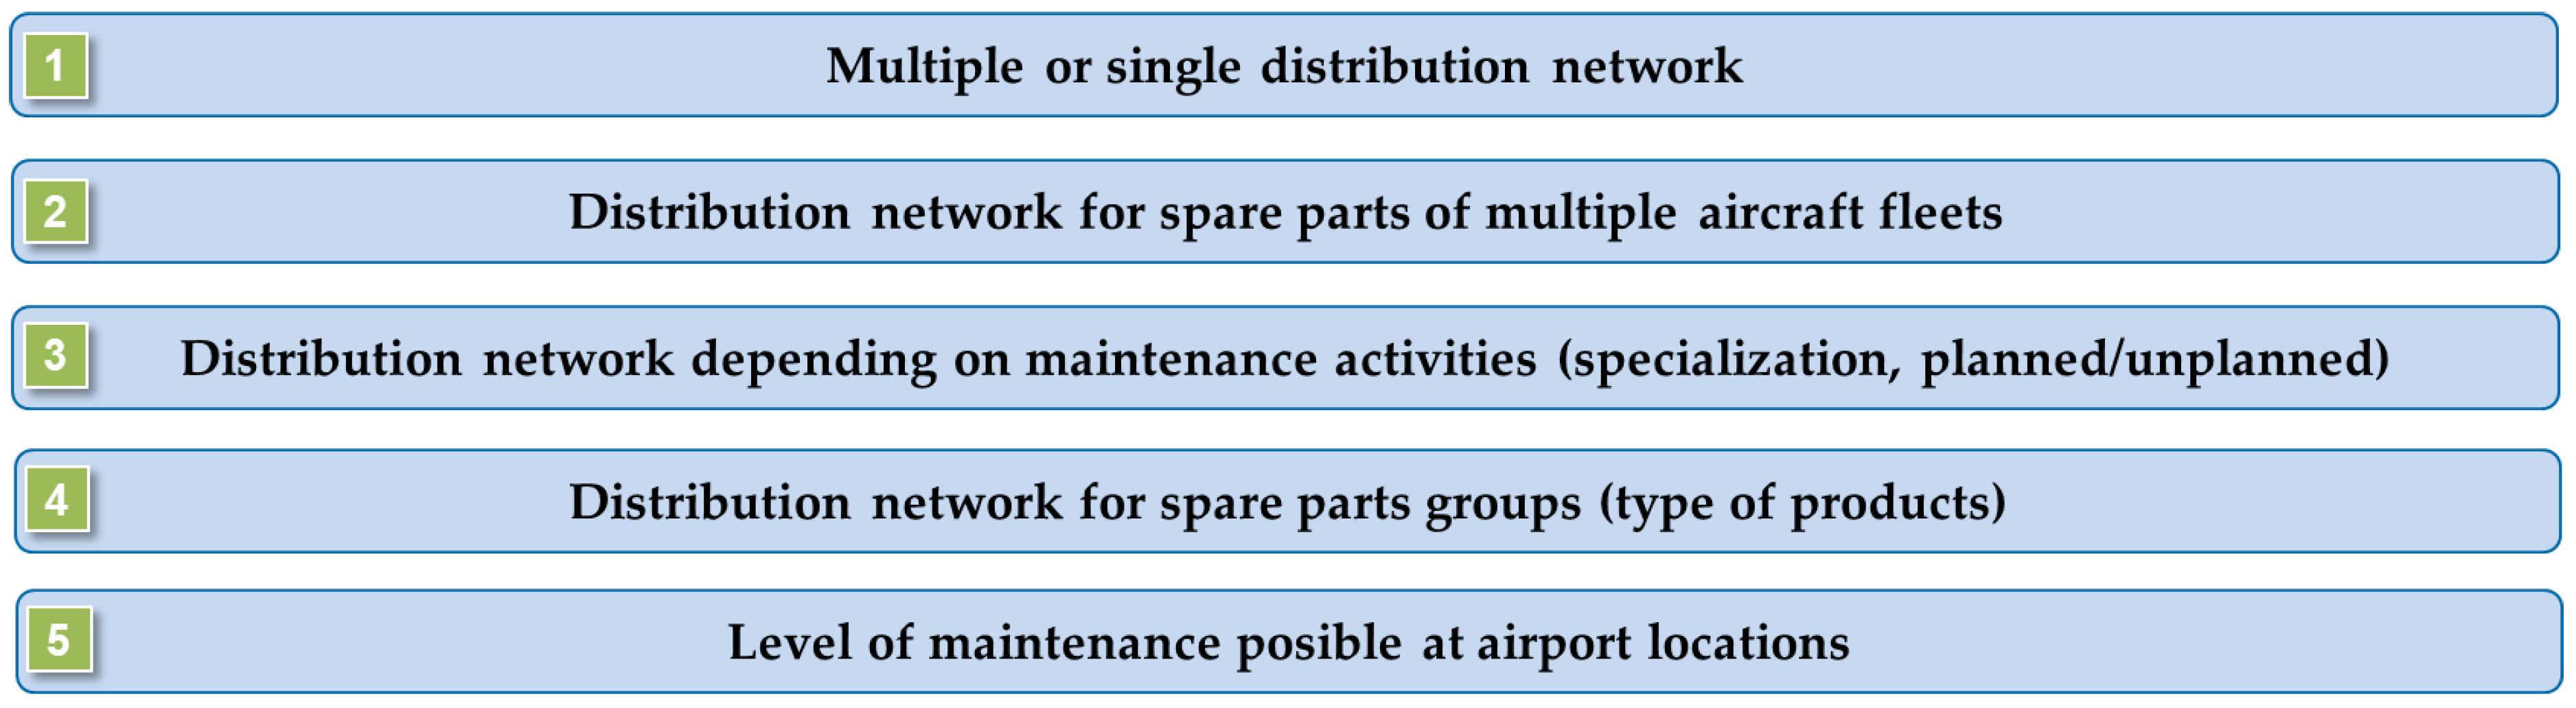
3.1. Target System
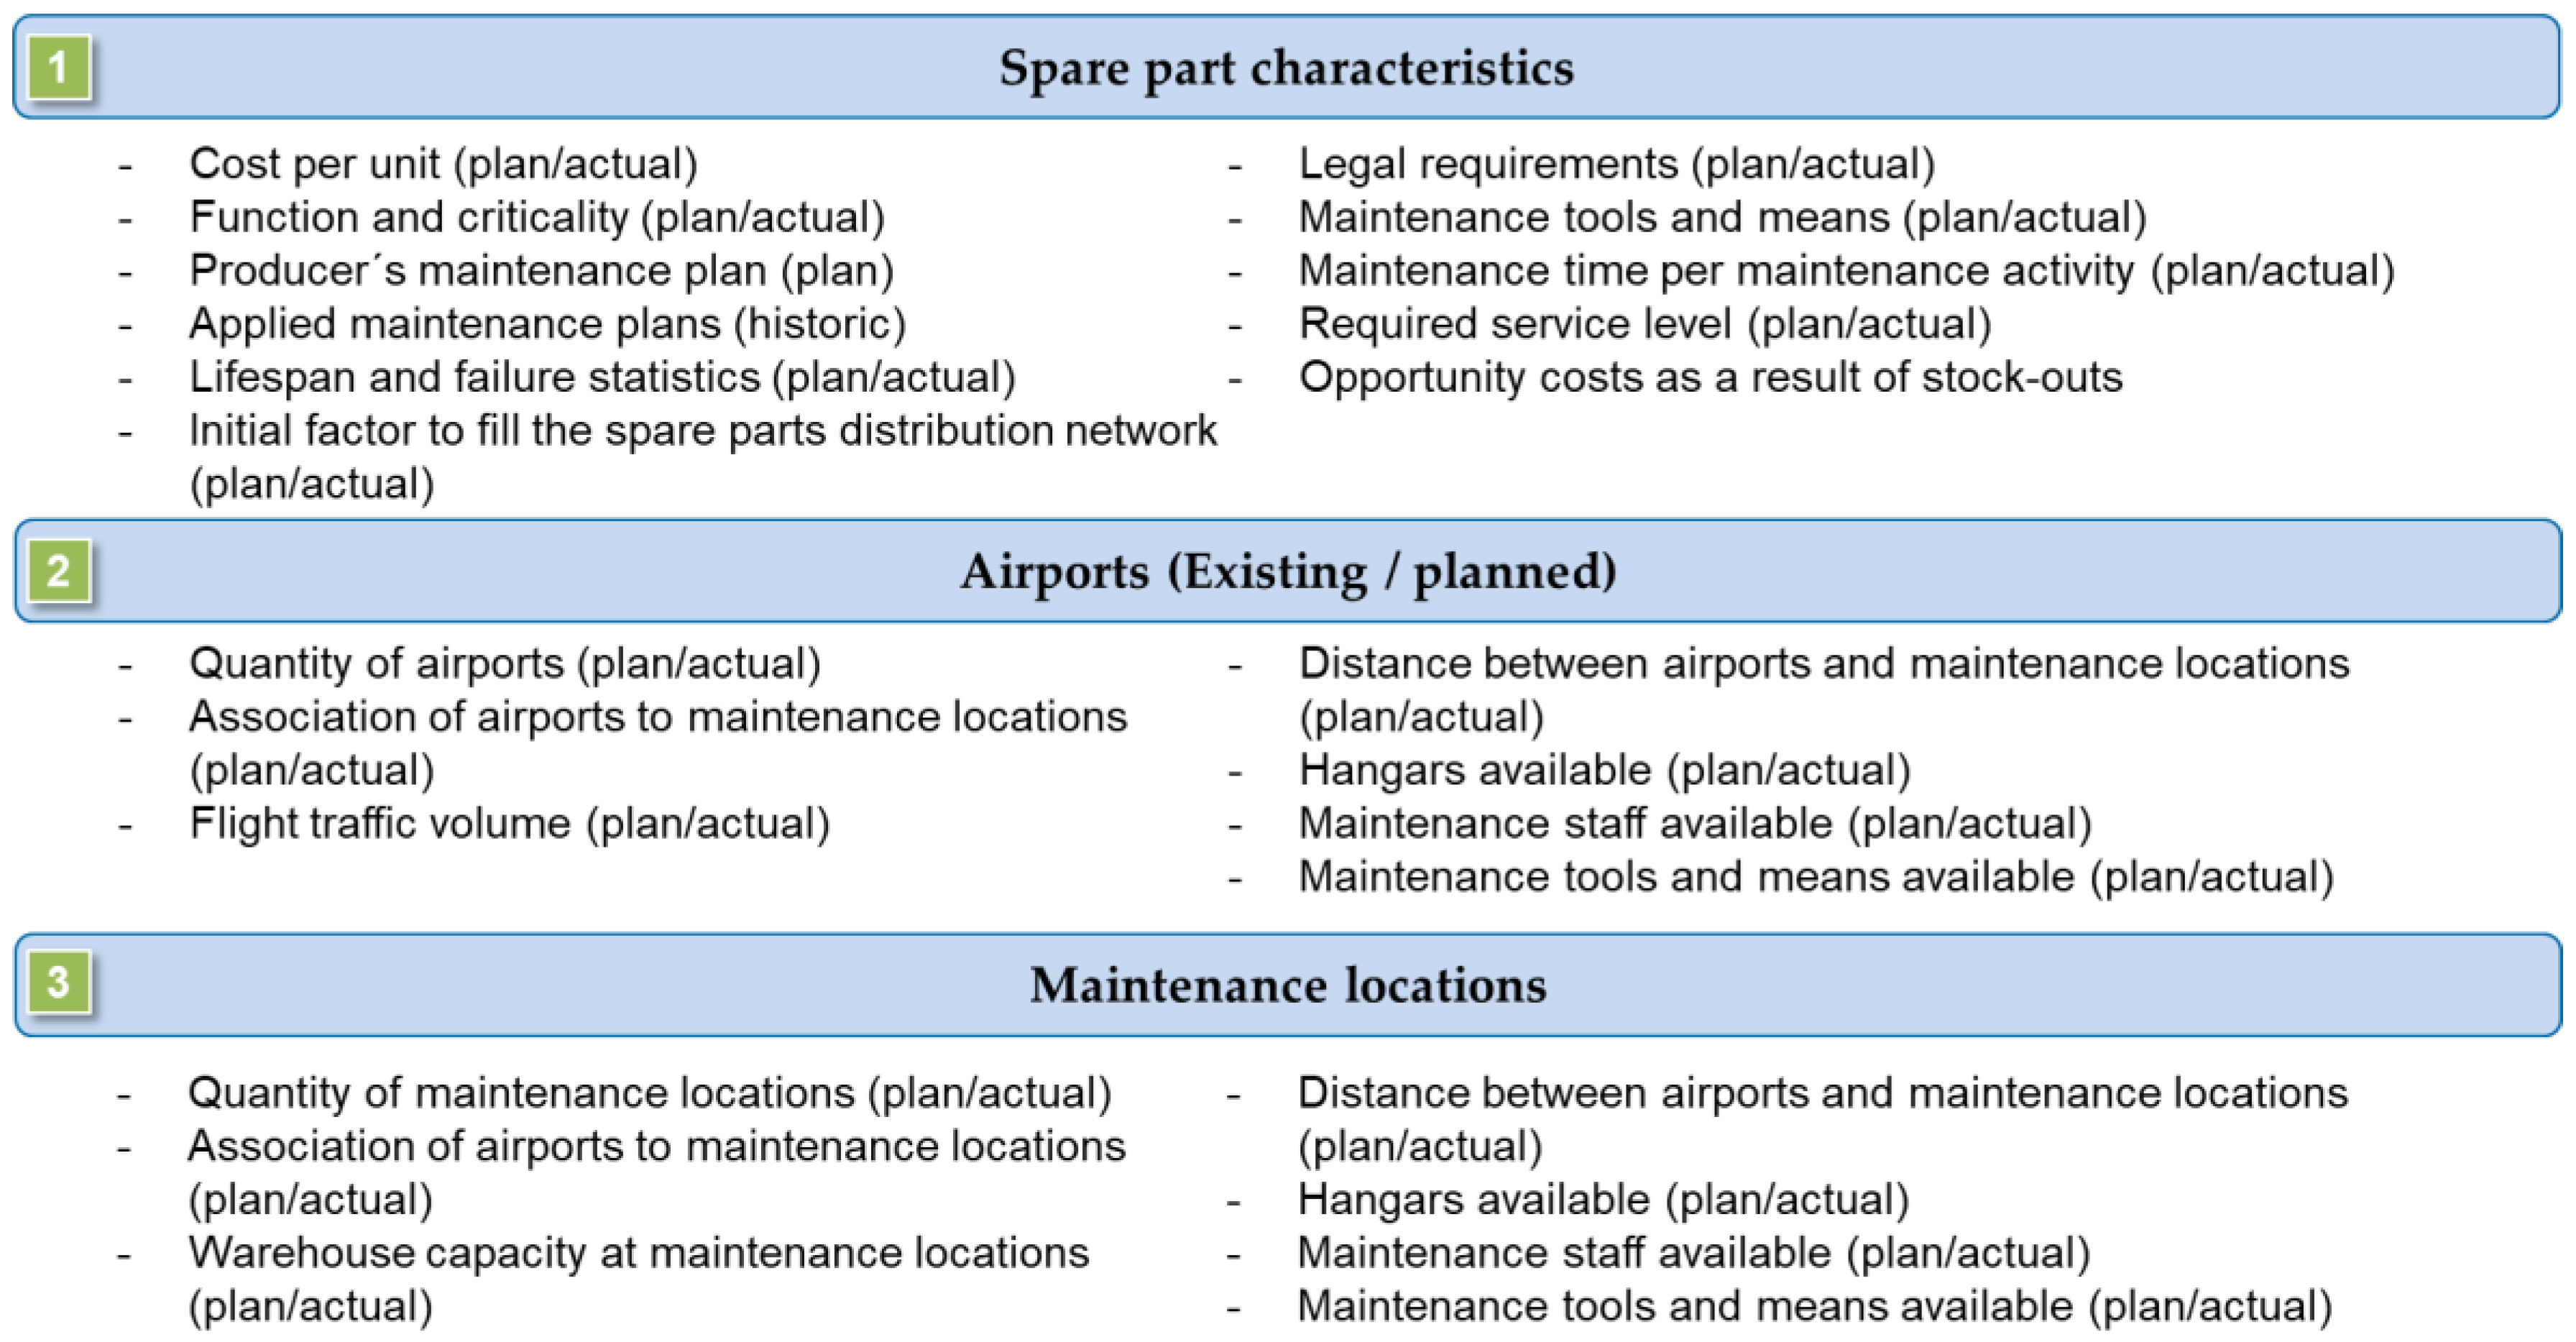
3.2. Model Elements
3.3. Model Development and Methodology
4. Simulation Model Results
4.1. System Dynamics Model Definition
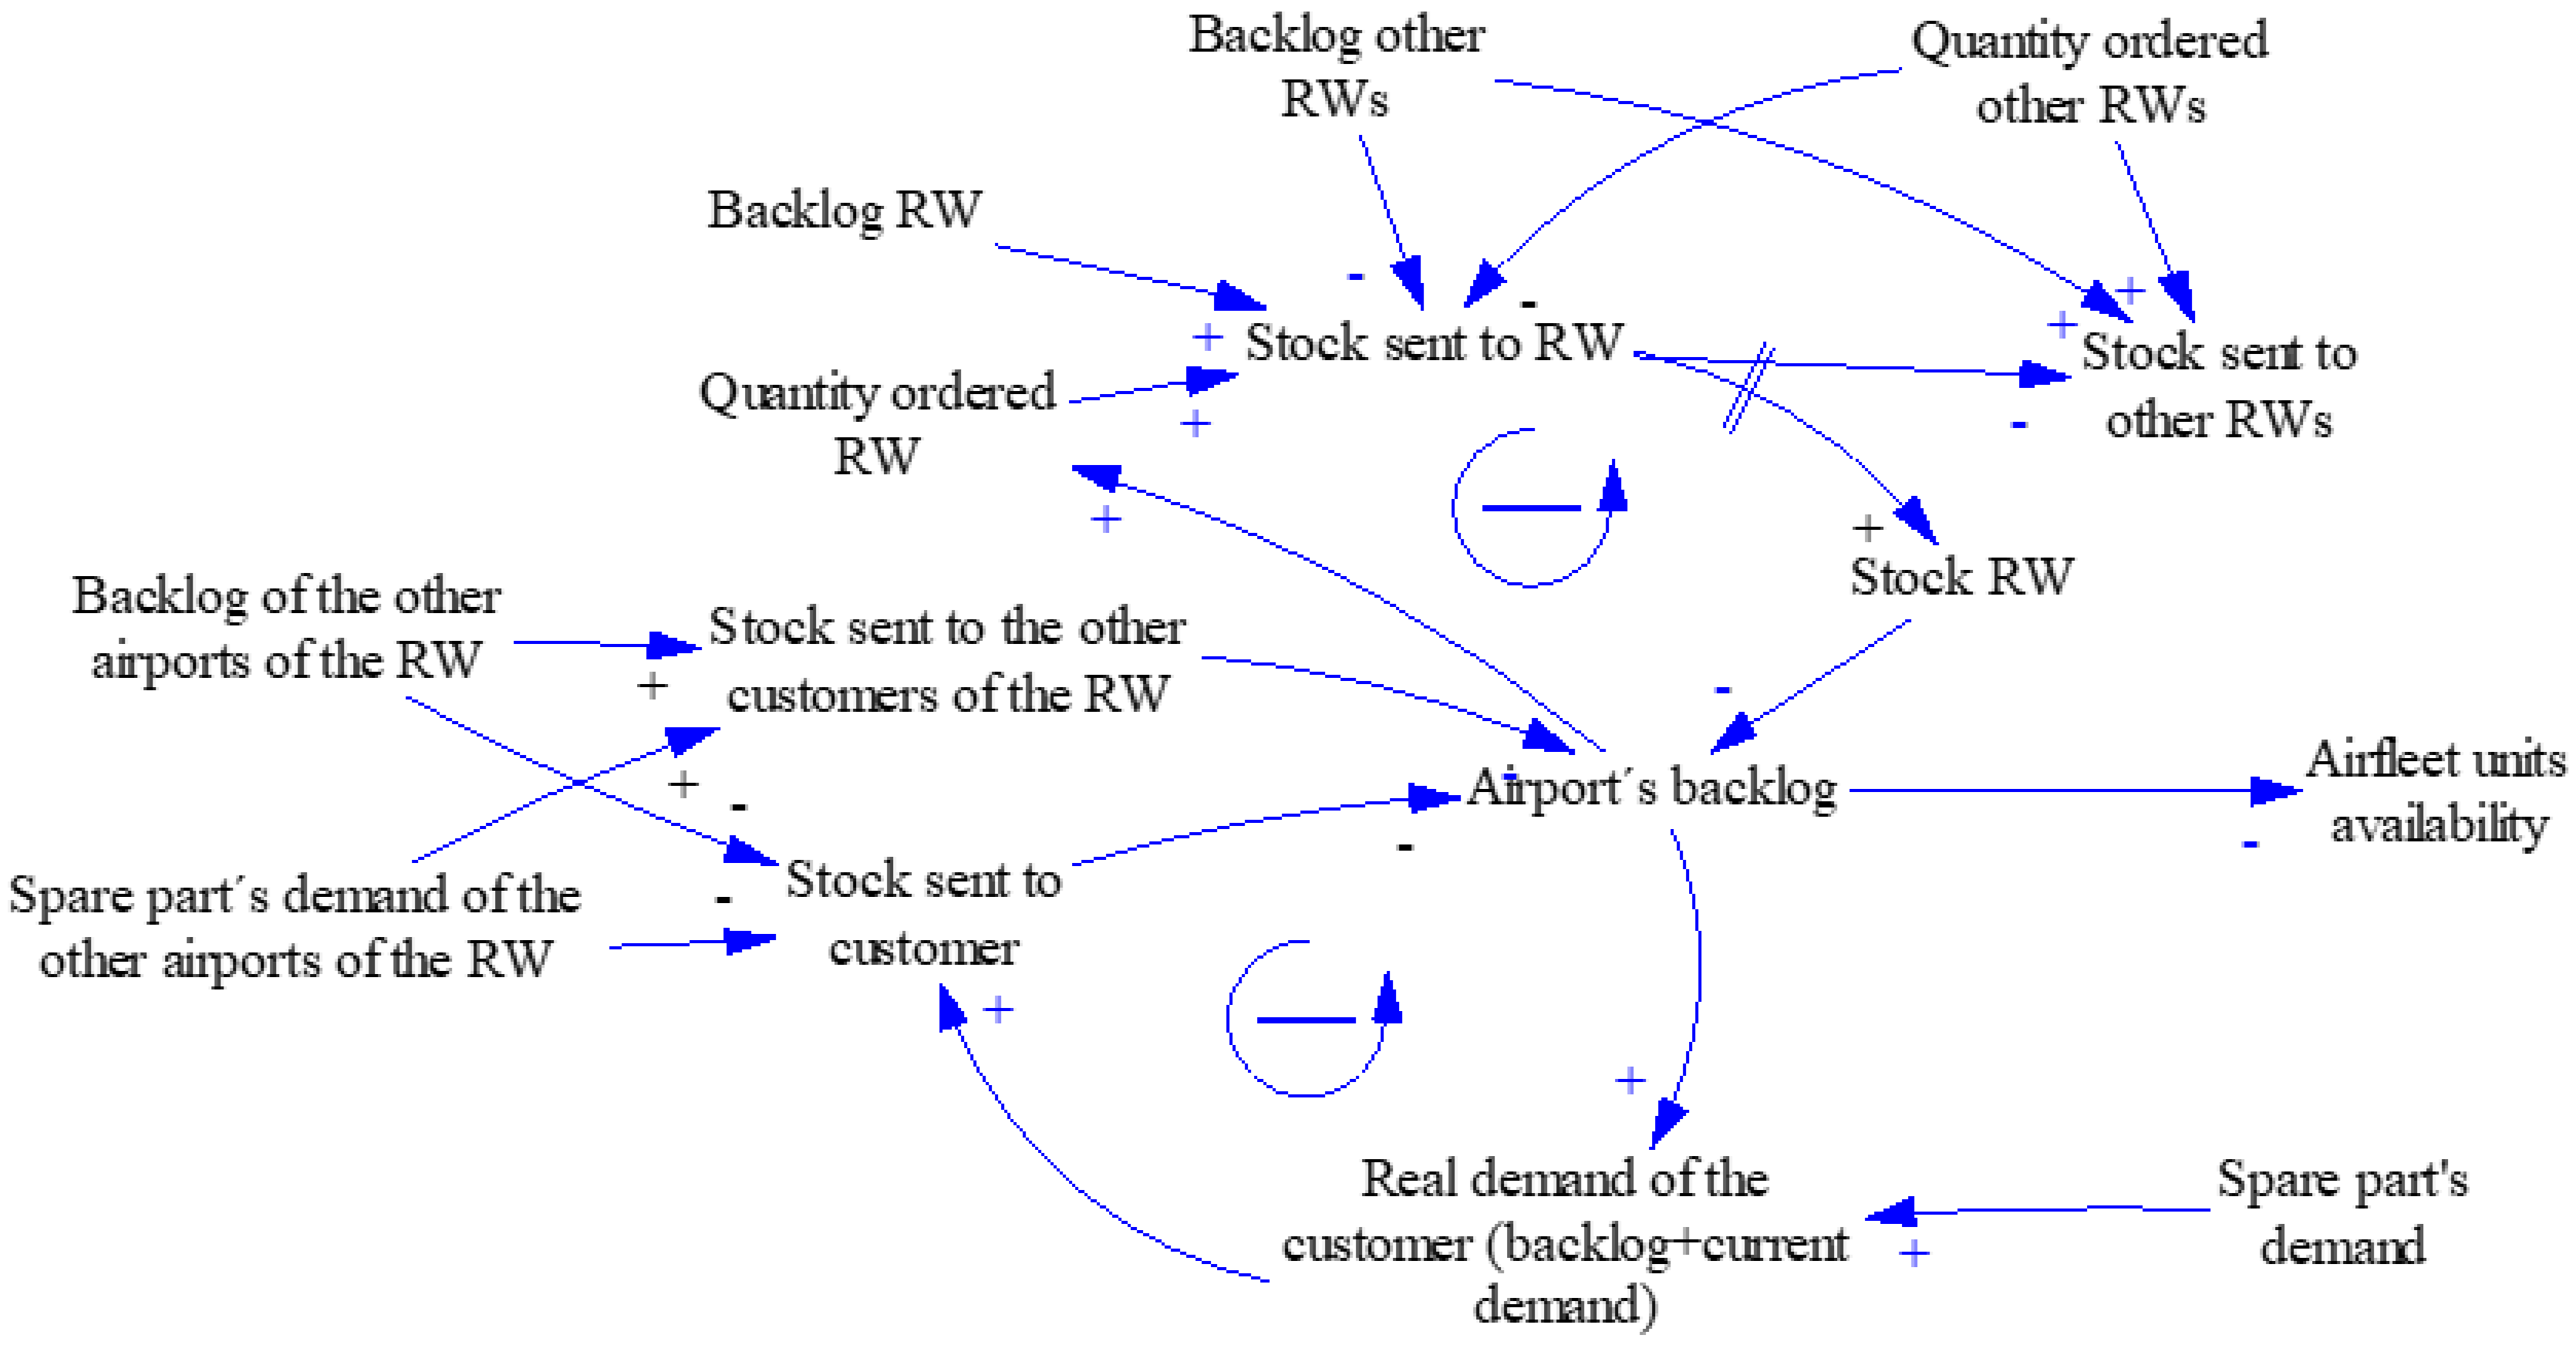
4.1.1. Casual Loop Diagrams
4.1.2. System Dynamics Sub-Models
4.1.3. Aircraft Fleet Sub-Model
4.1.4. Forecasting Sub-Model for Maintenance Requirements
4.1.5. Distribution Network Sub-Model
4.1.6. Maintenance Program Sub-Model
4.2. Simulation Design
4.2.1. Time Restrictions and Assumptions
- Initial time: 0 weeks;
- Final time: 2000 weeks;
- Time step: 1 week;
- Units for time: weeks.
- The same demand using replication;
- The same replenishment methods used with the same parameters and the same definition of them;
- Same aircraft fleet production rate and total number of aircraft units;
- Same flight traffic volume and operating hours;
- Same failure probability for the spare part component;
- Same initial situation, that is, no backlog to begin with and the same conditions of WIP (products on their ongoing transportation to the customers), the same initial stock in the different warehouses, and initial stock ready to deliver to customers;
- Same number of employees with same initial distribution and same capacity to perform warehouse activities;
- Same supply chain distribution network (production facility, warehouses, etc.);
- Same production logic for all simulation models;
- Same material delays: 1 week of production process, 2 week of transportation lead time between PF and CW, 4 weeks of transportation lead time between CW and RWs, and 2 weeks of transportation between RWs and airport-maintenance locations;
- Minimum quantity to deliver from central to regional warehouses (trucks´minimum load is 50 units of spare parts). If this quantity is not reached, then the delivery does not take place;
- All models have the same forecasting method and the same changes between them;
- Same inventory management models, reorder-point for pull strategy, and the same coordination of the distribution of spare parts for the push strategy;
- Constant interest rates;
- The backlog of spare part units is treated with the same logic in all models. Airports and distributors with higher backlog levels are prioritized when organizing the delivery of the spare parts;
- Same production limitations: Minimum of 100 products/week, maximum of 300 products/week;
- The warehouses have no stock capacity limitations. It was assumed that outsourcing warehouses for stocks can be found in the nearby with extra-holding costs;
- There were no transport limitation between the different production stages. It was assumed that additional third-party logistics could be found;
- No experts in the field have directly supported the model construction to assign values or to assist the validation of the models.
4.2.2. Key Performance Indicators
4.2.3. Simulation Models
4.2.4. Scenarios
- Scenario 1: High demand of spare parts;
- Scenario 2: Low demand of spare parts.
4.2.5. Model Validation
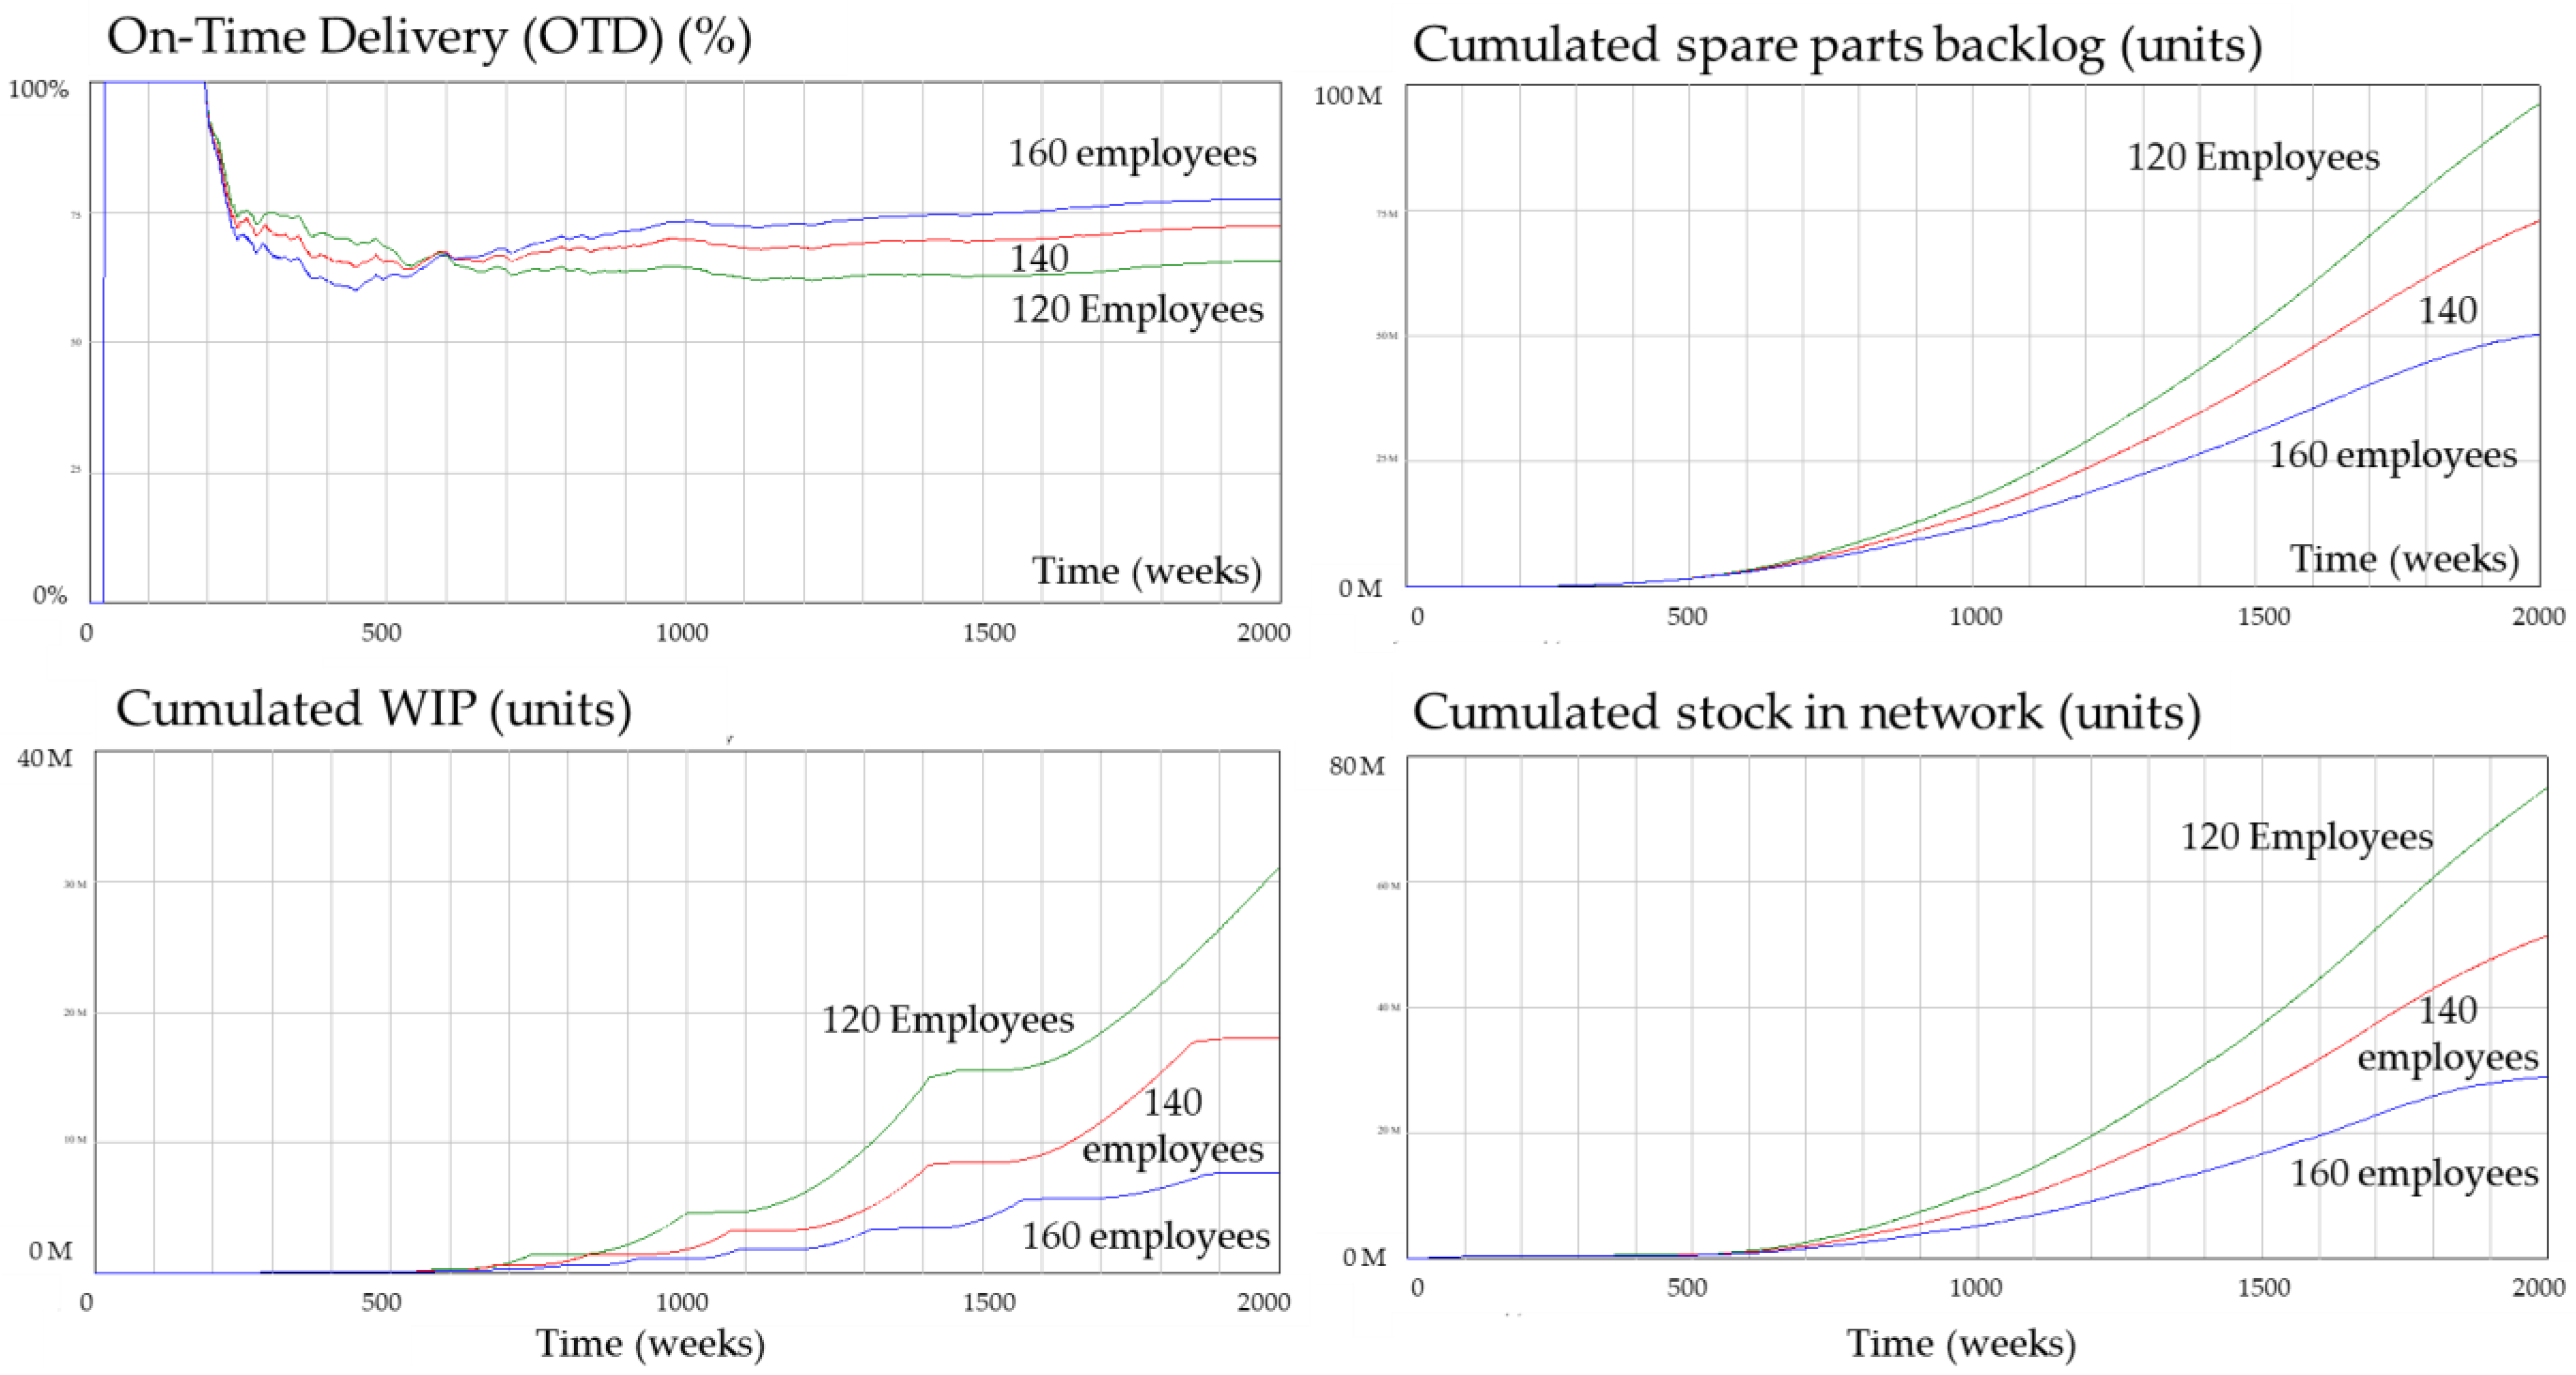
- For a lower number of employees, then OTD must be lower and total stock should be higher because the production facility provides more products than the employees are able to process. This is shown in Figure 10, where the blue lines refer to the results over the simulation time for 160 employees, while the red lines are for the results for 140 employees and the green lines for 120 employees. It can be seen that when there are fewer employees, then the OTD decreases while the cumulated spare parts backlog, WIP, and stock in network caused by missing manpower increase. This happens because employees perform the warehouse activities and if there are not enough employees then the spare parts are not ready for delivery on time.
- If the initial stock in the central warehouse is lower, the OTD should be lower and stocks should be lower. As expected, this result was obtained.
- If the initial stock in the regional warehouses is lower, the OTD should be lower and stocks should be lower. As expected, this result was obtained.
4.3. Results for the Case Study of an Aircraft Fleet
4.4. Managerial Implications
5. Conclusions
- System dynamics provides the necessary notation and functionality to design distribution related models using Vensim (commercial software);
- Simulation of frameworks can be used to compare different distribution network approaches as well as different maintenance planning models;
- According to the results of the comparison here, it has been shown that in most cases a push strategy together with variable maintenance intervals gives a better response for aircraft availability, while a pull strategy with variable maintenance intervals provides better results in terms of inventory costs. Moreover, the variable maintenance intervals are a key factor to reduce the consumption of spare parts and the related maintenance time for replacements. The better response of the push strategy in terms of aircraft availability is due to the stable and homogenous demand among airports. The demands analyzed did not have high volatility or constant demand pattern changes. As a result, the allocation of stocks close to the maintenance locations provided better results. In terms of cost, further analysis must be performed to determine which configuration is optimal. This also depends on a company´s goal and the overall system condition.
- The proposed approach can increase the efficiency of distribution networks. It shows how the proposed conceptual model and its methodology can provide a useful tool for managers to compare different distribution network designs and maintenance programs and decide which best meets the target aircraft availability with the lowest costs possible, increasing delivery service with less stocks and more efficient manpower allocation. The methods and strategies used have their unique advantages and disadvantages and each company’s objectives and external environment will determine the preference of use.
- Extension of the conceptual model for other distribution and maintenance planning and management tasks;
- Detailed analysis of the factors of the simulation model;
- Extension of the functionality of the simulation model including promotions, price fluctuations, economic context, cost of activities, number of spare parts, improvement of demand forecasts methods, increased flexibility of the distribution network by allowing different routes, different aggregation of customers as well as different distances between stages and the consideration of the product cycle;
- Application of the conceptual model methodology and the simulation model to a real-case distribution network for spare parts management.
Author Contributions
Funding
Conflicts of Interest
References
- Pawellek, I.G. Planung der Instandhaltung. In Tegrierte Instandhaltung und Ersatzteillogistik; Springer: Berlin/Heidelberg, Germany, 2013. [Google Scholar]
- Instandhaltung Technischer Systeme: Methoden und Werkzeuge zur Gewährleistung eines Sicheren und Wirtschaftlichen Anlagenbetriebs; Schenk, M. (Ed.) Springer: Heidelberg, Germany, 2009. [Google Scholar]
- Handbook of Maintenance Management and Engineering; Ben-Daya, M.; Duffuaa, S.O.; Raouf, A.; Knezevic, J.; Ait-Kadi, D. (Eds.) Springer: London, UK, 2009; Volume 7. [Google Scholar]
- Matyas, K. Instandhaltungslogistik: Qualität und Produktivität Steigern, 5th ed.; Carl Hanser Verlag, Ed.; Wien: München, Germany, 2013. [Google Scholar]
- Mcadam, R.; Duffner, A. Implementation of total productive maintenance in support of an established total quality programme. Total Qual. Manag. 1996, 7, 613–630. [Google Scholar] [CrossRef]
- Chelson, J.V.; Payne, A.C. Reavill., LRC. Management for Engineers, Scientists and Technologists, 2nd ed.; Wiley: Chichester, UK, 2005. [Google Scholar]
- Kuhn, A.; Schuh, G.; Stahl, B.N. Nachhaltige Instandhaltung: Trends, Potenziale und Handlungsfelder Nachhaltiger Instandhaltung; Ergebnisbericht der vom BMBF geförderten untersuchung nachhaltige instandhaltung; VDMA-Verlag: Frankfurt am Main, Germany, 2006. [Google Scholar]
- Garrido, S.G. Organización y Gestión Integral de Mantenimiento; Ediciones Diaz de Santos: Madrid, Spain, 2010. [Google Scholar]
- Sherbrooke, C.C. METRIC: A multi-echelon technique for recoverable item control. Oper. Res. 1968, 16, 122–141. [Google Scholar] [CrossRef] [Green Version]
- Agrawal, S.; Singh, R.K.; Murtaza, Q.A. literature review and perspectives in reverse logistics. Resour. Conserv. Recycl. 2015, 97, 76–92. [Google Scholar] [CrossRef]
- Garg, A.; Deshmukh, S.G. Maintenance management: Literature review and directions. J. Qual. Maint. Eng. 2006, 12, 1355–2511. [Google Scholar] [CrossRef]
- Alrabghi, A.; Tiwari, A. State of the art in simulation-based optimisation for maintenance systems. Comput. Ind. Eng. 2015, 82, 167–182. [Google Scholar] [CrossRef] [Green Version]
- Bacchetti, A.; Saccani, N. Spare parts classification and demand forecasting for stock control: Investigating the gap between research and practice. Omega 2012, 40, 722–737. [Google Scholar] [CrossRef]
- Gebauer, H.; Kucza, G.; Wang, C. Spare parts logistics for the Chinese market. Benchmarking Int. J. 2011, 18, 748–768. [Google Scholar] [CrossRef]
- Ford, A. Modeling the Environment: An Introduction to System Dynamics Modeling of Environmental Systems; Island Press: Washington, DC, USA, 1999. [Google Scholar]
- Forrester, J.W. Counterintuitive Behavior of Social Systems; Chap. 1 on toward Global, Equilibrium; Meadows, D., Meadows, D., Eds.; Pegasus Communications: Walthan, MA, USA, 1973. [Google Scholar]
- Márquez, A.C. Dynamic Modelling for Supply Chain Management: Dealing with Front-End, Back-End and Integration Issues; Springer Science & Business Media: London, UK, 2010. [Google Scholar]
- Angerhofer, B.J.; Angelides, M.C. System dynamics modelling in supply chain management: Research review. In Proceedings of the 2000 Winter Simulation Conference Proceedings, Orlando, FL, USA, 10–13 December 2000; Volume 1, pp. 342–351. [Google Scholar]
- Sterman, J.D. Business Dynamics: Systems Thinking and Modeling for a Complex World; Irwin/McGraw-Hill: New York, NY, USA, 2000. [Google Scholar]
- Forrester, J.W. Industrial Dynamics, 4. Auflage; MIT Press: Cambridge, UK, 1969. [Google Scholar]
- Schröter, M. Strategisches Ersatzteilmanagement in Closed-Loop Supply Chains; Deutscher Universitäts-Verlag: Wiesbaden, Germany, 2006. [Google Scholar]
- Campuzano, F.; Mula, J. Supply Chain Simulation: A System Dynamics Approach for Improving Performance; Springer Science & Business Media: Berlin, Germany, 2011. [Google Scholar]
- Forrester, J.W. Grundzüge einer Systemtheorie, Deutsche Übersetzung; Zahn: Wiesbaden, Germany, 1972. [Google Scholar]
- Dhillon, B.S. Engineering Maintenance: A Modern Approach; CRC Press, Taylor & Francis Group: Boca Raton, FL, USA, 2002. [Google Scholar]
- Wannenwetsch, H. Integrierte Materialwirtschaft, Logistik und Beschaffung; Springer: Berlin/Heidelberg, Germany, 2014. [Google Scholar]
- Pfohl, H. Logistiksysteme, Betriebswirtschaftliche Grundlagen, 8th ed.; Springer: Berlin/Heidelberg, Germany, 2010. [Google Scholar]
- Chopra, S.; Meindl, P. Supply chain management. strategy, planning & operation. In Das Summa Summarum des Management; Springer: Berlin/Heidelberg, Germany, 2007. [Google Scholar]
- Schuh, G.; Stich, V.; Wienholdt, H. Logistikmanagement; Springer: Berlin/Heidelberg, Germany, 2013. [Google Scholar]
- Sebastian, H.J. Optimierung von Distributionsnetzwerken. In BoD–Books on Demand; EAGLE: Leipzig, Germany, 2013. [Google Scholar]
- Siller, U. Optimierung Globaler Distributionsnetzwerke: Grundlagen, Methodik, Praktische Anwendung; Gabler Verlag: Wiesbaden, Germany, 2011. [Google Scholar]
- Wildemann, H. Entwicklungspfade der logistik. In Das Beste Der Logistik; Springer: Berlin/Heidelberg, Germany, 2008. [Google Scholar]
- Schulte, C. Logistik: Wege zur Optimierung der Supply Chain; Vahlen: Munich, Germany, 2008. [Google Scholar]
- Wensing, T. Periodic Review Inventory Systems; Springer: Berlin, Germany, 2011; Volume 651. [Google Scholar]


| No. | Key Indicator | Formula |
|---|---|---|
| 1 | Ø spare parts demand (units) | (∑ Spare parts demand)/Total number of weeks |
| 2 | On-time delivery (OTD) (%) | |
| 3 | Service level (%) | |
| 4 | Ø spare parts backlog (units) | (∑ spare parts backlog)/Total number of weeks |
| 5 | Ø age of backlog (weeks) | [∑ backlog (units) age of spare parts (weeks)]/Total number of weeks |
| 6 | Ø stock in network (units) | (∑ Stock central and regional warehouses)/Total number of weeks |
| 7 | Ø stock in Central Warehouse (CW) (units) | (∑ Stock central warehouse)/Total number of weeks |
| 8 | Ø stock in Regional Warehouses (RW) (units) | (∑ Stock regional warehouses)/Total number of weeks |
| 9 | Ø production (units) | (∑ Spare parts production)/Total number of weeks |
| 10 | Ø WIP (Work-In-Progress) (units) | (∑ Spare parts units in transportation process)/Total nnumber ofweeks |
| 11 | Ø airplane availability (%) | (1 − ∑ Aircraft on ground) 100%/Total number of weeks |
| 12 | Ø airplane on ground (%) | (∑ Spare parts demand)/Total number of weeks |
| 14 | Ø interval for planned maintenance (operating hours) | (∑ Maintenance interval for planned maintenance)/Number of planned maintenance intervals |
| 15 | Ø interval for unplanned maintenance (operating hours) | (∑ Maintenance interval for unplanned maintenance)/Number of unplanned maintenance intervals |
| 16 | Inventory costs (mil. USD) | ∑ (Procurement + Storage + Stock-out) costs |
| 17 | Production costs (mil. USD) | ∑ (Production cost per unit units produced) |
| 18 | Transport costs (mil. USD) | ∑ (Transport cost per unit units transported) |
| No. | Key Indicator | Model PF-1 | Model PF-2 | Model PV-1 | Model PV-2 |
|---|---|---|---|---|---|
| 1 | Ø spare parts demand (units) | 144.4 | 144.4 | 114.8 | 114.8 |
| 2 | On-time delivery (OTD) (%) | 88.2 | 85.0 | 100.0 | 90.3 |
| 3 | Service level (%) | 71.0 | 67.4 | 100.0 | 90.1 |
| 4 | Ø spare parts backlog (units) | 984 | 998 | 0 | 56 |
| 5 | Ø stock in network (units) | 3080 | 3112 | 6586 | 6679 |
| 6 | Ø stock in CW (units) | 26 | 1895 | 37 | 5086 |
| 7 | Ø stock in RW (units) | 3054 | 1217 | 6549 | 1593 |
| 8 | Ø production (units) | 154 | 154 | 129 | 129 |
| 9 | Ø WIP (Work-In-Progress) (units) | 3650 | 1795 | 7046 | 2053 |
| 10 | Ø aircraft availability (%) | 60.0 | 59.8 | 83.7 | 82.6 |
| 11 | Ø aircraft on ground (%) | 40.0 | 40.2 | 16.3 | 17.4 |
| 12 | Ø interval for planned maintenance (operating hours) | 706 | 706 | 1567 | 1567 |
| 13 | Ø interval for unplanned maintenance (operating hours) | 1974 | 1974 | 1577 | 1577 |
| No. | Key Indicator | Model PF-1 | Model PF-2 | Model PV-1 | Model PV-2 |
|---|---|---|---|---|---|
| 1 | Ø spare parts demand (units) | 28.6 | 28.6 | 22.0 | 22.0 |
| 2 | On-time delivery (OTD) (%) | 100 | 87.8 | 100 | 85.9 |
| 3 | Service level (%) | 100 | 88.3 | 100 | 86.9 |
| 4 | Ø spare parts backlog (units) | 0 | 27.1 | 0 | 29.4 |
| 5 | Ø stock in network (units) | 3111 | 3145 | 5530 | 5576 |
| 6 | Ø stock in CW (units) | 64 | 1731 | 67 | 3994 |
| 7 | Ø stock in RW (units) | 3047 | 1414 | 5463 | 1581 |
| 8 | Ø production (units) | 31 | 31 | 27 | 27 |
| 9 | Ø WIP (Work-In-Progress) (units) | 3168 | 1528 | 5567 | 1669 |
| 10 | Ø aircraft availability (%) | 79.7 | 77.0 | 83.7 | 80.8 |
| 11 | Ø aircraft on ground (%) | 20.3 | 23.0 | 16.3 | 19.2 |
| 12 | Ø interval for planned maintenance (operating hours) | 706 | 706 | 1567 | 1567 |
| 13 | Ø interval for unplanned maintenance (operating hours) | 1974 | 1974 | 1577 | 1577 |
Publisher’s Note: MDPI stays neutral with regard to jurisdictional claims in published maps and institutional affiliations. |
© 2021 by the authors. Licensee MDPI, Basel, Switzerland. This article is an open access article distributed under the terms and conditions of the Creative Commons Attribution (CC BY) license (http://creativecommons.org/licenses/by/4.0/).
Share and Cite
Gallego-García, S.; Gejo-García, J.; García-García, M. Development of a Maintenance and Spare Parts Distribution Model for Increasing Aircraft Efficiency. Appl. Sci. 2021, 11, 1333. https://doi.org/10.3390/app11031333
Gallego-García S, Gejo-García J, García-García M. Development of a Maintenance and Spare Parts Distribution Model for Increasing Aircraft Efficiency. Applied Sciences. 2021; 11(3):1333. https://doi.org/10.3390/app11031333
Chicago/Turabian StyleGallego-García, Sergio, Javier Gejo-García, and Manuel García-García. 2021. "Development of a Maintenance and Spare Parts Distribution Model for Increasing Aircraft Efficiency" Applied Sciences 11, no. 3: 1333. https://doi.org/10.3390/app11031333