Article

Connectivity as a Design Feature for Industry 4.0 Production Equipment: Application for the Development of an In-Line Metrology System

by
Ana Pamela Castro-Martin
1,
Horacio Ahuett-Garza
1,*,
Darío Guamán-Lozada
1,2,
Maria F. Márquez-Alderete
1,
Pedro D. Urbina Coronado
1,
Pedro A. Orta Castañon
1,
Thomas R. Kurfess
3 and
Emilio González de Castilla
4
1
Tecnológico de Monterrey, Escuela de Ingeniería y Ciencias, Ave. Eugenio Garza Sada 2501, Monterrey 64849, Mexico
2
Escuela Superior Politécnica del Chimborazo, Riobamba, Chimborazo 060106, Ecuador
3
Tecnológico de Monterrey, Escuela de Ingeniería y Ciencias and George W. Woodruff School of Mechanical Engineering, Georgia Institute of Technology, 771 Ferst Drive, NW, Love Bldg. Room 101, Atlanta, GA 30332-0405, USA
4
Bocar Group, Prof. Aurora Reza 255, Los Reyes, Coyoacan 04330, Mexico
*
Author to whom correspondence should be addressed.
Appl. Sci. 2021, 11(3), 1312; https://doi.org/10.3390/app11031312
Submission received: 4 December 2020 / Revised: 26 January 2021 / Accepted: 28 January 2021 / Published: 1 February 2021

Abstract

:
Industry 4.0 (I4.0) is built upon the capabilities of Internet of Things technologies that facilitate the recollection and processing of data. Originally conceived to improve the performance of manufacturing facilities, the field of application for I4.0 has expanded to reach most industrial sectors. To make the best use of the capabilities of I4.0, machine architectures and design paradigms have had to evolve. This is particularly important as the development of certain advanced manufacturing technologies has been passed from large companies to their subsidiaries and suppliers from around the world. This work discusses how design methodologies, such as those based on functional analysis, can incorporate new functions to enhance the architecture of machines. In particular, the article discusses how connectivity facilitates the development of smart manufacturing capabilities through the incorporation of I4.0 principles and resources that in turn improve the computing capacity available to machine controls and edge devices. These concepts are applied to the development of an in-line metrology station for automotive components. The impact on the design of the machine, particularly on the conception of the control, is analyzed. The resulting machine architecture allows for measurement of critical features of all parts as they are processed at the manufacturing floor, a critical operation in smart factories. Finally, this article discusses how the I4.0 infrastructure can be used to collect and process data to obtain useful information about the process.

1. Introduction

Industry 4.0 (I4.0) is a term introduced by the German government to label the convergence of technologies such as the Internet of Things Things (IoT), Cyberphysical Systems (CPS), and Cloud Computing in the new generation of industrial systems [1]. In the manufacturing environment envisioned by the concept of I4.0, the vast amount of data that is collected from the shop floor can be transported and analyzed to provide information that is then used to monitor and control operations. The ultimate goal is to develop Smart Manufacturing (SM) capabilities to produce finished goods of optimal quality, on time, with the minimum waste of energy and resources [2]. Initially intended as a strategy for the manufacturing sector, it has been adopted by other industries such as energy and transportation, where reliability and safety are of paramount importance [3].
The infrastructure that has been developed to support the (IoT) is the means to handle and process the data. The new Information and Communication Technologies that will provide a platform for the deployment of I4.0 have been an important topic of research [1]. Specifically, the network that allows manipulating and managing big data, from the telecommunication operators to the cloud administration and computing services, facilitates the introduction of I4.0. Communication and data transfer protocols have been developed to enable data transfer from sensors and machine controls to other equipment or the Cloud, and eventually, back to the shop floor. Delays in the process of handling and analyzing the data have an impact on the quality of the services that can be provided [4]. For this reason, data commonly goes through filtering and preprocessing procedures before it is sent to the Cloud [5]. During this procedure, data are also analyzed, and decisions are made by controls of different hierarchies based on the information that is gained from the analysis.
Digital Twins (DT) and Cyberphysical Systems (CPS) are the core tools of I4.0. They merge the physical world. i.e., intelligent machines and the data from sensors and part measurements, with the virtual models designed to represent reality. The purpose of CPS and DT is to monitor and forecast the behavior of a system, with the ultimate goal of controlling their processes. In particular, computer simulation is a key element of CPS for monitoring and forecasting. Simulation models can be used for contrasting a system’s behavior with expected conditions, predicting future states, diagnosing sources of problems, and preventing inefficient or hazardous conditions. The connection of the field data with these models is an important research topic [6,7]. Lee et al. [8] stressed the importance of acquiring accurate and reliable data from the shop floor to develop CPS. Rosen [9] described how DT are critical components of CPS, and pointed out that connectivity is a key element to achieve smart manufacturing capabilities. Chen [10] stated that fast, reliable communications between machines and improved intelligence at the machine level are also features of smart factories.
Machine tools are invaluable sources of information in smart factories, a perspective that needs to be assimilated at the design stage. Several studies have tried to incorporate I4.0 principles and technologies at the machine tool level. For example, current machine design trends such as sustainability, can benefit from I4.0 tools and cloud computing (Croccolo [11]), (Gao [12]). Cheng et al. [13] argued that smart tools are a key element for machine tools and smart processes within an I4.0 ecosystem. Xu et al. [1] stated that smart devices are key elements for resilient smart factories, and both are important topics of research.
To make the best use of the capabilities of the habilitating technologies in sensors, communications, and data analysis, machine architectures and design paradigms must evolve. Multiple studies have been made about the architectures that can make the best used of IoT at the system level. Schauerte et al. [14] analyzed the issues faced by legacy factories (brownfield) as they transition into I4.0 ecosystems, and proposed a general system architecture that can help bridge the gaps. This architecture was designed around characteristics such as flexibility, scalability, security, and real-time communication. Ackerman et al. [15] presented a system architecture to interconnect equipment at the shop floor with the Cloud. Their main concern was interoperability of the system, and work focused on communication protocols and open-source software for implementation.
This work argues that intelligence is a characteristic that can benefit from I4.0. Computer Numerical Control (CNC) allows for the automatic operation of many machine functions. However, autonomous operation, which allows the machine to adapt to changes in the environment, is a goal that lies beyond the reach of CNC. Monitoring and modeling of the process have long been recognized as capacities that are needed for autonomous control and operation of machine tools (see Yang [16] and Sato [17]). More recently, Moriwaki et al. [18] pointed out that Intelligent process monitoring and data from measurements of finished products are two features that are needed to achieve autonomy. Mutilba et al. [19] discussed the use of machine tools for in-line metrology to obtain part data right after manufacture. However, machine tools are meant to produce parts. Measuring is not a function that adds value, and other options exist. Weckmann et al. ([20,21]) identified trends in metrology for manufacturing: Metrology at smaller scales (micro and nano), holistic measurement in which multiple sensors are used to measure parts fully, and quick low-cost measurement techniques for high volumes in the production line, or in-line measurement. More specifically, Koren [22] proposed that in-line inspection stations are vital for part quality monitoring in modern Reconfigurable Manufacturing Systems (RMS).
From the previous discussion, communication between machines, improved intelligence, and data from the process and the product are necessary ingredients to achieve the goal of Smart Manufacturing. New machine architectures must incorporate features to achieve this goal. While world class, well-established machine tool builders routinely include state of the art concepts in their designs, they tend to maintain control of the information that is available to their customers. Furthermore, there is a growing trend in which regional manufacturing subsidiaries of global companies as well Tier 1 suppliers invest in the development of advanced manufacturing technologies (AMT), facilitating the digitization of existing factories [23]. Local developers of AMT compete on the basis of cost and development time for application-specific machines.
This work proposes that Connectivity, defined as the process of transferring data from an edge device (sensor or control) to another device or the Cloud, is the machine design feature that enables the implementation of I4.0, affecting the intelligence of the machine and how hardware capabilities are utilized. Connectivity allows intelligence to be decentralized and reconfigured to facilitate analysis and decision-making. Furthermore, Connectivity is the means to facilitate the construction of the digital thread of a product [24]. Through a specific case, this research shows that speed and safety of data transfer, as well as synchronization with the decision-making process, are factors that need to be accounted for during design stage. Proper design results in significant improvements over previous generations of machines, specifically, for the purposes of process monitoring and forecasting of the quality of the part and the health of the machine. This article describes how Connectivity can be incorporated into the design of machine tools and applies these ideas for the design of an in-line measuring machine. This work proposes solutions to specific challenges that designers encounter as they try to introduce I4.0 principles in the manufacturing floor. In particular, the contributions of this work are:
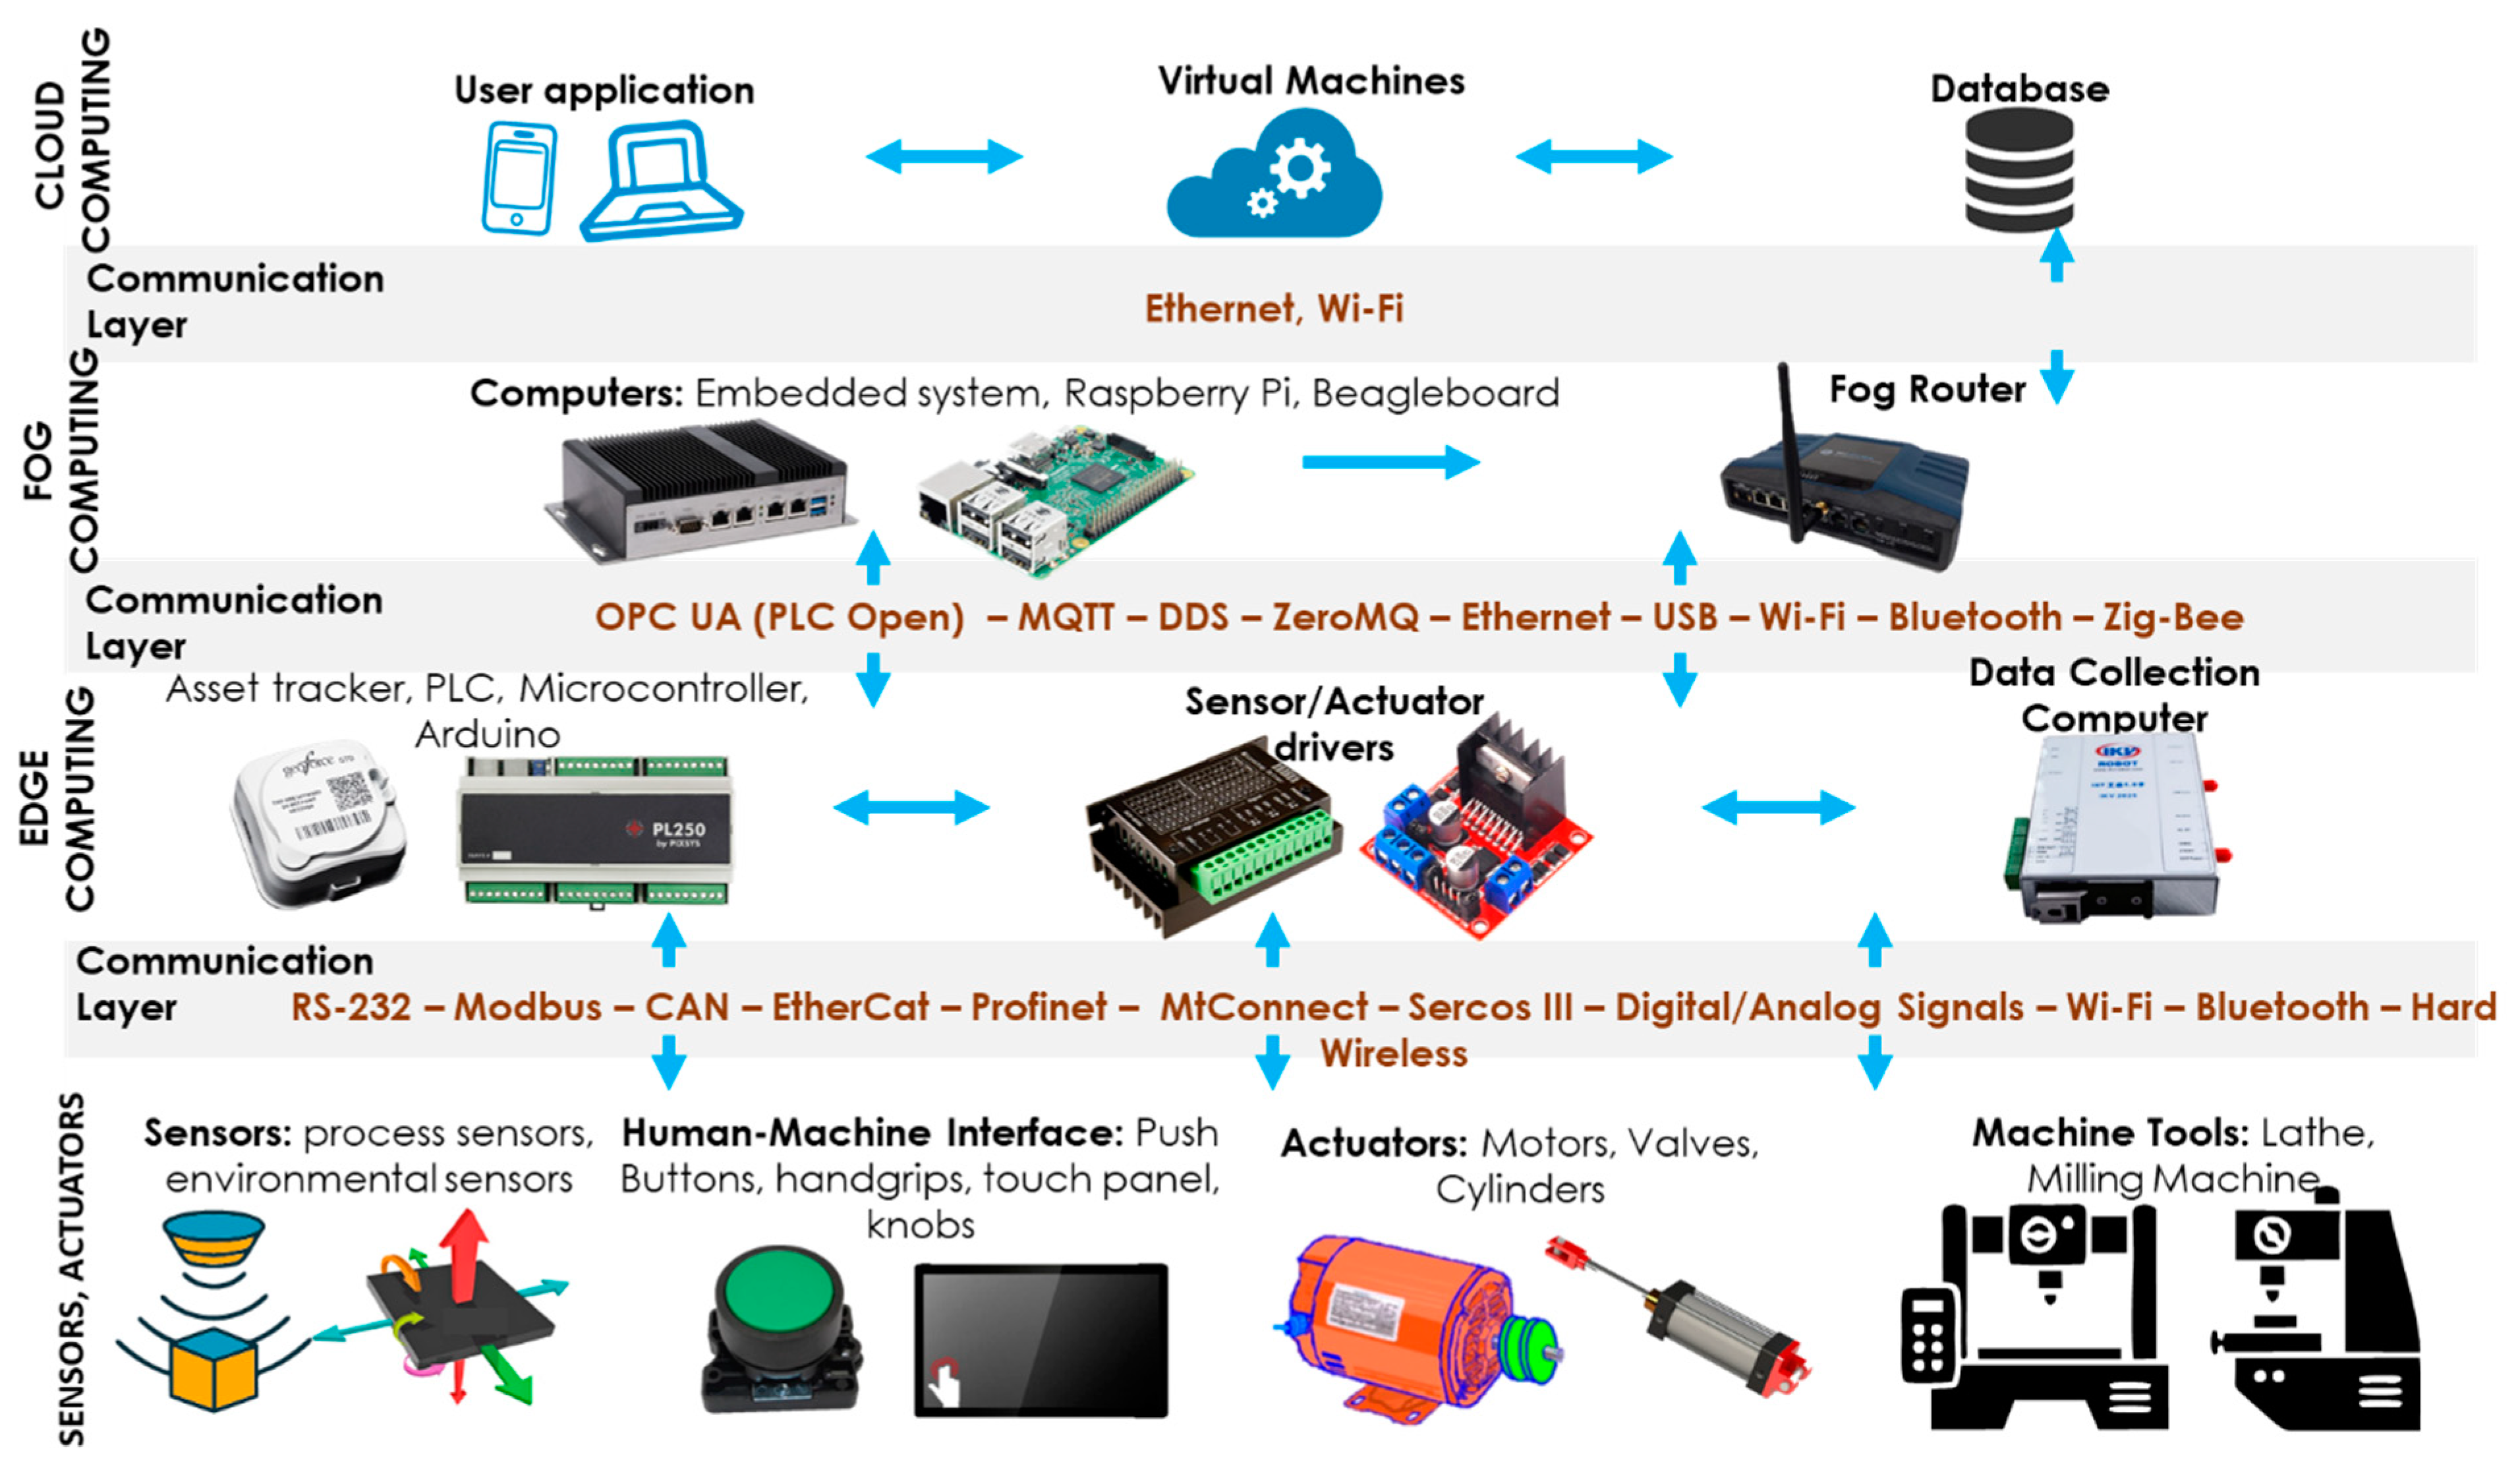
One of the most important technical challenges to the deployment of I4.0 capabilities is the integration of IoT technologies in the design of a machine [1]. This works introduces an approach based on functional decomposition concepts to help address this issue, and includes a mapping of technologies and networks that show the possible connections available to the designer that are needed to integrate and coordinate the signals from the different sensors and devices.
Connectivity, integration through data sharing, development of product memory, and improved process intelligence are key concepts for the development of smart factories under the I4.0 paradigm [25]. A function connectivity block was proposed to help designers manage the application of these I4.0 principles during the development of new machines. The proposed concepts are applied for the design of the in-line metrology machine.
A novel machine architecture for a highly relevant current application [22], in-line metrology of automotive parts, is presented. Among other characteristics, the new design uses connectivity to facilitate digitalization of the operation. Connectivity also helps improve the intelligence of the measuring process by allowing timely montoring of the status and performance of the machine.
The article is organized as follows. Section 2 discusses the concept of intelligence in machine tools and analyzes the implications of technologies and protocols to implement Connectivity and improve the control architecture of a machine. Section 3 presents how Connectivity and safety can be accounted for during the design stage using functional analysis. Section 4 applies the previous concepts to the design of an in-line metrology machine. Section 5 provides an assessment of the performance of the machines. Lessons learned are presented in Section 6. Finally, conclusions and future work are presented in Section 7.

2. Intelligence in Machine Tool Design

The design of manufacturing systems typically strives to achieve specific characteristics. For example, for the case of RMS, desired features include scalabililty, convertibility, diagnosability, customization, integrability, and modularity [22]. Molina et al. [26] proposed intelligence as another feature of machines in RMS. Even though the concept of RMS has been developed for over 20 years, there is a lack of structured approaches for the design of RMS [27]. A similar argument can be made for the design of equipment for I4.0 environments. This work proposes that production machines, including in-line metrology equipment, should have the following attributes to meet the performance demands of modern applications:
  • Accuracy and Repeatability. These attributes refer to the capacity of the machine to perform its functions consistently within bounds of an acceptable size from the intended target specification. The most common function associated with these attributes is the positioning of a tool. Accuracy refers to the ability of the machine to place a tool in the target location. Repeatability is associated with the size of the deviation in achieving a target when the positioning action is repeated.
  • Flexibility. Refers to the ability of the equipment to meet changing needs on the shop floor. For example, the features to be measured may vary depending on the type of analysis being conducted (for in-line metrology), or the machine may allow for parts of different geometry to be produced.
  • Robustness. This characteristic refers to the ability of the machine to perform its function reliably and accurately. Factors that affect this characteristic are the ambient conditions and the operator’s handling of the equipment.
  • Speed. Refers to the capacity of the machine to perform all its functions in a given time, and it is affected not only by the velocity with which mechanical functions are performed but also by the processing speed of the controls of the machine.
  • Safety. This attribute is associated with the capacity of the machine to care for the physical integrity of the human operator, as well as the machine and its surroundings.
  • Intelligence. This attribute refers to the capacity of the machine to perform its functions in an autonomous manner. Automatic operation requires the machine to manage, monitor, and control the functions it performs. Autonomous operation requires the ability to adapt to changes in conditions, particularly those in the environment. The ability to communicate with its surroundings and respond to commands from recognized higher authorities are also features of intelligence.
The subject of Intelligence in production equipment has received significant attention for some time. In their work, Moriwaki et al. [18] summarized the state of the art and trends. In conventional machine tool controls, intelligence is for the most part a local feature, constrained by the limitations of hardware, processing capacity, and more importantly, the scope of the available data. Connectivity allows access to the computing resources of the web, and to the infrastructure that supports I4.0. This work proposes that Connectivity opens a wide range of possibilities to enhance the intelligence of new machines.
A basic principle of I4.0 that is of particular interest is that objects can be designed to communicate with other objects. Karimi [28] argued that the contents of these communications determine how smart a process or machine is. Several studies have addressed the type of data that needs to be collected and communicated. Stock and Seliger [29] pointed out that variables and operational states of the machine need to be collected. Borgia [30] established that information about the environment needs to be monitored, stressed the importance of monitoring process conditions, and the potential benefits of integrating wearable sensors and digital cameras to the stream of data. While these studies have aimed to improve the efficiency of the manufacturing processes, it has been shown that information can be integrated much earlier, even as far back as the design stage. Gorecky [31] studied the integration of data associated with a product, the fabrication process, the technical documentation, or the operative production process. There are still challenges associated with the design of the digital thread that can allow the data to flow across the life cycle of a product, particularly those associated with the scope and format in which this communication can actually occur [24].
For the designer, an expanded universe from which intelligence can be constructed presents new challenges. In particular, the choice of the hardware, the design of the distribution of the intelligence, and the coordination and synchronization of the different resources are issues that need to be addressed. In particular, the integration of IoT technologies for I4.0 is an important technical challenge because there are no universal platforms that integrate communication technologies with the applications found in current networks, that is, in legacy systems [1]. Figure 1 maps the technologies and communication protocols that constitute the infrastructure for Connectivity and within which, the intelligence of smart machines can operate.
Connectivity allows access to resources that can significantly improve the capacity to monitor and control a given process, and by coordinating this information with the analysis of data about the environment, new capabilities can be developed. Forecasting can be enhanced, not only about systems that are internal to the machine but also about changes in the production environment and even market demands. The autonomous operation, in the sense of the capacity to adapt to changes, is greatly enhanced, and routine but necessary operations such as maintenance and tool change can be made more efficiently. To achieve these new capacities, the intelligence is built by distributing data and managing information across different layers of computing capabilities.
From the perspective of machine design, the technologies and protocols shown in Figure 1 are selected according to the application, with the goal of integrating the intelligence to the shop floor. The intelligence of the machine is the entity constructed by the hardware that collects data and executes instructions, by the connections that transfer data and signals, by the computers that store and analyze data, and by the programs and applications that run within the computers, processors and devices that perform the actual analysis and provide instructions. Different types of analysis and decisions are made at different levels, and an understanding of the capacities and requirements at each layer is critical for a coordinated operation that guarantees safety and reliability.
As shown in Figure 1, the shop floor is at the lower layer. Data are generated from here by machines and sensors, the edge devices. Real-time response is needed and therefore decision making amounts mostly to predefined, automatic responses. Storage capacity is relatively low. At the opposite end, the Cloud, large volumes of data are used to forecast the behavior of a system. At this level, there is virtually infinite storage capacity, and the analysis as well as the actions that are triggered cover longer times and larger spaces. The tendency is for these technologies to become ubiquitous. Between these extremes, there is a transition layer, where data are conditioned and transferred, and where the functions of machines are coordinated. The use of Edge concepts drastically reduces the communication volume between cloud and edge devices [32]. To avoid ambiguity, this work considers edge computing devices that are not only data acquisition systems but implement computing operations at the edge and provide connectivity to the Fog and Cloud. On the other hand, Fog computing sends data to a computer that is closer to the Cloud. Important enhancements are presented in computing paradigms with Fog computing due to the use of small platforms located at the network edges closer to the IoT devices and networks [33].
Figure 2 provides a framework in which response time, physical location, and data handling capacity are correlated with the types of intelligent functions that are provided by the principles and capabilities of I4.0. In essence, the technologies and protocols depicted in Figure 1 administer Intelligence within the frame illustrated in Figure 2.
Connectivity is the means by which the devices at the different levels can communicate, and is therefore at the core of the expanded intelligence that new machine architectures incorporate. The introduction of Connectivity in new machine designs offers the potential to bring significant improvements in the performance of the system. In the case of existing equipment, the addition of Connectivity represents an upgrade, in the sense that the software of industrial equipment evolves, as opposed to a retrofit, that is normally associated with the insertion of new hardware [5]. The section that follows explains how functional design can be used to integrate Connectivity.

3. Connectivity as a Design Function

Because of its effect on the fundamental architecture of a product, as well as its cost, the process that spans the conception of a product through the detailed design is critical. For example, Wan et al. [34] estimated that 75% of the cost of an automobile is defined during this stage. During this process, methodologies based on functional decomposition or functional reasoning have proved to be powerful tools to help designers arrive at robust product architectures. The main advantages of Functional-based design methodologies are simplicity, and the fact that, by looking at functions to be performed, designers are not constrained a priori to particular configurations [35]. Furthermore, functional analysis and functional decomposition are powerful tools for the purpose of declaring the mission of the system.
One of the most basic tools for functional analysis was introduced for the process of Value Analysis, a technique that seeks to characterize and manage the costs incurred in performing functions [36]. The basic idea is to identify functions, which are expressed in terms of a verb and a subject, and then categorize them in a structured manner in a diagram. Basic functions are those needed for a specific system or component to fulfill its mission. Support functions add value to the product, or perform critical complementary functions. There is no extra credit for performing basic functions, and typical support functions include “provide safety” or reliability. This type of diagram was originally intended for the analysis of a product, and not for design. Functional decomposition evolves from this type of analysis and has been used as a reliable method to generate alternate designs that are later evaluated automatically in terms of the sustainability of the different proposals [37]. There are inherent advantages of applying it early on during the design process. Depending on the detail of the diagram, certain functions can be correlated to physical components. The diagram also alerts the designer to the need to include functions that may not be essential to the mission of the product but crucial for a successful introduction.
While the normal functional analysis tree provides insights into the way functions can be delivered, it has limitations. For example, functional trees are not easily integrated with more sophisticated tools such as CAD systems, to support synthetic design [38]. This type of diagram was not originally designed to represent the features such as the flow of energy and materials or human intervention in the system’s performance. In their work designing CPS systems for automobile applications, Wan et al. [34] addressed these limitations by conceptualizing functions in terms of energy, materials, and signal flows. Of particular interest is the work of Jensen et al. [39], who proposed a model to incorporate safety as a function during the design process of CPS. In this work, they used systems modeling to represent the process of decomposing system function structures acting on flows. From these, components were identified to implement those functions and their architecture. They argue that this approach is useful for implementing safety, particularly for components that perform multiple functions, and for the design of controls.
Based on the previous discussion, this work looked at introducing a function to include Connectivity from the early stages of design. The proposed block diagram of the function “provide connectivity” is shown in Figure 3. There are actions associated with this function: Collect data, preprocessing the data, and deliver data. Preprocessing the data may include further actions such as classification and cleaning.
In the model of Figure 3, the function of providing Connectivity considers an input from an edge device (sensor or control), and includes actions such as preprocessing of the data as they are transferred to the Cloud or another device. Data can flow in either direction, and security protocols must be followed. The actual action of preprocessing and conditioning of the data is done according to specific protocols. Energy is required in this process. The implementation of Connectivity using this idea is discussed in the sections that follow.

4. Application of the Concepts: Design of an In-Line Measuring Machine

The development of manufacturing metrology is a highly competitive field that continuously incorporates technology to improve the accuracy and resolution of measurement equipment [16,17]. Recently, the need for metrology techniques that are efficient at getting data from parts at the production facilities has been recognized [20,22]. Kiraci et al. [40] proposed the use of intelligent systems to promote a paradigm shift from dedicated off-line metrology to in-line metrology. They also pointed out that the most important challenge for the introduction of in-line techniques is the validation of the system´s capabilities in terms of accuracy, repeatability, and measurement time. Imkamp et al. [41] discussed how I4.0 could impact the design of metrology equipment in terms of speed, flexibility, and reliability, and stated that protocols for safe and efficient connection are needed. A further argument of this work was that technologies associated with Industry 4.0 could be used to improve the value of in-line measurement systems. Bauza et al. [42] proposed the use of computer tomography to inspect parts quickly in an I4.0 environment. They mentioned the need to inspect parts completely, at speed to match production rates. Their system measured parts in batches with an accuracy comparable to that of a CMM, at a fraction of the time.
This work proposes that in-line metrology systems should have specific characteristics suitable for the production environment: Flexibility, Accuracy, Robustness, Speed, and Functional Intelligence and Connectivity. All the components of an in-line machine interact to achieve these characteristics. Nevertheless, the first four characteristics are mostly associated with the hardware of the machine, while Functional Intelligence and Connectivity are exclusively addressed by the design of the machine control. As will be shown, these principles were applied to the design of an in-line measuring machine for the inspection of die castings.

4.1. Analysis of Current Gauging Process and Target Specifications

To prevent defective products from reaching the customer, manufacturers strive for zero-defect-production. This is particularly true for the automobile industry [43], in which part traceability [44] has become an essential tool to analyze and predict part failure. In practice, manufacturers are moving towards verifying all critical specifications in every single part produced. Conventional inspection methods, which combine in-line gauging procedures with off-line metrology systems to verify part compliance with specifications and identify sources of error [23] are not designed for this new approach, as only samples of parts are fully verified before they are released. In response to these changing needs, a new paradigm for in-line inspection system design, in which all critical specs of all parts are measured, is emerging.
This particular case deals with the design of a machine in a casting operation. Figure 4 presents a schematic of the process that is followed to produce and inspect an aluminum die-cast part. After the casting process, a robotic arm takes the workpiece from the die casting die to a cooling water system and then to a punch press where excess material is removed. The part is then delivered to a gauging station, where a flatness test is performed. The test consists of measuring the height of approximately 20 points with linear variable displacement transducers (LVDT). Measurements are reported on a monitor screen. No provisions are made to store or transfer the data from the measurements.
The environment around the measuring station is typical of die casting operations: ambient temperatures can vary between 18 °C and 38 °C depending on the time of the day and season of the year. Steam released during the casting and quenching processes produce ambient humidity, and the punching operation produces noise, shock, and vibrations. The plant has several similar cells, which contribute to the overall conditions.
In general, in-line gauging systems in the automobile industry are built for robustness and speed. In this case, the pace of the part measuring process is given by the casting operation, which takes about one minute. Measurements need to be made in about 20 to 25 s to allow the operator to try to make corrections to the part if needed. As seen in Figure 5, the position of each LVDT is fixed, and therefore the gauging system can only be used for the specific part for which it was designed. The probes are covered and therefore they are well isolated from accidental impacts.
The main advantages of the current measuring station are reliability, robustness, and simplicity of operation. On the other hand, the gaging inspection system’s main weaknesses are its lack of flexibility, the tendency of the LVDT to catch debris from the part or the environment, and the lack of system information for the integration to I4.0.
The intention of the new design was to maintain the advantages of the current system, while adding flexibility and Connectivity to the Cloud. The use of permanently fixed sensors posed the main obstacle to achieve flexibility. The use of a moving probe allows the possibility to reconfigure the measuring plan. However, given that the measuring cycle needs to be completed in less than 25 s, speed becomes an important issue. As stated by [45], the use of contact probes limits the speed with which measurements can be made. Therefore, a laser probe was proposed for the application. Another consideration is that the inspection area of the measurement system must cover the overall dimensions of the workpiece (450 mm × 450mm). The tolerance range for the features from the casting operation is 0.8 mm and the target reliability using a gauge repeatability and reproducibility (R&R) study is 10% or less in each measurement point [46]. Therefore, as a starting point to select components, the overall target precision of the measuring system was specified as 0.040 mm. The new system has to perform measurements for the same part, and under the same environmental conditions as the current system. Among the expected upgrades are the capacity to analyze, store and transport data, and factors such as added flexibility to handle other parts were considered a desirable goal.

4.2. Architecture of In-Line Measuring Station

An in-Line measurement system was designed based on the specifications described in the previous section. A non-contact measurement device laser probe was proposed from the start to reduce the risk of collision between the machine and part. To compensate for the fact that the laser probe can make only one measurement at a time, a high speed positioning system was needed. A cartesian positioner, Gantry type, actuated by linear motors was selected because of the high speeds that can be achieved. The total work volume of the position system is 600 × 600 × 270 mm.
Figure 6 shows the structure of the full measurement system. There are two different sections in the system: The loading area and the measuring area. The measuring station is enclosed for the purpose of protecting the laser sensor as well as the linear motors from the environment. Parts are loaded (and retrieved) in the loading station, and then transported into the measuring area by a pneumatic positioner. This configuration requires a workpiece fixturing system (Figure 6c), which uses a novel locating system for accurate positioning of the casting in the measuring area [47].
The measuring process starts when the operator mounts the part on the transportation plate. Two button boxes are used to start the measurement cycle and require both hands to be occupied when an action is started by the operator. The part is fixed by pneumatic clamps and then transported into the working area, where the measurement process is conducted. If the part is within specifications, the system automatically unclamps the part, which allows the operator to remove it. If the part is not within specs, the operator has to push buttons to release the part, which then goes through a reprocessing step. The measurement cycle is repeated until the part is accepted or rejected if it could not be fixed. Results of a measurement are displayed on a computer screen and the data are sent to the Cloud.
The control and processing system coordinate all the functions of the equipment and manage the data from the process. Figure 6 shows the elements of this system: A Galil Controller (GC), a driver for the laser, an XDK Bosch multisensory, an accelerometer, and a minicomputer that coordinates the interaction of all and provides Connectivity.
The manner in which the hardware design meets the characteristics of flexibility, accuracy, robustness, and speed that are needed for in-line measurement are now discussed.

4.2.1. Flexibility

The proposed design includes a fast positioning system that uses linear motors and a laser sensor to perform the measuring actions. The use of the positioner allows the in-line machine to operate in a manner similar to a CMM, which can be adapted to variations in part size and geometry. In terms of the measurement functions that need to be performed, CMM are very flexible equipment. However, their flexibility comes at the expense of speed of measuring and cost of fixturing. Laser sensors are not as accurate and may be susceptible to variations in environmental conditions. On the other hand they are not hindered by the limitations of contact measurement sensors, which are inherently slow ([20,45]). The machine also includes a fixturing plate that holds the workpiece, and allows for quick part change. Parts of similar design may be measured on the same plate, and for parts of different designs, a new plate can be built.

4.2.2. Accuracy

In the proposed design, this characteristic is achieved by the performance capacities of the fixturing plate, the positioning system, and the laser probe. A positioner with a gantry design provides motion of the laser sensor in a plane. The use of linear guides and encoders allows a positioning accuracy of about 0.003 mm and a resolution of 0.001 mm. The laser sensor has a repeatability of 0.012 mm, with a ±40 mm measuring range from its focus length of 800 mm. That is, features within 40 to 120 mm distance from the sensor can be measured. The fixturing plate has three pins that define the reference plane (which fixes z and two angular positions), while two pins are used to locate the part in the remaining 3 degrees of freedom (in x, y, and the third angular position).
The part is made out of aluminum. The surface is generally smooth and reflecting. The measurement tries to identify sections of the part that may be thicker. As seen in Figure 7, flashing or the die’s heat checking (surface fatigue) marks may be present, depending on the tooling conditions. These are conditions that affect the quality of the part and the measurement process.

4.2.3. Robustness and Safety

In the proposed design, the laser and the linear motors need to be protected to allow for reliable operation. For this reason, the operations of part load unload and measurement were separated from each other. The operator handles the part in front of the machine. A pneumatic actuator inserts the part into the measurement volume. This volume is kept relatively isolated from the environment by an enclosure, which prevents debris and dust from affecting the linear guides or the laser. This enclosure also prevents the operator from being exposed to potentially harmful laser light and from reaching the machine’s moving elements.

4.2.4. Speed

A measuring cycle includes part setup and fixturing, data collection (measurement) time, and data processing time, which in this case includes calculations related to the measurements, display of the measurements, and data transfer to the Cloud. The mounting plate was designed to quickly mount and lock the casting in preparation for the measuring cycle. The part is fixed to the plate by pneumatic clamps. The total time to mount, fix, locate, extract, and dismount the part is not negligible, taking a little more than the time for the actual measurement cycle. As will be explained, the total time is competitive with the current gauging time (between 25 and 30 s in the lab), and both are much faster than any procedure used in a measuring room (with a CMM).

4.3. Control System Architecture and Connectivity

The design of the control architecture plays an important role in data collection and processing time. Figure 8 shows a functional analysis tree of the current measuring station. The system was conceived to measure the flatness of the casting and display the data. No provision was made to do any processing or storage of the measurement data.
In comparison, Figure 9 shows a section of the function tree of the new design. The main function, Monitor Casting, has several steps such as fix, position, and measure the part, display quality control results, provide safety to operators, monitor environmental conditions, and provide Connectivity to the system.
Compared with the current equipment, the new design adds a step, “Position part”. This step was added as a precaution to isolate the measuring probe and the environment’s positioning system as much as possible and while it does not contribute to improving the operation, it helps guarantee reliability. The other new functions, Provide Connectivity and Monitor the Environment, are intended to improve the intelligence of the control, and provide the capacity to respond to unexpected conditions. For example, information about the part, or about what the machine perceives from the environment can be used to anticipate and avoid conditions that can result in the waste of energy or resources. The machine performs a series of automatic functions once the part is placed on the fixturing plate: Clamp the part, insert it into the measuring volume, measure the target features, report to the operator the result of the measurements, and store selected data. The following sections describe how Connectivity was used to improve the capacity of the control system to monitor the product, the process, and adapt to changes. The result is an overall improved intelligence thanks to the access to the I4.0 resources provided by connectivity.

4.4. Implementation of Connectivity

In general, a control system for a measurement machine has four main components that work together to generate, condition, and analyze data: Sensors, edge devices, fog devices, and the Cloud. The implementation of Connectivity starts with the definition of the signals that need to be transported for analysis, as well as the place where processing will occur. Figure 10, which was derived from the frame introduced in Figure 1, maps the sources of data to the hardware and the level at which processing is performed for the in-line measuring machine.
As seen in Figure 10, the lowest level is where the basic signals are collected, and where actuators respond to impulses sent by the control of the machine. Generally, typical response time at this level is between 1 and 100 milliseconds and data capability management reaches from bits to megabytes. In this particular case, the devices at the lower level have the following characteristics:
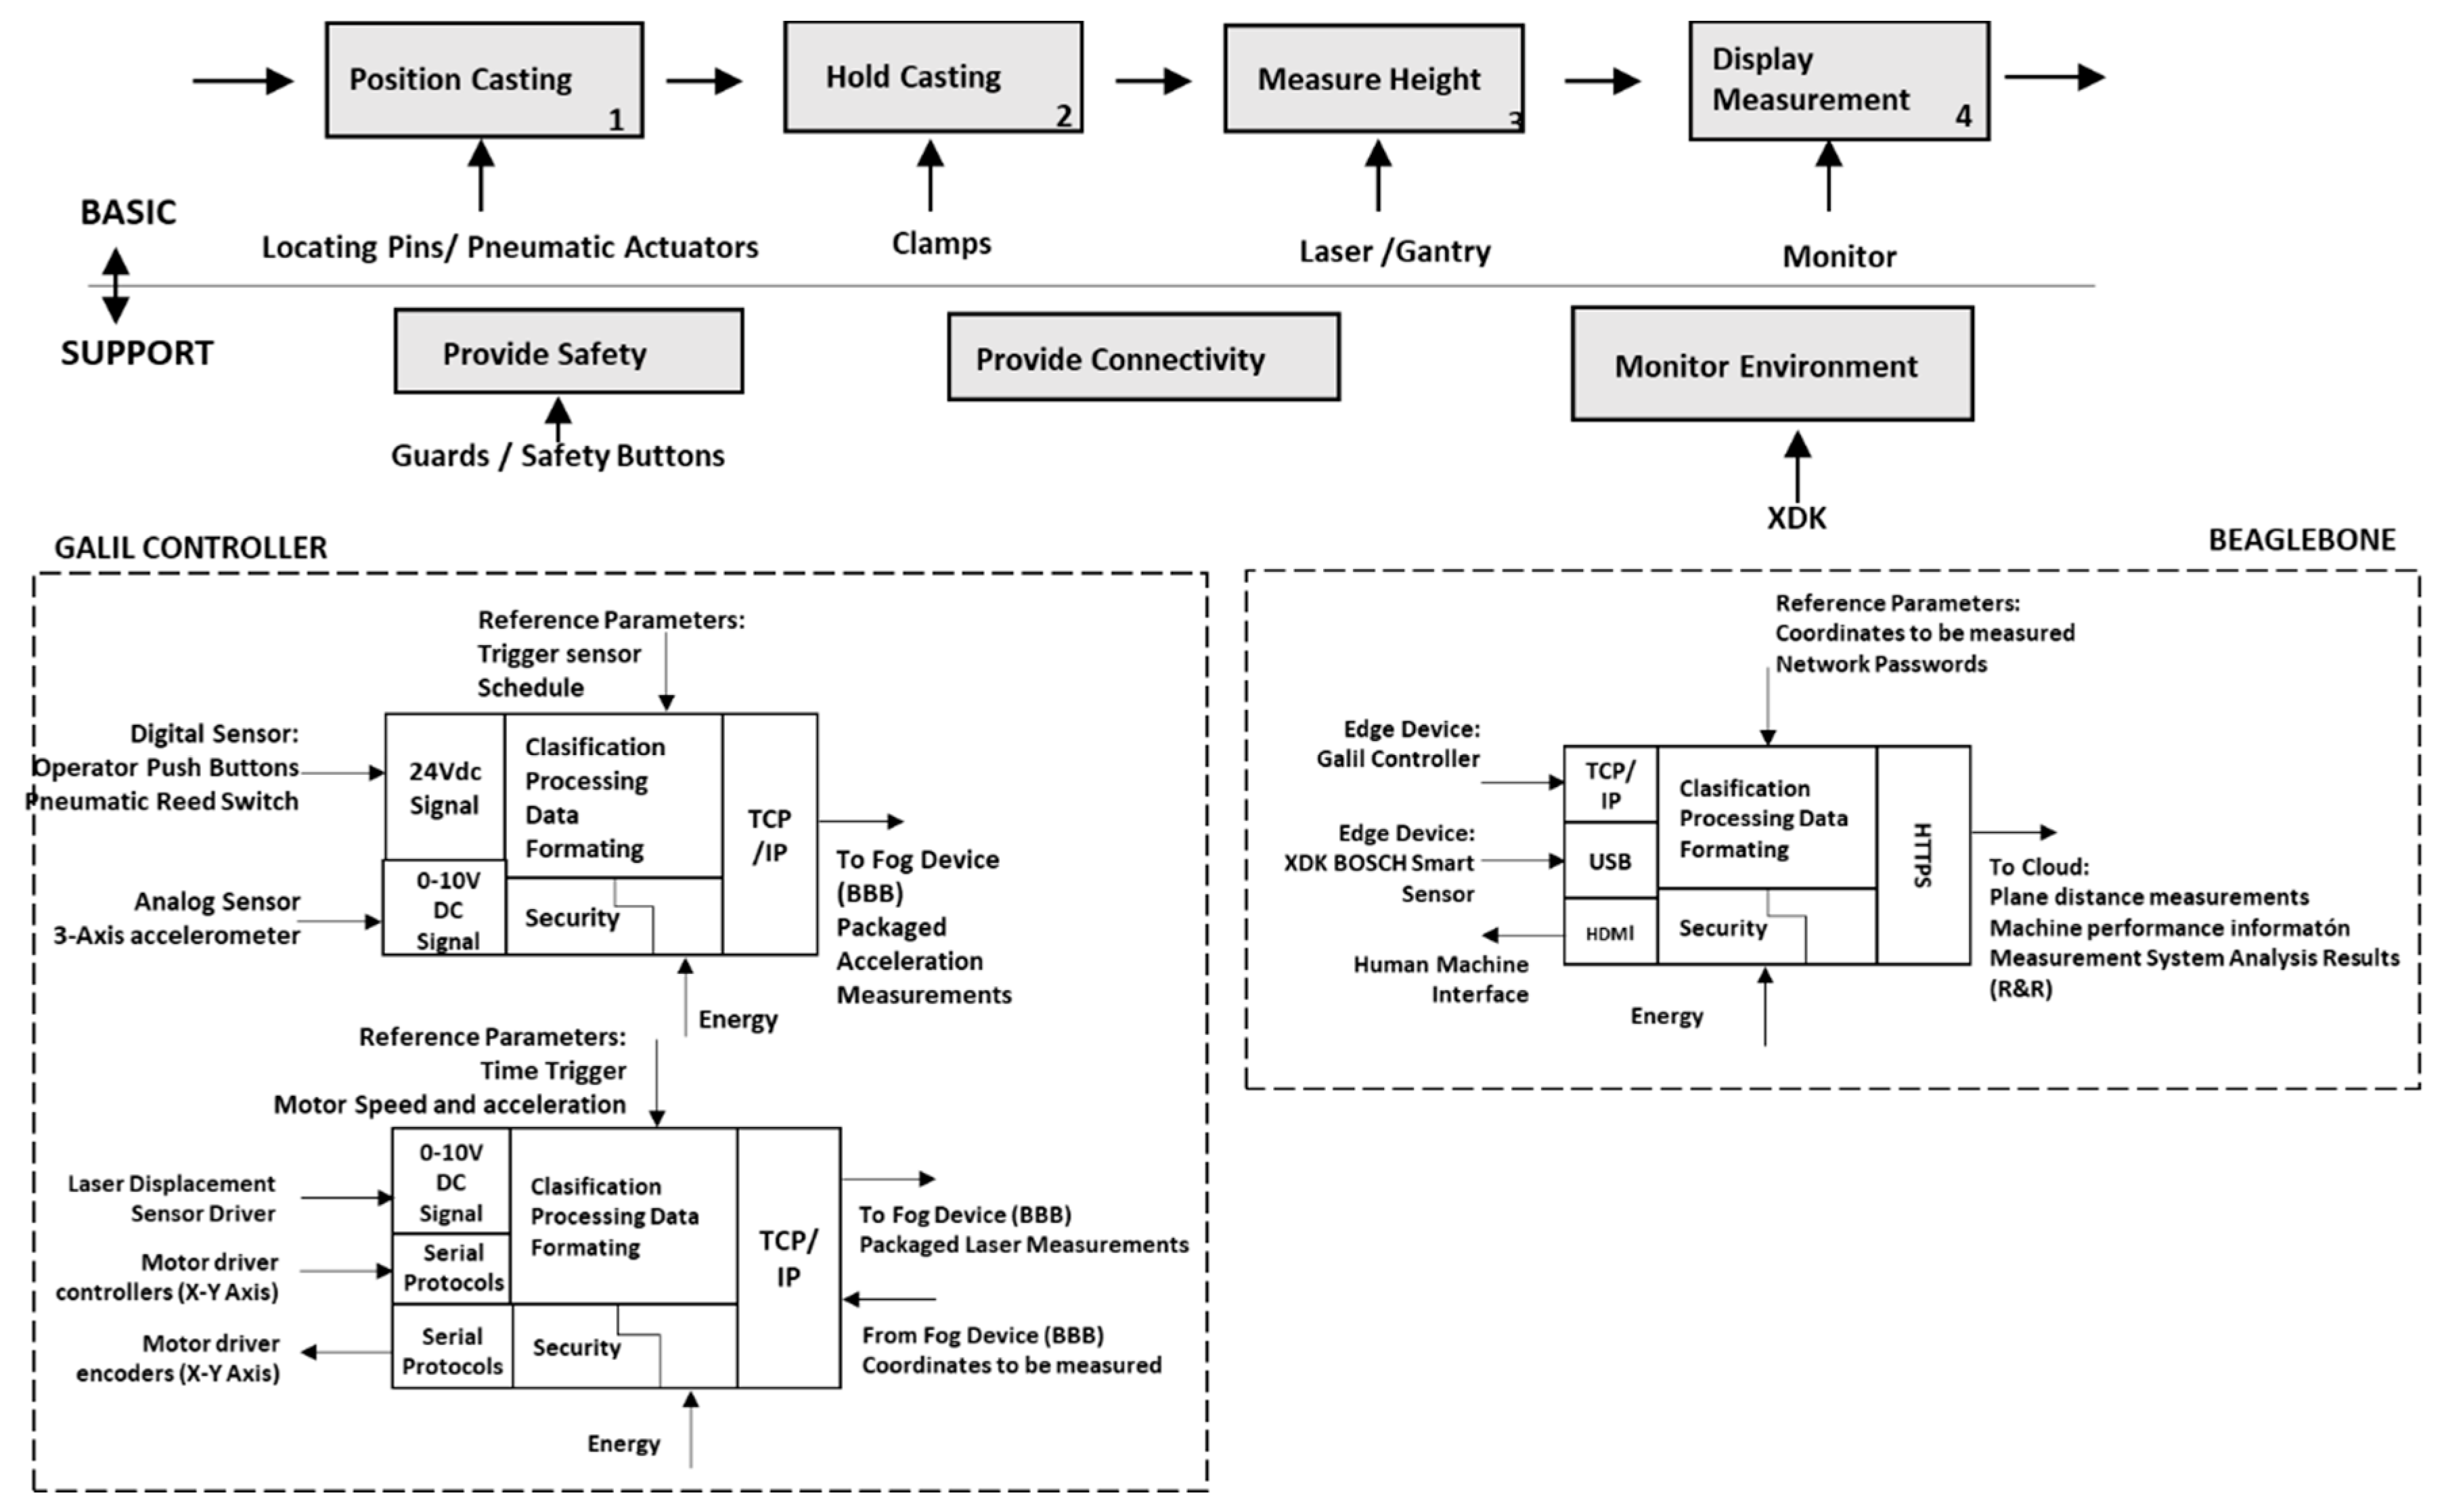
  • Laser displacement sensor (LDS): This instrument performs the essential basic function of the machine. It measures the height at specific locations of the workpiece. In this case, the laser is calibrated to perform 30 measurements at each location in about 0.080 s
  • Positioning system. This system transports the laser sensor to the location where measurements are made. It is actuated by linear motors, and has a travel space of 600 by 600 mm. The gantry system can reach speeds of 6 m/s, with a resolution of 0.001 mm. Linear encoders report the position of the laser head to the GC at any given instant.
  • Button box: The operator interacts with the control and paces the measurement process through the control buttons. After placing the part in the pallet, the operator can start the measuring process by pushing a button. The operator can also release the part, after the process, or can stop the process in an emergency situation. The time at which the start button is pushed is recorded and sent to the Cloud.
  • Pneumatic actuator: The actuator is responsible for transporting the part in and out of the measuring volume. Sensors are triggered when it reaches its limit positions.
  • 3-axis accelerometer (MMA7361): This sensor records the accelerations in different directions as the gantry goes through the measuring cycle. These data are intended to provide information about the health of the operation. The GC takes data from these accelerometers at a rate of 400 Hz approximately.
Edge computing takes place at the second level, where the processing devices, i.e., the GC and the LDS drive, receive data from the sensors, which is then filtered, classified, and formatted. The response time of those elements depends on the specific function they were programmed to perform. Specifically:
  • LDS Controller received data from the laser sensor. Processing at this stage consists of scaling, filtering, and mathematical operations. This control was programmed to obtain the average of 30 measurements, and then deliver these data to the GC. LDS driver sends its data via ethernet communication using UART protocol over RS-232C interface or by using analog signals from 0 to 10 Vdc.
  • Galil controller (GC) is responsible for coordinating and ordering the motion of the gantry, with the measurements taken by the laser. The controller synchronizes the data from both laser and encoders to form a coherent stream of data. In addition, data from the 3-axis accelerometer are also synchronized with the other signals. The control performs these operations in about 200 millisecond. For this purpose, it uses about 4 KB of its 32 KB capacity.
  • XDK BOSCH (XDK) is a platform of environmental sensors that monitor pressure, temperature, vibration, and humidity. XDK process capabilities allow edge computing to transform data in valuable information of the machine surroundings and give an intelligence level to the machine. Temperature, pressure, and humidity in the machine’s measurement area are collected at approximately 182 Hz. Data from accelerometers and gyroscopes can be reported at a rate of up to 2000 Hz.
It is important to note that there are no universally accepted definitions for Edge and Fog computing. In our case, we propose that the GC can be considered an edge device because it performs functions beyond data acquisition tasks. In addition to collecting data from the laser control, the GC coordinates other basic automatic functions: It processes the orders of the operator (start or stop the process), instructs the pneumatic clamps to hold the part, and the pneumatic stage to insert the part or remove it from the measurement area. Beyond these automatic functions, the controller displays a certain degree of intelligence. For example, the control reacts only when the operator has both hands at the button boxes, a safety feature, and unclamps the part to allow for removal only if all measurements are within specs.
The processing units that serve as Fog devices were chosen based on their processing capacity and on the interface they handle to facilitate connection. In this particular case, an embedded development platform, BeagleBone Red (BBR), was selected to serve as a fog computing stage due to additional features such as compact size, ease of programming, and flexibility. It can be connected with almost any type of device, from simple components, such as switches, to more complex devices, such as smart sensors, as well as to the Cloud.
As seen in Figure 10, the BBR receives information and data from the GC and the XDK. In this case, the BBR is mostly used as the manager and distributor of all the data. Part measurement data are sent to a screen and displayed in a manner that facilitates interpretation. Basically, measurements are displayed directly on an image of the workpiece. A green circle is shown when measurements are within specification; measurements out of specification are shown in red. The BBR also conditions and formats the data to be transmitted to the Cloud. The protocol used is HTTPS with a post method using a URL address. Data are saved on a Google drive where the engineering department of the factory monitors the measuring process. The response time at the fog computing level is less than 2 s. Most of this is needed to display the measurement data on the HMI. The continuous data handling requirement in each cycle is around 600 KB, which corresponds to all information that is sent to the Cloud. Because the BBR is the closest device to the IoT gateway (the node to the LAN), this work proposes that it may be considered a Fog Device.
Figure 11 presents an integrated diagram of the functions performed by the machine. The functions associated with Connectivity are presented in more detail, and describe the type of signal that is being processed as well the protocol used.
The last stage is the connection to the Cloud. In this particular case, the BBR is the only device with Internet access. The BBR was configured to access the company´s WLAN to get a secure connection with the Cloud. A request using HTTP to an URL hosted was used for sending data to the virtual Cloud through a Wi-Fi adapter. A BBR application was developed using Qt Creator, which has a code editor with support for C+. The library of C+ that allows HTTP method is “curl”, which is an open-source code used in command lines or scripts to transfer data [48].
The program that receives and writes data from BBR code to the virtual Cloud is an App script of Google drive with the “doGet” function. Data are saved in seven different spreadsheets within a Google spreadsheet, and consequently seven apps scripts were developed to save data. The structure of “doGet” function is shown in Appendix A. Each group of data received is saved with a timestamp, which recorded the date and hour. The information that is stored in each sheet is described in Table 1. This information is available for the engineering team in real-time.
It is important to note that free cloud services such as Google’s are invaluable while the system is under design. However, reliability and robustness cannot be expected from these services once the system is released for operation. For this reason, an account was created in a commercial cloud system. The same data that were uploaded to the free service were stored in the new account.
To facilitate process monitoring, a dashboard was created to display process performance. In addition to the data traces, parameters such as Active Time and Machine Utilization are reported. Figure 12 shows the dashboard for a specific case. The ranges of measurements and stops are clearly visible. The user can establish the time span for which the analysis is requested.
To calculate the utilization rate, some basic definitions were needed. The cycle time Δ t , defined as the time lapse between consecutive activations of the start button, is not a constant. A vector that contains N cycle times for a given period is first calculated, where t represents the clock time when the start button is pushed:
Δ t n = t n + 1 t n
A second definition is an active time ( Δ T m ), which represents a particular instance of the cycle time in which it can be assumed that the machine is in use. To calculate this vector, a trimmed vector Δ t r n is extracted out of the lapse vector Δ t n by removing all instances in which the lapse exceeds 100 s. After this, an instance of the active time vector is obtained whenever a lapse is smaller than 3 times the mean value of the trimmed vector. The resulting vector Δ T m contains M elements, where M < N. Essentially:
Δ t r n Δ t n |   Δ t n < 100
Δ T m Δ t r n   |   Δ t r n < 3 Δ t r n ˜
The utilization rate is then given by the total active time divided by the time under analysis as shown in Equation (4).
U a c = m = 1 M Δ T m n = 1 N Δ t n × 100 %
where
Δ t n = nth element of the lapse vector
Δ T m = mth element of the Active time vector
Δ t r n ˜ = mean of the trimmed lapse vector
Δ t n = Total observation time
Δ T m = Total active time
U a c = Utilization rate
M = size of the trimmed vector
N = size of vector containing the measurement cycles for selected time lapse

5. Assessment of Machine Performance

Following the previous description, a prototype of the in-line measuring machine was built. This version of the machine was intended primarily for use in the laboratory, but it was also considered suitable for use in the plant for limited runs. The machine was deployed in a production line and was tested in relatively short runs, of around 400 parts or so, on multiple occasions over a period of 18 months. The system was used only for test purposes or as a redundant operation during this time. Figure 13 shows the prototype in different settings. This section presents an assessment of the system’s performance, based on the characteristics that were described in Section 2.
The first target characteristics for an in-line measuring system are accuracy and repeatability. Part measurement immediately after manufacture is highly susceptible to shop conditions, particularly to variations of temperature [19]. Other important factors include operator skill and capacity of the measuring system. In this case, the target was to score better than 0.1 (10%) in a gauge repeatability and reproducibility (R&R) test for each of the points being measured. The prototype machine operates in one of two different modes: (workpiece) measurement and (R&R) test. The normal measurement mode is used when production is being monitored. In the test mode, a Gage R&R algorithm based on ANOVA technique implemented in the BBR is applied to check the process.
A typical R&R test involves 10 different parts and 3 different operators. Each operator tests each part 3 times in a randomized manner (19 measurement points). Results of the measurements are analyzed to assess the repeatability (due mostly to machine performance) and reproducibility (due mainly to the operator’s skill and training) of the measurement process. Appendix B presents some details of this algorithm. The Gage R&R study, environmental data, and acceleration registered by the 3-axis accelerometer are sent to the Cloud by the BBR.
Table 2 shows the results of several tests performed in the lab prior to shipping to the plant, and subsequent trials on the shop floor. Tests were performed periodically per standard practices. In particular, given that the machine was used during specific intervals of production, a test had to be made after re-installation and before use in the production line.
The reported data shows that the system was capable of performing up to the standard required by the application (less than 10%). It is important to notice that tests on the shop floor included one more point for measurement than the lab tests. The engineering department requested this additional data for a feature that had raised concerns.
The second design characteristic is speed. The initial target was to perform a measuring cycle from part mount to part dismount for 20 to 25 s. Vibration and shock affect the repeatability of the system. For this reason, experiments were made to establish how fast the system could move and still deliver an accurate measurement. In the end, a measuring cycle that consisted of five steps took the following times:
  • Part clamp and insertion into the workspace: 6 s.
  • Measurement cycle: 9 s.
  • Part extraction and unclamp: 5 s.
  • Handling of the part to load and unload. In these cases, time varies depending on the operator’s training.
In the lab, the best times that could be achieved were around 28–29 s from part to part. On the other hand, operators in the field achieved as little as 22 s from part to part after gaining familiarity with the process. Figure 14 shows a histogram of part to part time for data reported in the last experimental campaign of the machine. The fastest times would correspond to parts that pass the test without problems. In other cases, some part fixing takes place, which extends the time it takes to start a new cycle.
The analysis in Figure 14 was performed with data obtained from the Cloud. In total, 957 measuring cycles are included in the data. Notable figures: A total of 383 parts were measured in 31 s or less, 467 in 32 s or less, 693 in 41 s or less, and 713 in 42 s or less.
Flexibility, or the capacity to adapt to different part geometries was addressed by two design features. From the hardware perspective, a new product design can be fitted into the machine measuring area by modifying the clamping plate. Depending on the product’s geometry, the modification may be minor (modify the position of locating pins or clamps), or an entirely new plate may be necessary. The clamping plate’s cost is less than 5% of the machine’s cost, which is a very modest figure as far as tooling is concerned. The other modification is to change the coordinates of the points to be measured. Modification of a coordinate point requires editing a table and recompilation of the program. Even though the ideal would be to have a programmable user interface, the time it takes to make the modification in the current system is relatively insignificant (a few minutes). Modifications of this sort in the standard equipment are not feasible at all.
As an architecture characteristic, safety is intrinsic to the design of the machine. In this case, isolation of the measuring volume greatly diminished the risk of harm to the operator or to sensitive components. A condition that was overlooked during design was the potential risk that the pneumatic clamps pose to the operator as they are activated. This concern was raised by the process engineering team as soon as the machine was placed on the shop floor. The problem was eliminated by adding a safety button, which needs to be pressed simultaneously with the main control buttons to begin the clamping and measuring cycle. This forces the operator to place both hands outside the area where the clamps operate. During the machine’s trial period, no personnel injuries or hazardous conditions (other than the need for the double button safety feature) were reported.

6. Discussion

The diagrams presented in Figure 10 and Figure 11 provide a clear representation of the hard connections and the data formats being used. They are particularly helpful for documentation. For the purposes of design, the diagrams can be used as the starting point for the design of Connectivity.
In principle, Connectivity allows the transfer of data from different sources to the Cloud. This in turn opens up new options for the purposes of monitoring, forecasting, and controlling operations on the shop floor. In certain instances, the information that can provide a glimpse to the health of the operation is relatively obvious. In other cases, experience will dictate what kind of information can be extracted out of the data.
An example of the type of information that was anticipated as useful during the design stage is the knowledge that can be obtained from the time stamp associated with each entry into the cloud datasheet. These data can be used to monitor cycle times and machine uptime. A direct application of this concept was shown in Figure 14, which was used to analyze the time it takes operators to go from part to part. A target specification was to perform the measuring cycle in 20–25 s. This value was based on the time it takes for the current system.. On the shop floor, operators were able to get closer to the minimum value but did not quite reach the optimum. However, during interviews with the operators, this shortcoming was completely ignored as an area of opportunity. Basically, operators felt comfortable with the performance of the machine in this regard. This indicates that there are other factors that may play a more important role in the effectiveness of the measuring process, such as the time to fix the part, or casting process uptime.
Another example of knowledge that can be extracted from the time stamp is machine utilization and uptime. The dashboard presented in Figure 12 illustrates this use. A simple glance at the data allows a supervisor to visualize the pace of production. However, automatic extraction of information from the data is not a straightforward task. Equations (1) through (4) were developed to make the pertinent calculations. While simple, the terminology had to be developed in such a way that the correct information is communicated. As in the case of the cycle time, this information is derived directly from the time saved in the sheets and its use was anticipated from the start of the development process. A potential use of this information is a better synchronization of this operation with other stations to optimize material flow, or monitoring of operator fatigue. Implementation would require the use of more sophisticated analysis techniques.
For the most part, the data produced by ambient sensors and accelerometers require analysis before an application is developed. Figure 15a shows an interesting behavior of the positioning system. As the ambient temperature rises, the maximum acceleration reached by the system appears to increase too, which is consistent with experience. The temperature measurement is made inside the measurement volume of the machine, and the rise may be caused by a combination of the environment around the machine as well as the heat generated by the linear motors as they perform their duties. The behavior seems to indicate that as the environment increases its temperature, the machine can reach higher speeds. This would be consistent with the observation that as the shift progresses, cycle times are reduced, as shown in Figure 15b. The reduction in cycle time may be caused by the combination of factors such as a faster machine and operator improved dexterity as the process progresses. A safe recommendation is to try to maintain the machine running as consistently as possible to allow for it to reach its maximum speeds. However, this correlation needs to be studied further before other recommendations can be made.
A similar situation is seen in the accelerometer data, which can provide relevant information about the performance of a machine. As in the previous case, acceleration patterns need to be analyzed before any type of predictions can be made. Figure 16a,b shows histograms of the maximum accelerations that the positioning system can achieve during the measurement cycle in our machine design. These values are reported by the accelerometers placed on the Gantry machine and constitute a baseline for what can be considered normal behavior.
The XDK sensor provides acceleration values, along with ambient temperature, pressure, and humidity. In this case, the XDK was set up to report peak values between measuring cycles, while the Gantry positioner is at rest. A typical histogram is shown in Figure 16c. An example of information that could be extracted out of the combined data, but that was not anticipated at the design stage, surfaced after several hundreds of measurement cycles in a particular trial run. At some point in the operation, part measurements deviated considerably out of range (Figure 16d). The operator stopped the machine and observed that one of the positioning plate support pins had been separated from the plate. Upon inspection, it was determined that the screw that was holding the pin in place became loose. An analysis of the environment data showed that prior to the faulty measurements, the accelerometer had picked up a large spike, in excess of 0.25 g in both X and Y, which could be interpreted as an impact. A few cycles after this event, measurements at specific points of the workpiece started to divert considerably. Had the acceleration parameter been monitored, a warning could have been given so that maintenance crews could have checked the machine. A feature of this type is a clear example of the improved intelligence that is derived from monitoring the environment and adapting the process as more knowledge is gained. While the problem was relatively minor in terms of the fix that was needed (it took about 10 min to reattach and glue the screw) it still knocked the machine out of production for more than one shift while the orders to diagnose the problem and implement the solution were made. Full data for this event were reported in [24].
Connectivity in the plant was achieved through a Wi-Fi connection that was available for guests. It was possible to observe the efficacy of the process of sending data to the Cloud during R&R tests performed on the shop floor. It was standard practice to bring a laptop next to the machine and monitor how data were being registered on the Google Sheet. Data would be available within a couple of seconds of completion of a measuring cycle. However, during these tests, about once in every 250 cycles a measurement would not reach the Cloud. This performance could be improved by dedicating a connection for this process.
Overall, the design of the prototype in-line measuring machine proved to be able to meet the expectations of the shop conditions. The introduction of the clamping plate and moving sensor with a programmable path improved the flexibility/adaptability of the equipment. While highly desirable, these modifications represent an incremental improvement with respect to the equipment that is currently deployed on the shop floor. Connectivity on the other hand is what allows the new concept to establish itself as a new generation with respect to the equipment that it is intended to replace. The information that can be obtained about the process is a powerful new tool that can be used to improve the overall efficiency of the manufacturing operation.

7. Conclusions and Future Work

This work proposed that Connectivity as a design function allows the introduction of Industry 4.0 principles into the architecture of production equipment. Connectivity allows powerful computer resources to interact with the machine control to improve the capacity to monitor and adapt to changes in the environment, in essence improving the intelligence of the process. The article also explained the importance of in-line metrology for the new generation of smart factories. The advantages and opportunities that these concepts offer were explored through the development of an in-line measuring machine.
This work also showed how functional decomposition techniques could be used to clarify the role of Connectivity. A connectivity block was presented for use in IDEF0 type diagrams. Diagrams that used these representations of Connectivity were presented. Their goal was to show how Connectivity was implemented in the particular architecture of the machine. They are particularly useful for documentation.
The design principles and methodology presented in this work were applied to the design, construction, and testing of an in-line measuring machine that accomplishes the features of flexibility, accuracy, robustness, and speed. In addition to those features, the machine is ready for a smart factory (Industry 4.0) environment as a result of the added dimension of intelligence through Connectivity.
This case demonstrated that Connectivity offers the potential to improve the efficiency of the operation. It should be noted that while implementation added little cost, there were costs associated with managing and maintaining the hardware and software. There were also issues of reliability and robustness. For example, missing data from a faulty sensor can cause the system to crash. Therefore, it is important to address questions about the data that will be collected, analyzed, processed, and stored as early as possible in the design stage in such a way that risks can be assessed.
At this stage of the development of the prototype, all of the analysis has been done by humans. The dashboard presents information that administrators can use to understand the process in more depth and develop practices that can lead to a more efficient operation. A few examples of the types of improvements that can be made to the control to reflect the improved intelligence have already been described. Specifically, adding a variable to monitor peak acceleration and generate a warning when a specific value is exceeded represents one case. Future work includes the implementation of these features or the control of the machine, specifically, the design of a dashboard for engineering that includes warnings.
Making the best use of new technologies is not a straightforward process. Szalavetz argues that the skill sets for “innovation capabilities” are different from those associated with “production capabilities”. Design, engineering, and testing are key competences of innovation capability [23]. In this regard, the application case presented here provides valuable experience for the user of the in-line measuring station.
There are a number of opportunities for further work. The most important area of interest that was not addressed in this exercise was cybersecurity. In the current design, no automatic feedback was programmed to make modifications in the measurement cycle. Consequently, no provisions were made to safeguard the data other than what was afforded by the normal vendor services or what is built into the data transfer protocols and what the LAN provided. Without a doubt, this approach will have to be revisited during the development of a new version of the machine. The second direction to take should be the implementation of automatic responses or warning to changes in the environment.

Author Contributions

Conceptualization, H.A.-G., T.R.K. and E.G.d.C.; methodology, A.P.C.-M., D.G.-L. and M.F.M.-A.; validation, H.A.-G., P.D.U.C., P.A.O.C., T.R.K. and E.G.d.C.; formal analysis, A.P.C.-M., D.G.-L. and M.F.M.-A.; supervision, H.A.-G., P.D.U.C. and P.A.O.C.; writing—original draft preparation, H.A.-G.; writing—review and editing, P.D.U.C., P.A.O.C., T.R.K. and E.G.d.C. All authors have read and agreed to the published version of the manuscript.

Funding

This research received no external funding.

Acknowledgments

The authors wish to acknowledge the support of the Automotive Consortium for Cyberphysical Systems at Tecnológico de Monterrey.

Conflicts of Interest

The authors declare no conflict of interest.

Appendix A. DoGet Script

Code for DoGet script to store data in the Cloud. Written un Javascript. This function was adapted to write different data in 7 worksheets.
Figure A1. DoGet script for sending data to the Cloud.
Applsci 11 01312 g0a1

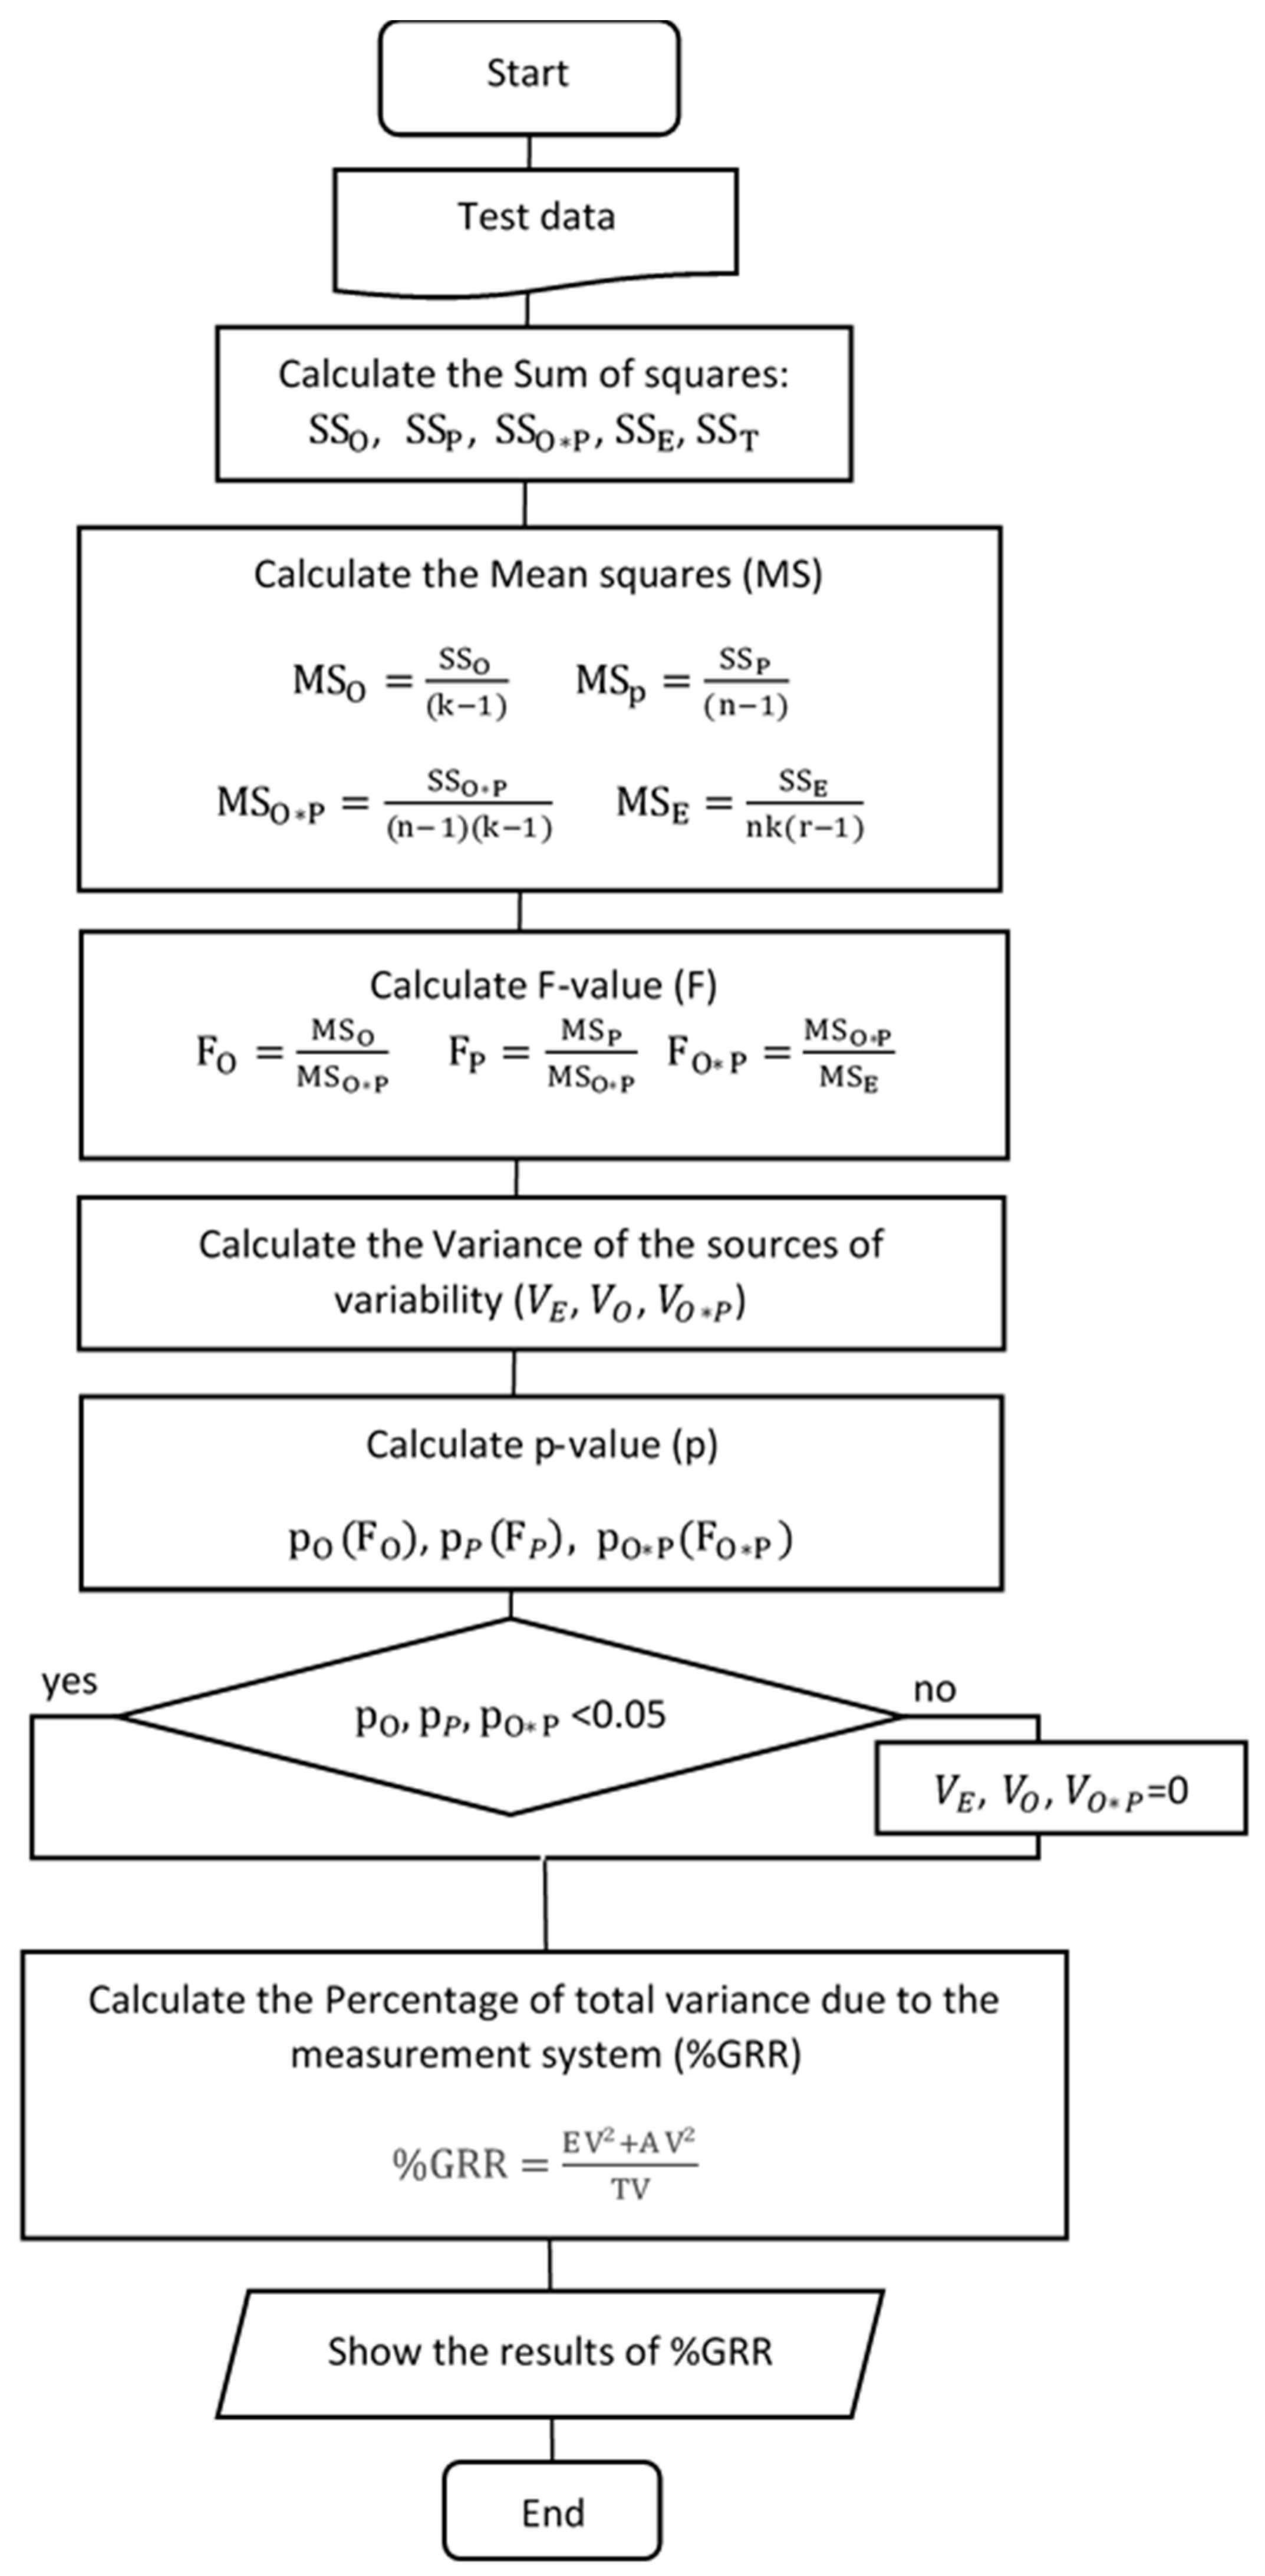
Appendix B. R&R Program Flow Chart

The input data are taken from the corresponding google sheet in the Cloud. Ninety measurement lines (10 different parts, 3 operators measuring each part 3 times). Each line contains 19 different point heights.
Figure A2. Procedure followed by the R&R program. where: k = number of operator; r = number of replications; n = number of part; SS = sum of squares; MS = Mean square; F = F value; P = p value; V = variance; GRR = total variance due to the measurement system; %GRR = percentage of the total variance due to the measurement system. Sub index notation: O = operator; P = part; O*P = operator by part; E = equipment; T = total.
Applsci 11 01312 g0a2

References

  1. Da Xu, L.; Xu, E.L.; Li, L. Industry 4.0: State of the art and future trends. Int. J. Prod. Res. 2018, 56, 2941–2962. [Google Scholar]
  2. Ahuett-Garza, H.; Kurfess, T. A brief discussion on the trends of habilitating technologies for Industry 4.0 and Smart manufacturing. Manuf. Lett. 2018, 15, 60–63. [Google Scholar] [CrossRef]
  3. Huh, J.-H.; Lee, H.-G. A Cost-Effective Redundant Digital Excitation. Processes 2018, 6, 29. [Google Scholar]
  4. Awan, M.D.; Khiyal, M.S.H. Big Data in Cloud Computing: A Resource. Sci. Prog. 2018, 2018, 5418679. [Google Scholar]
  5. García-Garza, M.A.; Ahuett-Garza, H.; Lopez, M.G.; Orta-Castañón, P.; Kurfess, T.R.; Urbina Coronado, P.D.; Güemes-Castorena, D.; Villa, S.G.; Salinas, S. A Case about the Upgrade of Manufacturing Equipment for Insertion into an Industry 4.0 Environment. Sensors 2019, 19, 3304. [Google Scholar] [CrossRef] [Green Version]
  6. Huh, J.-H.; Lee, H.-G. Simulation and Test Bed of a Low-Power Digital Excitation System for Industry 4.0. Processes 2018, 6, 145. [Google Scholar] [CrossRef] [Green Version]
  7. Park, S.; Huh, J. Development and Test Bed for Successful Industry 4.0 Project: Safety Management for Security. Processes 2018, 6, 88. [Google Scholar] [CrossRef] [Green Version]
  8. Lee, J.; Bagheri, B.; Kao, H.A. A Cyber-Physical Systems architecture for Industry 4.0-based manufacturing systems. Manuf. Lett. 2015, 3, 18–23. [Google Scholar] [CrossRef]
  9. Rosen, R.; Von Wichert, G.; Lo, G.; Bettenhausen, K.D. About the importance of autonomy and digital twins for the future of manufacturing. IFAC-PapersOnLine 2015, 28, 567–572. [Google Scholar] [CrossRef]
  10. Chen, B.; Wan, J.; Shu, L.E.I.; Member, S. Smart Factory of Industry 4.0: Key Technologies, Application Case, and Challenges. IEEE Access 2018, 6, 6505–6519. [Google Scholar] [CrossRef]
  11. Croccolo, D.; Cavalli, O.; De Agostinis, M.; Fini, S.; Olmi, G.; Robusto, F.; Vincenzi, N. A Methodology for the Lightweight Design of Modern Transfer Machine Tools. Machines 2018, 6, 2. [Google Scholar] [CrossRef] [Green Version]
  12. Gao, R.X.; Wang, P. Through Life Analysis for Machine Tools: From Design to Remanufacture. Procedia CIRP 2017, 59, 2–7. [Google Scholar] [CrossRef]
  13. Cheng, K.; Niu, Z.C.; Wang, R.C.; Rakowski, R.; Bateman, R. Smart Cutting Tools and Smart Machining: Development Approaches, and Their Implementation and Application Perspectives. Chin. J. Mech. Eng. 2017, 30, 1162–1176. [Google Scholar] [CrossRef] [Green Version]
  14. Schauerte, H.; Reifferscheid, M.; Vogel, B. Derivation of a generic architecture proposal. Prod. Eng. 2019, 13, 247–257. [Google Scholar]
  15. Åkerman, M.; Stahre, J.; Engström, U.; Angelsmark, O.; McGillivray, D.; Holmberg, T.; Bärring, M.; Lundgren, C.; Friis, M.; Fast-Berglund, Å. Technical Interoperability for Machine Connectivity on the Shop Floor. Technologies 2018, 6, 57. [Google Scholar] [CrossRef] [Green Version]
  16. Yang, H.; Wang, Z.; Zhang, T.; Du, F. A review on vibration analysis and control of machine tool feed drive systems. Int. J. Adv. Manuf. Technol. 2020, 107, 503–525. [Google Scholar] [CrossRef]
  17. Sato, R.; Hayashi, H.; Shirase, K. Active vibration suppression of NC machine tools for high-speed contouring motions. J. Adv. Mech. Des. Syst. Manuf. 2020, 14, JAMDSM0005. [Google Scholar] [CrossRef]
  18. Moriwaki, T.; Shirase, K. Intelligent machine tools: Current status and evolutional architecture. Int. J. Manuf. Technol. Manag. 2006, 9, 204–218. [Google Scholar] [CrossRef]
  19. Mutilba, U.; Sandá, A.; Vega, I.; Gomez-Acedo, E.; Bengoetxea, I.; Fabra, J.A.Y. Traceability of on-machine tool measurement: Uncertainty budget assessment on shop floor conditions. Measurement 2019, 135, 180–188. [Google Scholar] [CrossRef]
  20. Weckenmann, A.; Krämer, P.; Hoffmann, J. Manufacturing metrology–state of the art and prospects. In Proceedings of the 9th Internacional Symposium on Measurement and Quality Control, Chennai, India, 21–24 November 2007; pp. 1–8. [Google Scholar]
  21. Weckenmann, A.; Krämer, P.; Akkasoglu, G. Metrology—Base for Scientific Cognition and Technical Production. Adv. Mater. Res. 2012, 498, 169–176. [Google Scholar] [CrossRef] [Green Version]
  22. Koren, Y.; Gu, X.; Guo, W. Reconfigurable manufacturing systems: Principles, design, and future trends. Front. Mech. Eng. 2018, 13, 121–136. [Google Scholar] [CrossRef] [Green Version]
  23. Szalavetz, A. Technological Forecasting & Social Change Industry 4.0 and capability development in manufacturing subsidiaries. Technol. Forecast. Soc. Chang. 2019, 145, 384–395. [Google Scholar]
  24. Ahuett-Garza, H.; Urbina Coronado, P.D. A Reference Model for Evolving Digital Twins and Its Application to Cases in the Manufacturing Floor. Smart Sustain. Manuf. Syst. 2019, 3, 20190049. [Google Scholar] [CrossRef]
  25. Lasi, H.; Kemper, H.; Fettke, P.; Feld, T.; Hoffman, M. Industry 4.0. Bus. Inf. Syst. Eng. 2020, 6, 239–242. [Google Scholar] [CrossRef]
  26. Molina, A.; Rodriguez, C.A.; Ahuett, H.; Cortés, J.A.; Ramírez, M.; Jiménez, G.; Martinez, S. Next-generation manufacturing systems: Key research issues in developing and integrating reconfigurable and intelligent machines. Int. J. Comput. Integr. Manuf. 2005, 18, 525–536. [Google Scholar] [CrossRef]
  27. Andersen, A.L.; Brunoe, T.D.; Nielsen, K.; Rösiö, C. Towards a generic design method for reconfigurable manufacturing systems: Analysis and synthesis of current design methods and evaluation of supportive tools. J. Manuf. Syst. 2017, 42, 179–195. [Google Scholar] [CrossRef]
  28. Karimi, D.A.K. What the Internet of Things (IoT) Needs to Become a Reality; White Paper; FreeScale and ARM: Cambridge, UK, 2013; pp. 1–16. [Google Scholar]
  29. Stock, T.; Seliger, G. Opportunities of Sustainable Manufacturing in Industry 4.0. Procedia CIRP 2016, 40, 536–541. [Google Scholar] [CrossRef] [Green Version]
  30. Borgia, E. The internet of things vision: Key features, applications and open issues. Comput. Commun. 2014, 54, 1–31. [Google Scholar] [CrossRef]
  31. Gorecky, D.; Schmitt, M.; Loskyll, M.; Zühlke, D. Human-machine-interaction in the industry 4.0 era. In Proceedings of the Proceedings—2014 12th IEEE International Conference on Industrial Informatics (INDIN), Porto Alegre, Brazil, 27–30 July 2014. [Google Scholar]
  32. Gai, K.; Qiu, M.; Xiong, Z.; Liu, M. Privacy-preserving multi-channel communication in Edge-of-Things. Future Gener. Comput. Syst. 2018, 85, 190–200. [Google Scholar] [CrossRef]
  33. Dastjerdi, A.V.; Buyya, R. Fog Computing: Helping the Internet of Things Realize Its Potential. In Computer; IEEE: Long Beath, CA, USA, 2016; Volume 49, pp. 112–116. [Google Scholar]
  34. Wan, J.; Canedo, A.; Al Faruque, M.A. Functional Model-Based Design Methodology for Automotive Cyber-Physical Systems. IEEE Syst. J. 2015, 11, 2028–2039. [Google Scholar] [CrossRef]
  35. Van Eck, D.; McAdams, D.A.; Vermaas, P.E. Functional decomposition in engineering: A survey. In Proceedings of the ASME International Design Engineering Technical Conferences and Computers and Information in Engineering Conference, DETC2007, Las Vegas, NV, USA, 4–7 September 2007; American Society of Mechanical Engineers: New York, NY, USA, 2008; Volume 3, pp. 227–236. [Google Scholar]
  36. Wixson, J.R. Function Analysis and Decomposistion using Function Analysis Systems Technique. INCOSE Int. Symp. 1999, 9, 800–805. [Google Scholar] [CrossRef] [Green Version]
  37. Arlitt, R.; Van Bossuyt, D.L.; Stone, R.B.; Tumer, I.Y. The Function-Based Design for Sustainability Method. J. Mech. Des. 2017, 139, 041102. [Google Scholar] [CrossRef]
  38. Umeda, Y.; Ishii, M.; Yoshioka, M.; Shimomura, Y.; Tomiyama, T. Supporting conceptual design based on the function-behavior-state modeler. Artif. Intell. Eng. Des. Anal. Manuf. 1996, 10, 275–288. [Google Scholar] [CrossRef] [Green Version]
  39. Jensen, D.C.; Tumer, I.Y. Modeling and analysis of safety in early design. Procedia Comput. Sci. 2013, 16, 824–833. [Google Scholar] [CrossRef] [Green Version]
  40. Kiraci, E.; Franciosa, P.; Turley, G.A.; Olifent, A.; Attridge, A.; Williams, M.A. Moving towards in-line metrology: Evaluation of a Laser Radar system for in-line dimensional inspection for automotive assembly systems. Int. J. Adv. Manuf. Technol. 2017, 91, 69–78. [Google Scholar] [CrossRef] [Green Version]
  41. Imkamp, D.; Berthold, J.; Heizmann, M.; Kniel, K.; Manske, E.; Peterek, M.; Schmitt, R.; Seidler, J.; Sommer, K.D. Challenges and trends in manufacturing measurement technology—The “industrie 4.0” concept. J. Sens. Sens. Syst. 2016, 5, 325–335. [Google Scholar] [CrossRef] [Green Version]
  42. Bauza, M.B.; Tenboer, J.; Li, M.; Lisovich, A.; Zhou, J.; Pratt, D.; Edwards, J.; Zhang, H.; Turch, C.; Knebel, R. Realization of Industry 4.0 with high speed CT in high volume production. CIRP J. Manuf. Sci. Technol. 2018, 22, 121–125. [Google Scholar] [CrossRef]
  43. Recalls-Probes-Reshape-Auto-Industry-Heading-Into-2020s. Available online: https://www.cnbc.com/2019/12/27/recalls-probes-reshape-auto-industry-heading-into-2020s.html (accessed on 8 May 2020).
  44. Ahsan, K. Trend Analysis of Car Recalls: Evidence from the US Market. Int. J. Manag. Value Supply Chains 2013, 4, 1–16. [Google Scholar] [CrossRef]
  45. Van Vliet, W.P.; Schellekens, P.H.; Engineering, S.P. Accuracy Limitations of Fast Mechanical Probing. CIRP Ann. 1996, 45, 483–487. [Google Scholar] [CrossRef] [Green Version]
  46. Bucher, J.L. The Quality Calibration Handbook: Developing and Managing a Calibration Program; ASQ Quality Press: Milwaukee, WI, USA, 2007; ISBN 9780873897044. [Google Scholar]
  47. Guamán-Lozada, D.; Ahuett-Garza, H.; Castro-Martin, A.P.; Ruiz-Carrizal, J.; Márquez-Alderete, M.F.; Anaya-Aranda, J.G.; Kurfess, T.R.; González de Castilla, E. Design and testing of a positioning system based on a quasi kinematic guide and a clamp plate suspended by compliant straps for in-line metrology systems. Manuf. Lett. 2020, 24, 19–22. [Google Scholar] [CrossRef]
  48. Langr, J. Modern C++ Programming with Test-Driven Development; Pragmatic Bookshelf: Raleigh NC, USA, 2013; ISBN 978-1-93778-548-2. [Google Scholar]
Figure 1. A map of technologies and protocols to facilitate Connectivity.
Applsci 11 01312 g001
Figure 2. A frame to describe the interaction among different elements that constitute the intelligence provided by I4.0.
Applsci 11 01312 g002
Figure 3. Provide Connectivity function block. Specific actions are performed in this function, as data flows in either direction.
Applsci 11 01312 g003
Figure 4. Workpiece process. The robot takes the part from the die casting machine (1) and submerges it in a water tank (2). The robot then inserts the part in a trim die, where excess material is removed. The workpiece is then delivered to a measuring station to check the flatness of the surface of the casting.
Applsci 11 01312 g004
Figure 5. Current gaging inspection system: (a) View from operator’s perspective showing linear variable displacement transducers (LVDTs) and reference pins, and (b) view from the opposite side showing a workpiece mounted and ready for measurement operation.
Applsci 11 01312 g005
Figure 6. In-Line Measurement Machine. (a) Cartesian 2 axis Positioner, (b) machine structure, (c) pneumatic part positioning system, and (d) control system.
Applsci 11 01312 g006
Figure 7. Flash and heat checking (thermal fatigue) marks are typically found on the die’s surface. Such defects can affect the measurements.
Applsci 11 01312 g007
Figure 8. Simplified function analysis tree of the current measuring station. Physical components are shown in dashed boxes.
Applsci 11 01312 g008
Figure 9. The functional tree for the proposed design. Connectivity and monitoring of the environment are support functions that help improve intelligence of the machine.
Applsci 11 01312 g009
Figure 10. Control architecture of In-line Measurement machine. Connectivity, data flow and distribution of analysis, and support for decision making.
Applsci 11 01312 g010
Figure 11. Integrated function diagram. Functions that provide Connectivity are shown at the bottom.
Applsci 11 01312 g011
Figure 12. Dahsboard for monitoring machine utilization and operation times. Points correspond to measurements at a given time.
Applsci 11 01312 g012
Figure 13. (a) Prototype of the machine in the laboratory, and (b,c) in use on the shop floor.
Applsci 11 01312 g013
Figure 14. Part measurement cycle time on shop floor conditions. Interval between times in which the start button is pressed in consecutive cycles.
Applsci 11 01312 g014
Figure 15. (a) Ambient temperature and maximum accelerations of the positioner. (b) Cycle time and temperature variations measured during a typical shift.
Applsci 11 01312 g015
Figure 16. (a,b) Histogram of acceleration of X and Y axes of the positioning system. (c) Histogram of accelerations reported by the XDK sensor. (d) Part deviation measured after machine was subject to shock.
Applsci 11 01312 g016
Table 1. Description of contents of Google spreadsheet. Signals that are transferred to the Cloud, as well as their intended use.
No of SheetData StoredUse
Asses Part QualityProcess MonitoringDiagnostics/Forecast
1Calculated values of height data for 19 measurement points. Environment data from XDK (taken during measurement) x x
2Environmental data from XDK when clamps are activated (taken before measuring cycle) xx
3Laser measurement raw data. 19 pointsx
4Height of locating points. 3 values. xxx
5Maximum accelerations of axis X xx
6Maximum accelerations of axis Y xx
7Results of R&R Gage x
Table 2. In-line measuring machine Gage repeatability and reproducibility (R&R) results. The results of left hand columns correspond to the last test performed in the lab prior to shipping. The second tests was performed prior to the first run on shop floor. A measurement point was added between these two tests.
LABSHOP FLOOR
15-nov-0013-dic-0024-sep-0101-mar-02
Point%R&RPoint%R&RPoint%R&RPoint%R&R
15.916.3513.816.24
23.9923.5622.9824.63
35.5333.1533.1435.59
43.9743.4642.1844.94
54.9453.6352.3556.69
63.9962.3462.2664.31
74.9172.373.5773.90
84.0982.5182.3282.84
93.9192.5192.1693.83
104.51102.16102.63103.31
115.42112.83113.13119.64
125.32123.04122.31122.52
134.79133.32133.14133.52
146.04144.28143.47143.59
155.61153.75155.55153.03
166.4163.13162.96162.57
176.51173.64174.06172.90
184.7184.22186.42181.84
193.77192.37192.81
Publisher’s Note: MDPI stays neutral with regard to jurisdictional claims in published maps and institutional affiliations.

