
Intelligent Robotic Palletizer System

Abstract
:1. Introduction
- The objects are arranged symmetrically, and only the overlapping parts of the objects are removed instead of the regional removal proposed in the recursive partitioning algorithm. In this way, it can be ensured that the outer layer of the stack has a complete rectangular structure. If the situation of overlap happened, only a few overlapping objects will be changed.
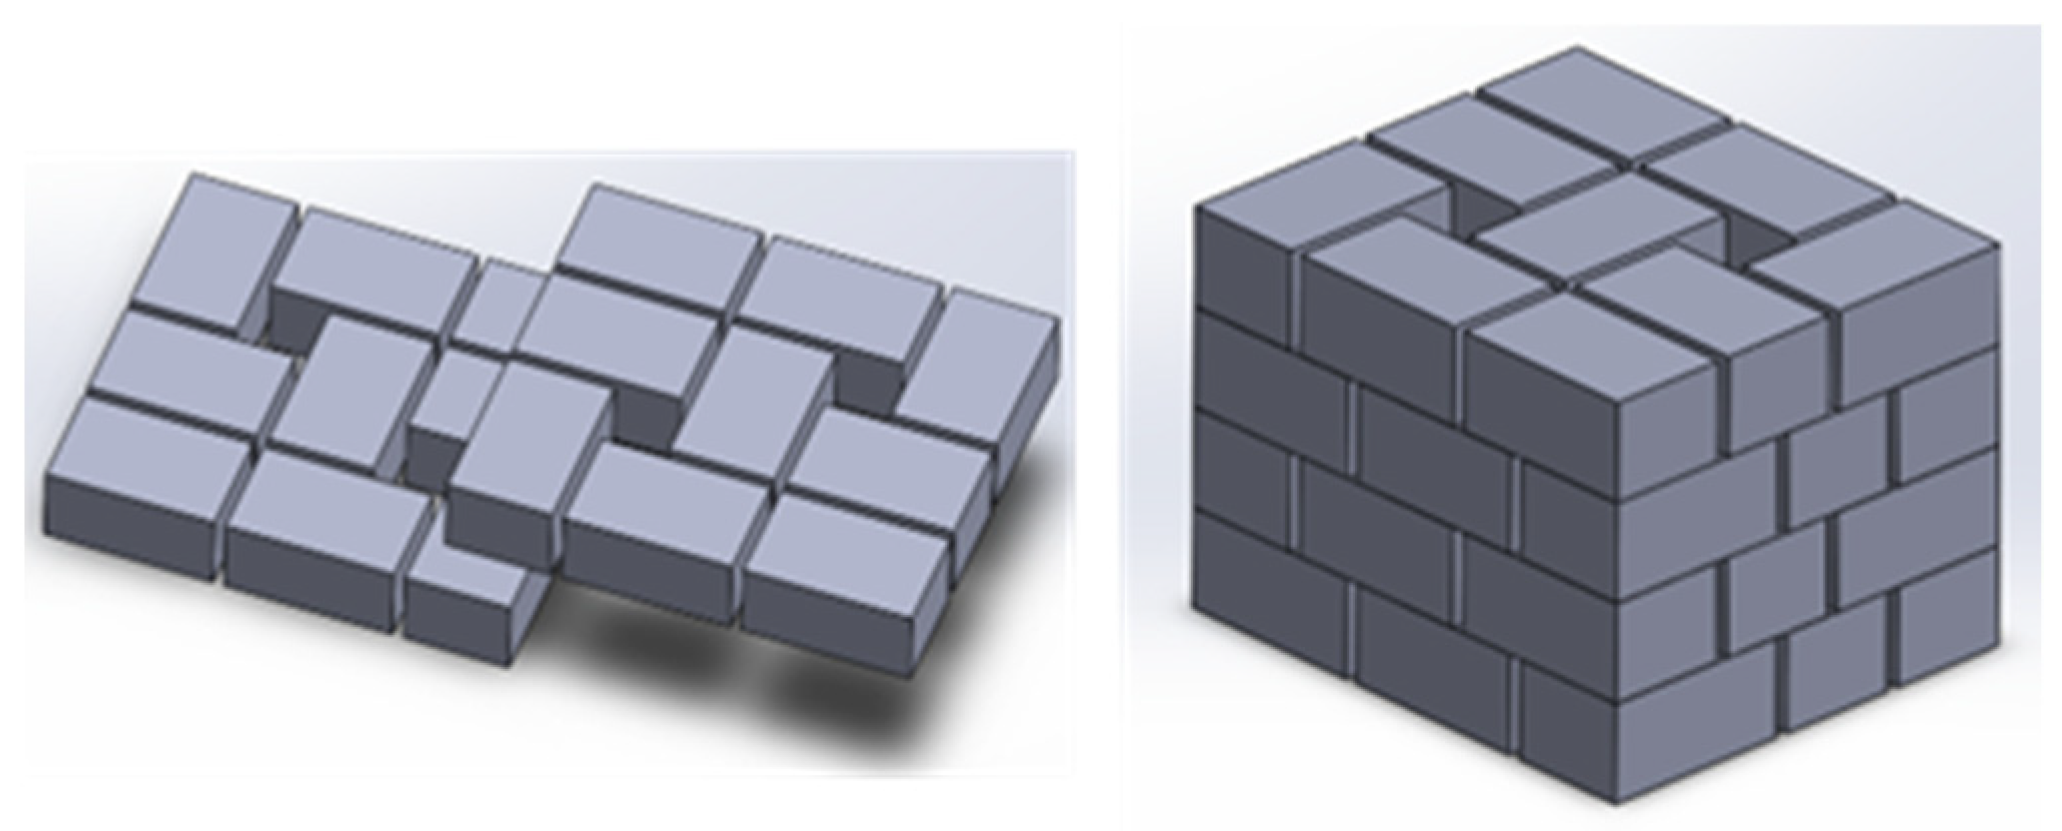
- The improved symmetric algorithm arranges the arrangement between layers in a staggered manner to maintain the stability of the stacking structure, in accordance with the cargo stacking rules, which improves the structural problems when stacking goods by using the recursive partitioning algorithm.
2. Improved Symmetric Algorithm
- Input data: the length, width, and height of the effective area, and the size of the arranged objects;
- Output data: object arrangement result, object arrangement coordinate list;
- Combine the arrangement of vertical and horizontal to increase the utilization rate of effective area;
- Use staggered stacking to increase the stability of objects when palletizing;
- The size of the space between objects can be set.
2.1. Variable Name and Basic Concepts
2.2. Basic Concepts of the Improved Symmetrical Arrangement Algorithm
2.3. Improved Symmetrical Arrangement Algorithm
| Algorithm 1. Overlap calculation |
| if if ( Block 1 and Block 3 are larger in area and non-overlapping, as A1 shown in Figure 4a. else if () Block 1 and Block 3 are larger in area and overlapping, as B1 shown in Figure 4b. if ( if ( Block 2 and Block 4 are larger in area and non-overlapping, as A2 shown in Figure 4c. else if () Block 2 and Block 4 are larger in area and overlapping, as B2 shown in Figure 4d. |
2.3.1. Solution to Overlap
- Horizontal multi-object overlapThe horizontal multi-object overlap is as shown in Figure 8. When Block 1 and Block 3 are overlapped horizontally, the number of overlaps in a single block will be calculated first. As shown in Equations (1) and (2), can know the number of overlaps. According to the symmetry, Block 1 and Block 3 will remove objects at the same time. Block 1 will start to remove the overlapping objects in the upper right corner in a vertical manner. On the contrary, Block 3 will start to remove the overlapping objects in the lower left corner in a vertical manner. Because of the symmetry, the number of rows removed is (Round up). It can be obtained from Equation (3) that is the number of objects that need to be removed for a single block to eliminate overlap.
- Vertical multi-object overlapThe vertical multi-object overlap is as shown in Figure 9. When Block 2 and Block 4 are overlapped vertically, the number of overlaps in a single Block will be calculated first as Equations (4) and (5). and are the same to indicate the amount of overlap. Block 2 will be removed horizontally from the upper left corner of the overlap; otherwise, Block 4 will be removed horizontally from the bottom right corner of the overlap. Additionally, due to the symmetry, the number of rows removed is (round up). It can be obtained from Equation (6) that is the number of objects that need to be removed for a single block to eliminate overlap.
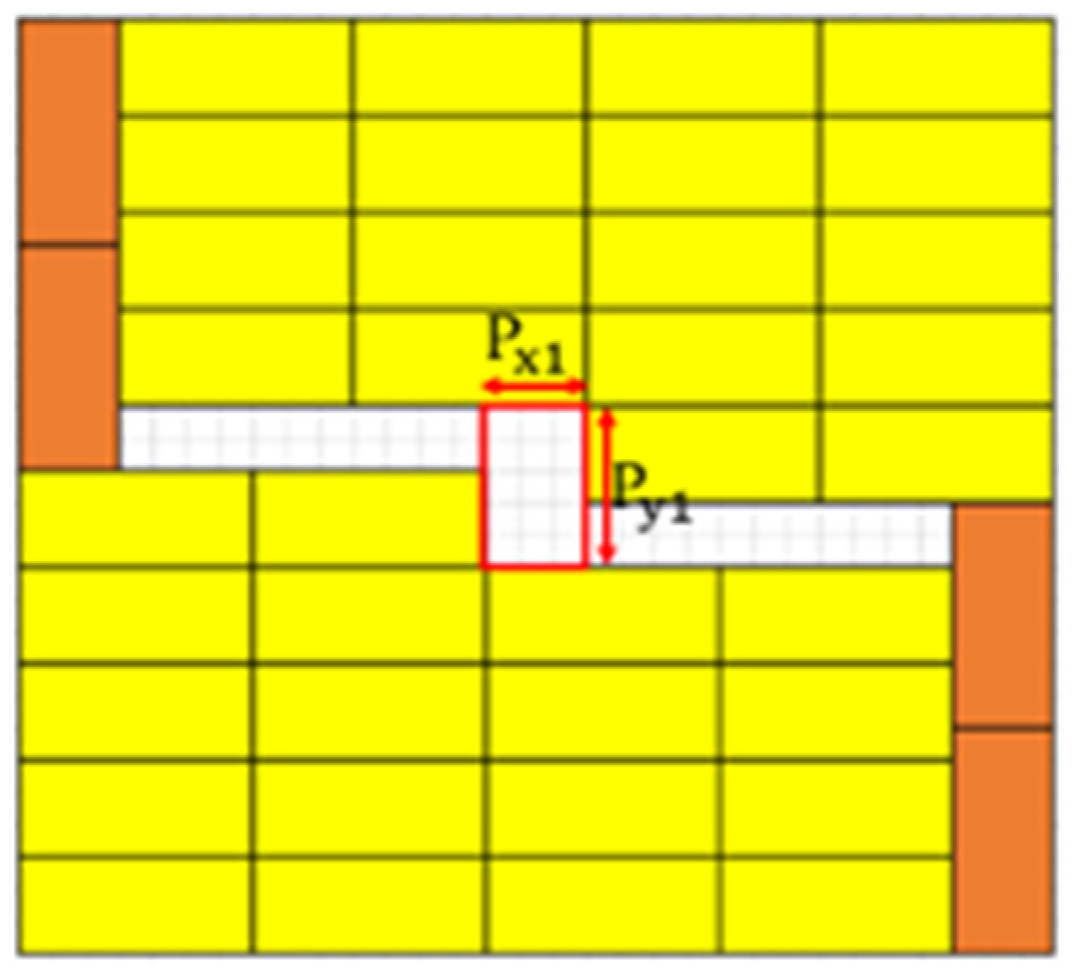
- Single object overlapSingle object overlap will occur in horizontal overlap and vertical overlap. Additionally, this situation does not have to be removed in a symmetrical way. An independent method was developed to solve the problem. The feature of a single object overlap is that both and are 1. However, it still needs to be brought into the corresponding equation according to the classification. If the horizontal overlap occurs, Equations (1) and (2) are used to calculate and ; if the vertical overlap occurs, Equations (4) and (5) are used. Figure 10a shows the single object overlap vertically. It can be seen from the Figure 10a that there is no need to remove the same number of objects in the block at the same time as in the previous two methods. Only one of the two overlapping objects in the blocks needs to be removed. This algorithm mainly focuses on Block 1 and Block 2. When a single object overlaps, the overlapped objects of Block 3 and Block 4 will be removed. When the object is removed, as shown in Figure 10b, the overlap problem can be completely eliminated.
2.3.2. Calculation of Remaining Effective Area
- Block 1 and Block 3 are larger in area and non-overlappedWhen this horizontal area is larger and does not overlap, define the new effective area as and . It can be found that determines the length of , and determines the length of . The equations are as Equations (7) and (8). After calculation, the area when Block 1 and Block 3 are non-overlapped is as shown in Figure 11.
- Block 2 and Block 4 are larger in area and non-overlappedIn the case of non-overlapped, the calculated new effective area is roughly the same. The difference is that the key factors that determine and are different. When this vertical area is larger and does not overlap, define the new effective area as and . It can be found that determines the length of , and determines the length of . The equations are as Equations (9) and (10). After calculation, the area when Block 2 and Block 4 are non-overlapped is as shown in Figure 12. After confirming the length and width of the new area, it can be known whether the area can continue to be arranged.
- Block 1 and Block 3 overlappedIn the case of overlap, the remaining effective area is the area remaining after the overlapped object is removed. It can be known that when overlap occurs, there will be areas that cannot be used. The remaining area calculation will determine the new area size according to , , , . Take as an example. Its effective length is the length remaining after removing the overlapped objects, and is the length remaining after minus . The equations are as shown in Equations (11) and (12). After calculation, the area when Block 1 and Block 3 are overlapped is as shown in Figure 13.
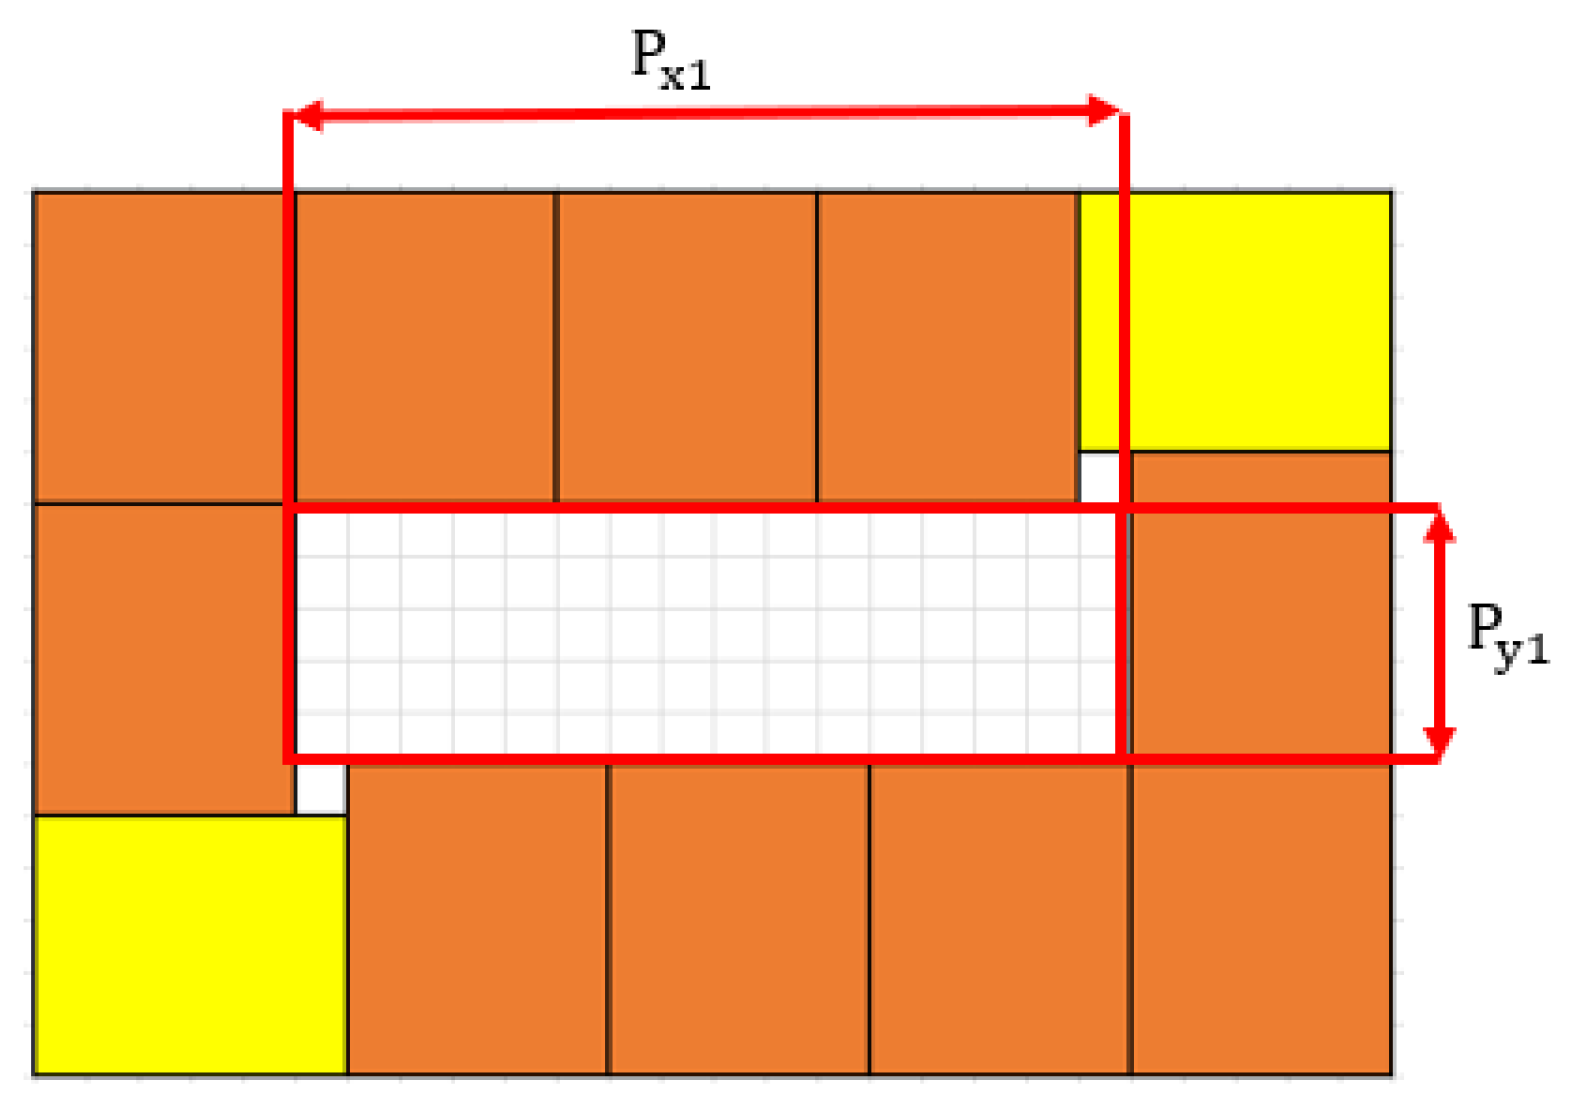
- Block 2 and Block 4 overlappedThe area calculation of horizontal overlap is roughly the same as that of vertical overlap. The remaining area calculation will determine the new area size according to , , , . Take as an example. Its effective length is the length remaining after removing the overlapped objects, and is the length remaining after minus . The equations are as shown in Equations (13) and (14). After calculation, the area when Block 2 and Block 4 are overlapped is as shown in Figure 14. It can be seen in the Figure 14 that there are remaining blank areas that are not within the frame, all of which are invalid areas and cannot be arranged. is rounded up.
2.3.3. Object Coordinate Marking
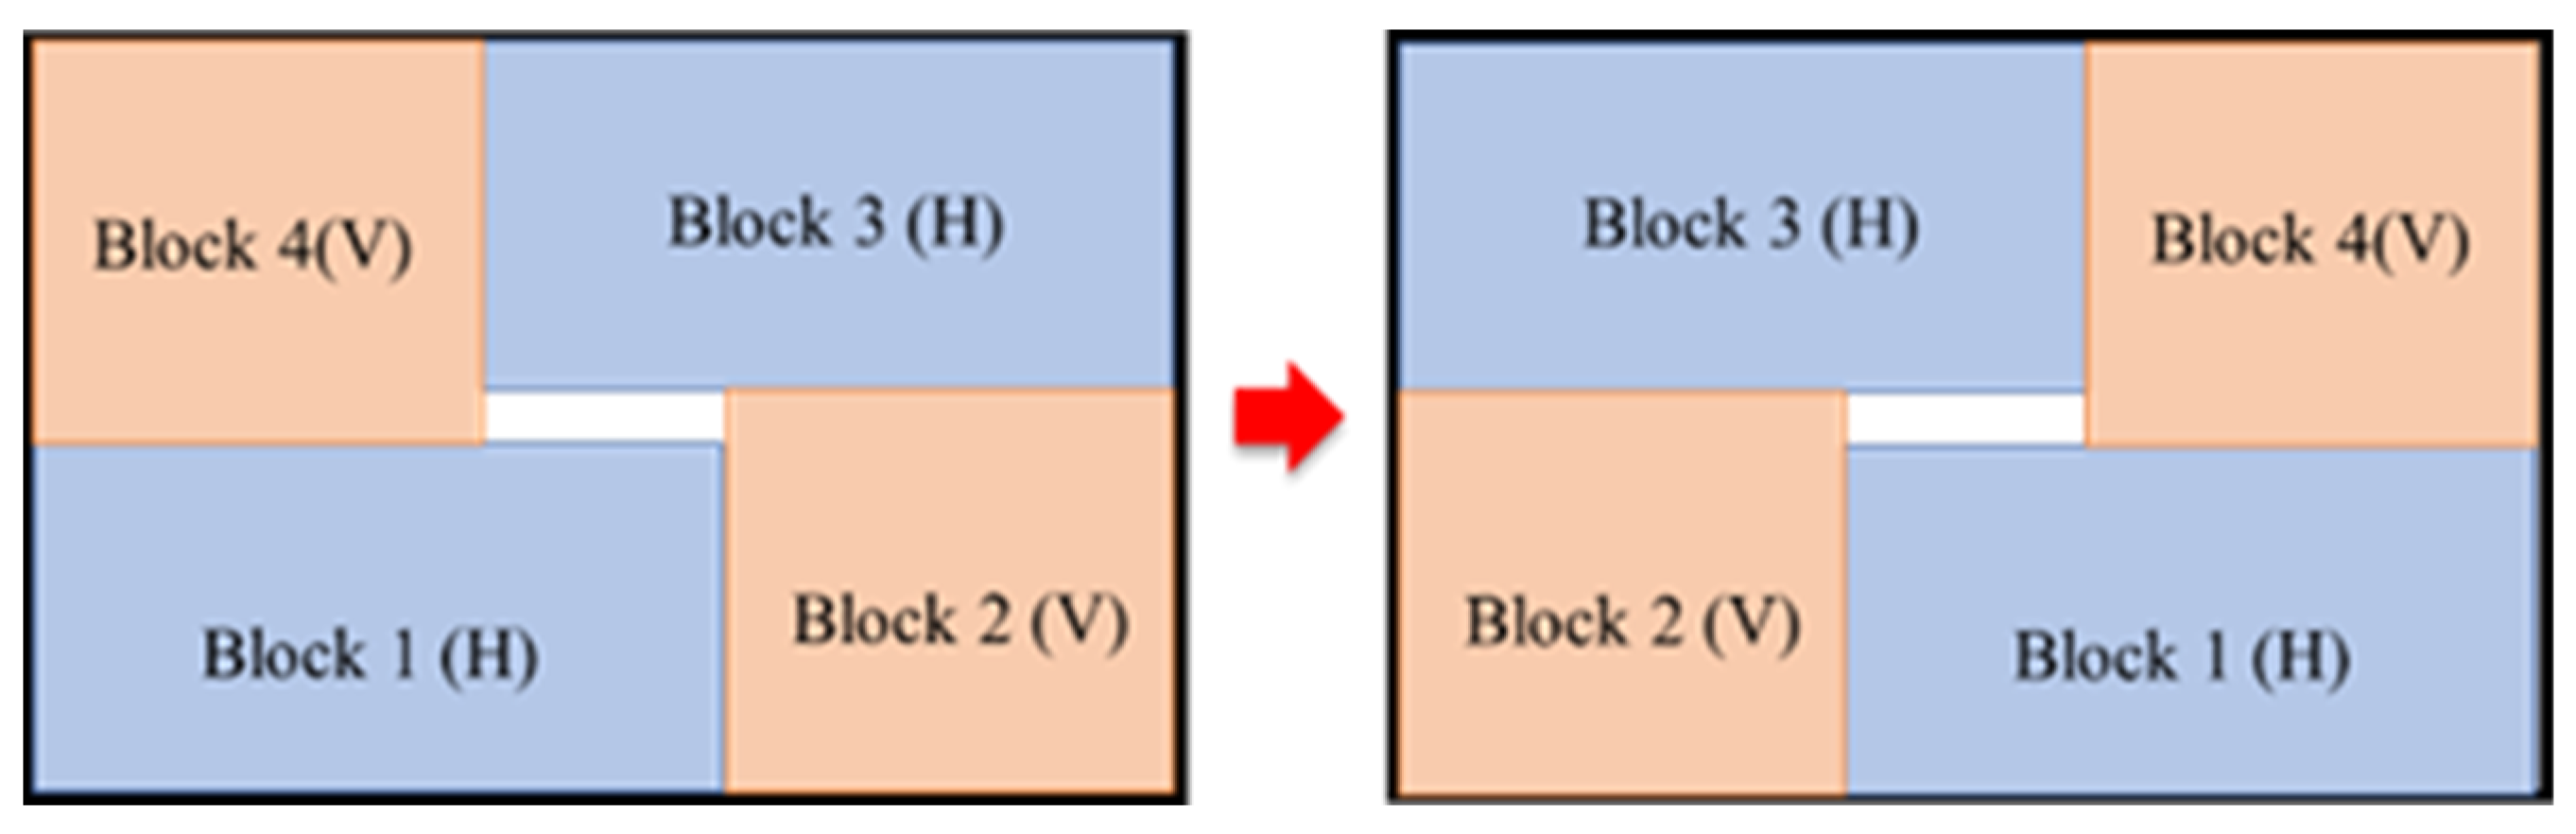
- Arrangement of each areaAt the beginning of the algorithm, the pallet is divided into four areas. Different quadrants are used by the coordinate marking according to different areas. As shown in Figure 15, and are the maximum distance that the object can be placed in the effective area, rather than the original size of the effective area. In order to simplify the marking method, each area is in a different quadrant. It can be seen from Table 2 that the objects of Block 1 are arranged in the first quadrant, Block 2 in the second quadrant, Block 3 in the third quadrant, and Block 4 in the fourth quadrant; therefore, the arrangement direction of each object will be different.However, each area is arranged from the origin to the center of the effective area. At the same time, there are different arrangements for horizontal overlap and vertical overlap. The coordinates are as shown in Figure 16.
- Non-overlapping object coordinate marksNon-overlapping coordinate marking is relatively simple, because there is no overlap problem. Regardless of whether the horizontal area is larger or the vertical area is larger, the equations are the same. The vertical row is filled first before switching to the next to continue the arrangement while arranging horizontally. The horizontal row is filled first and then switch to the next row to continue the arrangement while arranging vertically. After calculation in the loop, the coordinates of Block 1 to Block 4 are as shown in Algorithm 2, respectively.
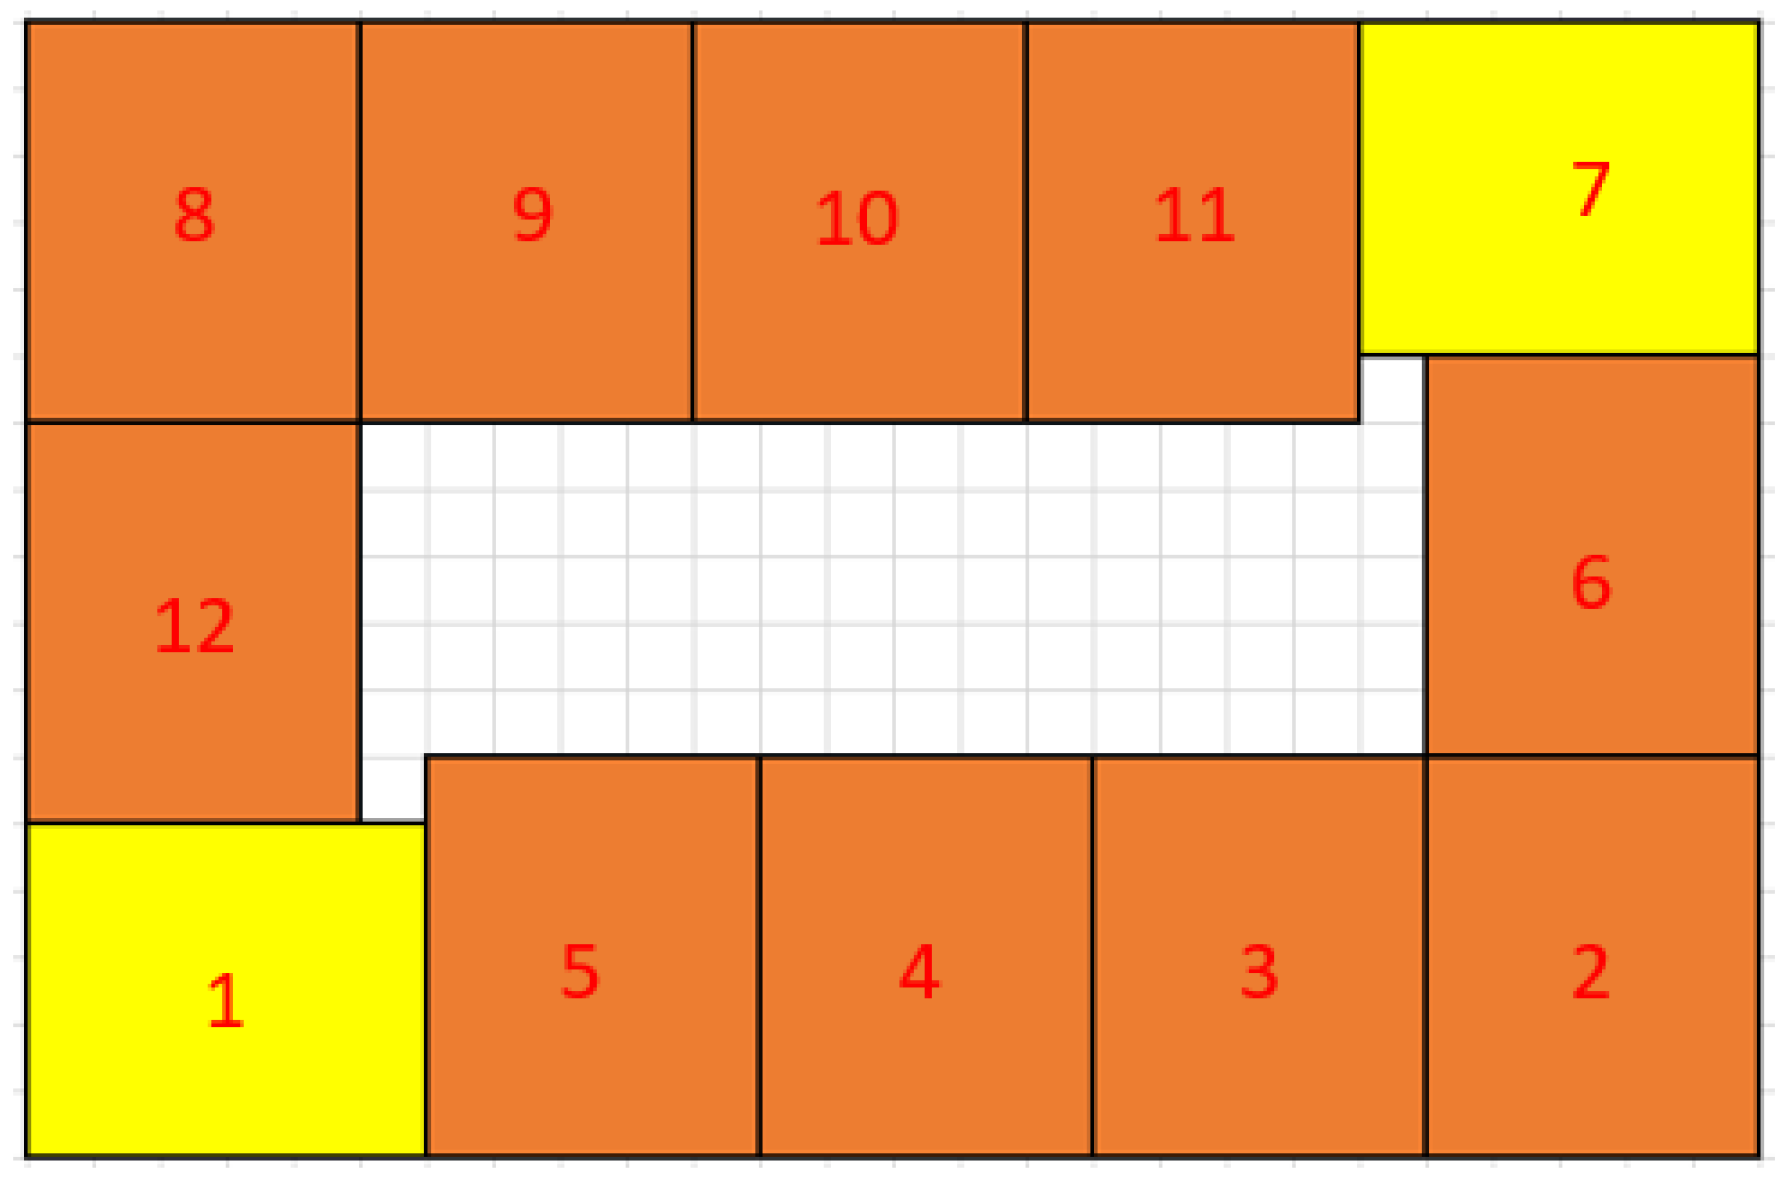
The code of “i” represents the number of boxes on the horizontal axis, and the code of j represents the number of boxes on the vertical axis. After bringing in the respective equations, the obtained coordinates are put into the database. The arrangement sequence will start from Block 1, as shown in Figure 17. From the order of object placement, it can be found that the order of placement of each block’s object is slightly different. Block 1 and Block 3 will first arrange the vertical row and then move to the next row to continue the arrangement, while Block 2 and Block 4 will first arrange the horizontal row and then move to the next row to continue the arrangement. At the same time, at the end of the calculation of each object arrangement, the coordinates will be written into the temporary storage table of individual blocks, such as B1_pos.Add(new List<int>() {x, y}) in Algorithm 2 for storage.Algorithm 2. Non-overlapping coordinate calculation
- Horizontal overlap object markWhen marking objects with horizontal overlap, Block 1 and Block 3 must be divided into two arrangements, removed objects and not been removed objects, because the horizontal arrangement changes to the next row to continue the arrangement when the vertical arrangement is completed. Therefore, the unremoved objects are arranged into several rows, which are determined by . Meanwhile, the vertically removed objects are arranged into several objects, which is determined by . Taking Block 1 as an example, the equation is as follows Algorithm 3:
From , rows of removed objects and unremoved objects can be known. From , the number of objects that can only be arranged for the removed objects can be known. There are two rows to be removed, and under normal circumstances five objects can be arranged. The removed part can only arrange four objects, as shown in Figure 18.Algorithm 3. Overlap calculation
if
else
- Vertical overlap object markWhen marking objects with vertical overlap, Block 2 and Block 4 must be divided into two arrangements, removed objects and not been removed objects, because the vertical arrangement changes to the next row to continue the arrangement when the horizontal arrangement is completed. Therefore, the unremoved objects are arranged into several rows, which are determined by . Meanwhile, the horizontally removed objects are arranged into several objects, which is determined by . Taking Block 2 as an example, the equation is as follows Algorithm 4:
Algorithm 4. Vertical overlap coordinate calculation
if
else
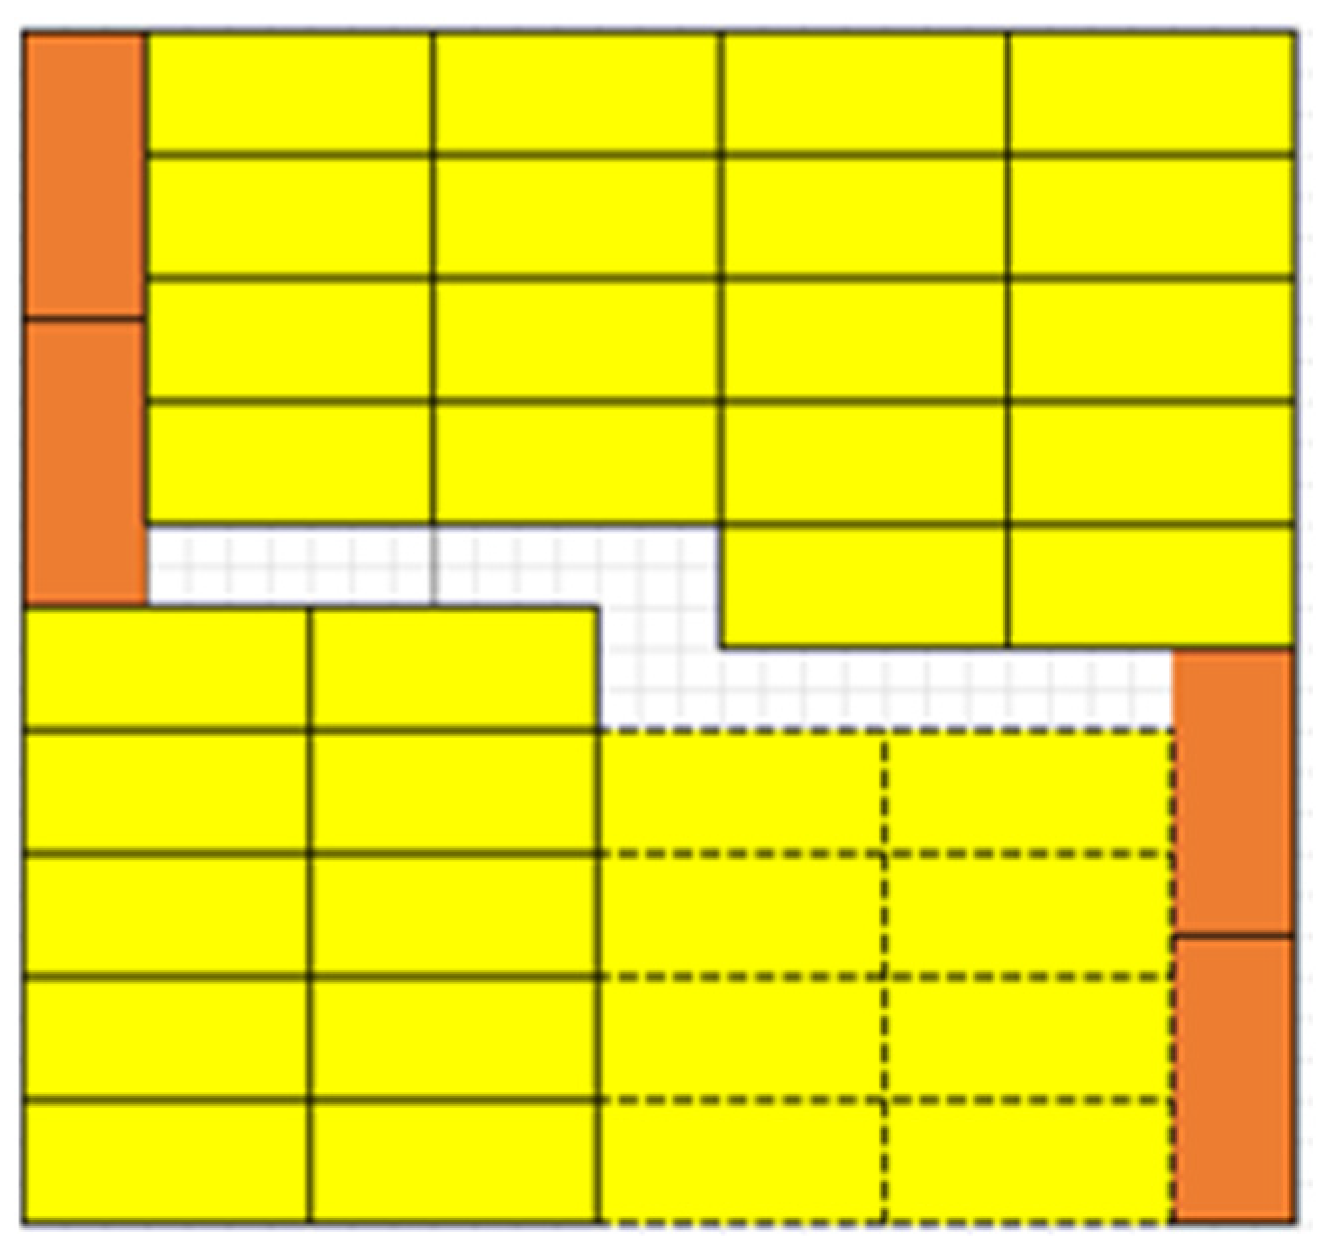
From , rows of removed objects and unremoved objects can be known. From , rows of removed objects and unremoved objects can be known. From , the number of objects that can only be arranged for the removed objects can be known. Some objects are removed since the dash line area in Block 2 is overlapped. It can be seen that there is a row of unremoved objects and a row of removed objects. Normally, four objects can be arranged. The removed part can only be arranged as an object, as shown in Figure 19.
2.3.4. Staggered Stacking
3. Vision System
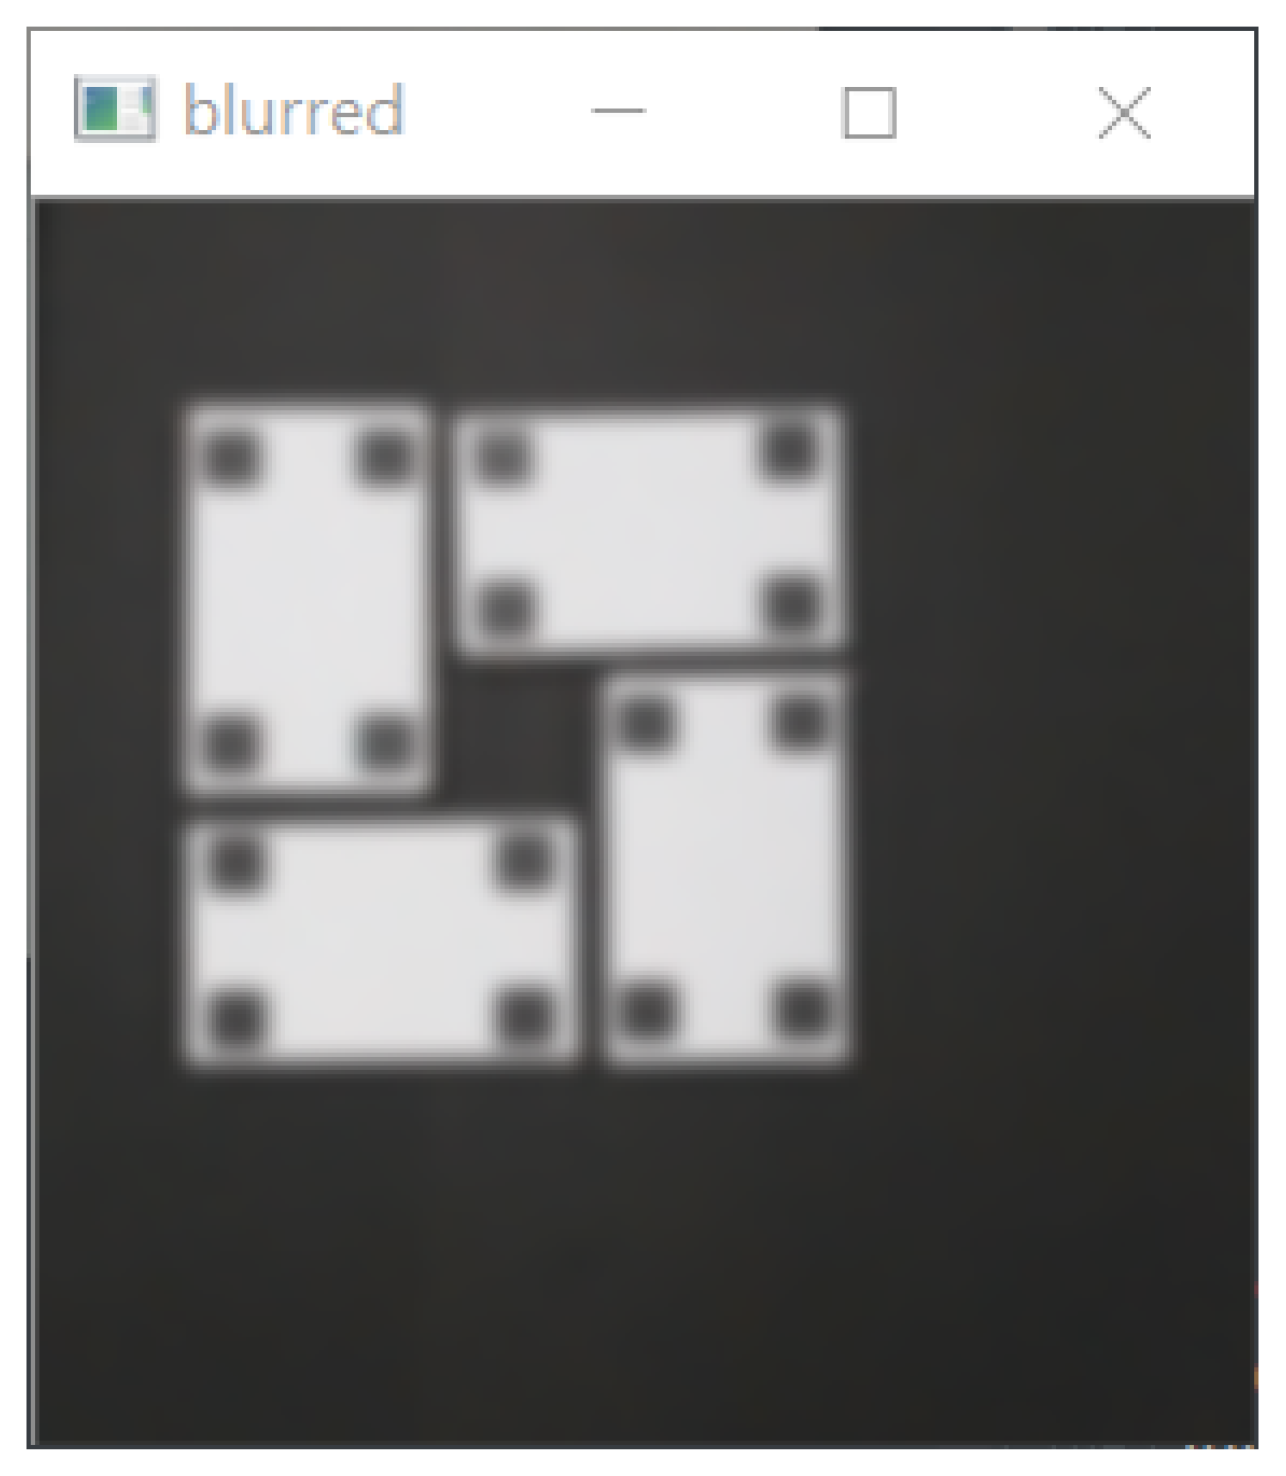
3.1. Visual Stack Inspection Module
3.1.1. Gray Scale
3.1.2. Gaussian Blur
3.1.3. Edge Detection
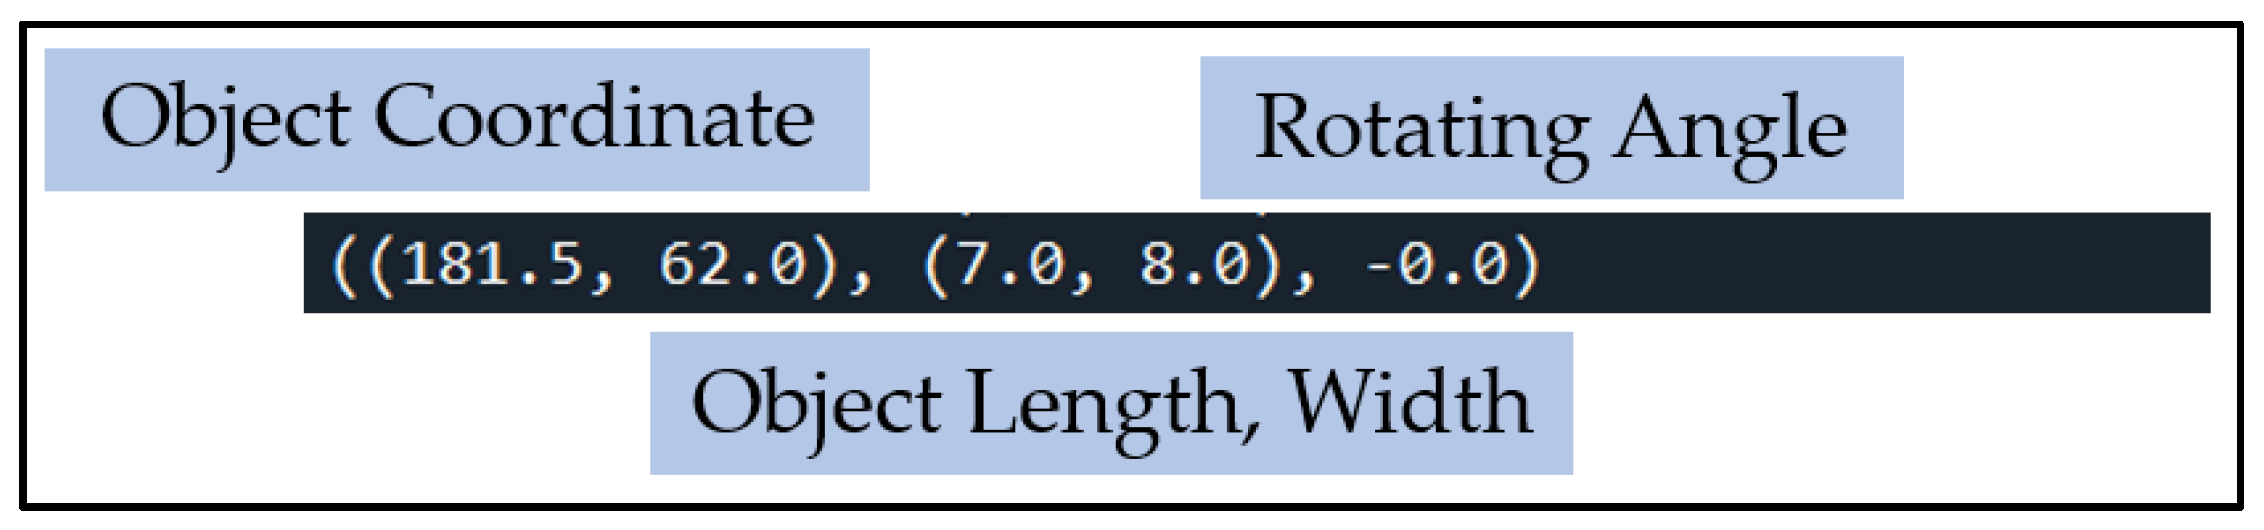
3.1.4. Fitting Square
3.2. AI Working Area Safety Module
4. Experiment Results
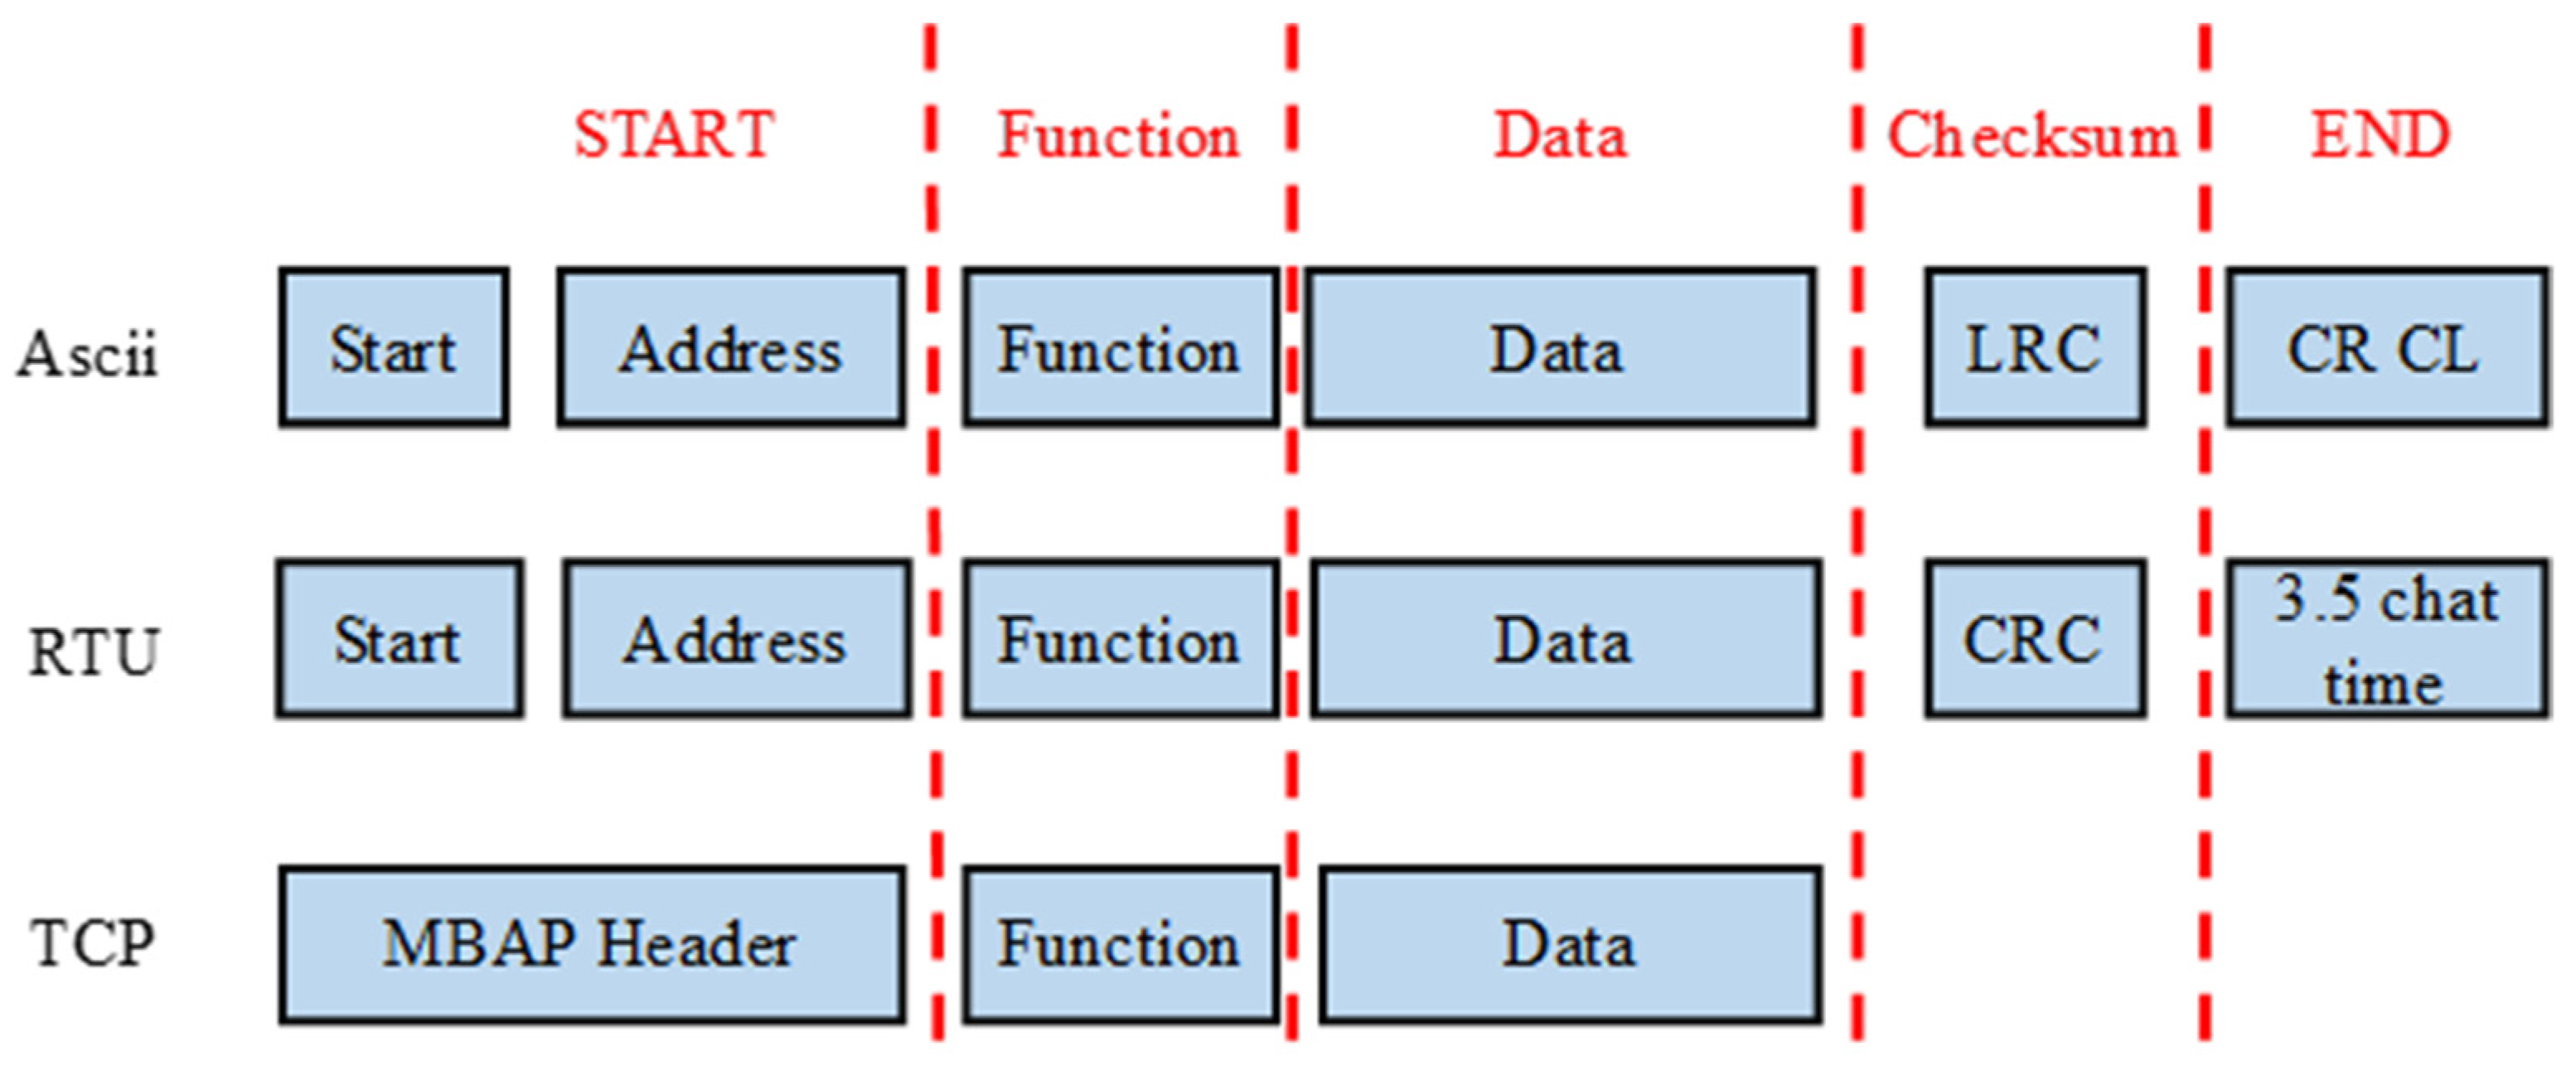
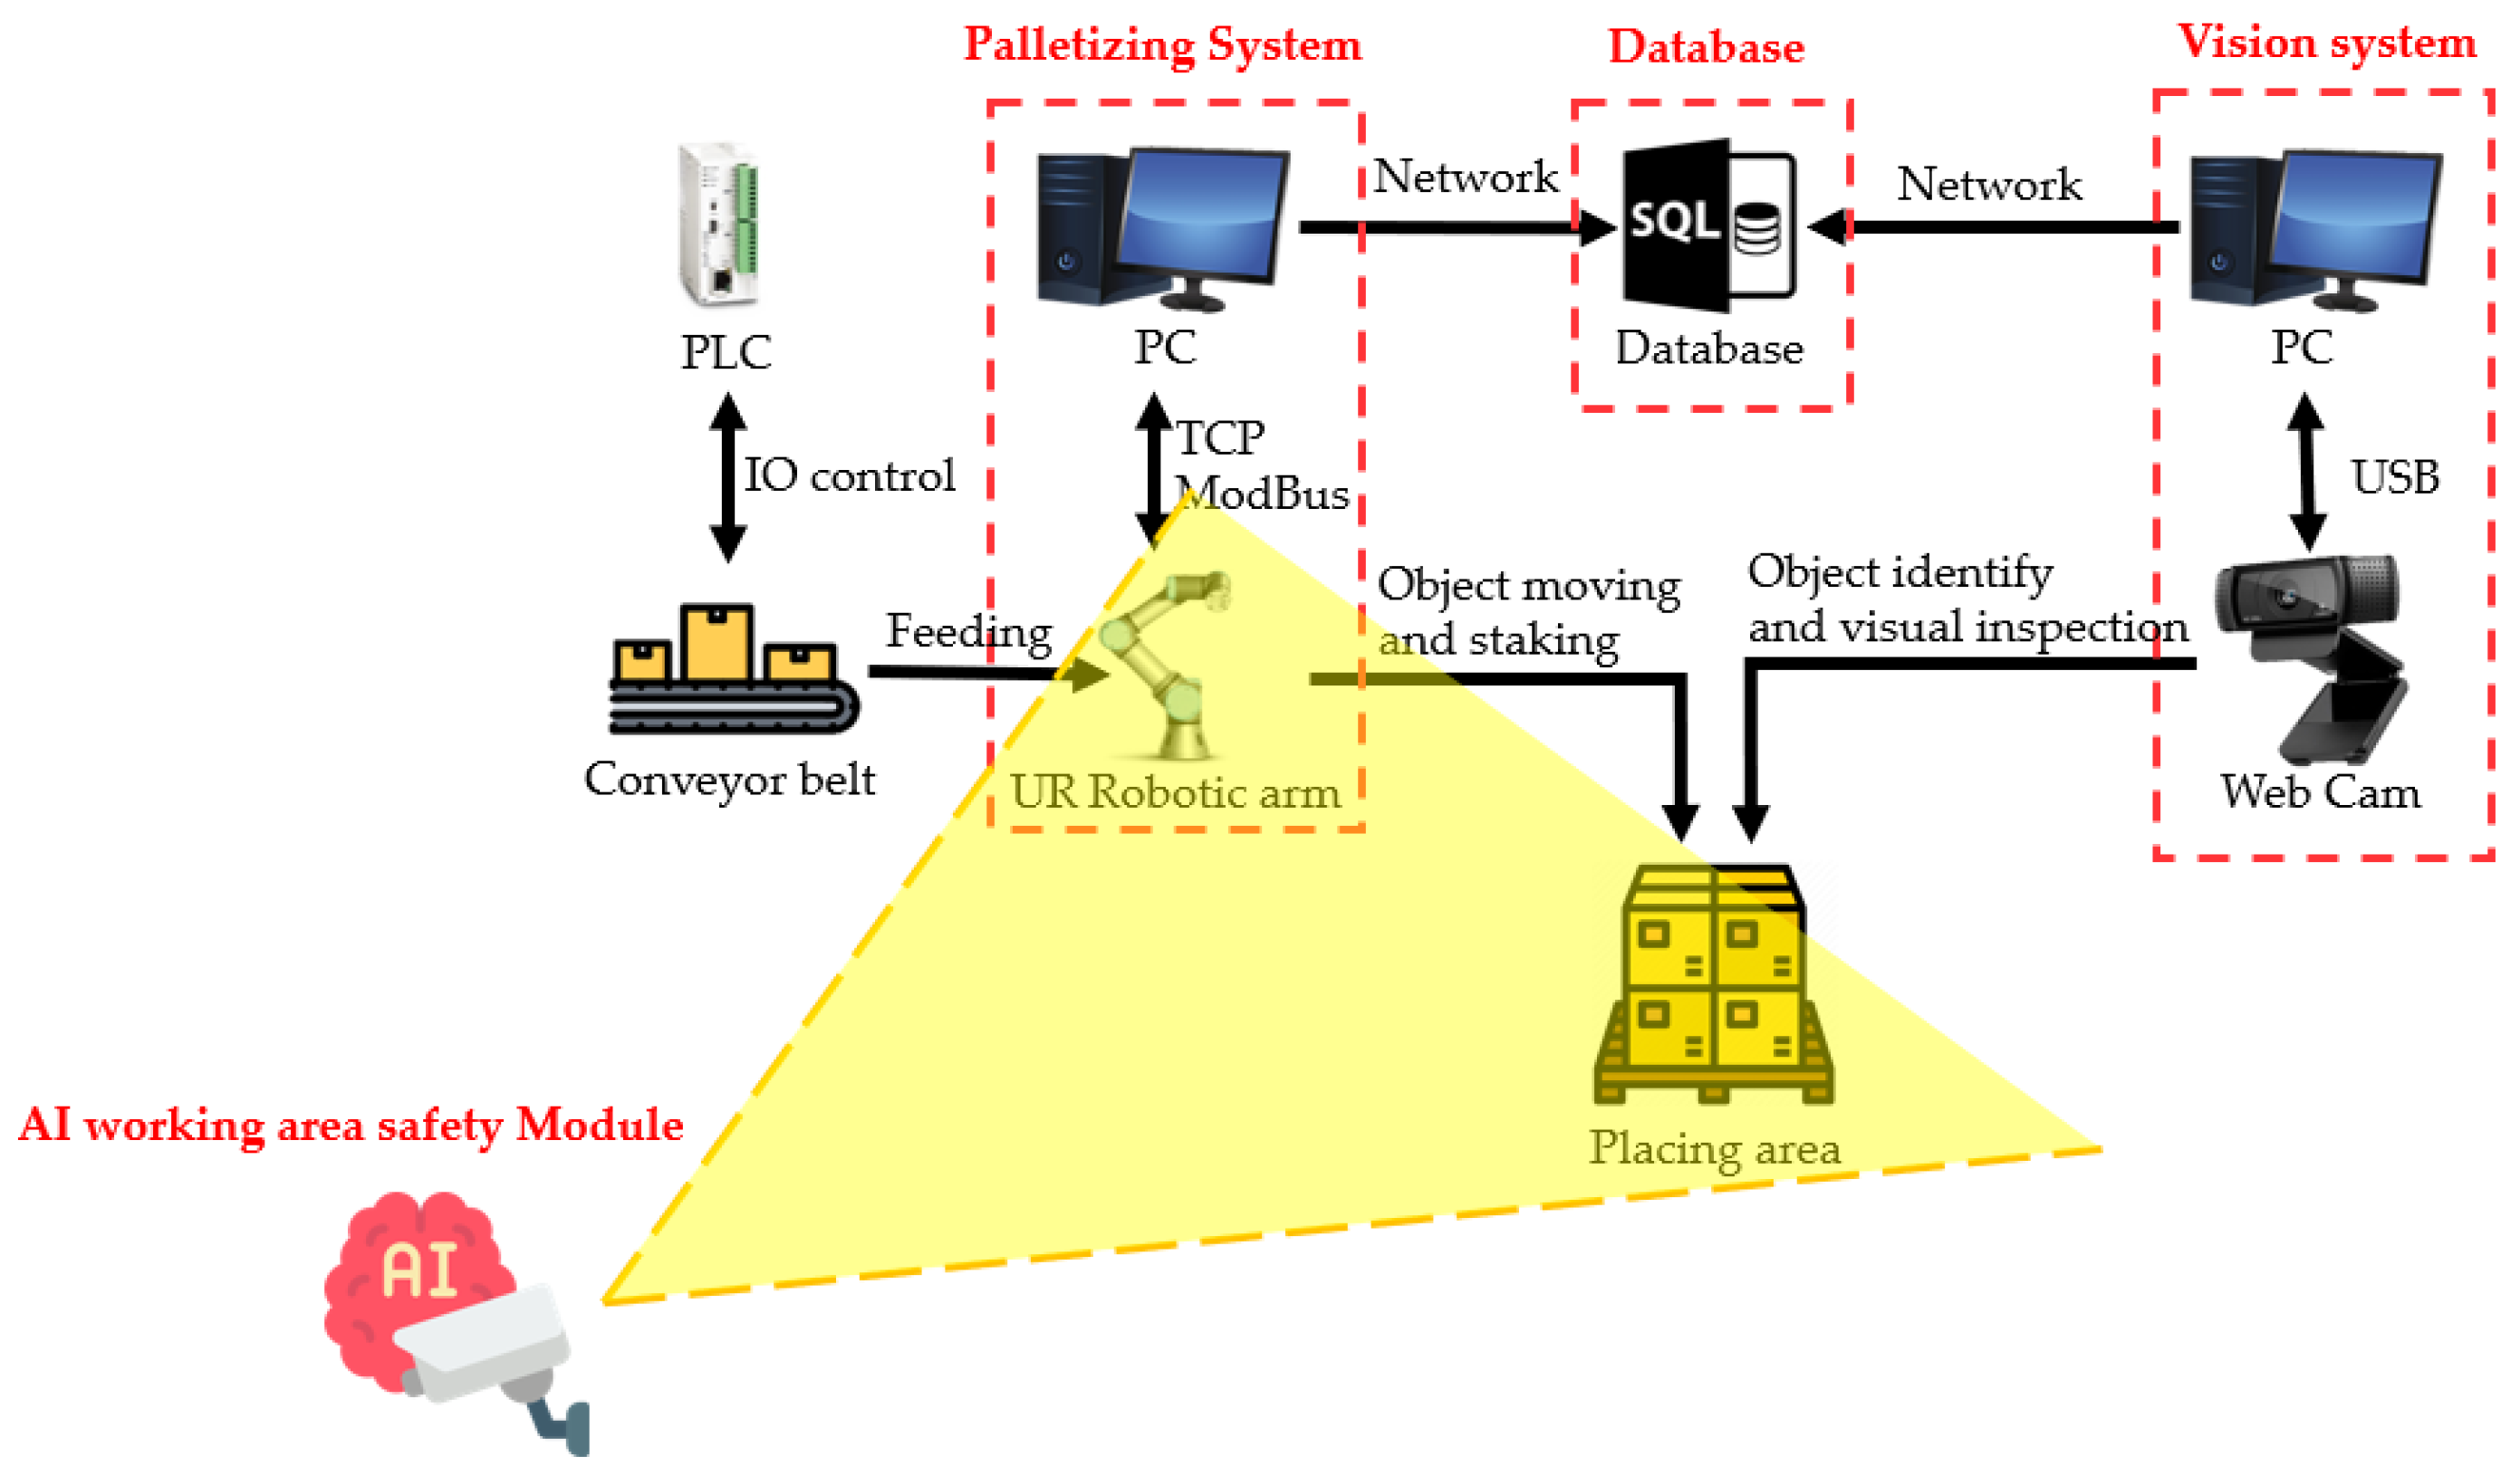
4.1. Communication
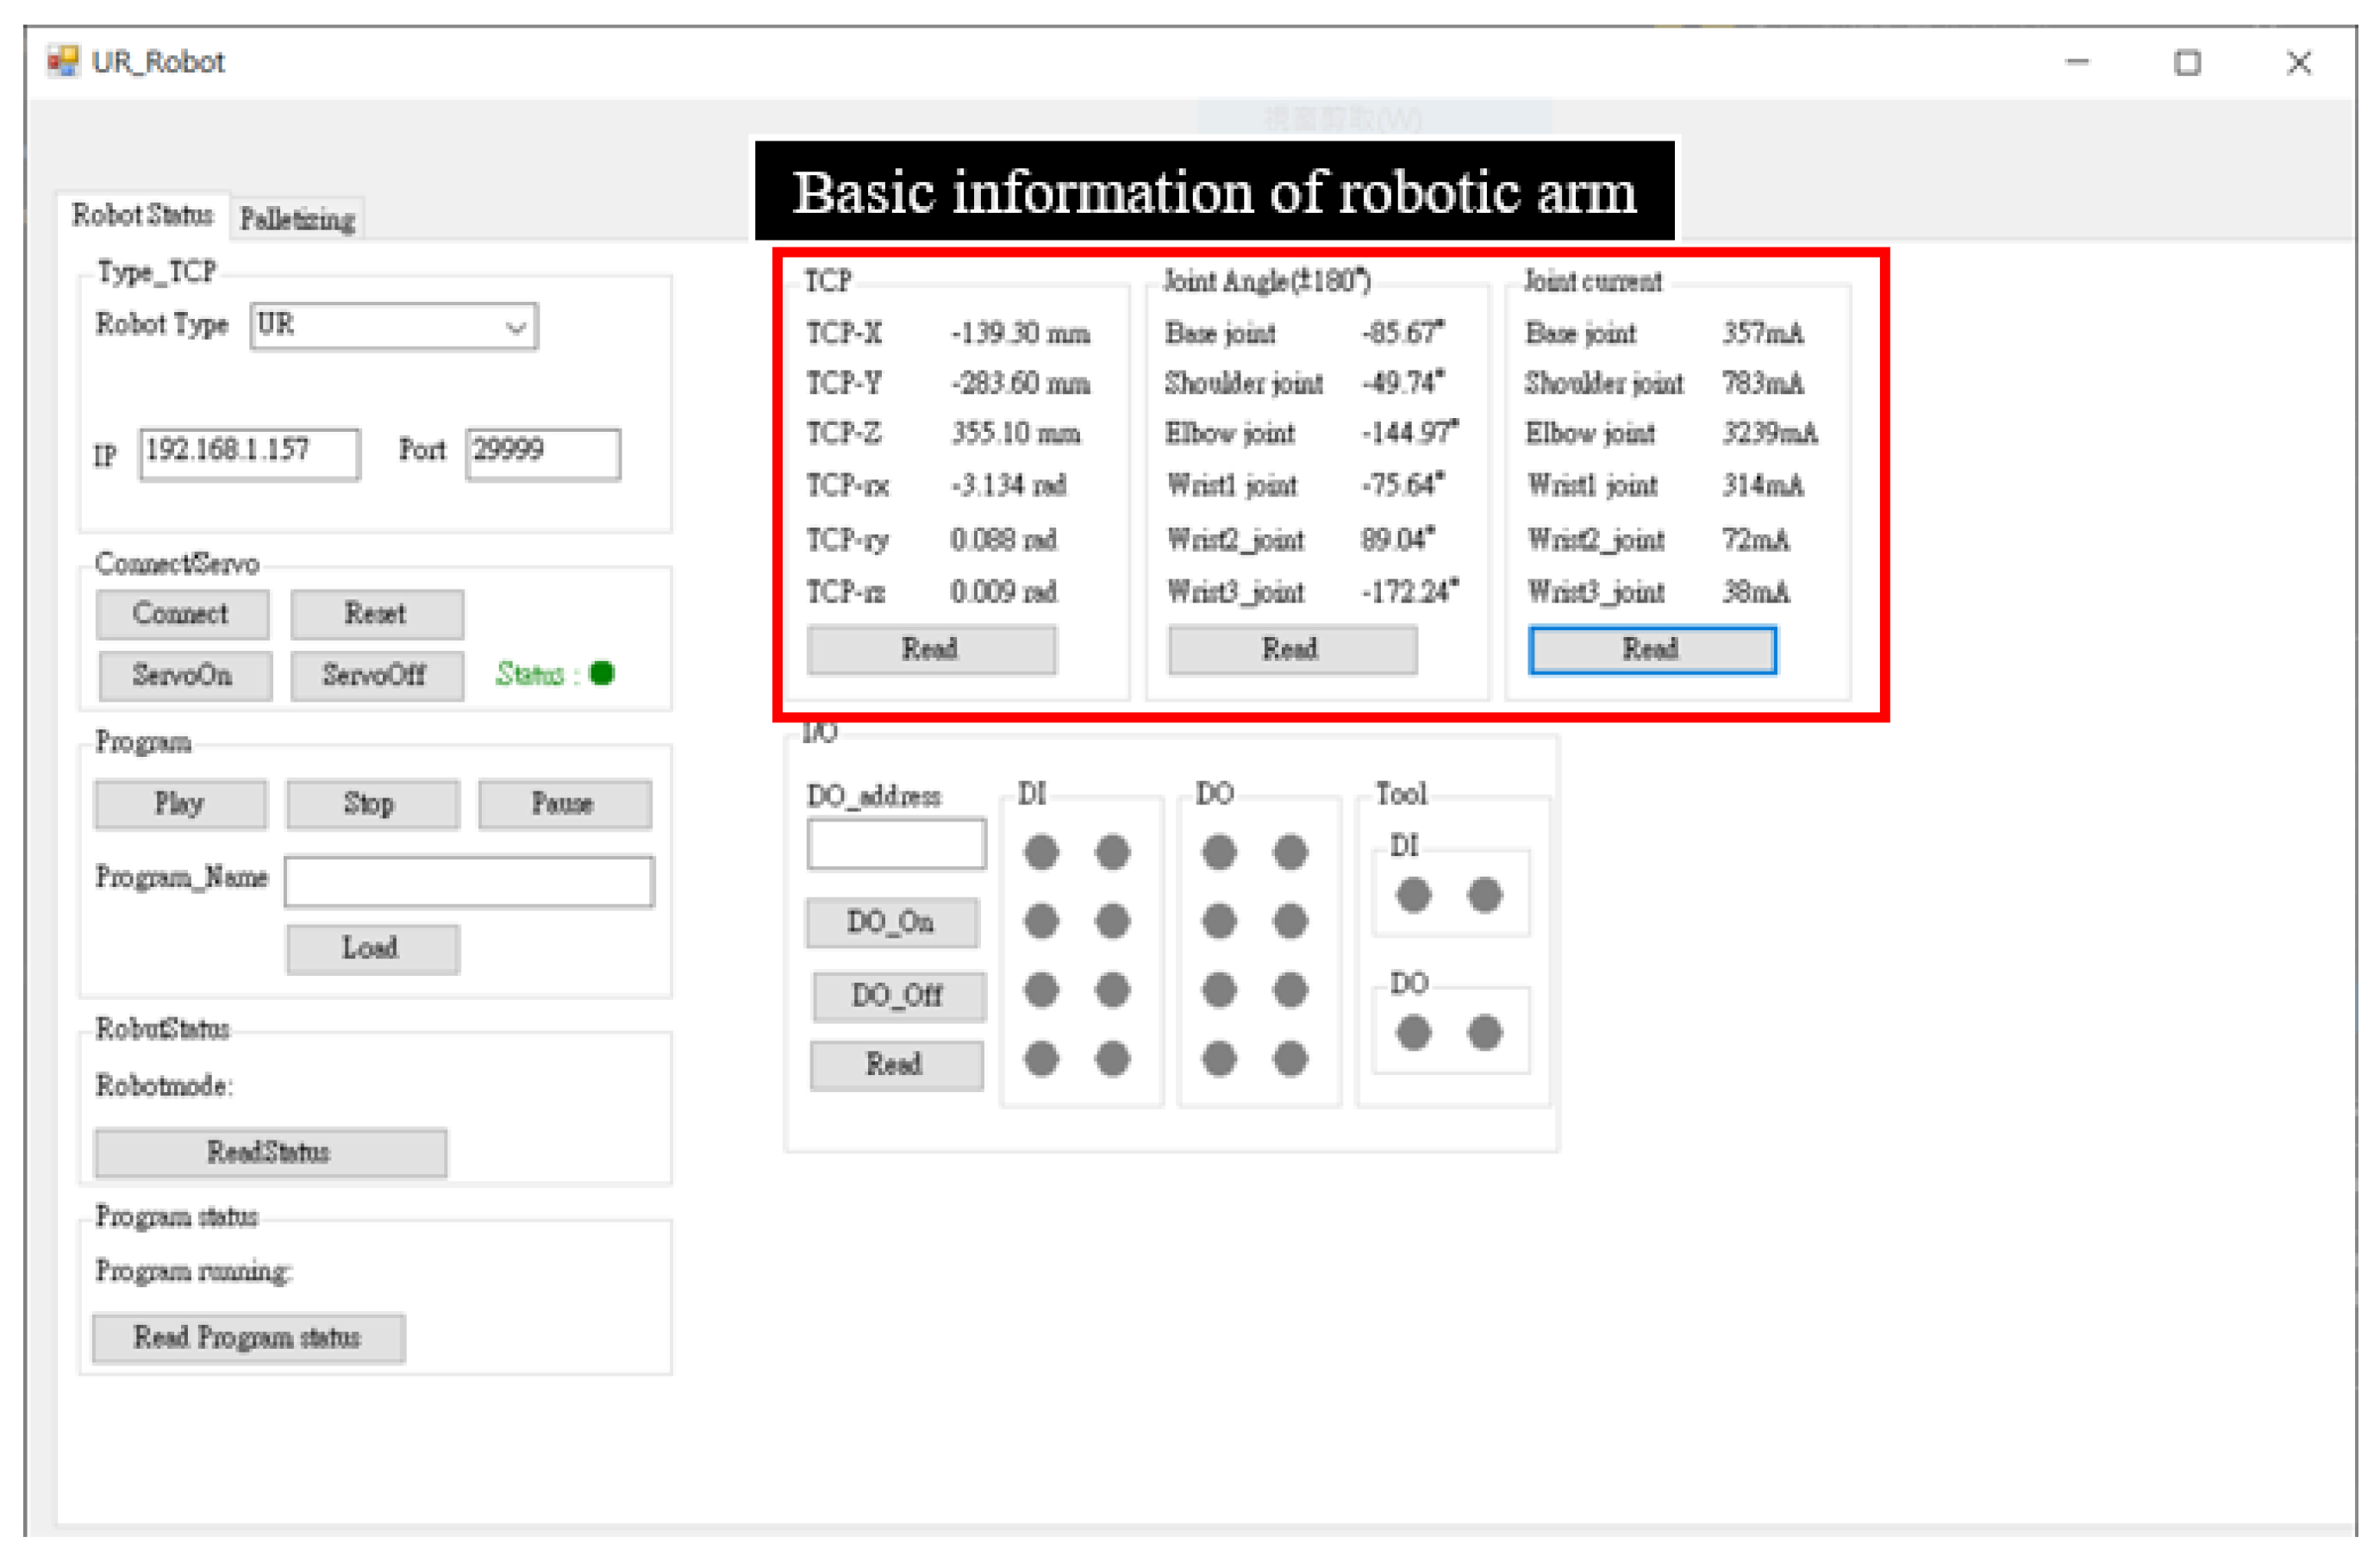
4.2. Operation of User Interface (UI)


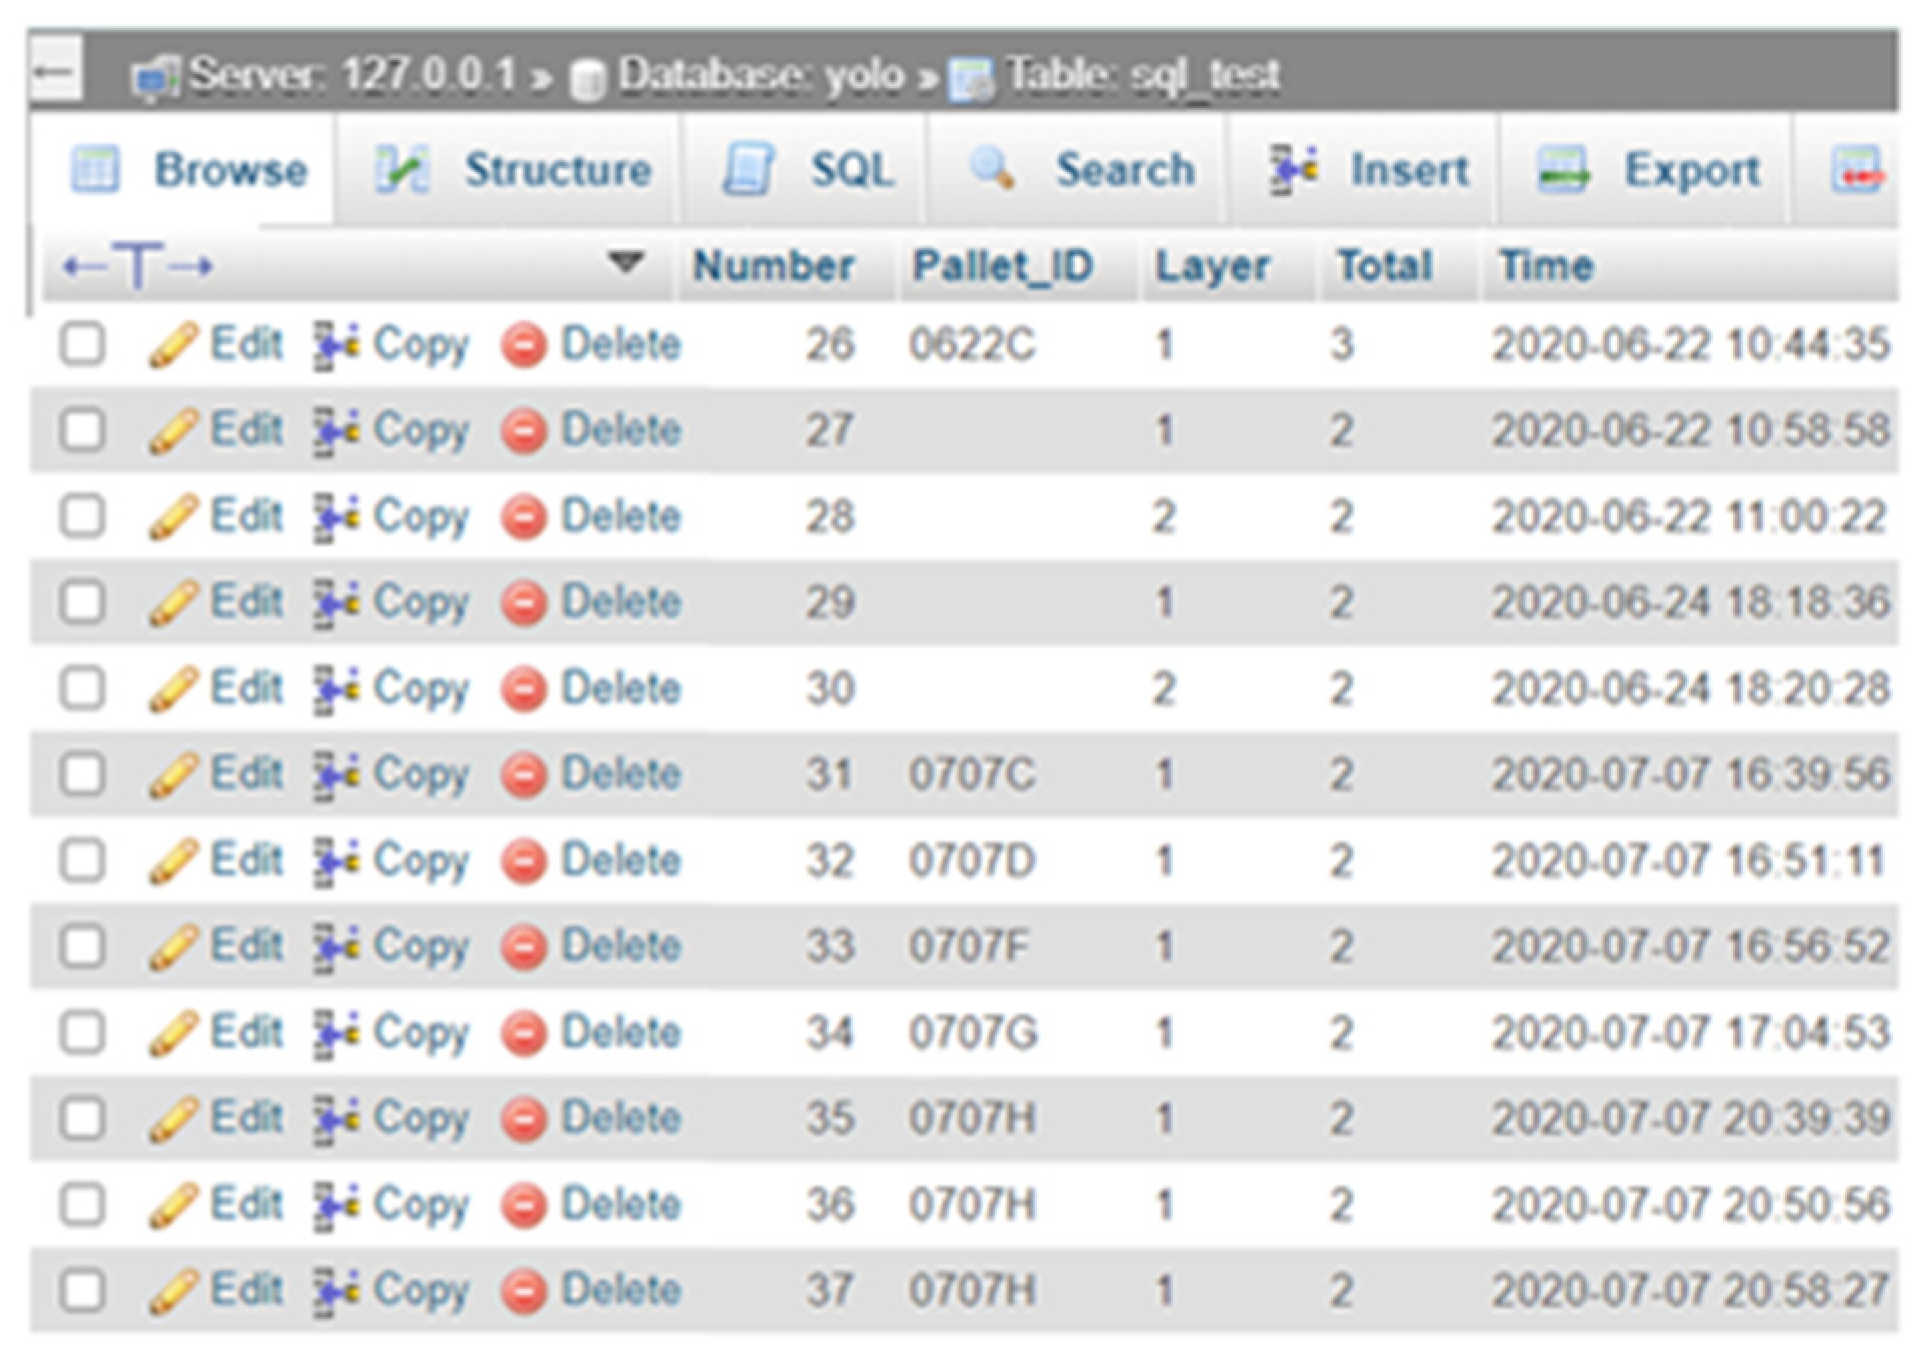
4.3. Database
4.4. Experiments
5. Conclusions
Author Contributions
Funding
Institutional Review Board Statement
Informed Consent Statement
Data Availability Statement
Acknowledgments
Conflicts of Interest
Appendix A
| Variable Name | Explanation |
| The length of the effective area of the objects that can be arranged (the length of the pallet) | |
| The width of the effective area of the objects that can be arranged (the width of pallet) | |
| Object length. | |
| Object width. | |
| The horizontal length of Block 1 and Block 3 as shown in Figure A1. | |
| The horizontal length of Block 2 and Block 4 as shown in Figure A1. | |
| The vertical length of Block 2 and Block 4 as shown in Figure A1. | |
| The vertical length of Block 1 and Block 3 as shown in Figure A1. | |
| The quantity of objects contained in the length of | |
| The quantity of objects contained in the length of | |
| The quantity of objects contained in the length of | |
| The quantity of objects contained in the length of | |
| The horizontal length of the remaining area as shown in Figure A1. | |
| The vertical length of the remaining area as shown in Figure A1. | |
| Quantity of objects that overlap horizontally. | |
| Quantity of objects that overlap vertically. | |
| The number of objects that need to be removed. | |
| The horizontal length of the objects arranged in the effective area as shown in Figure A1. | |
| The vertical length of the objects arranged in the effective area as shown in Figure A1. | |
| When the object is placed horizontally, the horizontal length to the center point as shown in Figure A1. | |
| When the object is placed horizontally, the vertical length to the center point as shown in Figure A1. | |
| When the object is placed vertically, the horizontal length to the center point as shown in Figure A1. | |
| When the object is placed vertically, the vertical length to the center point as shown in Figure A1. |

References
- Uniqlo Replaced 90% of Staff at its Tokyo Warehouse with Robots. Available online: https://www.weforum.org/agenda/2018/10/uniqlo-replaced-90-of-staff-at-its-newly-automated-warehouse-with-robots (accessed on 12 October 2018).
- Warehouse Robotics Market by Type (Mobile, Articulated, Cylindrical, SCARA, Parallel, Cartesian), Software, Function (Pick & Place, Palletizing & Depalletizing, Transportation, Packaging), Payload Capacity, Industry, and Region—Global Forecast to 2022. Available online: https://www.marketsandmarkets.com/Market-Reports/warehouse-robotic-market-128876258.html%20 (accessed on 1 September 2021).
- Vargas-Osorio, S.; Zúñiga, C. A literature review on the pallet loading problem. Lámpsakos 2016, 15, 69–80. [Google Scholar] [CrossRef] [Green Version]
- Laurent, D.; Iyengar, S. A heuristic algorithm for optimal placement of rectangular objects. Inf. Sci. 1982, 26, 127–139. [Google Scholar] [CrossRef]
- Bhattacharya, S.; Roy, R.; Bhattacharya, S. An exact depth-first algorithm for the pallet loading problem, European Journal of Operational Research. Eur. J. Oper. Res. 1998, 110, 610–625. [Google Scholar] [CrossRef]
- Birgin, E.G.; Lobato, R.D.; Morabito, R. Generating unconstrained two-dimensional non-guillotine cutting patterns by a Recursive Partitioning Algorithm. J. Oper. Res. Soc. 2012, 63, 183–200. [Google Scholar] [CrossRef] [Green Version]
- Wu, R.H.; Lin, H.Y. System Analysis and Design-Theory and Application; Bestwise Publishing Co.: Taipei, China, 2001. [Google Scholar]
- What is TM Palletizing Operator? Available online: https://www.tm-robot.com/zh-hant/tm-palletizing-operator (accessed on 1 September 2021).
- CMD Yaskawa Motoman Robotic Palletizer. Available online: https://www.youtube.com/watch?v=bhBqc6ocBeY&ab_channel=YaskawaAmerica%2CInc (accessed on 28 September 2018).
- A Strong Partner in Automation—KUKA Robot Makes Medium-Sized Malaysian Company Fit for the Future. Available online: https://www.youtube.com/watch?v=aTL_PS04AZ4&t=16s&ab_channel=KUKA-Robots%26Automation (accessed on 19 March 2020).


| Title | This Study | Exact Depth-First Algorithm [4] | Steudel’s Heuristic Algorithm [5] | Recursive Partitioning Algorithm [6] | Heuristic Packing Algorithm [7] |
|---|---|---|---|---|---|
| Peripheral complete rectangle | Yes | No | Yes | No | No |
| Space utilization | Medium | High | Low | Medium | High |
| Logic | Yes | No | Yes | Yes | No |
| Staggered stacking | Yes | No | No | No | Yes |
| Object coordinate generation | Yes | No | No | Yes | No |
| Computing speed | High | Low | High | High | Low |
| Practical application | Yes | No | No | Yes | No |
| Area | Horizontal Axis | Vertical Axis |
|---|---|---|
| Block 1 | ||
| Block 2 | ||
| Block 3 | ||
| Block 4 |
Publisher’s Note: MDPI stays neutral with regard to jurisdictional claims in published maps and institutional affiliations. |
© 2021 by the authors. Licensee MDPI, Basel, Switzerland. This article is an open access article distributed under the terms and conditions of the Creative Commons Attribution (CC BY) license (https://creativecommons.org/licenses/by/4.0/).
Share and Cite
Lee, J.-D.; Chang, C.-H.; Cheng, E.-S.; Kuo, C.-C.; Hsieh, C.-Y. Intelligent Robotic Palletizer System. Appl. Sci. 2021, 11, 12159. https://doi.org/10.3390/app112412159
Lee J-D, Chang C-H, Cheng E-S, Kuo C-C, Hsieh C-Y. Intelligent Robotic Palletizer System. Applied Sciences. 2021; 11(24):12159. https://doi.org/10.3390/app112412159
Chicago/Turabian StyleLee, Jeng-Dao, Chen-Huan Chang, En-Shuo Cheng, Chia-Chen Kuo, and Chia-Ying Hsieh. 2021. "Intelligent Robotic Palletizer System" Applied Sciences 11, no. 24: 12159. https://doi.org/10.3390/app112412159