1. Introduction
In general, sustainability is related to natural materials and ecological issues. For example, in the past Buchanan and Honey compared energy consumption and carbon dioxide emissions to build different types of typical buildings (commercial, industrial, and residential) in New Zealand [
1]. More recently, the circular economy paradigm was the basis for designing a facade for a building rehabilitation, quantifying the improvement in energy efficiency with respect to a conventional facade [
2]. A review of current and alternative systems to reduce the environmental impacts of road refrigerated transport was proposed to minimize energy consumption and greenhouse gas emissions [
3]. Concerning energy savings in metro systems, Wang et al. [
4] recently proposed an integrated energy efficient train operation method with a jointly optimized driving strategy and train timetable. On the same topic, Su et al. [
5] proposed an energy efficient train operation method that used the cooperative control approach to minimize the difference between the traction energy consumption and the reused regenerative energy.
A perspective can be proposed that is more focused on buildings and sustainability. For example, Mithraratne et al. [
4] developed a method for the life cycle analysis (LCA) of a residential building in New Zealand, based on the embodied and operating energy requirements and life cycle cost over the useful life of the building [
6]. Zhu and Lin [
7] analyzed the characteristics and requirements of sustainable buildings in China and recommended different technical approaches for designing and implementing more efficient buildings. Asif and his group provided an LCA of a three-bedroom semi-detached house in Scotland [
8]. The authors analyzed five construction materials (ceramic, aluminum, wood, concrete and glass) determining their respective embodied energy and environmental impacts. They found that concrete consumed the greater part of the total energy embodied in the building.
Professor Lazzarin’s interest in environmental sustainability dates to the 1970s of the past century at the beginning of his academic career with the first studies on solar cooling [
9,
10]. As its main innovation, this paper describes the research studies and results in sustainable energy systems developed by Professor Renato Lazzarin (now retired) and his research group during the 2000–2015 period, when he was working at the Department of Management and Engineering (DTG) of the University of Padova (Italy). To the best knowledge of the authors, no similar studies have been proposed in the literature that go through a long period of work from a research group of a university department on the topic of sustainable energy systems.
Many different technologies were objects of the authors’ interest and work. During the first years of 2000, Prof. Lazzarin and his research group focused on the topic of thermo-insulating materials [
11]. The latter can be chlorofluorocarbon (CFC) and hydrofluorocarbon (HCFC) free, with a great positive effect preventing ozone depletion; nevertheless, an indirect negative effect is expected to increase the energy consumption of a building as a result of lower insulating properties. As a more mature approach to sustainability, the authors proposed to evaluate the environmental effect of thermo-insulating materials along their useful life. Therefore, the research work focused both on the environmental impact during their life (LCA) and on an economic evaluation (life cycle cost, LCC) to evaluate the optimum thickness in different climates (
Section 2.1).
At the beginning of 2000, another topic related to sustainable energy technologies in building applications was the subject of Professor Lazzarin and his research group’s interest, concerning the evaluation of the energy performance of green roofs [
12,
13]. As is well known, this is a useful technique to reduce the energy requirements of buildings and to ensure acceptable indoor comfort conditions. Only a few studies had been conducted before. For example, in [
14] the thermal properties and energy performance of a green roof were investigated in two phases, the first with extended surface and air temperature measurements and the second with the development of a mathematical model to evaluate the thermal properties and energy saving potential of the green roof. Theodosiou [
15] developed a similar study: By using real data from an existing building in the Mediterranean area, the model developed was included in the building energy simulation.
Taking advantage of a new green roof realized at the Vicenza Hospital, the authors of this article installed a monitoring system with sensors that measure solar radiation, rainfall, air humidity and temperature for a survey of the main variables affecting the behavior of the green roof and the rooms below [
13]. Such experimental measures were useful to tune the dynamic state, mono-dimensional model developed by the authors in Trnsys
® (
Section 2.2).
Another line of research in sustainable systems was related to solar technologies, in particular thermal collectors and photovoltaic (PV). Literature on such a topic is very wide: Goel et al. [
16] presented a comprehensive review of solar thermal air heating systems, discussing the various designs and techniques used for performance enhancement; recently, Sarma et al. [
17] published a review on research work on improving the thermal performance of the solar flat plate collector; Singh and his group reported a review of solar energy and concentrating collectors and their application in power plants [
18]; Zluwa and Pitha [
19] provided an overview of the relevant literature on building greenery systems and PV combined solutions; in [
20], a review was conducted on building integrated photovoltaic systems to provide guidance for practical applications in terms of the selection of appropriate photovoltaic technologies, temperature management, enhancement of solar irradiation and avoidance of excessive mechanical strain; finally, Abdin and Rachid [
21] provided a review of photovoltaic/thermal technology (PV/T), describing the different heat extraction media, hybrid design configurations and their feasibility and efficiency in the industry and buildings sector.
Professor Lazzarin worked on solar systems from the 1980s [
22,
23,
24,
25,
26,
27,
28] when interest in solar renewable technologies started to increase due to the oil crisis of the 1970s. As is well known, both solar thermal and photovoltaic energy have some drawbacks. For example, the former can produce mechanical (and electric) power only with low efficiency, unless it is specifically designed to concentrate solar radiation and to produce very high temperature heat. The latter can convert into electricity only 6% to 25% of solar radiation; the rest is converted and released as heat, with a real performance that is usually lower and decreases with the age of the modules. An effective way to increase the electrical efficiency of PV is to cool the panel by liquid (or air). Therefore, PV/T produces electricity and heat in the same area. The authors worked on liquid active systems, where waste heat can be recovered for domestic water heating or for use as a cold source for a heat pump (
Section 2.3).
During the first part of his academic life, Professor Lazzarin worked mainly on solar and heating technologies. In fact, until the first years of 2000, domestic hot water (DHW) and heating were the largest part of the energy load of buildings, especially in the northern climate [
29]. Due to European legislation (2010/31/UE Directive [
30]) and global climate change, new and energy-renovated buildings will require more cooling than heating throughout the year, due to reduction of thermal losses and the increasing importance of internal heat gains [
31]. This was the reason for the interest of Prof. Lazzarin’s research group in evaluating the energy and economic viability of economizer cycles [
32,
33,
34]. These can satisfy cooling loads in the case that the external air temperature is lower than the set indoor air temperature [
35] (
Section 2.4).
In the second part of the 2000–2015 period, Professor Lazzarin’s group focused his research on sustainable technologies mainly on two lines. One was related to energy saving technologies for refrigeration and air conditioning equipment, especially in supermarkets [
36,
37,
38,
39,
40,
41,
42] (
Section 2.5). The second was related to the urban heat island (UHI) phenomenon, participating in the European Project “UHI—Development and application of mitigation and adaptation strategies and measures for counteracting the global Urban Heat Islands phenomenon” [
43].
Within the project (whose main objective was to connect partners from different countries to study UHI and to propose solutions to prevent, adapt and to mitigate the risks), the authors’ group used three different methodologies to study the effect of UHI in Padova: The analysis of data from the meteorological stations of the Veneto Environment Protection Regional Agency’s; mobile surveys that were necessary to map the phenomenon; development of simulation models to determine outdoor comfort indexes and their variation with different mitigation strategies [
44,
45,
46,
47] (
Section 2.6).
In the following sections, the main hypotheses, methods and results of the previously described research studies are synthesized. By the presentation of a synthesis of the different research works on sustainable energy technologies carried out over 15 years at the Department of Management and Engineering, the main goal is to describe different strategies and approaches to energy sustainability in buildings and related plants carried out by the authors.
2. Research in Sustainable Energy Systems at DTG: Main Results and Discussion
In the next sections, the main research works on innovative sustainable energy technologies based on experimental and theoretical/modelling studies carried on by the authors under the supervision of Professor Lazzarin in different periods during the 2000–2015 period are described.
2.1. LCA and LCC of Building Insulation Materials in Italy
The case study simulated by Trnsys
® was a typical Italian two-story house with an area of 135 m
2, a volume of 363 m
3 and an external surface area of 327 m
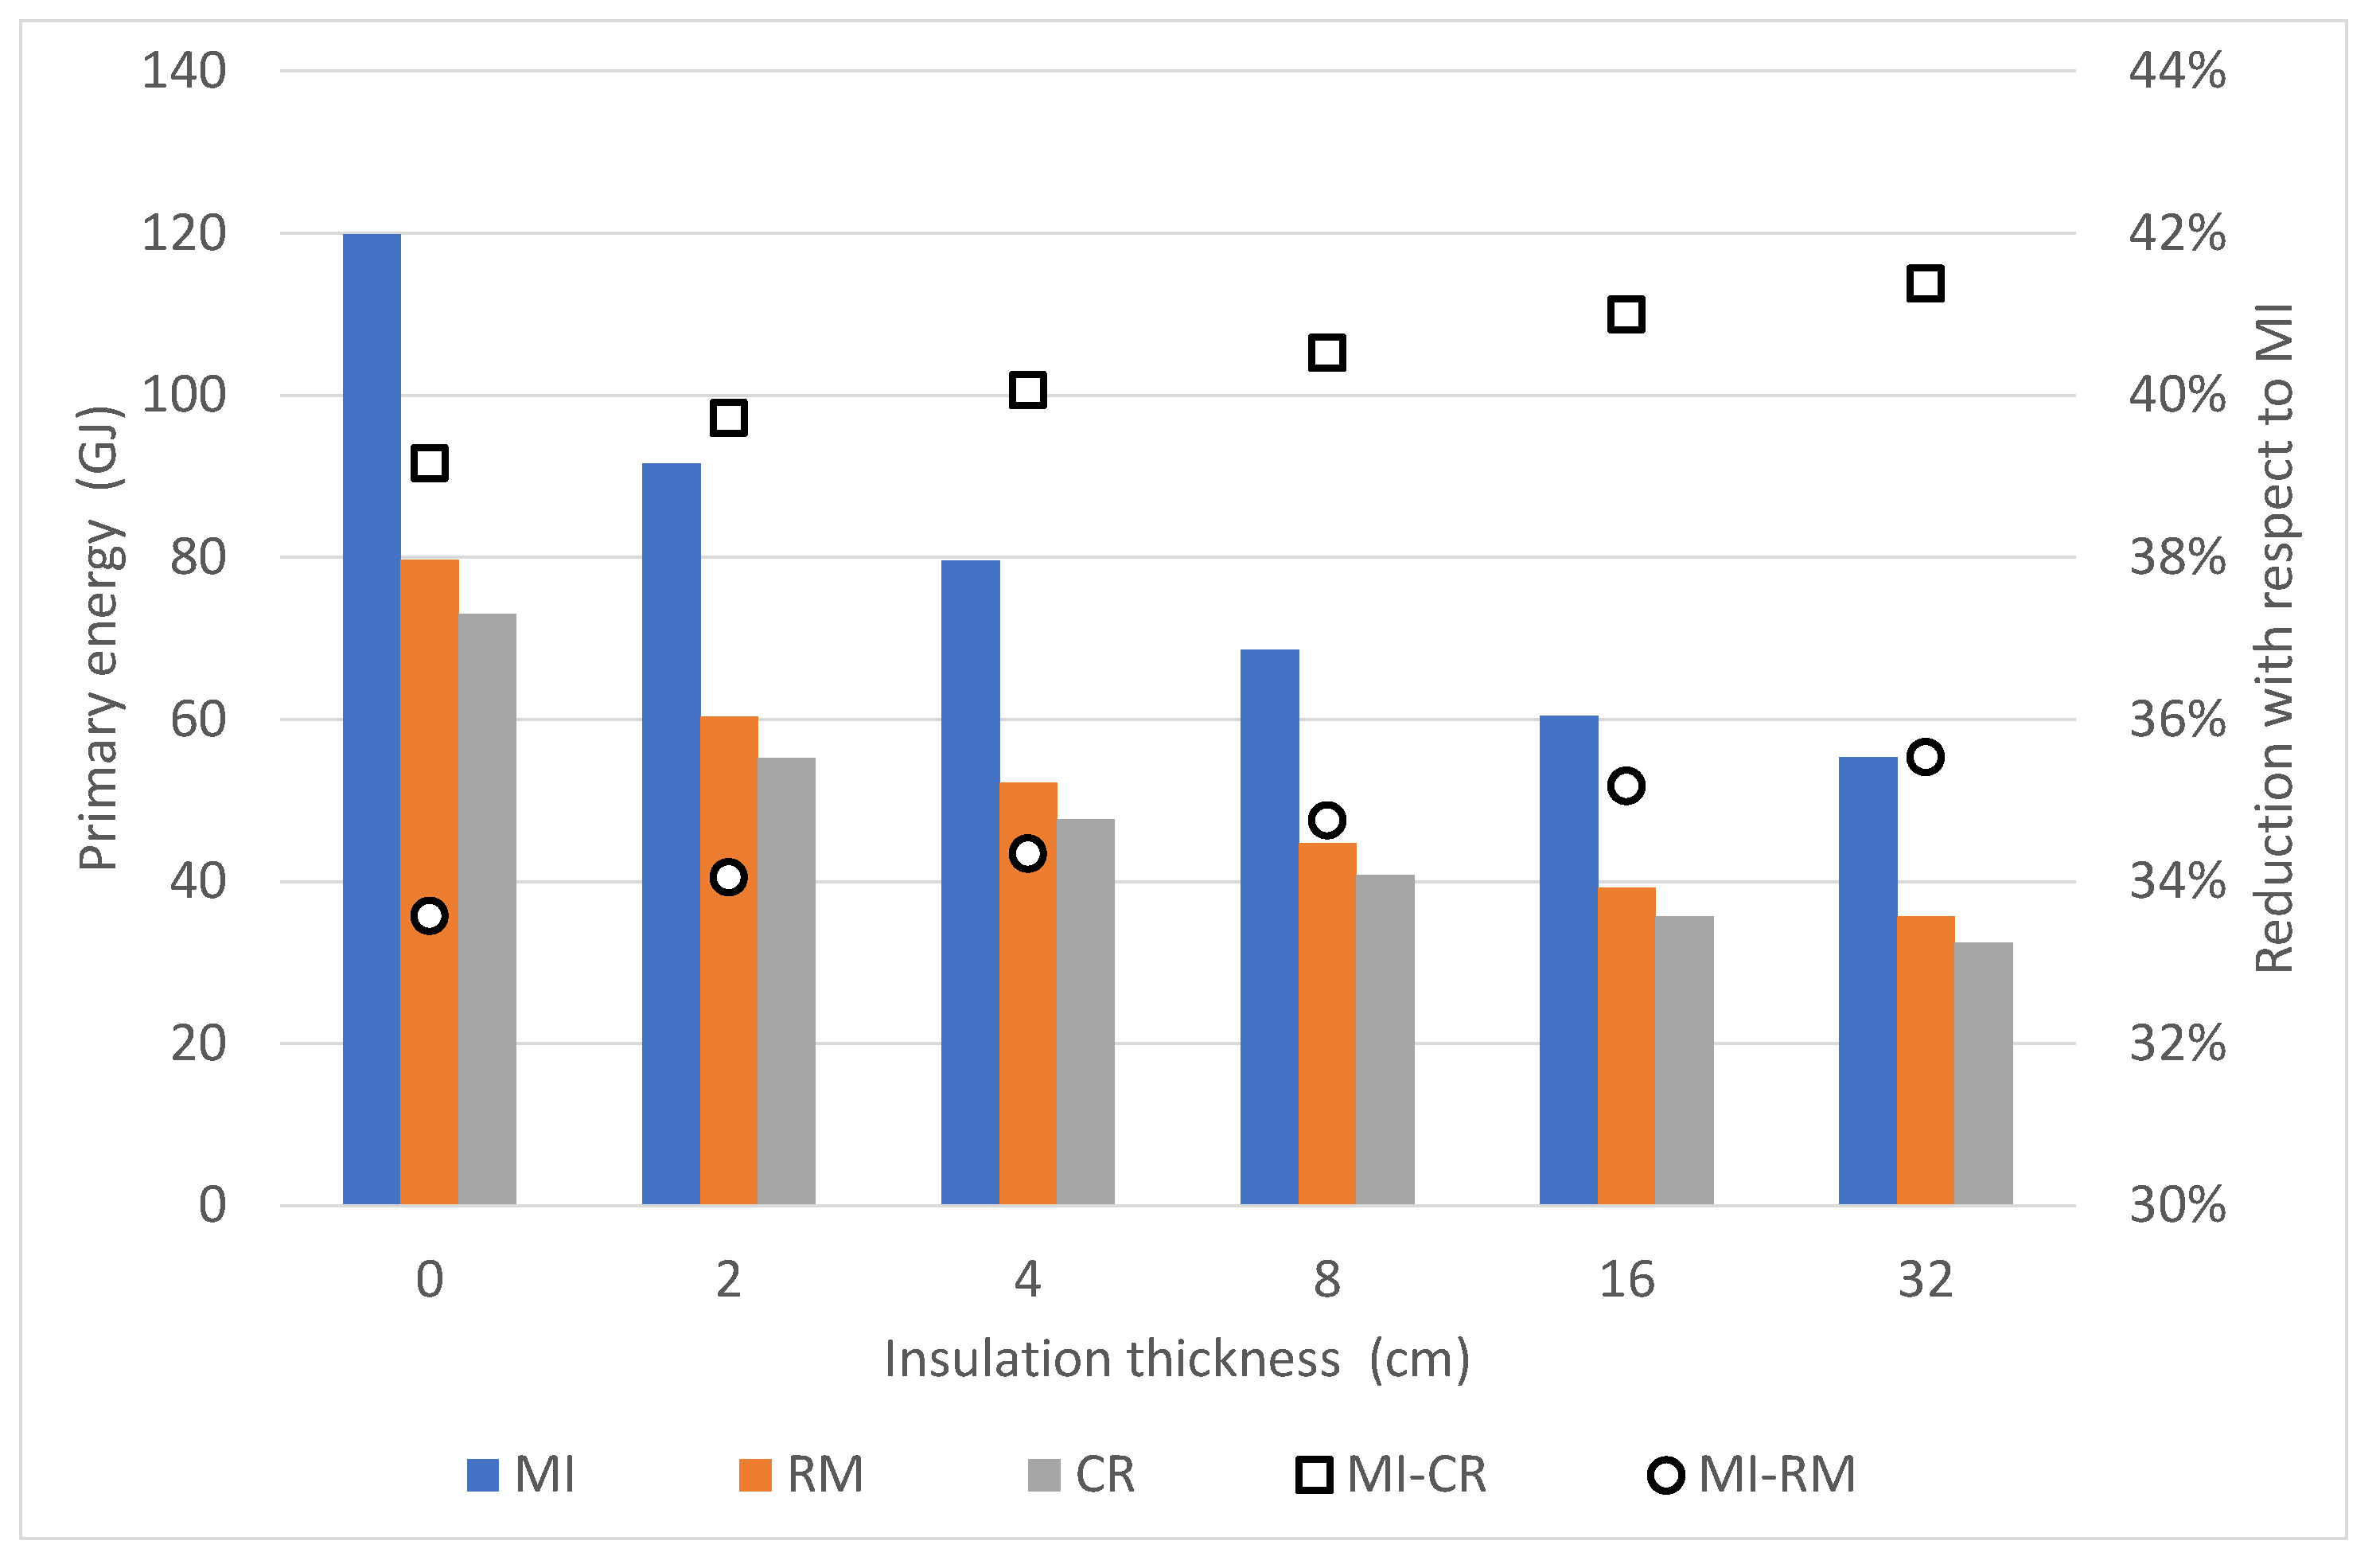
2. Roofs and walls were covered with insulating material. Some parameters for the analysis were fixed: Set-point temperatures, global electrical efficiency of 39%, natural gas boiler with average seasonal efficiency of 75%, electric air conditioning system with average coefficient of performance (COP) of 2.5. The cooling and heating thermal loads as primary energy (PE) were determined for three different climates (
Figure 1). In PE consumption of Rome and Crotone was definitely lower than that of Milan (−33 to 41%). This was mainly due to the heating contribution, whereas the cooling load increased in the southern resort, but it remained a reduced part, less than 10%.
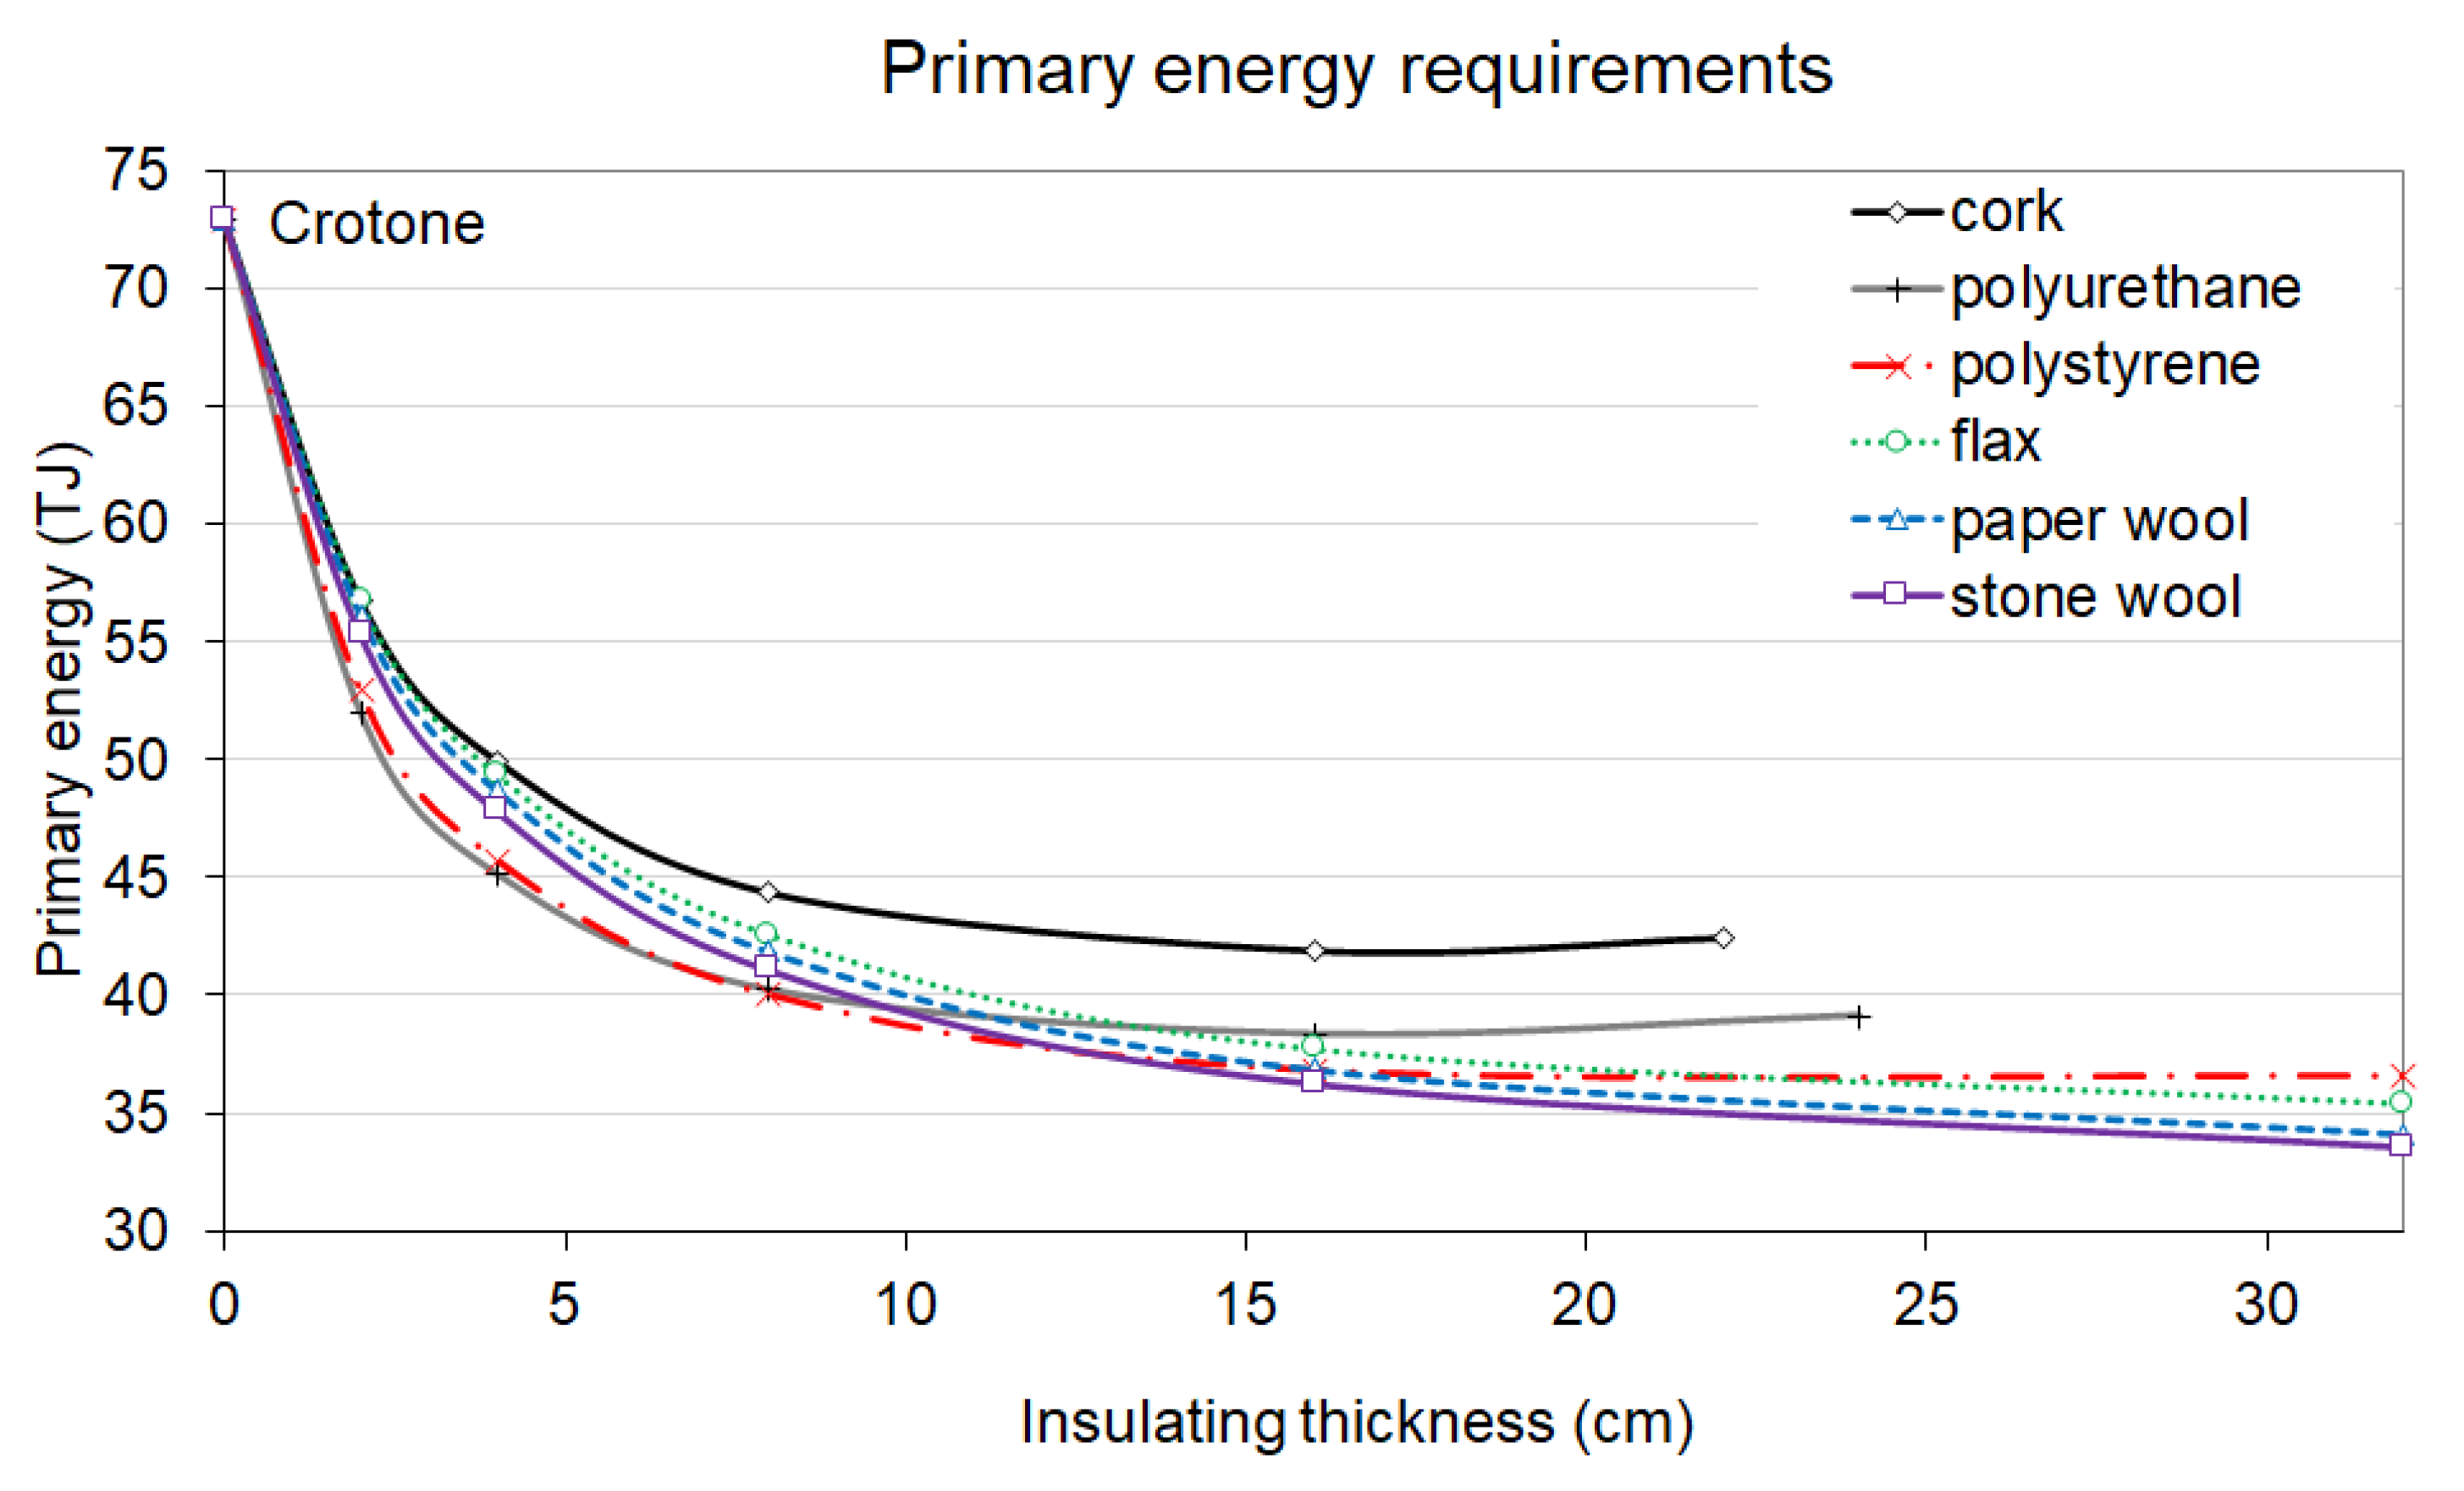
The LCA analysis for Crotone is reported in
Figure 2 for a fixed building life of 50 years. Assuming that energy was not recovered at the end of the material life (that is, the feed stock energy was included), some insulating materials featured a minimum of PE consumption. For example, the optimum thickness of expanded polyurethane foam was 17.5 cm while it was 20 cm, and 18.5 cm, respectively, for the cities of Milan and Rome. This means that no advantage was reported by increasing the insulation thickness from the LCA point of view, as the energy saving during the lifetime was not sufficient to compensate for the energy used to produce the insulation panels.
Other materials did not feature any minimum point in total PE consumption in the thickness range considered (0–32 cm). For example, since the stone wool batts featured a low value of feedstock energy (16%), the total requirement did not vary significantly. As a matter of fact, the energy savings produced in the lifetime climatization allowed the energy cost of the material to be always paid back.
Even in the most unfavorable conditions (cork panels, i.e., the material with the highest energy requirement per functional unit, and the climate of Crotone that had the lowest annual load), a payback energy lower than three months was calculated.
Figure 2.
Primary energy consumed in Crotone (feed stock energy included).
Figure 2.
Primary energy consumed in Crotone (feed stock energy included).
In terms of LCC, the authors compared the results of three different cases: Stone wool (with a cost equal to the base cost × 2, approximately 11 € per functional unit); flax (base cost × 2 fixed at 55 € per functional unit, the most expensive material); paper wool (base cost × 2 fixed at 5 € per functional unit, the less expensive material) (
Figure 3). Using flax rolls, no economic benefit was produced in both Milan and Crotone: In fact, for any thickness greater than the minimum of 2 cm available on market, the net present worth (NPW) was higher than without insulation. Instead, the curves featured a minimum NPW only with a thick insulation when using paper wool (7 cm in Crotone, 11 cm in Milan). These are thicknesses that are fully consistent with the current standard of Directive (EU) 2018/844 [
48], but very high for the requirements set by the previous Italian law 412/93 [
49].
The sensitivity analysis developed by the authors highlighted that, differently from the natural gas cost, the optimal thickness did not vary considerably with the electricity cost, both in Milan and in Crotone, due to the low weight of cooling requirements in relative terms.
As the main conclusion and novelty of the study, the authors stated that the most advantageous choice to minimize the energy cost of building management was the insulating material that had the lowest cost per functional unit. It allowed the energy savings to be translated into economic savings, with an optimum thickness that minimized the NPW.
2.2. Summer and Winter Energy Analysis of a Green Roof in Vicenza
Taking advantage of the opportunity of a new green roof realized at the Vicenza Hospital, the authors installed a monitoring system with sensors that measured solar radiation, rainfall, air humidity and temperature for a survey of the main variables affecting the behavior of the green roof and the rooms below [
13] (
Figure 4). Such experimental measures were useful to tune the dynamic state, mono-dimensional model developed by the authors in Trnsys
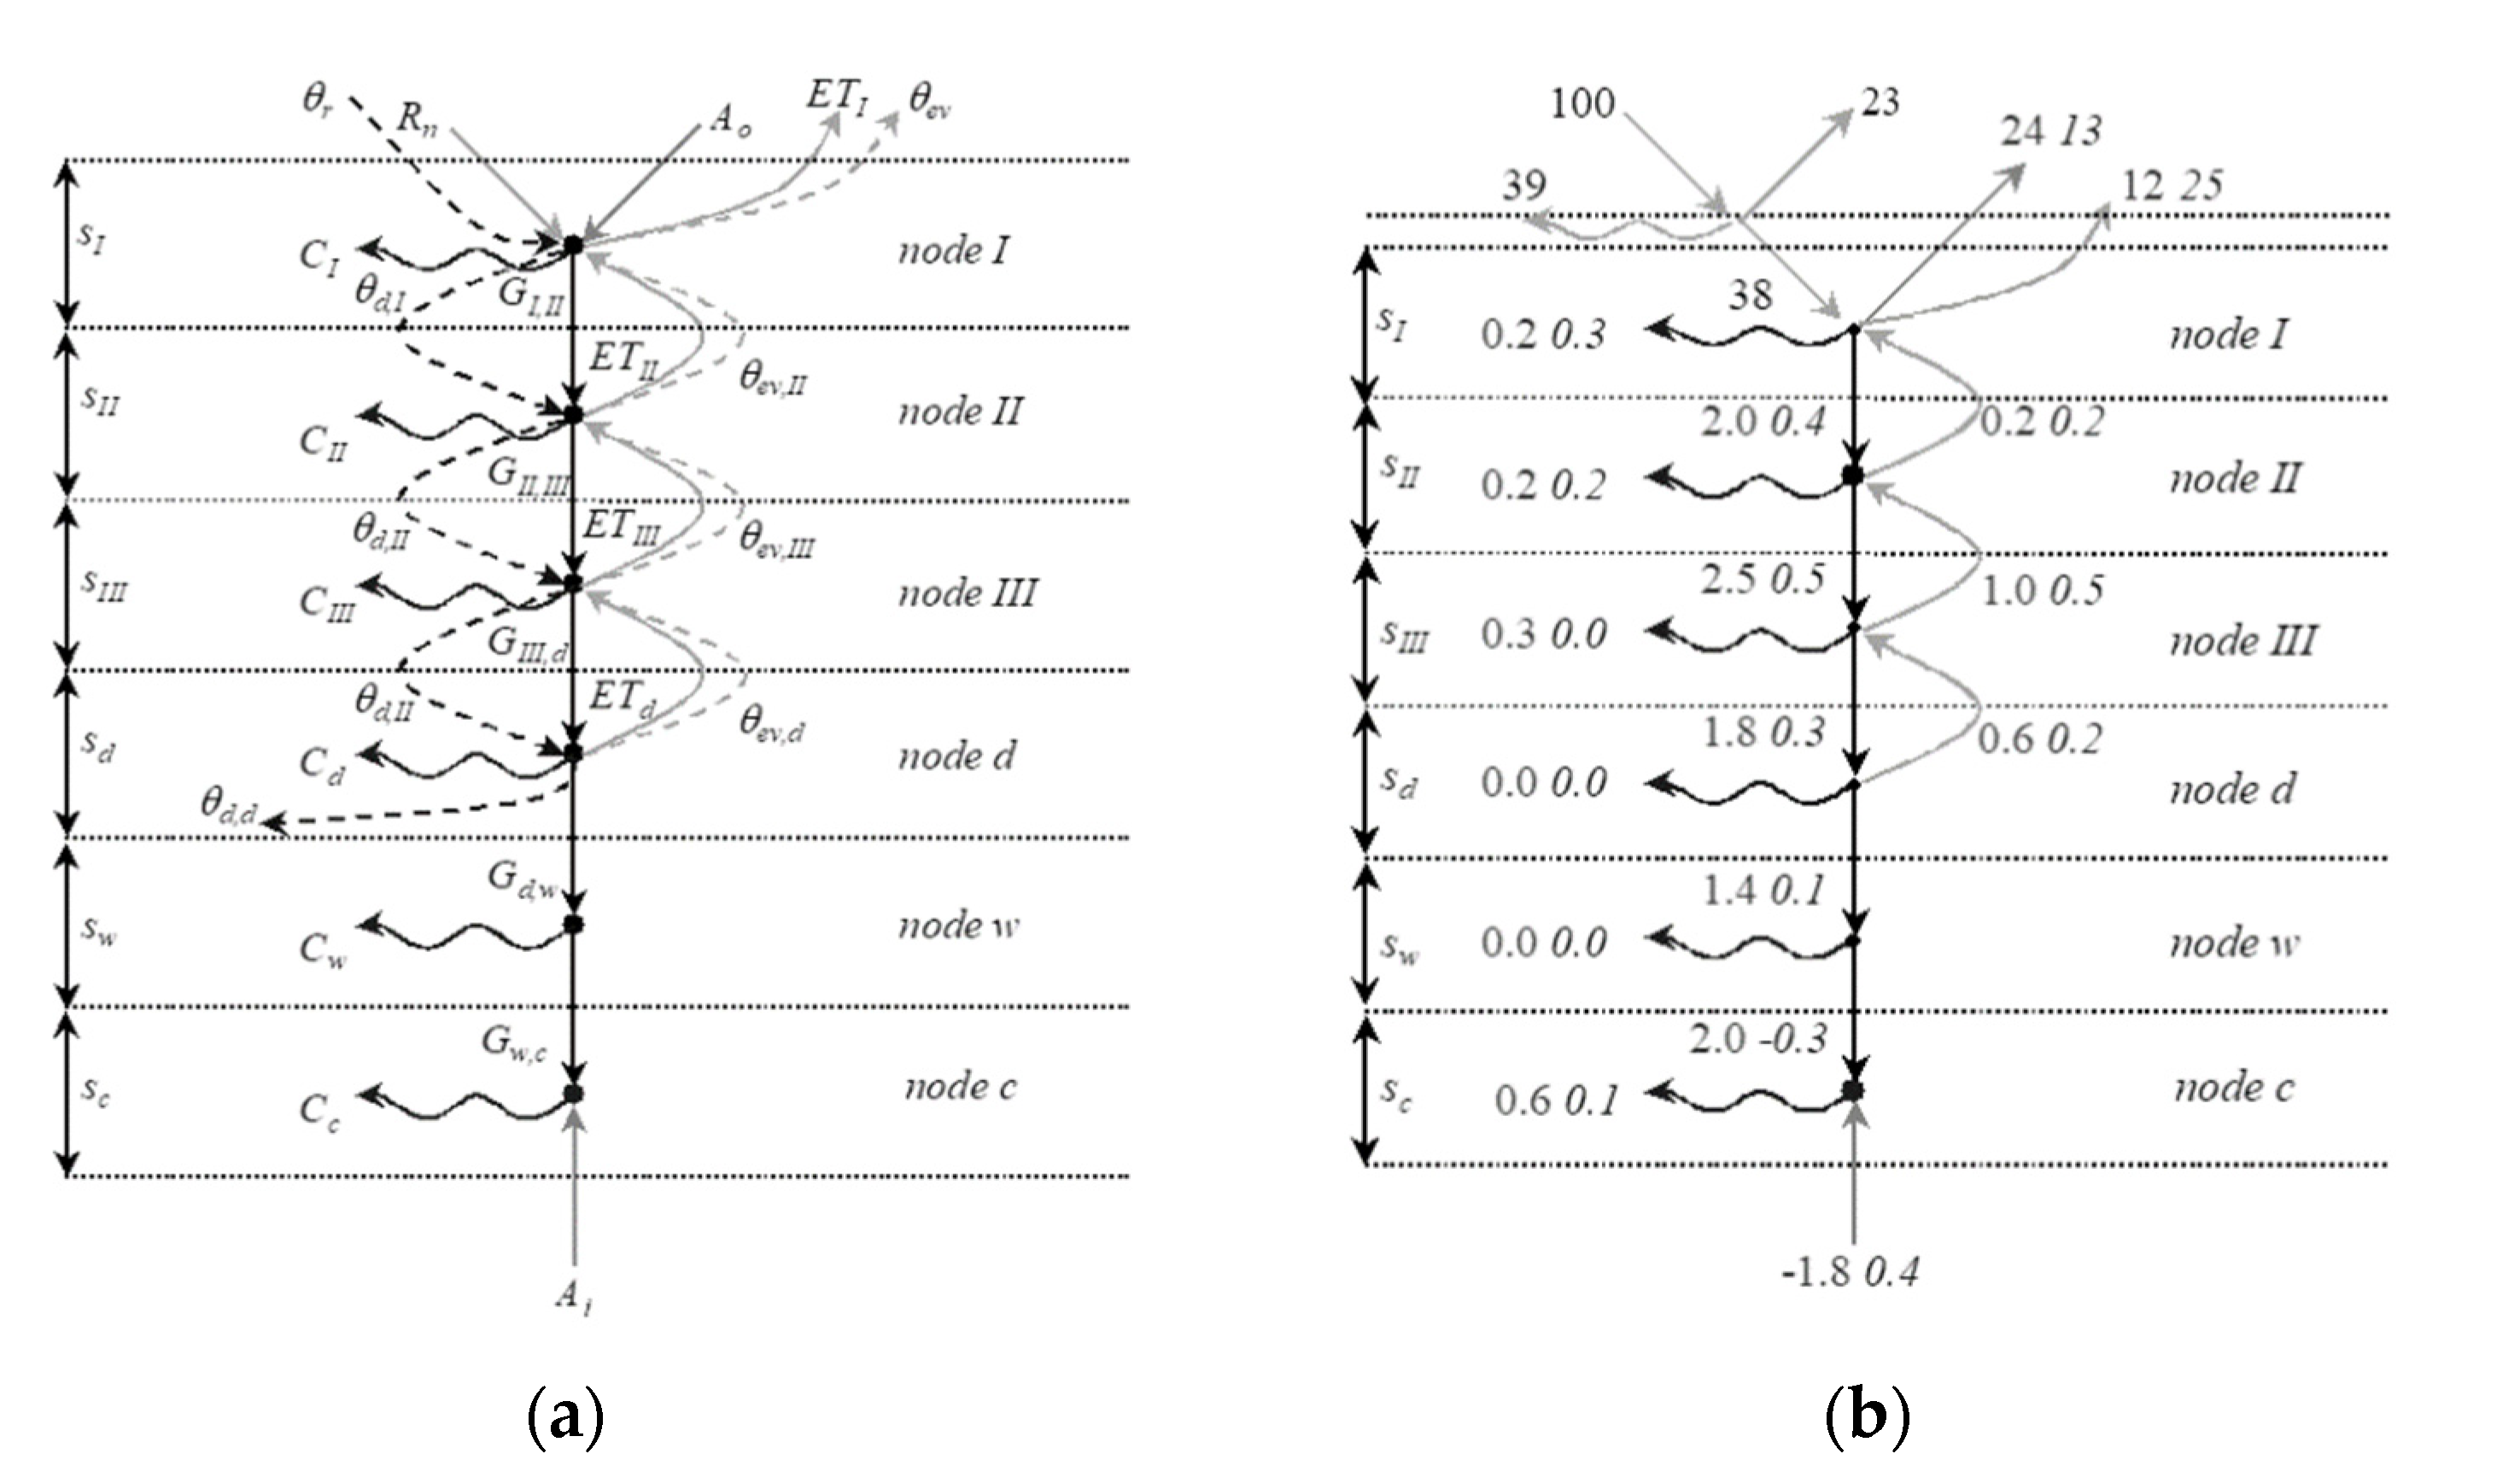
®. Such a study was a novelty, as very few similar studies had been carried out at the time it was realized. The temperature was measured at different depths. However, the temperature between the drainage layer and the waterproofing sheet, the one on the internal surface of the roof and the one of the inside air were measured to estimate the adduction flux.
Two summer sessions (August–September 2002 and June–July 2003) and one winter session (February–March 2004) were monitored. The energy balance was determined in all nodes, based on the values reported in [
13], with the main objective of evaluating the passive cooling capacity and the effect of evapotranspiration during summer, and the insulating capacity of the roof in winter.
Regarding the evapotranspiration process, the performance of the green roof in dry and wet conditions was compared in two different periods characterized by the same incident solar irradiation. In this way, the energy exchanges between the nodes were normalized to 100 units of incident energy. The results are reported in
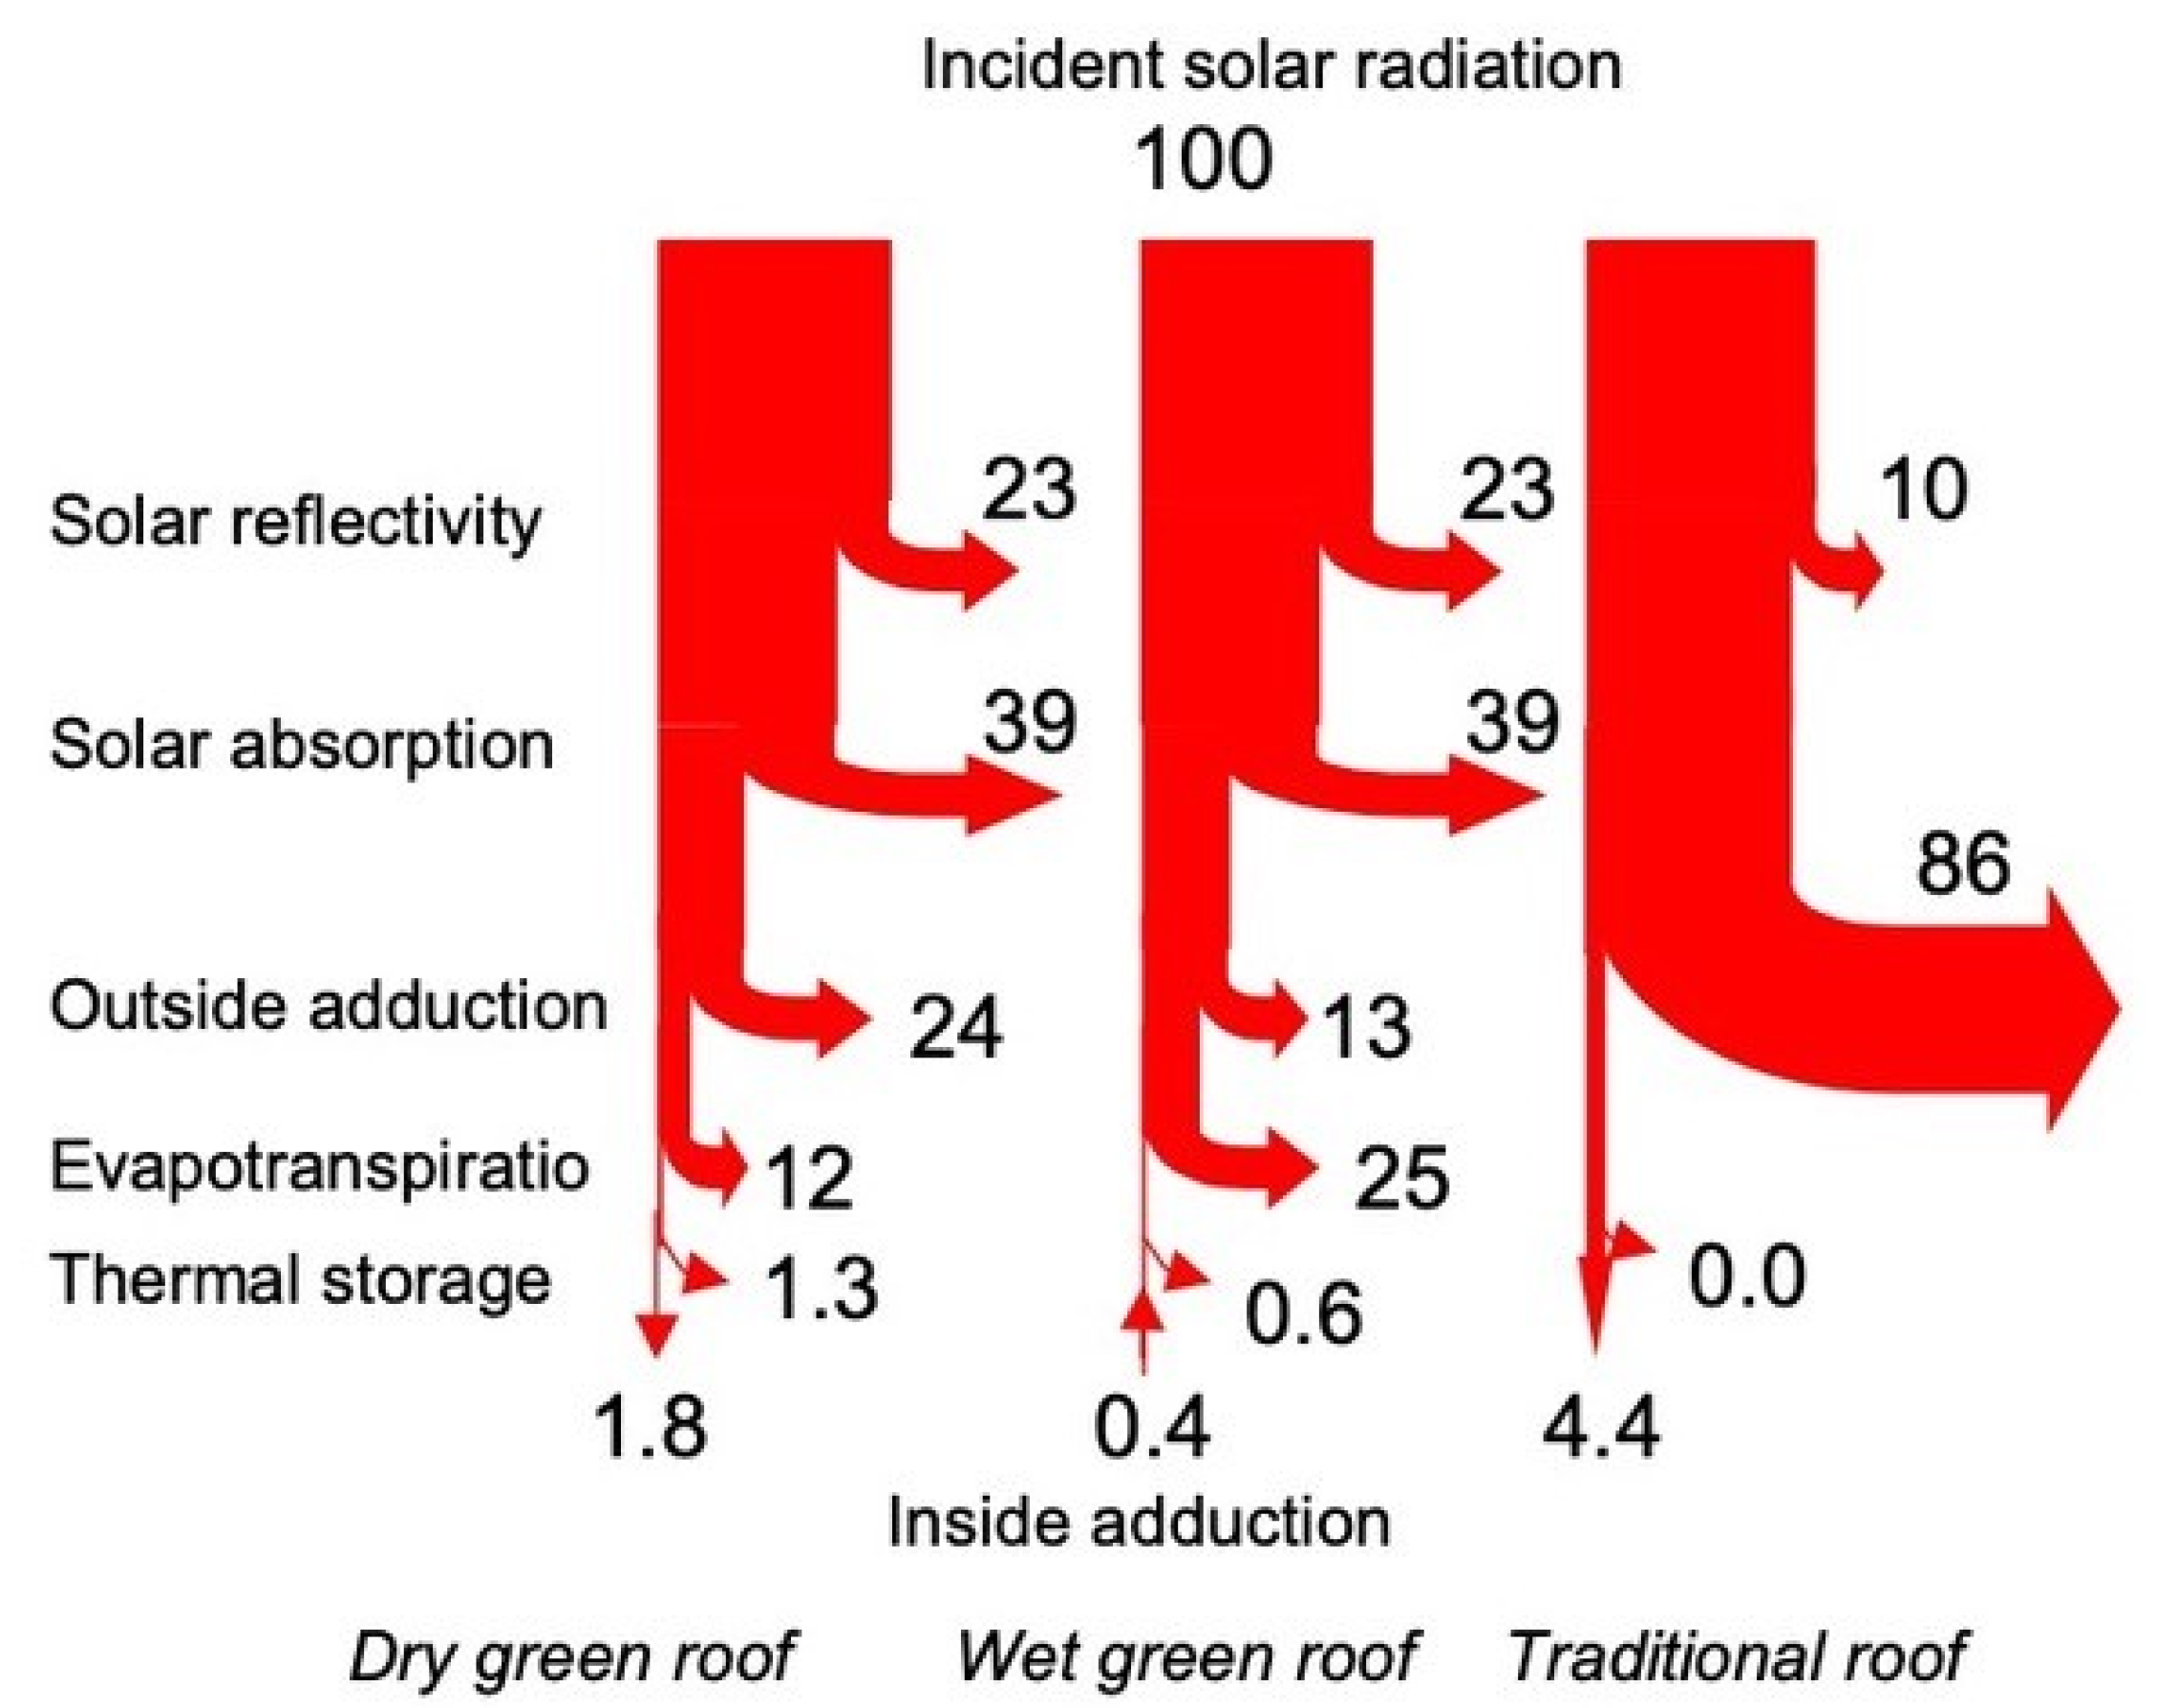
Figure 5: the greenery reflected 23 units and absorbed 39 units.
Figure 5 revealed that adduction and evapotranspiration swapped roles comparing the dry and wet condition periods: When the soil was dryer, the surface temperature reached even 55 °C, while it exceeded 40 °C only once in wet conditions. Furthermore, in wet conditions the outgoing adduction flux was lower than in dry conditions (13 vs. 24 units). Furthermore, the more humid the soil, the more intense the evapotranspiration effect (25 vs. 12 units). The main consequence was a reduced thermal conduction towards the lower layers under wet conditions. As a matter of fact, the green roof in wet conditions not only eliminated the thermal gain of the underneath room due to the roof (1.8 units in dry conditions), but also gave a slight contribution to passive cooling (0.4 units).
The comparison (based on a numerical simulation that fixed the boundary conditions) with a traditional roof allowed the evaluation of the energy savings, based on 100 units of incident solar radiation (
Figure 6). The very different solar reflectivity (0.1 vs. 0.23 of the green roof) and the solar absorption of the greenery allowed the green roof to feature a very low adduction energy exchange. The energy saving can be evaluated by comparing the outgoing adduction energy of the wet green roof and the 4.4 units of the traditional roof entering the underneath room.
The winter session measurements highlighted a poorer energy performance of the green roof compared to a traditional one. In fact, the evapotranspiration flux was appreciable despite the somewhat lower solar radiation, as the latent flux was driven also by the air-vapor-pressure difference. As a consequence, the surface temperature was nearly always lower than the air temperature during the sessions.
Moreover, based on optical, geometric and thermodynamic characteristics, the authors developed a Trnsys
® type to simulate the green roof in a building [
13], in order to calculate the energy performance varying the climatic conditions.
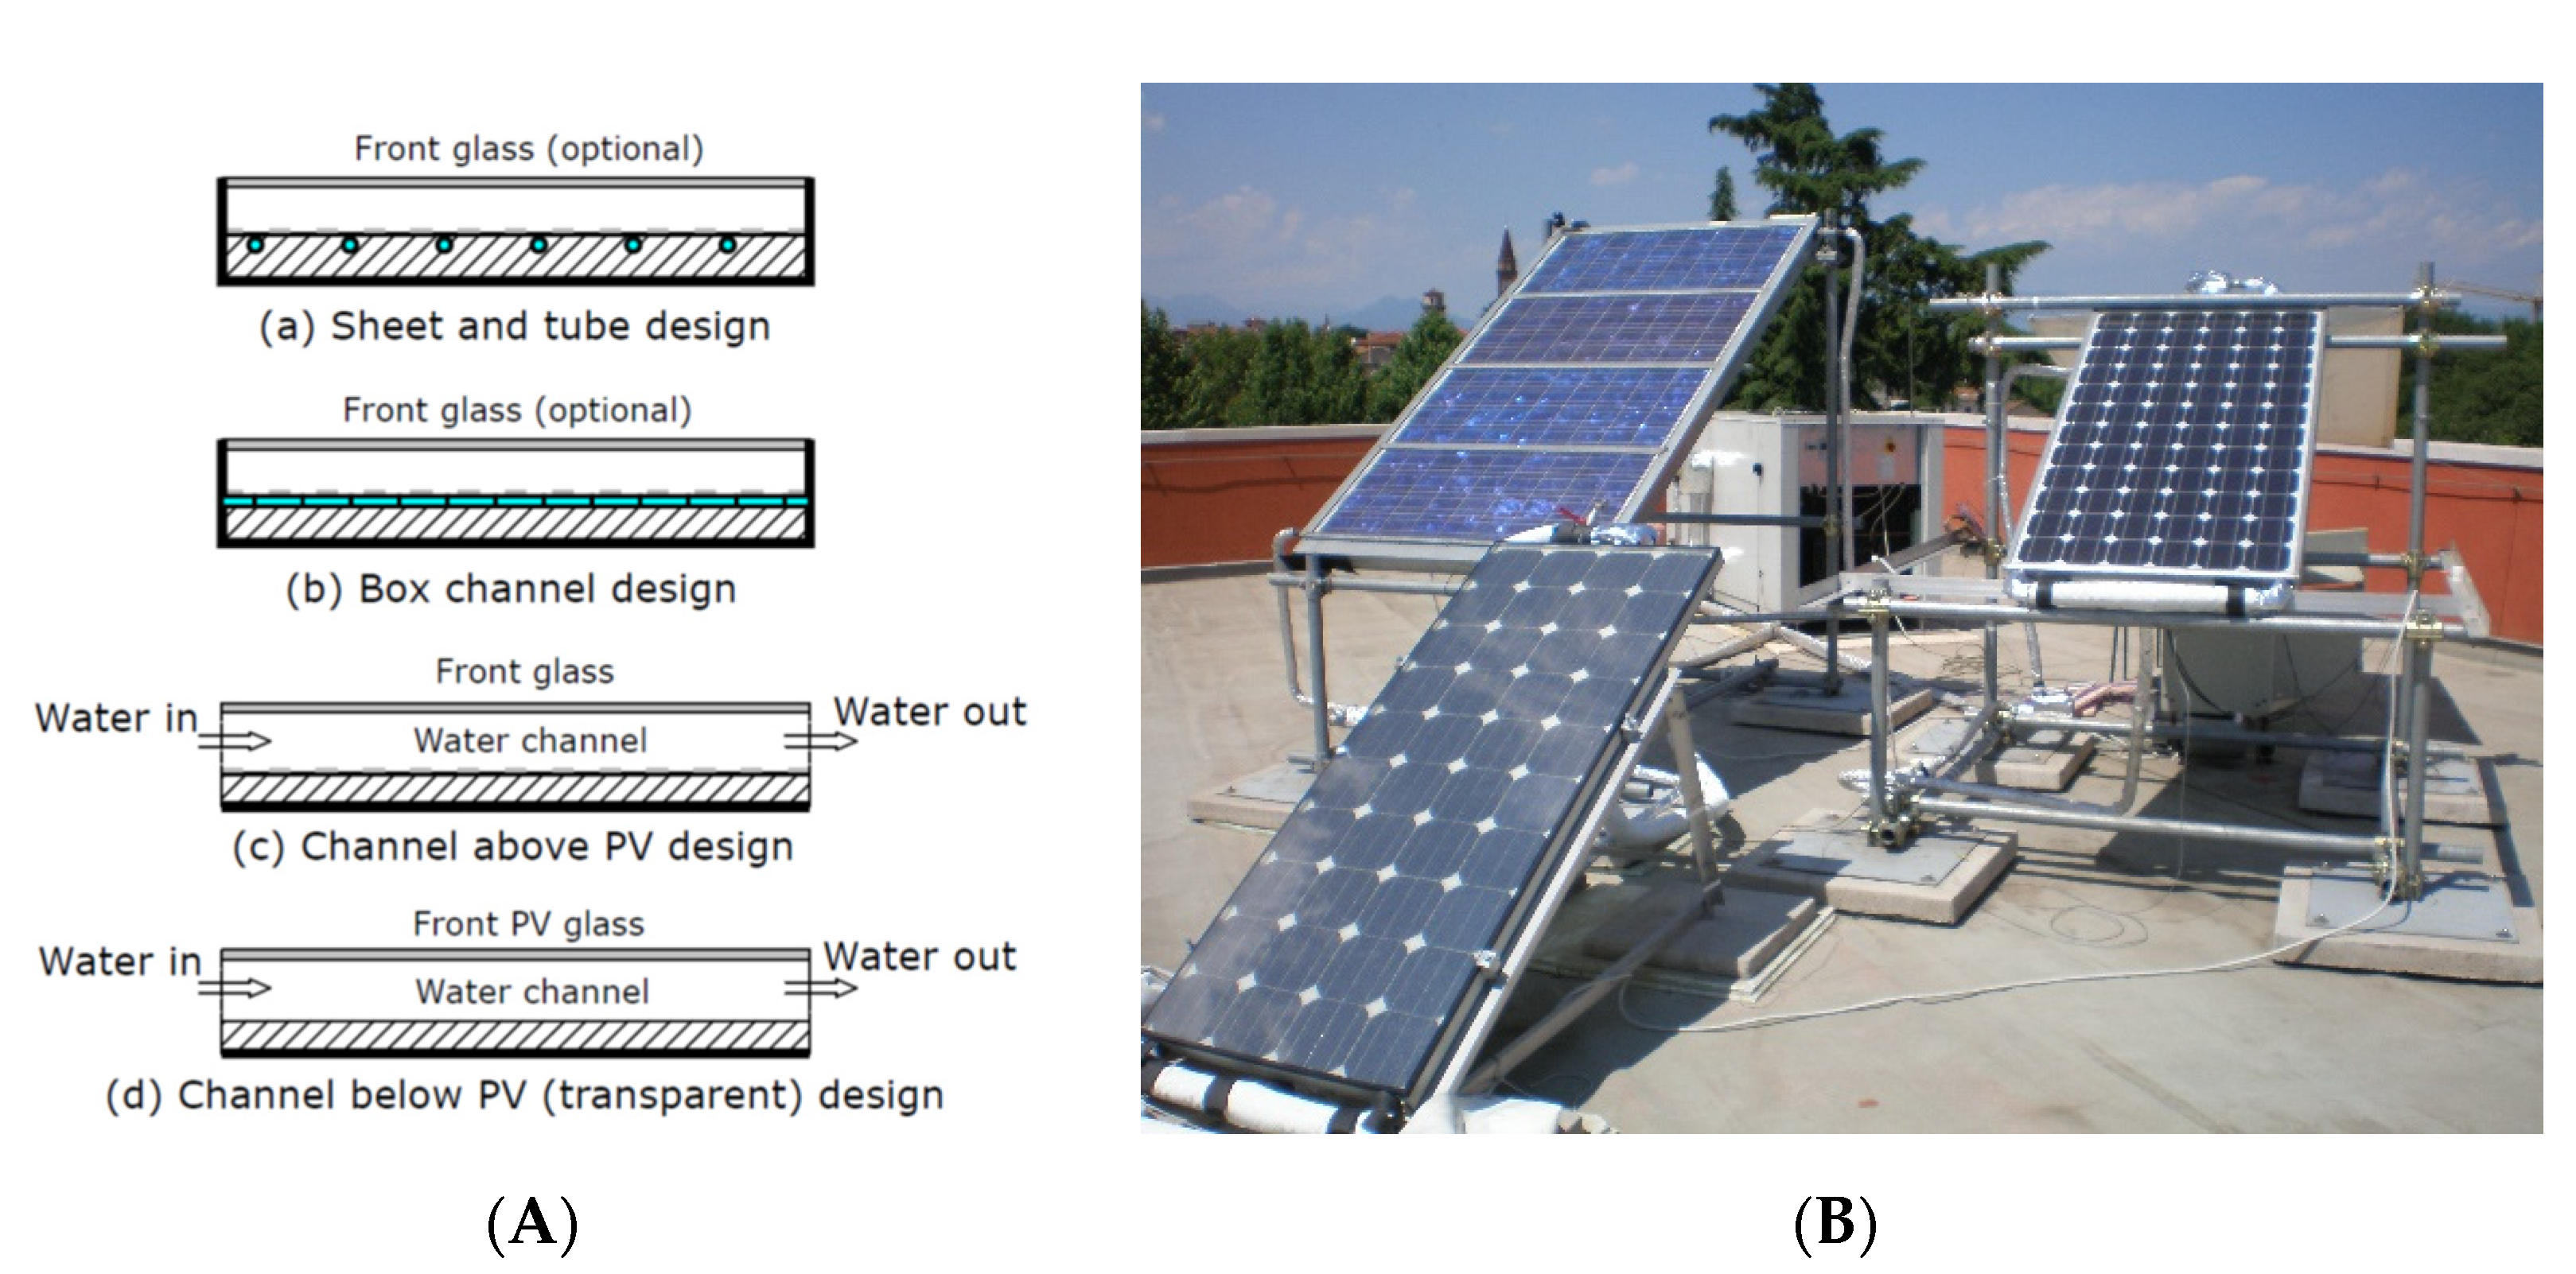
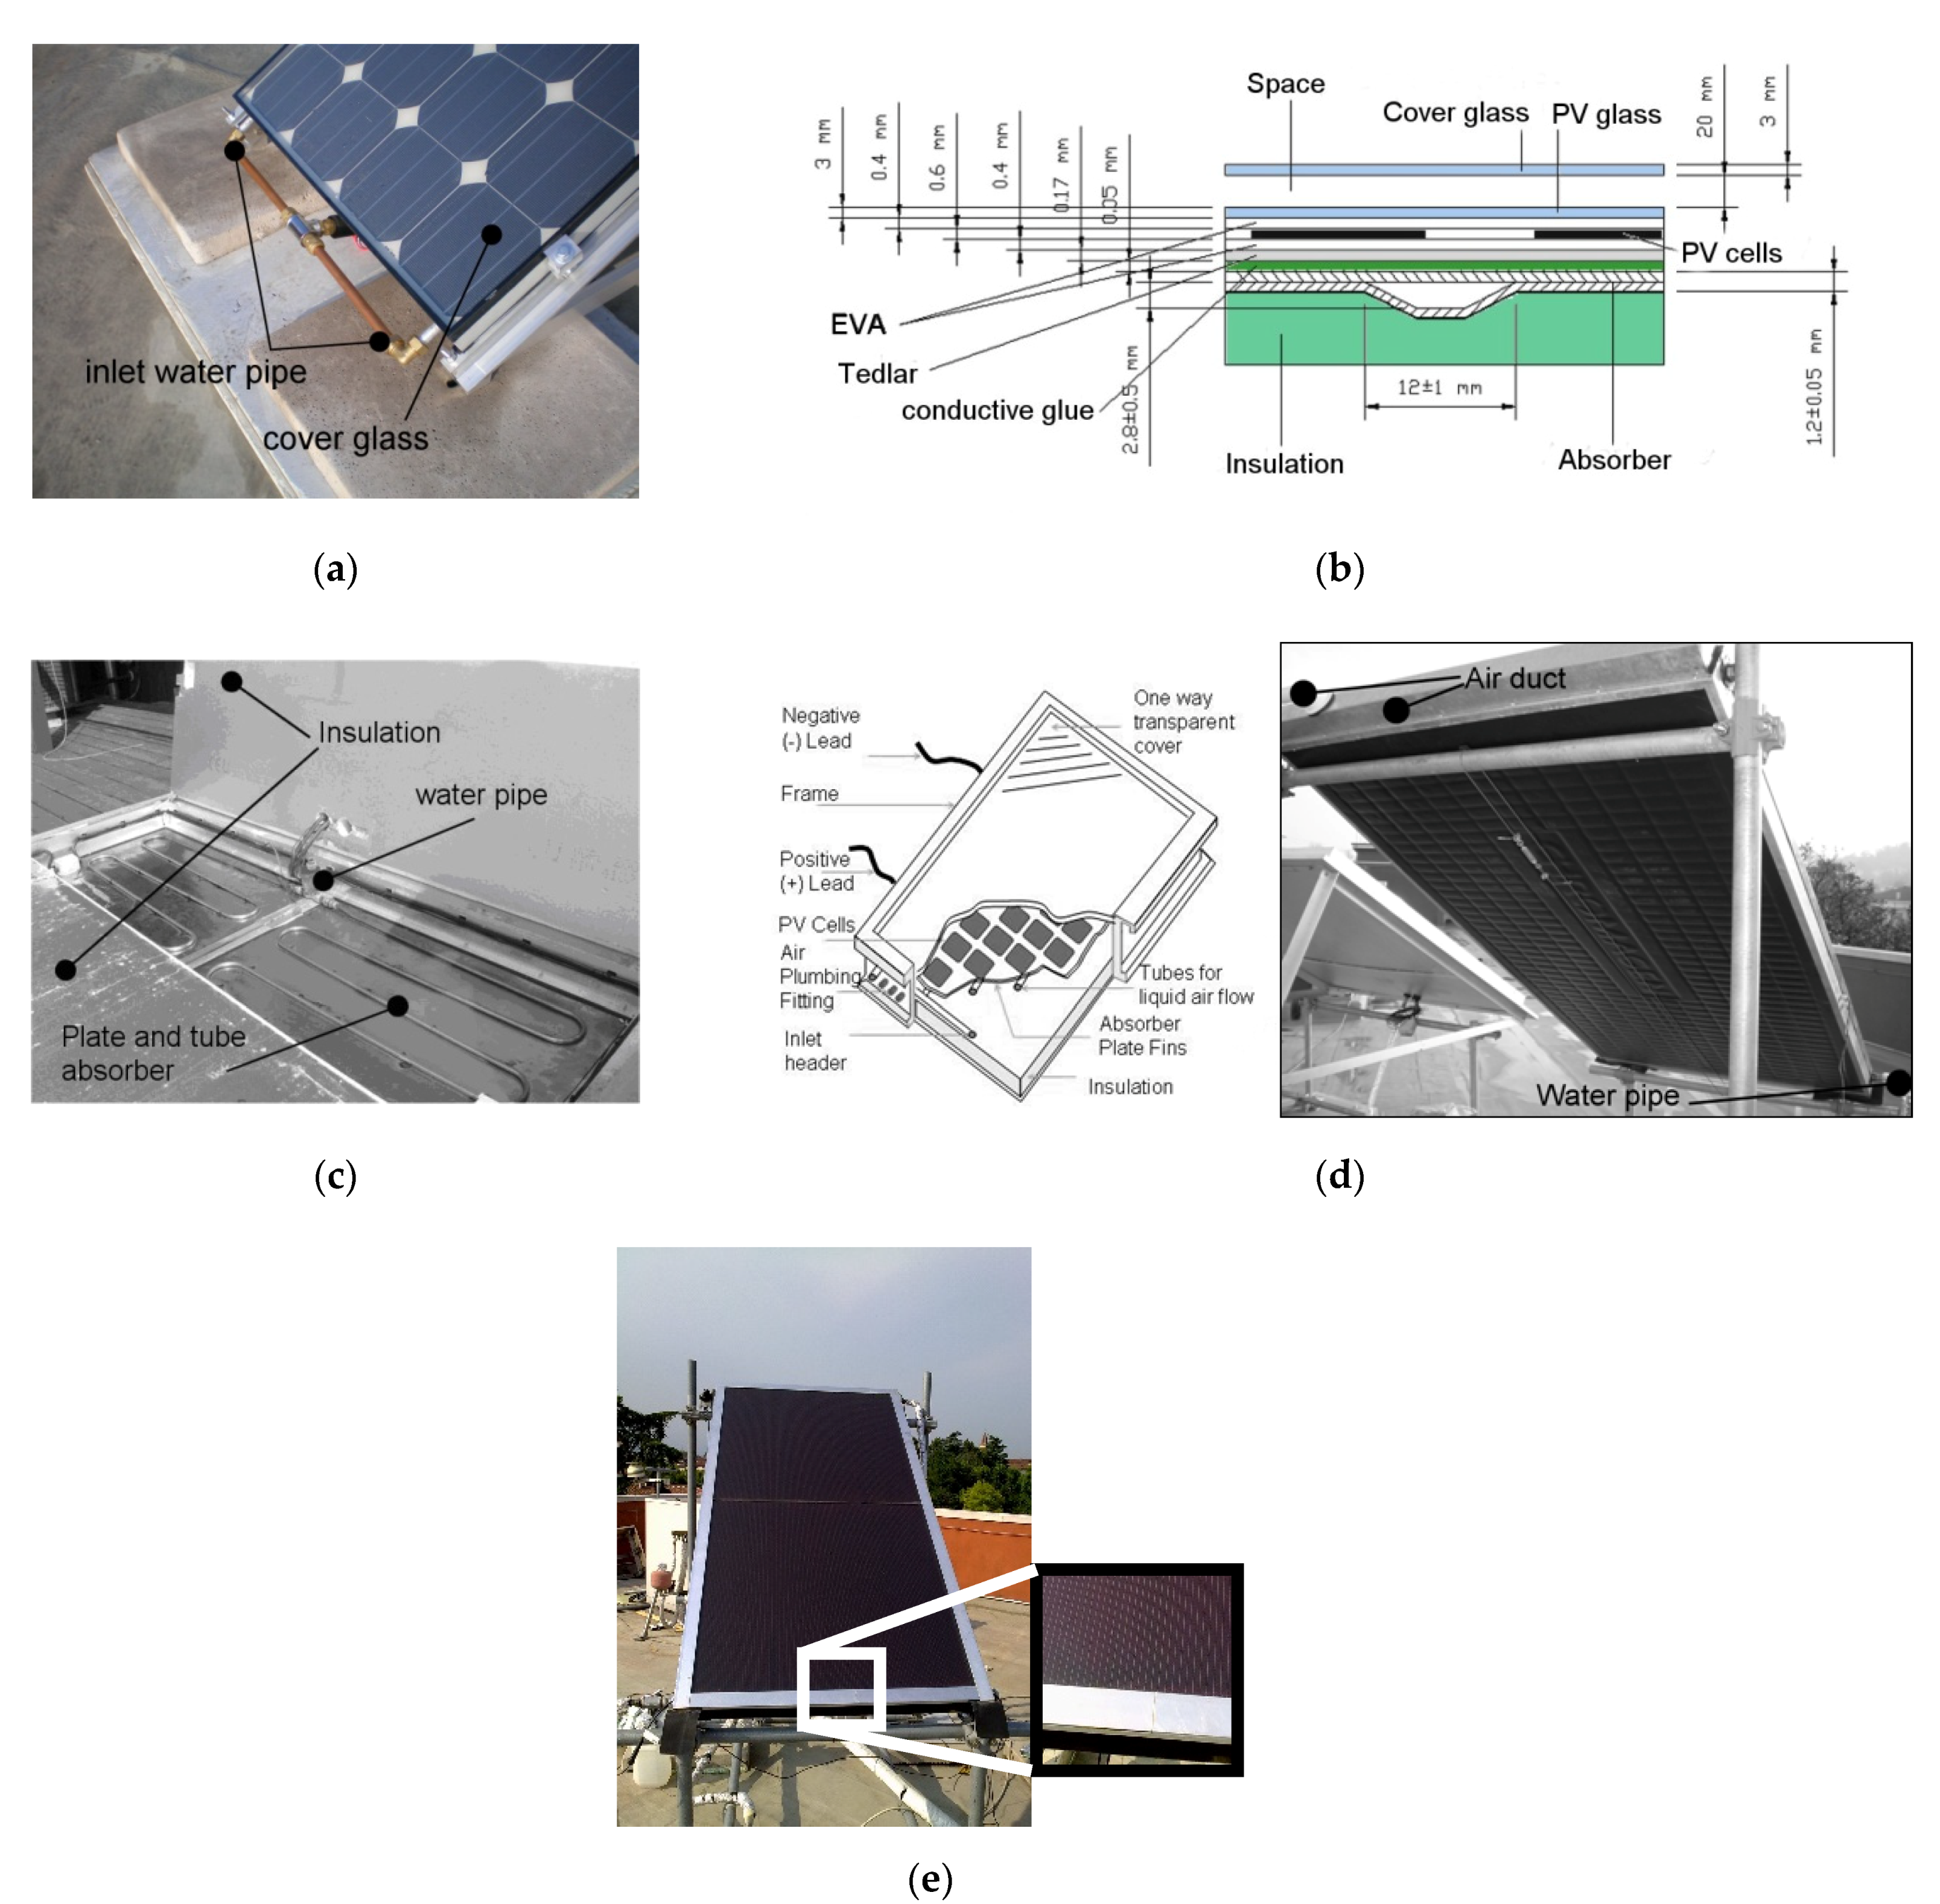
2.3. Energy Performance of PV/T Modules: Experimental and Theoretical Analysis
A PV/T test rig was placed on the roof of a building of the DTG to investigate the energy performance of different types of PV/T water-cooled plane collectors (
Figure 7).
Table 1.
Main technical characteristics of the PV/T module tested at DTG.
Table 1.
Main technical characteristics of the PV/T module tested at DTG.
| | COGEN | PVTWIN | MSS | HYBRIS | THYBRIS |
|---|
| Glass | Glazed | Glazed | Unglazed | Unglazed | Unglazed |
| PV cells | Single-crystalline Si | Multi-crystalline Si | Multi-crystalline Si | Single-crystalline Si | Amorphous Si |
| Gross area (m2) | 1.2 | 2.54 | 2.7 | 1.27 | 2.09 |
| Nominal power (Wp) | 135 | 295 | 300 | 170 | 52 |
| Electrical efficiency | 11.2% | 11.6% | 11.5% | 13.3% | 10% |
| Absorber | Roll-bond type made of aluminium suitably glued to the Tedlar film of the PV laminate | Plate-and-tube type made of copper | Plate-and-tube type made of aluminium | Roll-bond type made of aluminium suitably glued to the Tedlar film of the PV laminate | Copper selective solar thermal collector |
| Manufacturer | By the authors | PVTWINS (The Netherlands) | Millennium Electric T.O.U. (Israel) | SY.T.EN. (Italy) | By the authors |
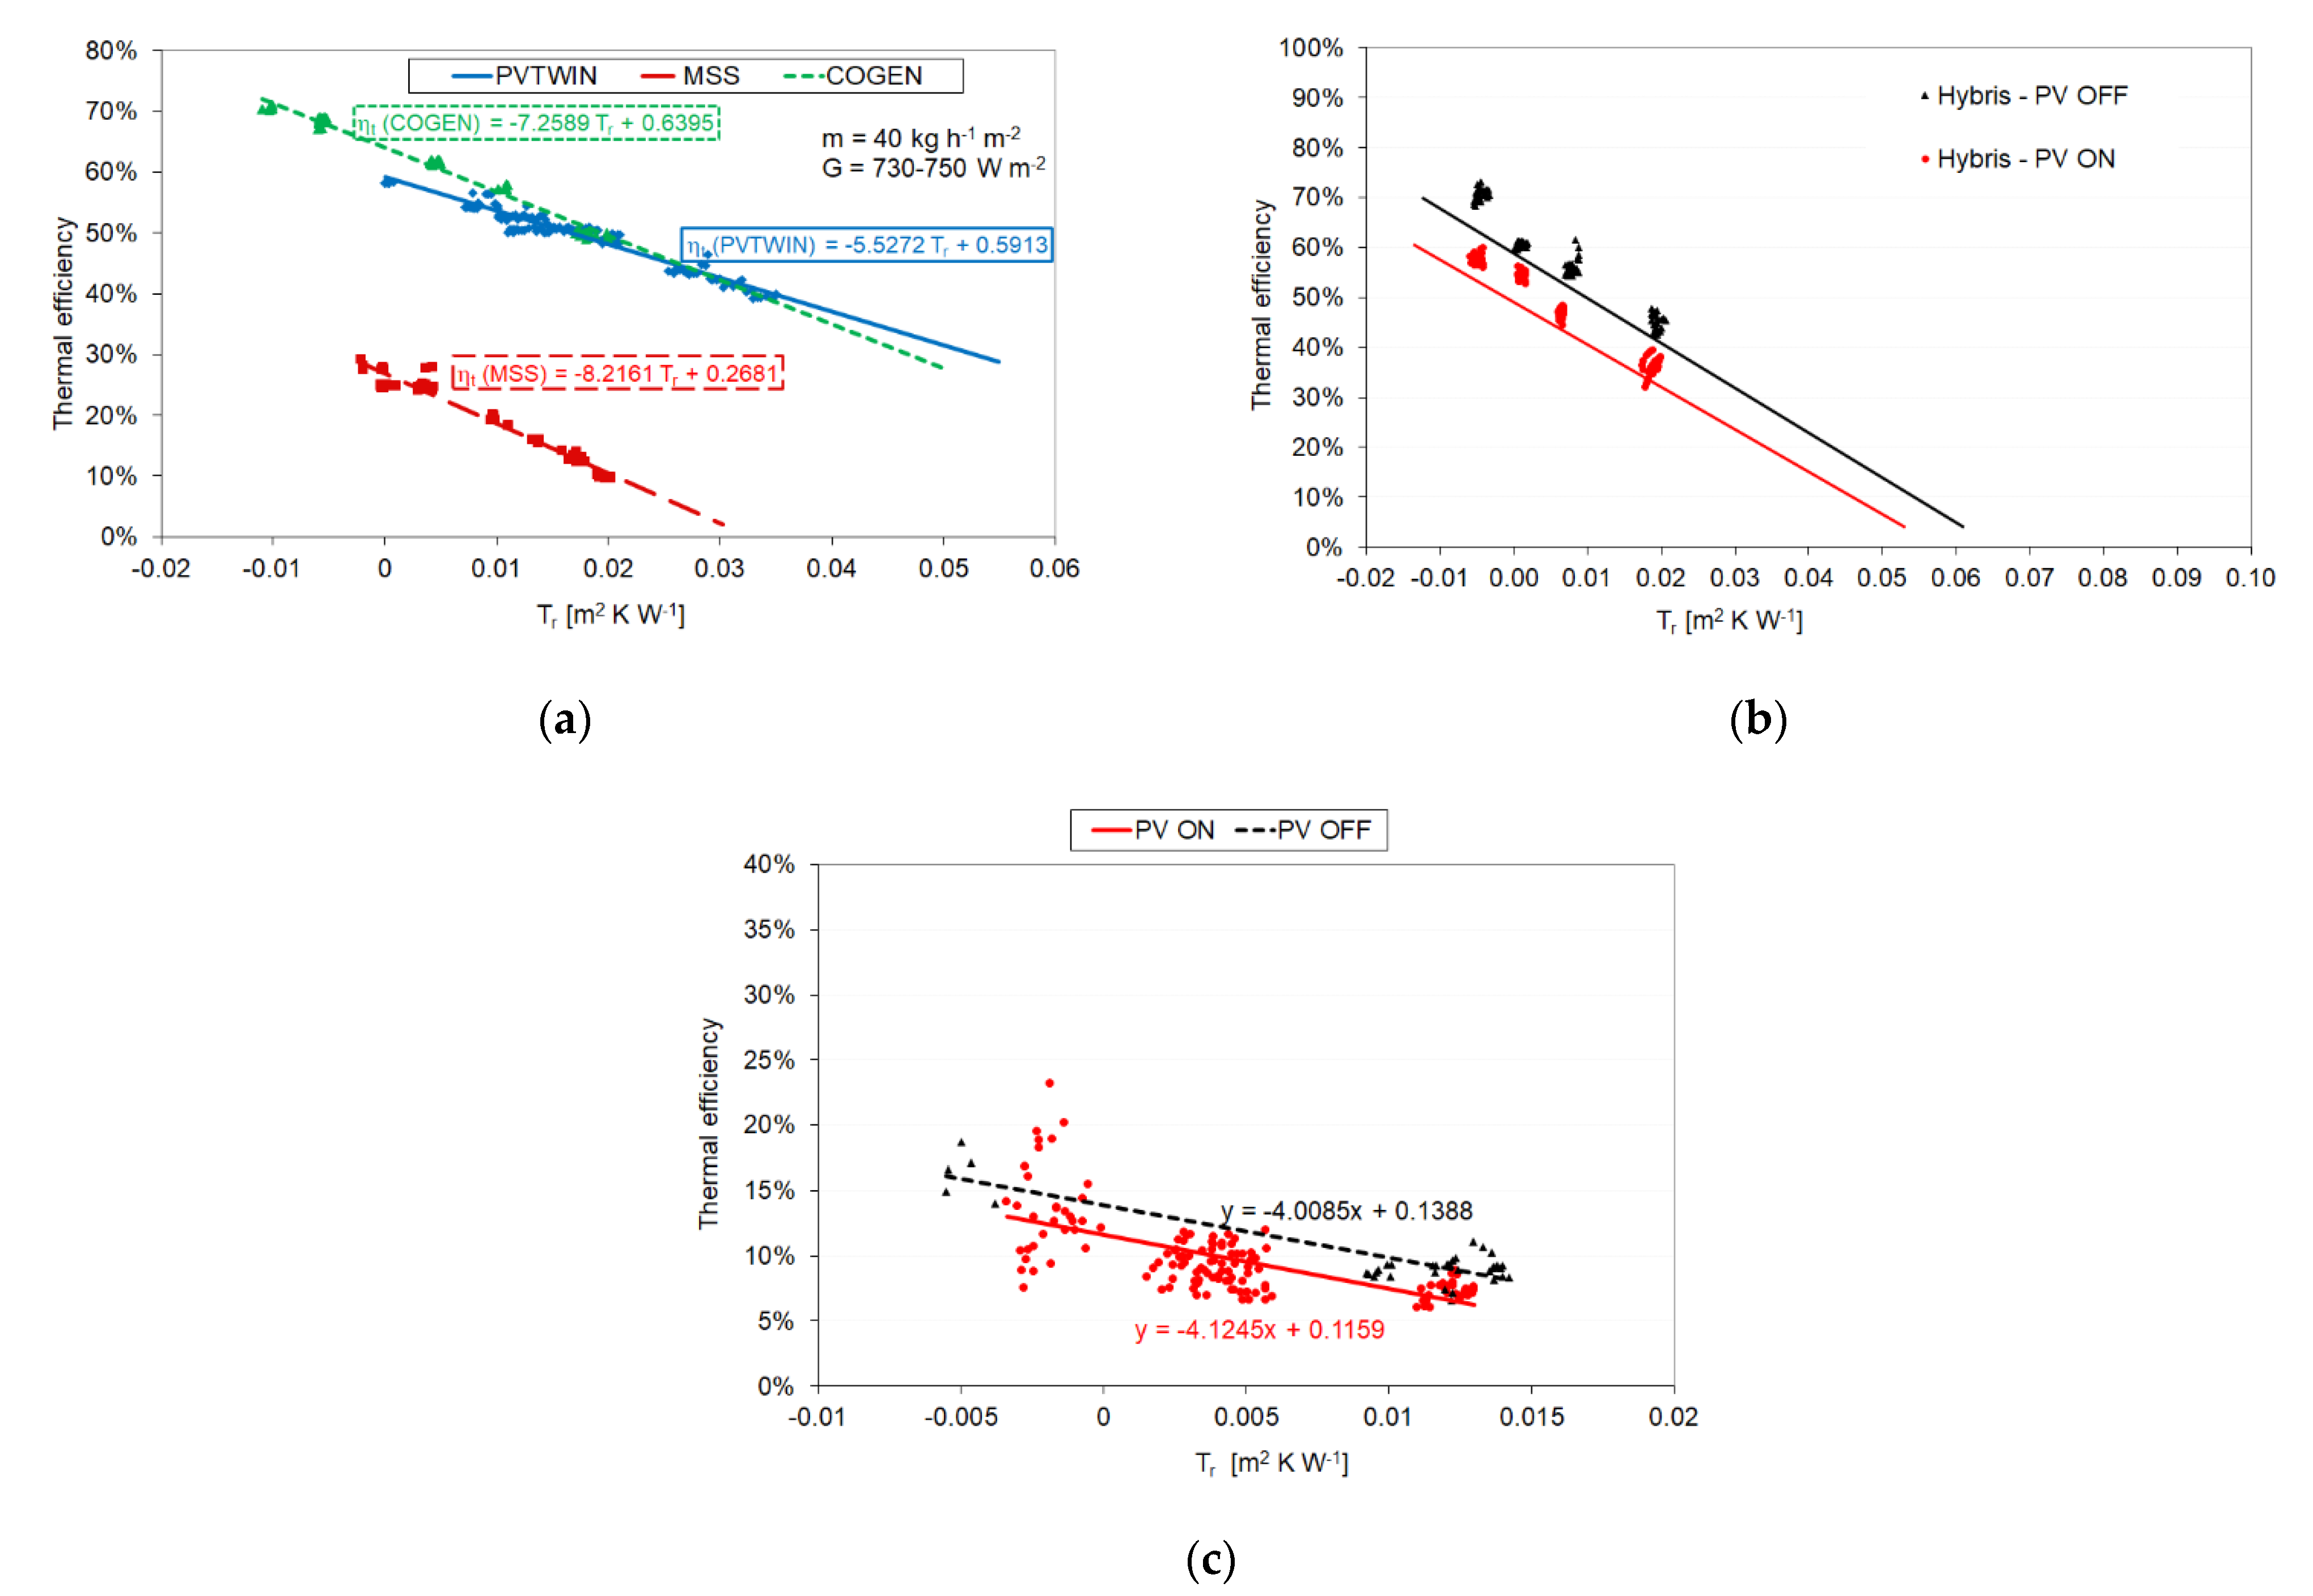
Experimental analysis of the first four PV/T liquid cooled collectors mentioned above conducted by the authors during the 2006–2009 period highlighted that, with glazed collectors, high values of water mass flow rate are necessary during periods of high global solar radiation (700 ÷ 800 W m
−2) [
50,
51,
52] in order to limit the negative effect of high temperature on electric efficiency. In contrast, a lower mass flow rate was useful to avoid high penalization in the thermal energy production of unglazed collectors. During periods with low global solar radiation (350–400 W m
−2), low mass flow rate values were effective for both glazed and unglazed technologies. Therefore, glazed collectors are advisable in resorts with low annual global solar radiation; instead, unglazed collectors are more useful with high annual radiation.
Figure 8.
COGEN: Front (a) and section view (b); (c) PVTWIN: Back-side view; (d) MSS: Schematic and back-side view; € THYBRIS module.
Figure 8.
COGEN: Front (a) and section view (b); (c) PVTWIN: Back-side view; (d) MSS: Schematic and back-side view; € THYBRIS module.
The authors developed the THYBRIS collector in order to balance two different requirements: Minimizing dangerous effects of stagnation, typical of glazed modules, without penalizing too much thermal production. This was realized by installing the photovoltaic layer over the glazing (instead of behind): The main idea was not to use a simple glass but a semitransparent PV. The effect was an indirect cooling of the photovoltaic layer (by the fluid and the ambient air), whereas the absorber behaved like a thermal collector. As a drawback, data from experimental measurements highlighted a lower thermal efficiency than conventional PV/T (glazed and unglazed) (
Figure 9). Furthermore, a low value of electrical efficiency with a low temperature coefficient was an intrinsic characteristic of the thin film technology, and thus the electrical efficiency decreased less than crystalline PV when increasing the external air temperature.
As a main consequence of such experimental work, more recently the authors developed simulation models in Trnsys
® to evaluate the energy performance of heating and cooling PV/T systems coupled to both electric [
53,
54] and thermal absorption heat pump/chillers [
55]. In fact, the use of the suitable type of PV/T (glazed or unglazed) in dual source heat pump systems can offer a useful technical solution for new and refurbished nearly zero-energy buildings (NZEB), allowing very high energy performance and economic viability.
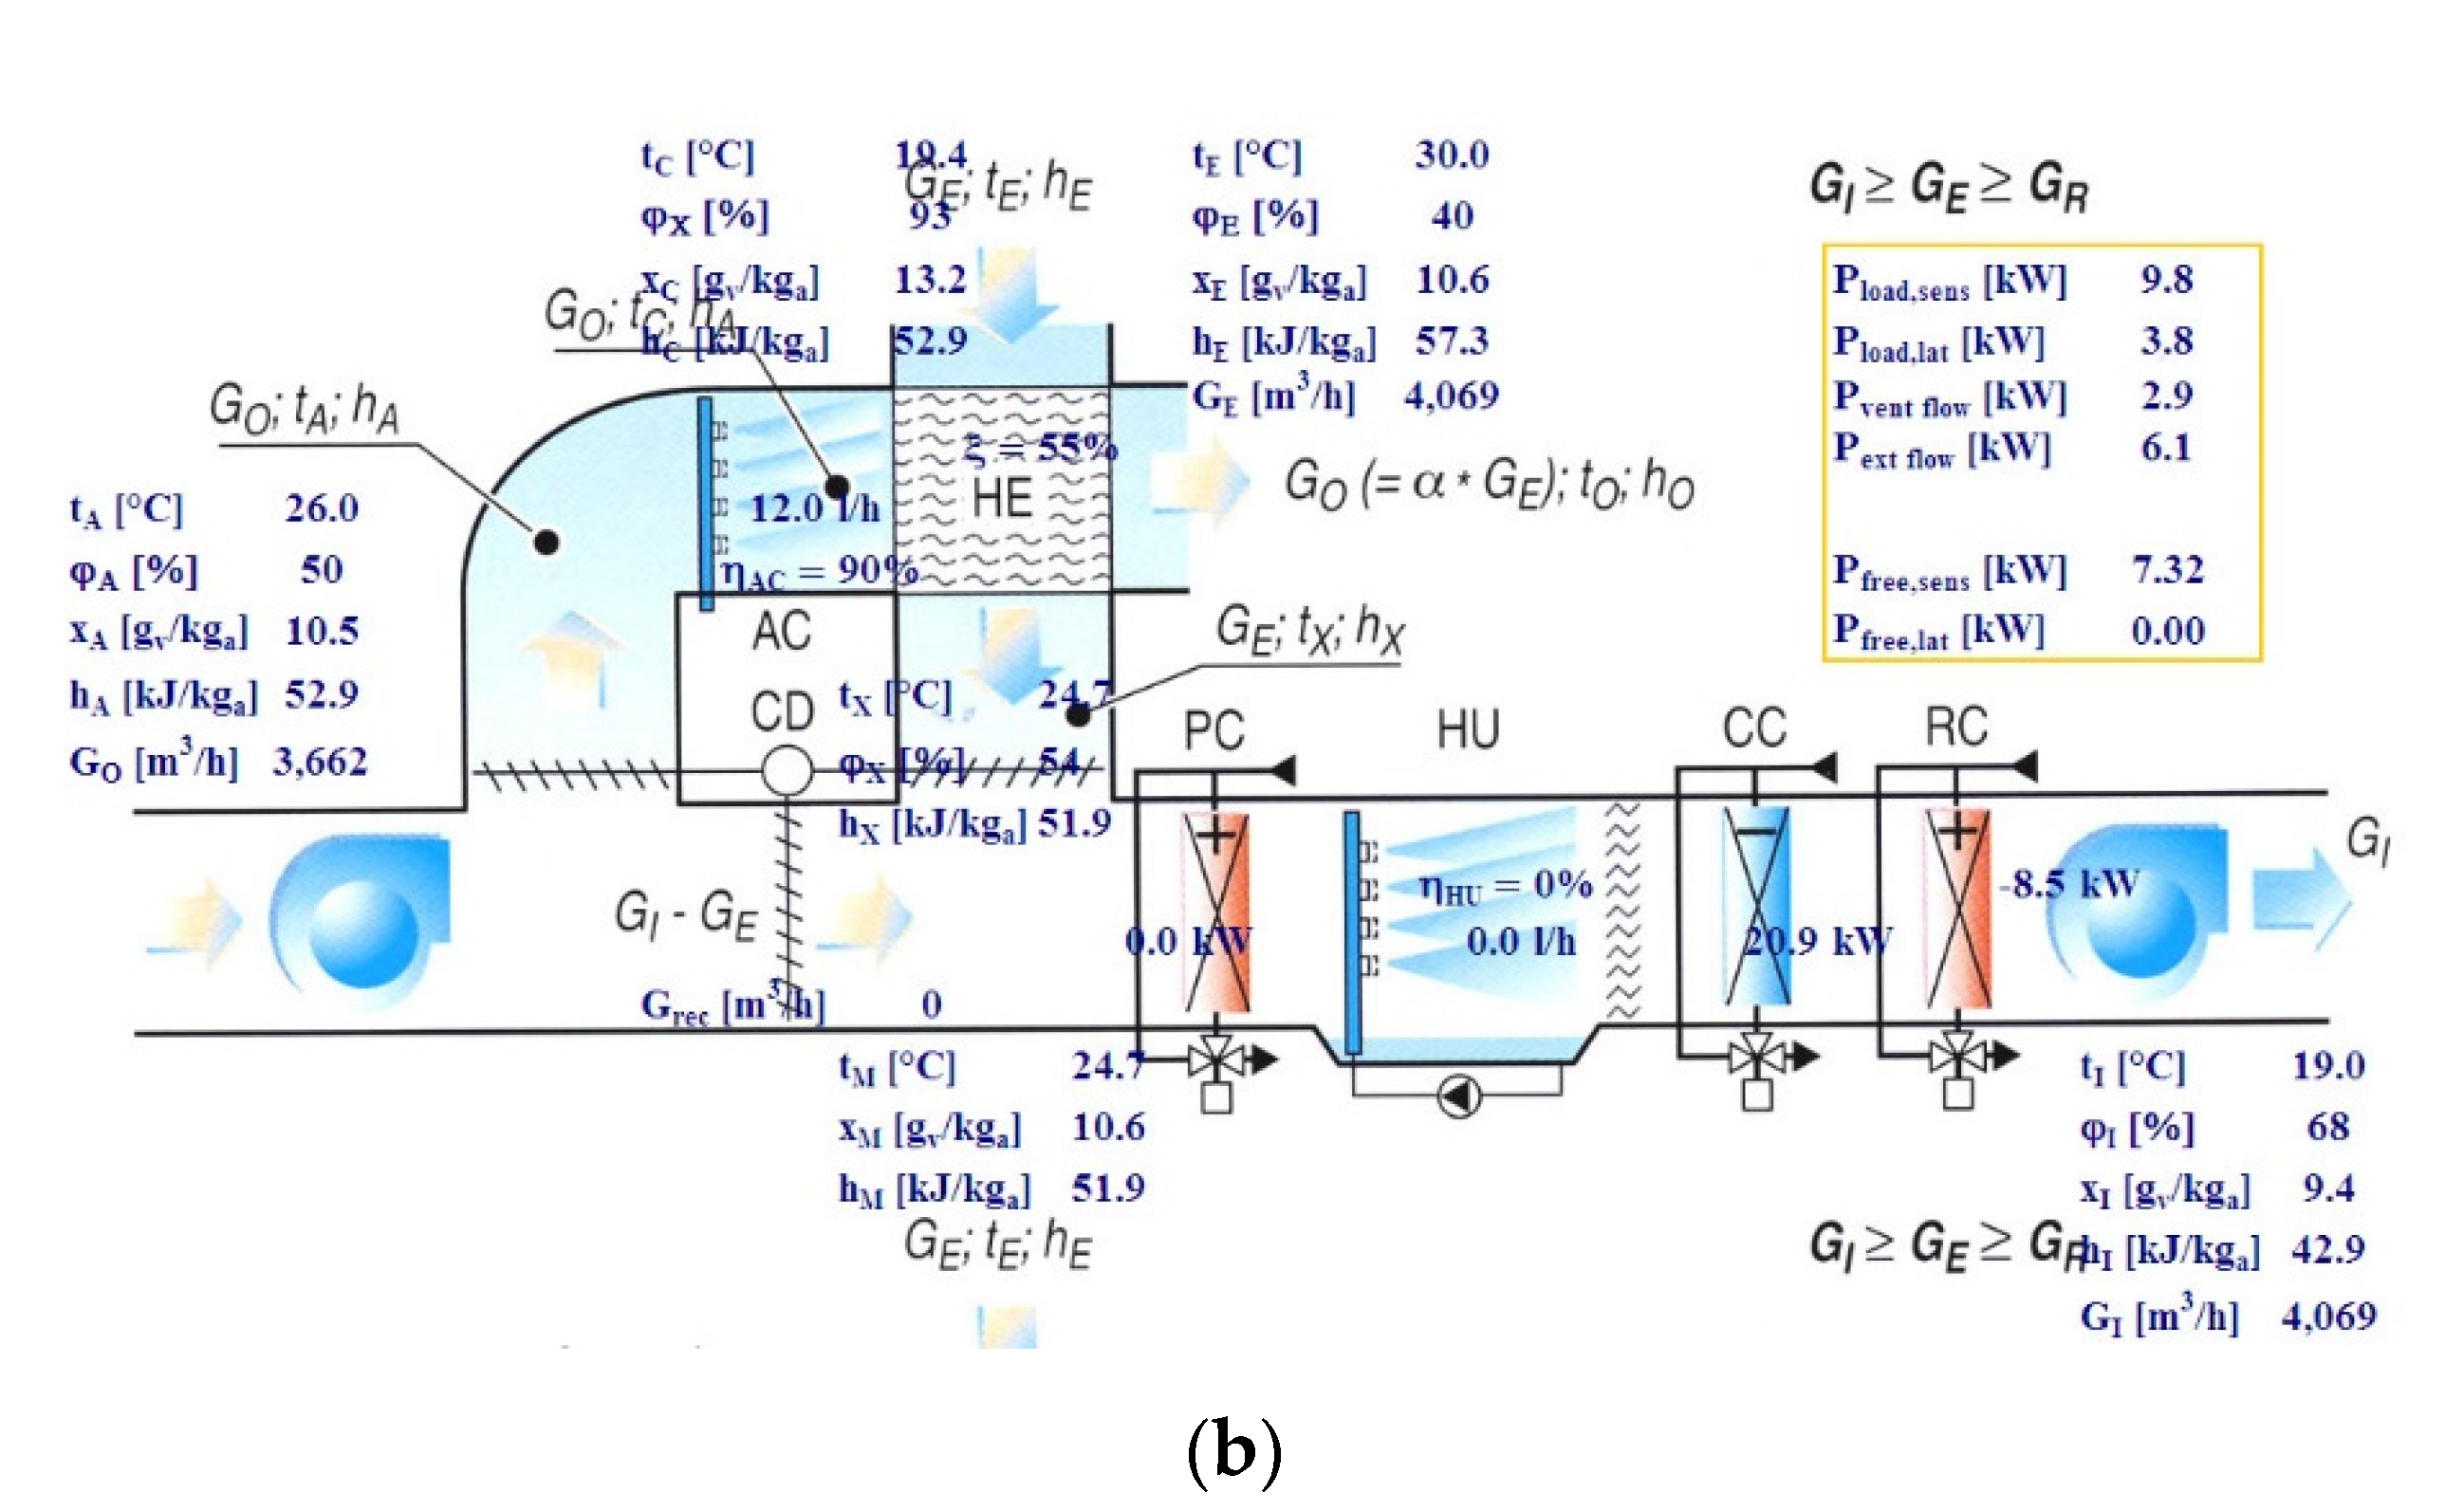
2.4. Energy and Economic Analysis of Direct and Indirect Evaporative Cooling
Direct evaporative cooling (DEC) and indirect evaporative cooling (IEC) use the evaporative cooling potential by means of a suitable control logic, varying the external air flow in the Air Handling Unit (AHU) from minimum (G
vent, that is, ventilation air flow) to maximum value (G
I, that is, inlet air flow) (
Figure 10 and
Figure 11).
A simulation worksheet was developed, based on the hourly Typical Meteorological Years of some European resorts [
56] and verified by experimental measurements [
57]. The psychrometric chart was divided into seven parts, considering the outside air enthalpy h
E and the humidity ratio x
E, fixing the indoor (h
A), the minimum outdoor (h
E,min) and the inlet air enthalpy h
I values, and the inlet air humidity ratio (x
I) (
Table 2). For each zone, the simulation worksheet determined the external air flow G
E that maximizes the effect of free cooling, subdivided into sensible and latent components.
Different AHU configurations for air conditioning (cooling) of a room were considered to evaluate the possible energy and economic advantages using such techniques:
Heat Recovery (HR): Sensible heat recovery, typically by a cross-flow heat exchanger, is always useful when the external air enthalpy h
E is greater than the ambient enthalpy h
A; in contrast, the heat exchanger must be bypassed so as to use the outdoor air (eventually mixed with the recirculated air) for free cooling (
Figure 12a);
Direct Evaporative Cooling (DEC): External air can help achieve the cooling load by directly humidifying it by an adiabatic saturator when the enthalpy of the outside air h
E is lower than that of the inside air h
A, and the humidity ratio (x
E) is suitably lower than that of the inside air (x
A) in order to cover internal latent load (
Figure 12b);
Indirect Evaporative Cooling (Single Stage) (IEC_SS): The idea is to place an adiabatic saturator in the inside air flow G
O to humidify it before being exhausted; thus, its temperature decreases, allowing to cool the outside air flow G
E. This is useful to improve the performance of the sensible heat exchanger in the cooling season, as a free cooling effect is also present in case external air enthalpy h
E should be greater than the inside air h
A (
Figure 12c);
Indirect Evaporative Cooling (Double Stage) (IEC_DS): Internal air is humidified and flows through two cross-flow heat exchangers before being discharged. Such a system emphasizes the adiabatic cooling, and so increases the free cooling effect with respect to the IEC single stage. However, it also increases the pressure drop of the AHU; therefore, overall performance must be carefully evaluated (
Figure 12d).
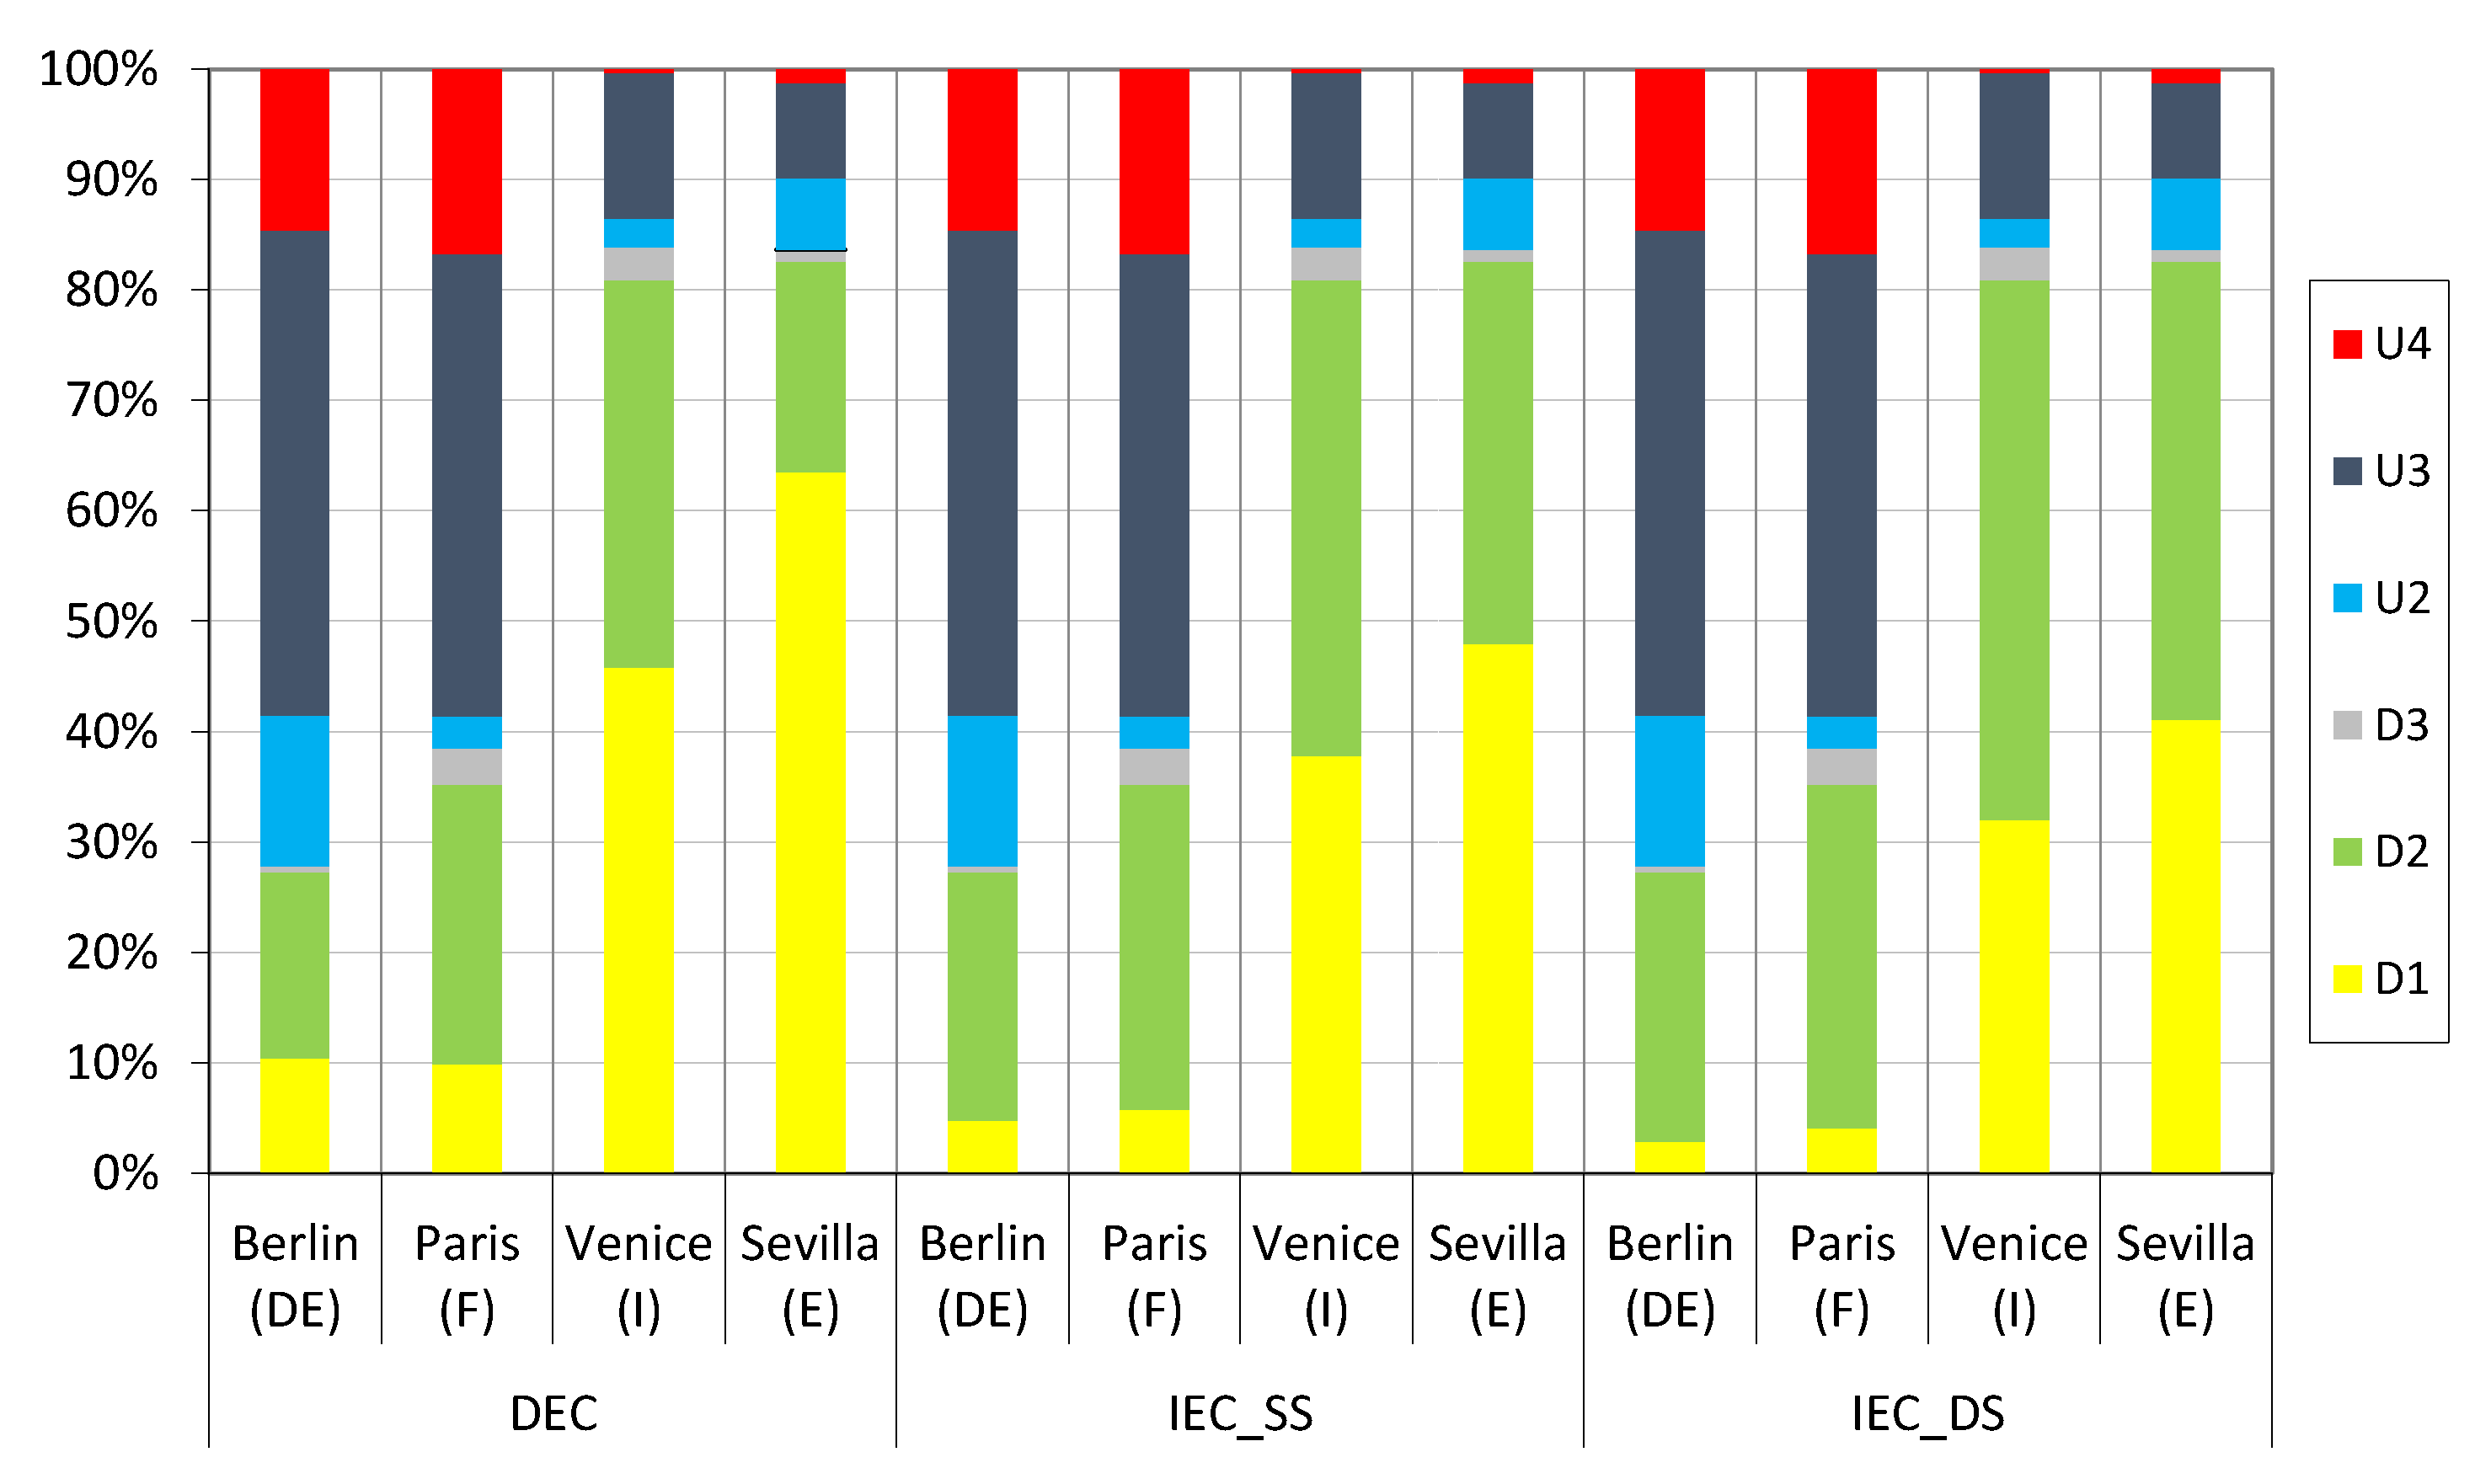
Four resorts were selected at different latitudes to represent the main European climates. According to the Koppen classification: Berlin, Germany (52.47° N) and Paris, France (48.73° N) as representative for the Cfb climate, Venice, Italy (45.50° N) for the Cfa climate and Seville, Spain (37.42° N) for the Csa climate. The percentages of the psychrometric zones are reported in
Figure 13: The most suitable zones for a free cooling effect (D2 and U2) were wider with IEC technology (even more with double stage), also highlighting a reduction of D1 and U1 (the least favorable zones).
In Berlin and Paris, that is, in climates where D1 and U1 zones were relatively less frequent than D2, U2 and U3, both DEC and IEC featured very effective cooling energy savings with respect to the total cooling and ventilation air load (
Figure 14). IEC savings were greater than DEC, especially in Venice and Seville (that is, in climates with a high frequency of the D1 zone). Where the climate was mainly colder (wider U4 zone), both IEC_SS and IEC_DS allowed for basically the same advantage of DEC (
Figure 14).
Such figures were found to be emphasized when the comparison was done with respect to HR. Furthermore, free cooling also had a positive effect on the reduction of the chiller capacity, which the authors evaluated at around 11 kW in most situations for the case considered.
While energy savings by evaporative techniques were appreciable in all European climates, the economic analysis carried out by the authors revealed some drawbacks. In fact, the higher costs were compensated by savings in cooling capacity and electricity costs only in Cfb climates. Instead, the economic advantage had to be carefully evaluated in warmer climates (Cfa and Csa), due to its great dependence on the extra investment costs in evaporative cooling equipment.
As a main conclusion of this study, the authors highlighted that evaporative cooling can be a sustainable energy saving technique in many types of climates, especially in buildings with high internal heat gain. This will be more and more common in the next years due to the increased thermal insulation of new and retrofitted buildings. However, economic profit should be carefully evaluated in each situation, considering the extent of outdoor ventilation, air flow (so the presence of people) and internal heat gain.
2.5. An Experimental and Theoretical Approach to Energy Saving for Refrigeration and Air Conditioning in Supermarkets
First, the advantages of using an electronic expansion valve (EEV) instead of a thermostatic expansion valve (TEV) were evaluated. The authors considered two cases: An eight-direct expansion air conditioner plant (120 kW cooling capacity) located in a telephone control room in Bologna (Italy) [
36]), and a supermarket located in a resort in the north Tirrenic coast of Italy [
37].
In both air conditioner [
36] and refrigerating cabinet [
37,
38] case studies, the research featured both an experimental and a simulation part. In the former, both electronic and thermostatic expansion valves were assembled. To compare the two systems at similar load conditions, TEV and EEV were activated alternatively on a daily basis. Furthermore, a transient simulation program allowed an annual analysis of the behaviour of the systems in three European climates to quantify the economic and energy advantages of EEV in two different operating modes.
The main results obtained by the simulation models, based on the experimental data, revealed that when using EEV the consumption was substantially lower than TEV; the conditions of the outer air mainly influenced the consumption (
Figure 15). Energy savings with EEV were in the range of ten per cent, depending on the external air temperature and the month of the year. In fact, the low condensation pressure allowed significant savings in winter. Furthermore, part of the savings was due to the fairly constant sort, for the high internal heat gain in the air conditioners of the telephone control room,
Figure 15a, or the less variable sort, for the refrigerating cabinets in the supermarket,
Figure 15b, of energy consumption throughout the year for the TEV technology.
As a matter of fact, lower condensation pressures were allowed by EEV in systems with air-cooled condensers. Furthermore, the refrigerating capacity was also increased by Proportional-Integral-Derivative (PID) control on the superheating, which allowed the optimization of the use of the evaporator due to lower superheating.
After the analysis of EEV advantages, the authors’ research work focused on supermarkets [
39,
40,
41,
42]. In a first approach, the impact of cycling losses was evaluated in refrigeration and air conditioning units [
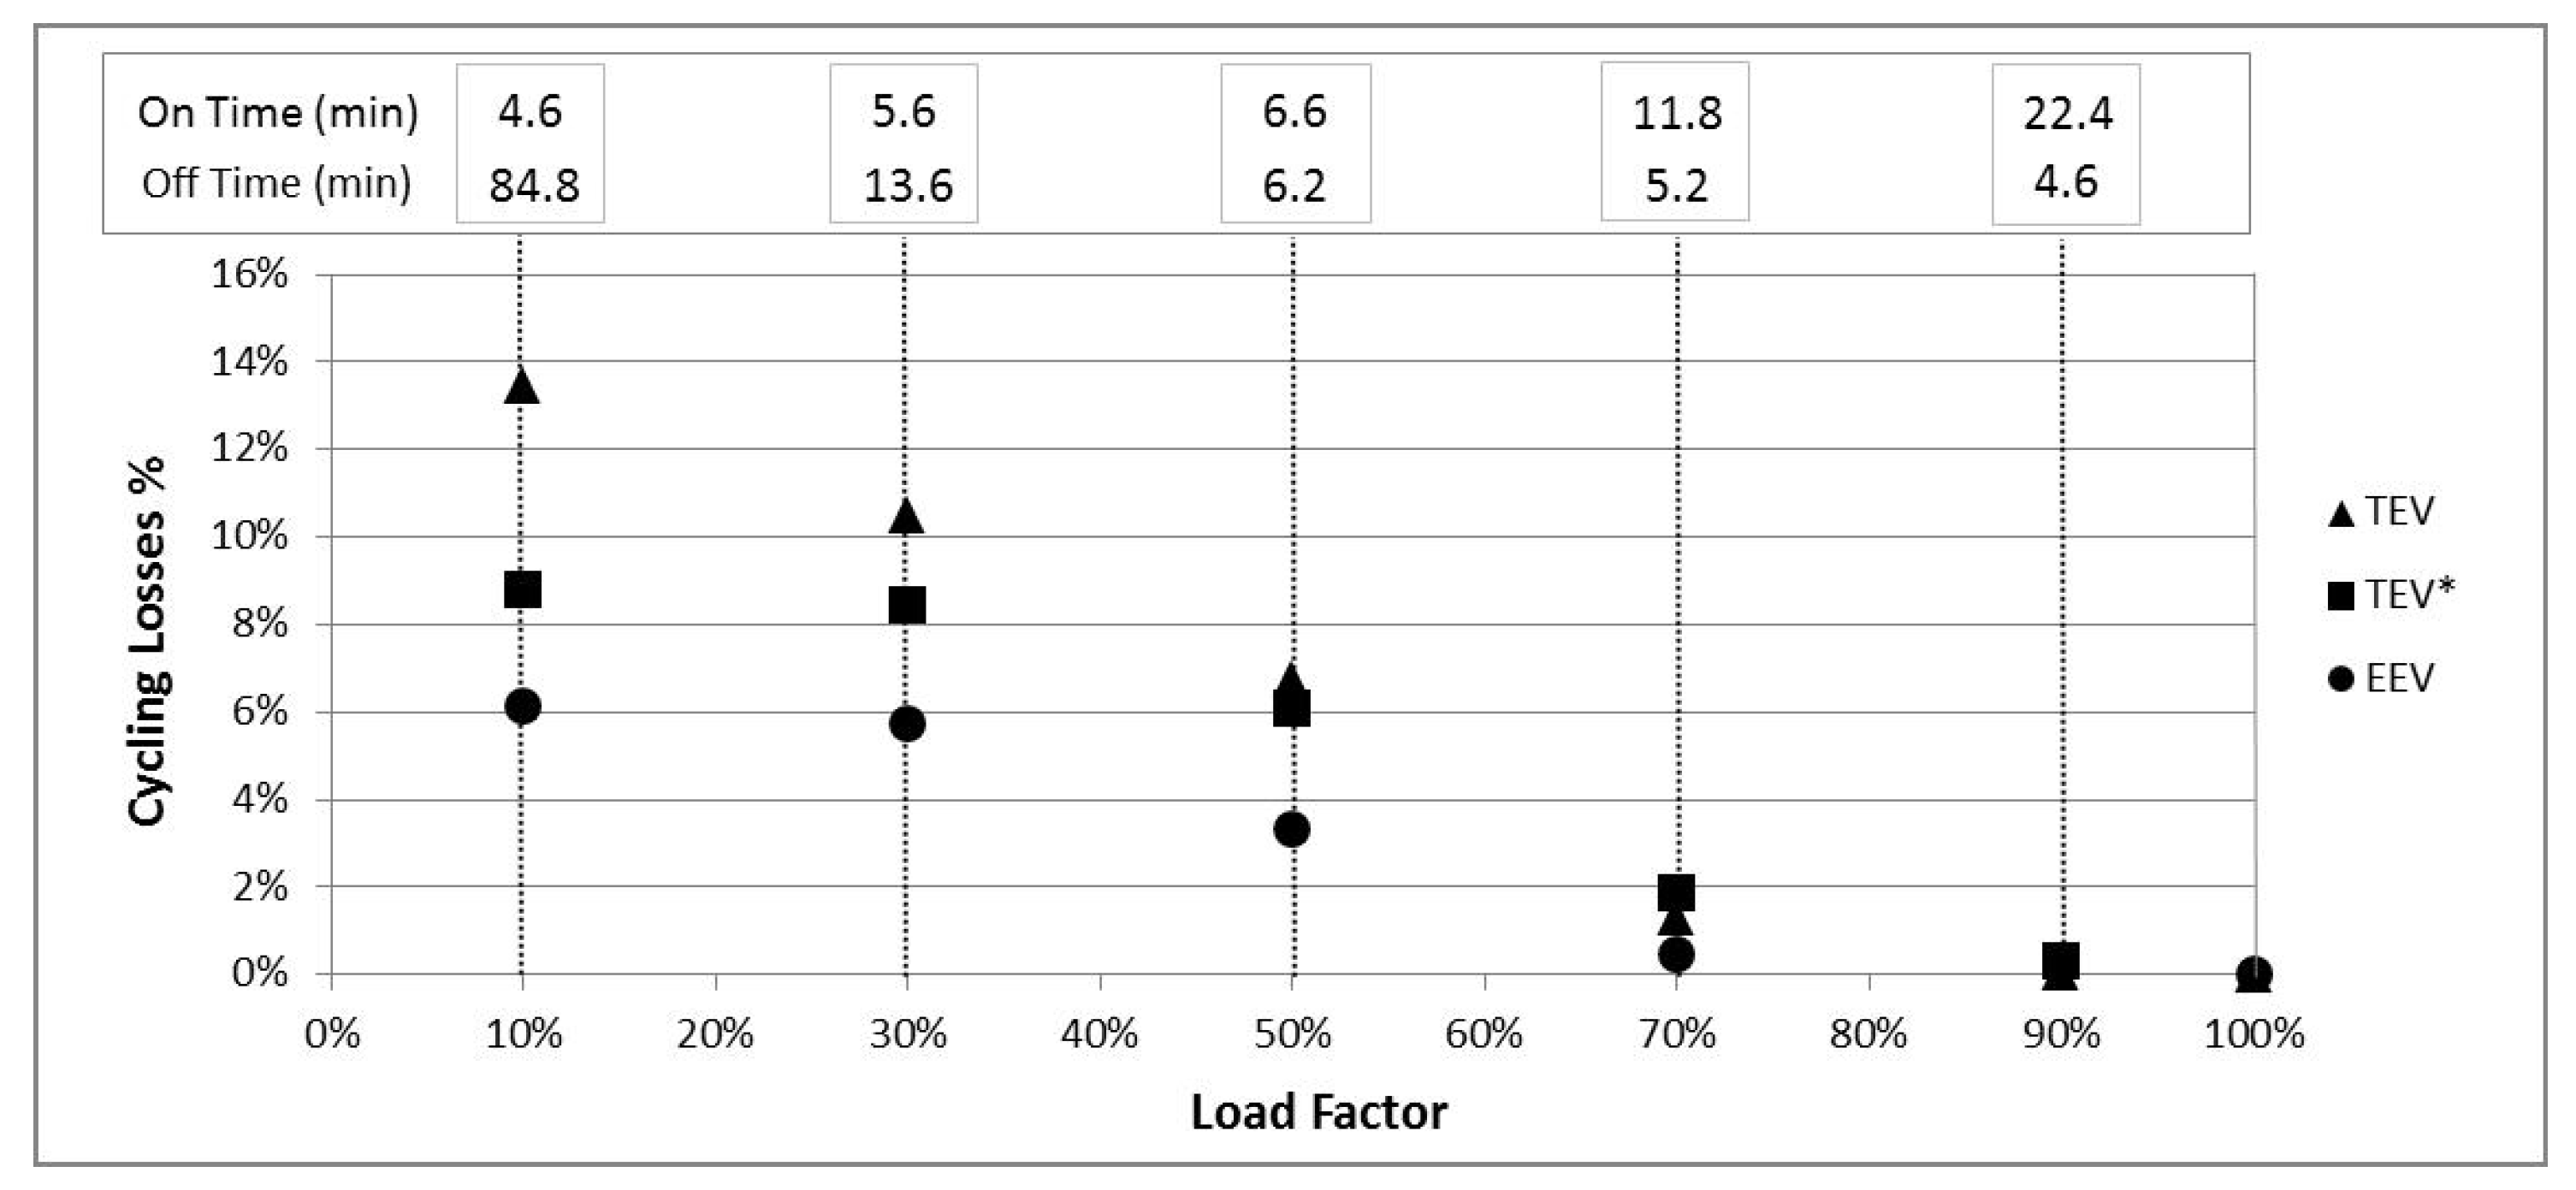
39]. Cycling losses reduce performance during the transient period due to the on–off control of a unit. The authors experimentally evaluated the advantages of the variable speed capacity control strategy of brushless compressors (BLDC) compared to the on–off strategy. First, the operation of a traditional chiller with TEV was tested between the “cycling mode” and the “continuous mode”. The different energy efficiency ratio (EER) was due to cycling losses, which resulted in up to 13%. Lower load factors increased penalization. Installing a solenoid valve in series with the TEV allowed improved performance when the load factor fell below 30%, but with still not negligible cycling losses with low load factors. As a final step, the best solution turned out to be equipping the chiller circuit with an EEV: For all load factors, this allowed losses to be kept below 6% (
Figure 16).
The research of the authors was successively focused on the whole refrigeration plant of a supermarket. Research focused on water-loop self-contained (WLSC) refrigeration plants, due to the positive characteristic that they reduce the required amount of energy and refrigerant, therefore direct and indirect CO
2 emissions, respectively [
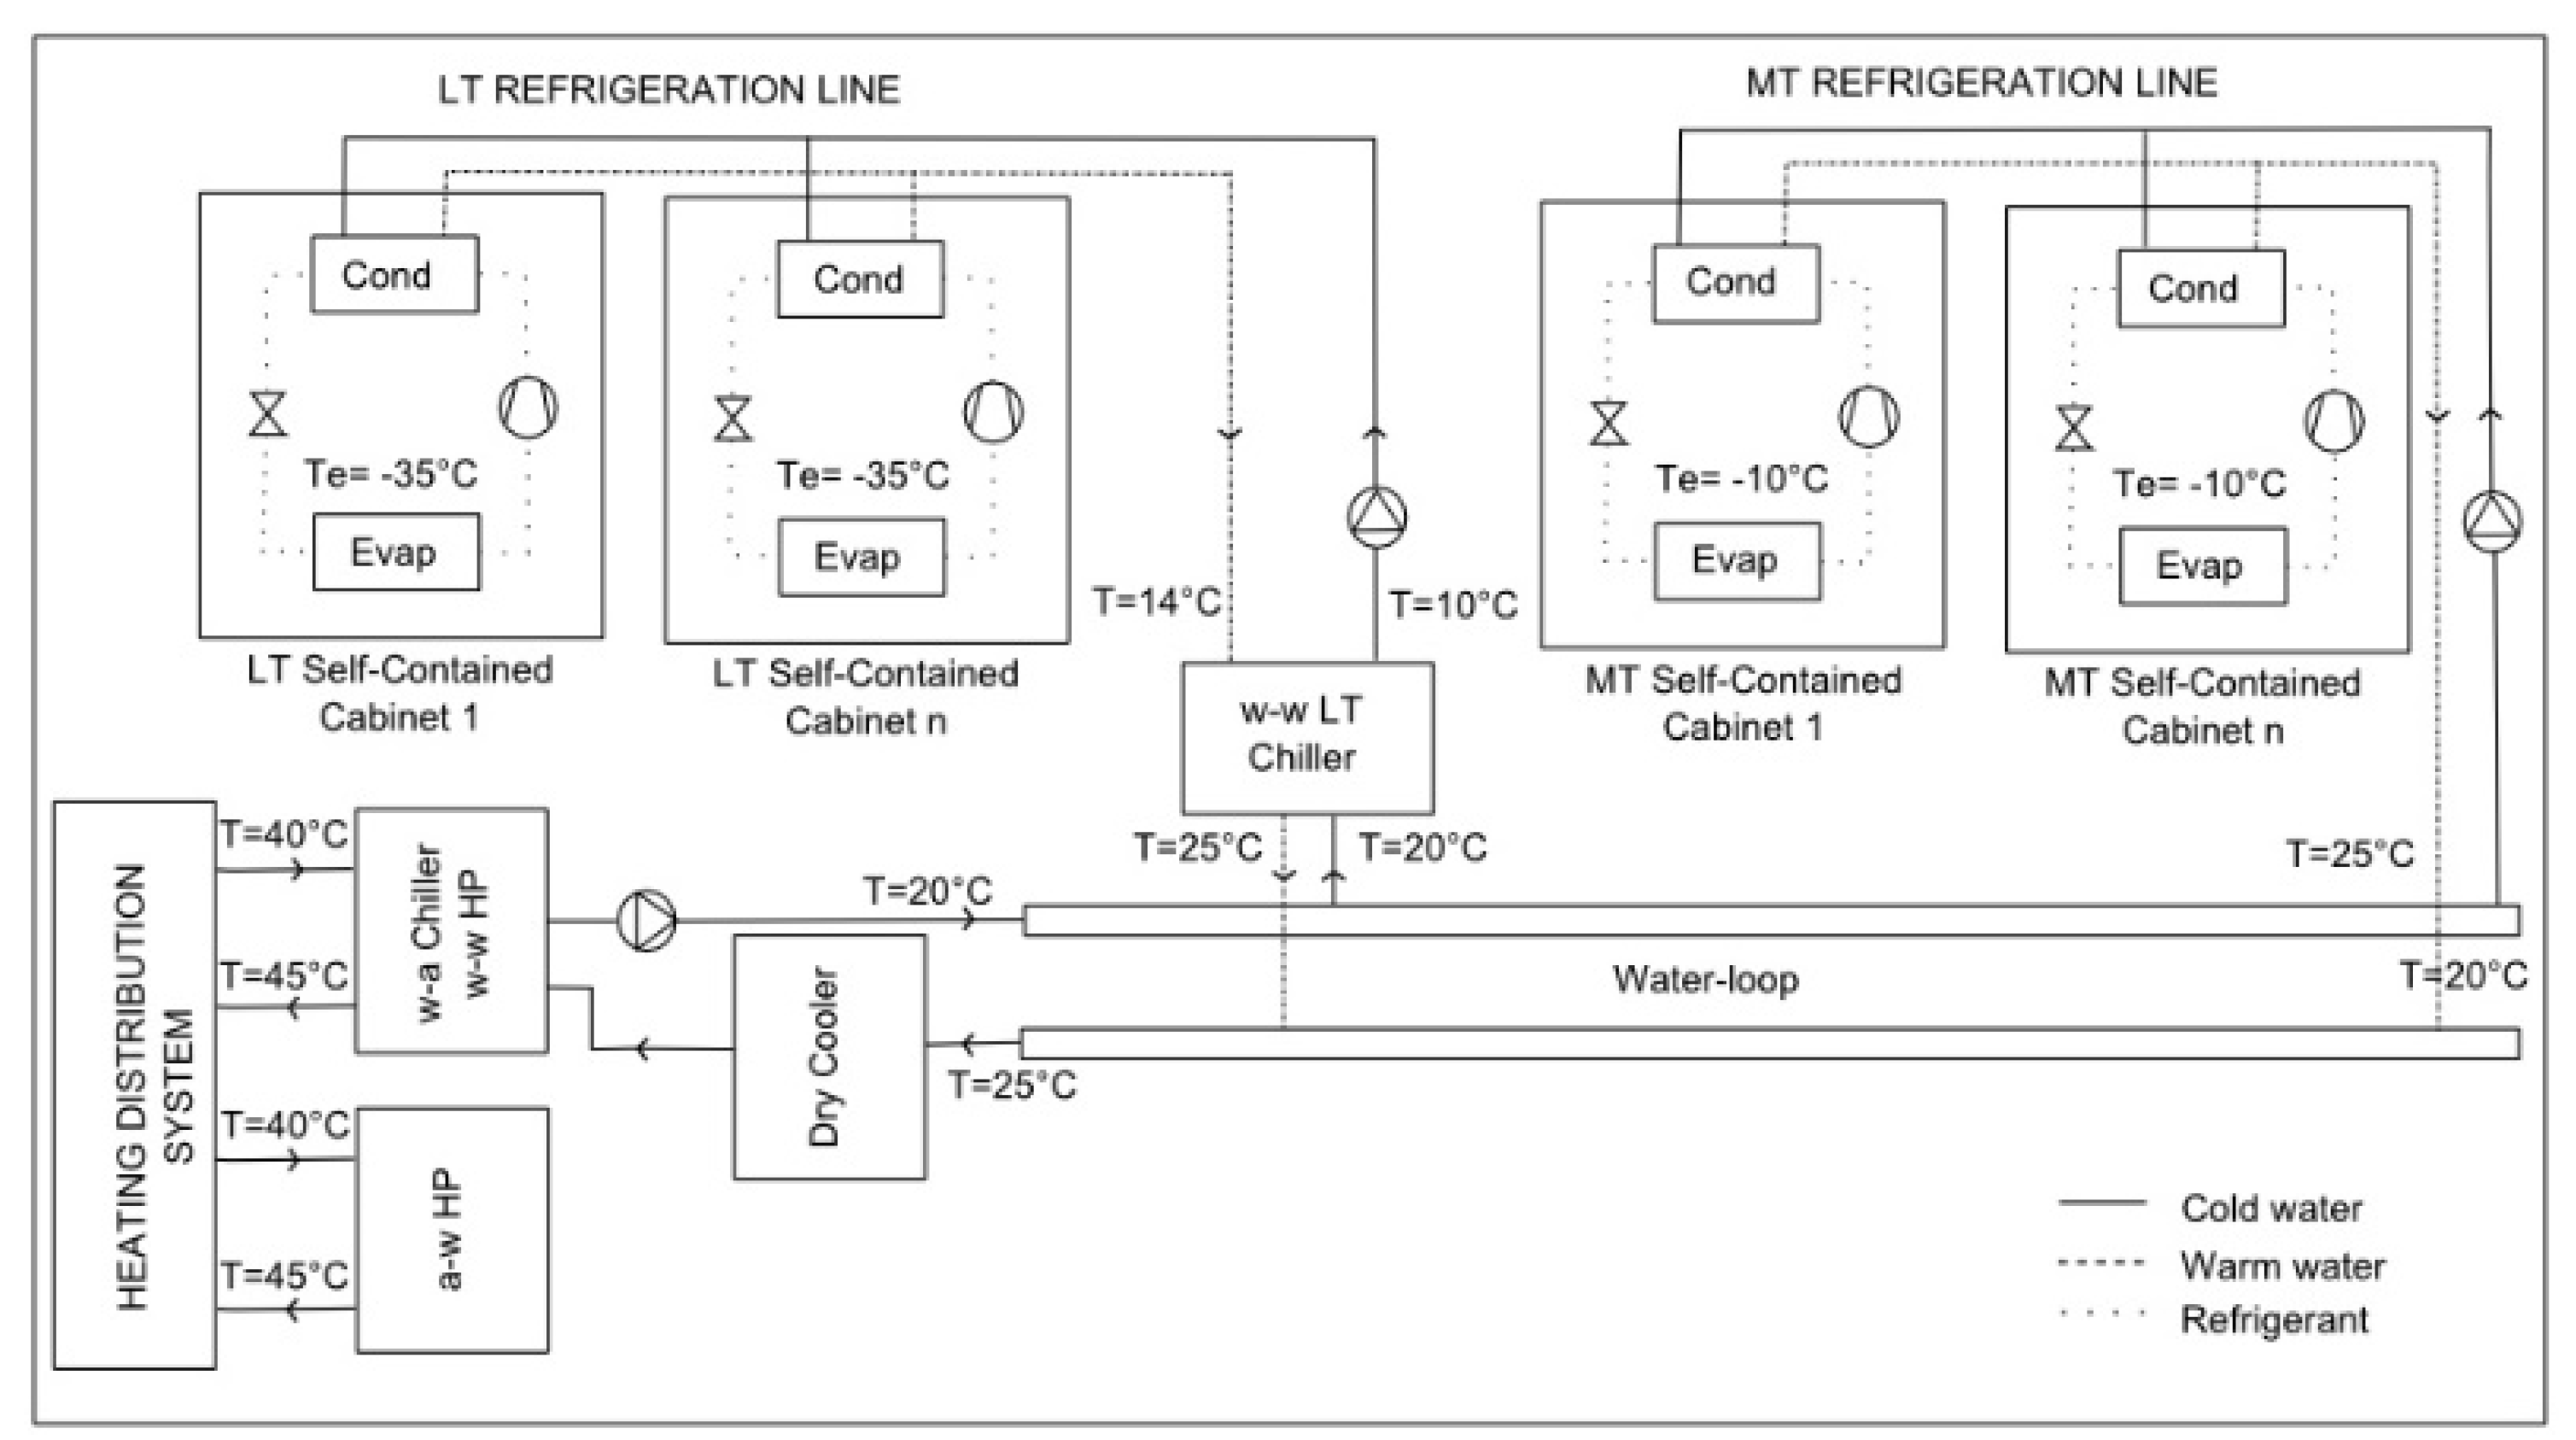
40]. In WLSC systems, the condenser and the variable speed (BLDC) compressor equip each cabinet that rejects thermal power to a cold water loop. The latter is cooled by a dry cooler or a chiller (
Figure 17).
The relevant parameters of a real WLSC supermarket located in Bologna (Italy) were monitored and recorded over 12 months. In this way, the energy performance of the WLCS plant was compared to those of two traditional multiplex configurations: One equipped with TEV (operated with a fixed suction pressure, MPTEV_Fixed_suction_p) and one equipped with EEV (operated with lower head pressures and with a floating suction pressure, MPEEV_Float_suction_p).
The three supermarket configurations were modelled to assess both the compressor electricity consumption and the cooling capacity [
40]. The MP
EEV_Float_suction_p solution led to 8.1% electric energy savings with respect to the MP
TEV_Fixed_suction_p system. This was due to the lower condensation pressure and the higher evaporation pressure; moreover, the higher heat recovered allowed the WLSC to feature 15.8% electric energy saving with respect to the MP
TEV_Fixed_suction_p system and 8.4% if compared with the MP
EEV_Float_suction_p system (
Figure 18).
The authors’ analysis of the WLSC system allowed to evaluate significantly lower CO2 emissions (around 56–58%), due to the reduction of both the direct (refrigerant charge and leakages) and indirect (electric energy consumption) warming effect.
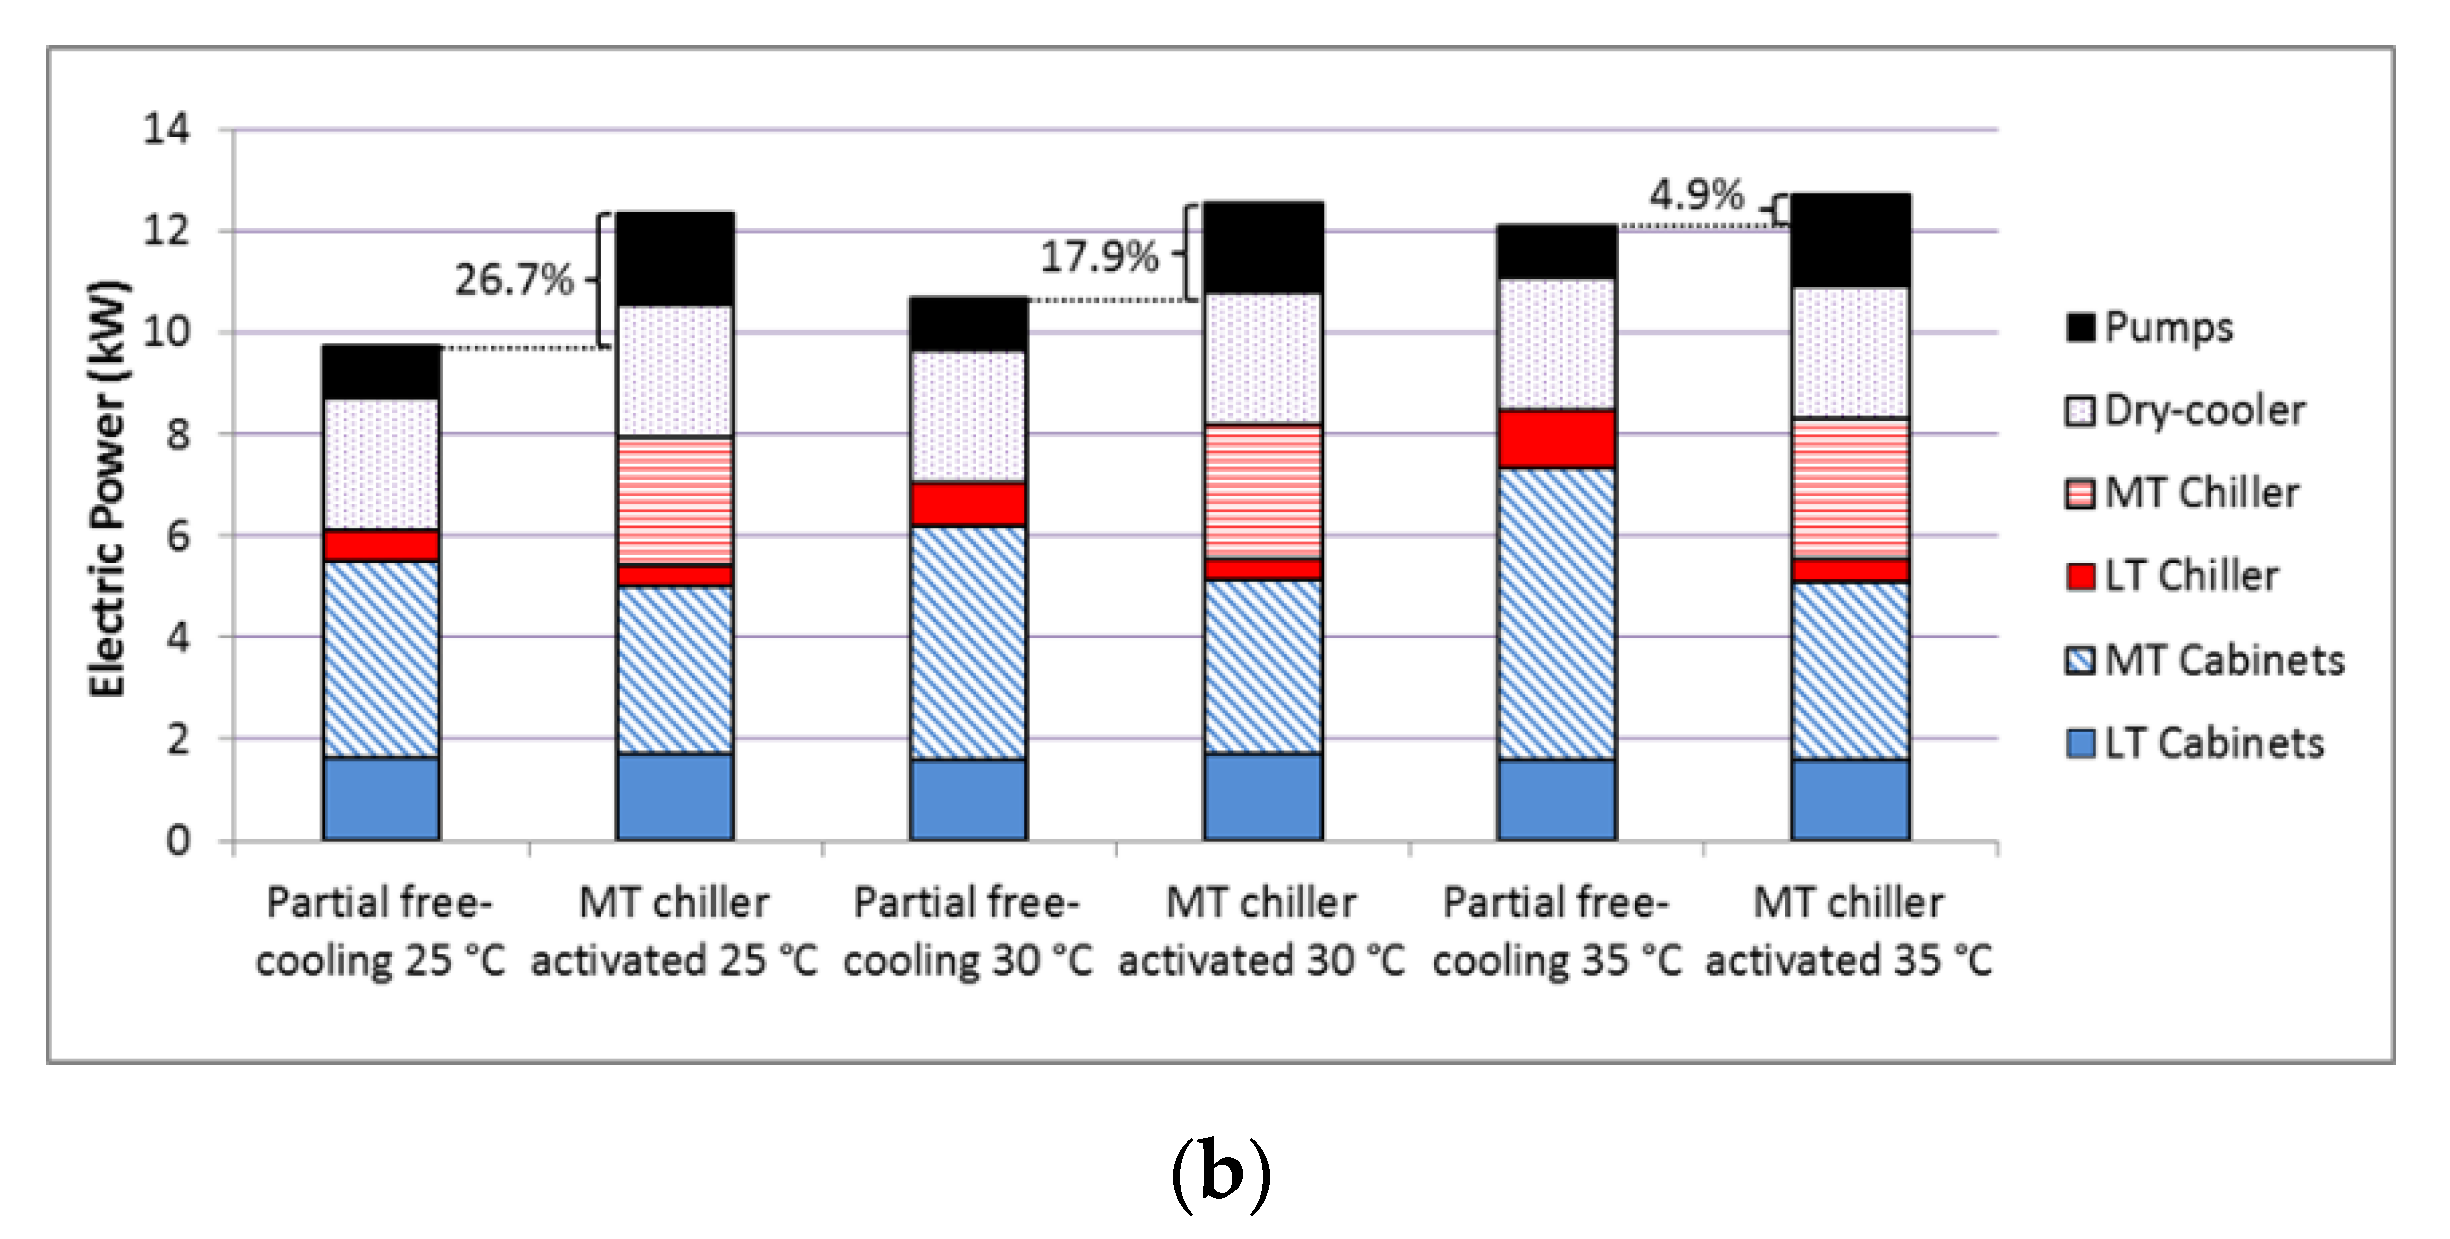
Finally, the authors focused on the control of the activation of the medium temperature (MT) chiller of the WLSC system [
41] (
Figure 19a). Measurement of the performance of a real WLSC system allowed evaluating a strong increase in total electric power required with the operation of the MT chiller when the external temperature was between 25 °C and 30 °C (
Figure 19b). The reason for the activation of the MT chiller was to limit the condensation pressure of the MT cabinets in case of very high external temperature. In this case, the use of a compressor with a low minimum pressure ratio limit limited the inefficiency of the system due to the extra temperature difference in the evaporator.
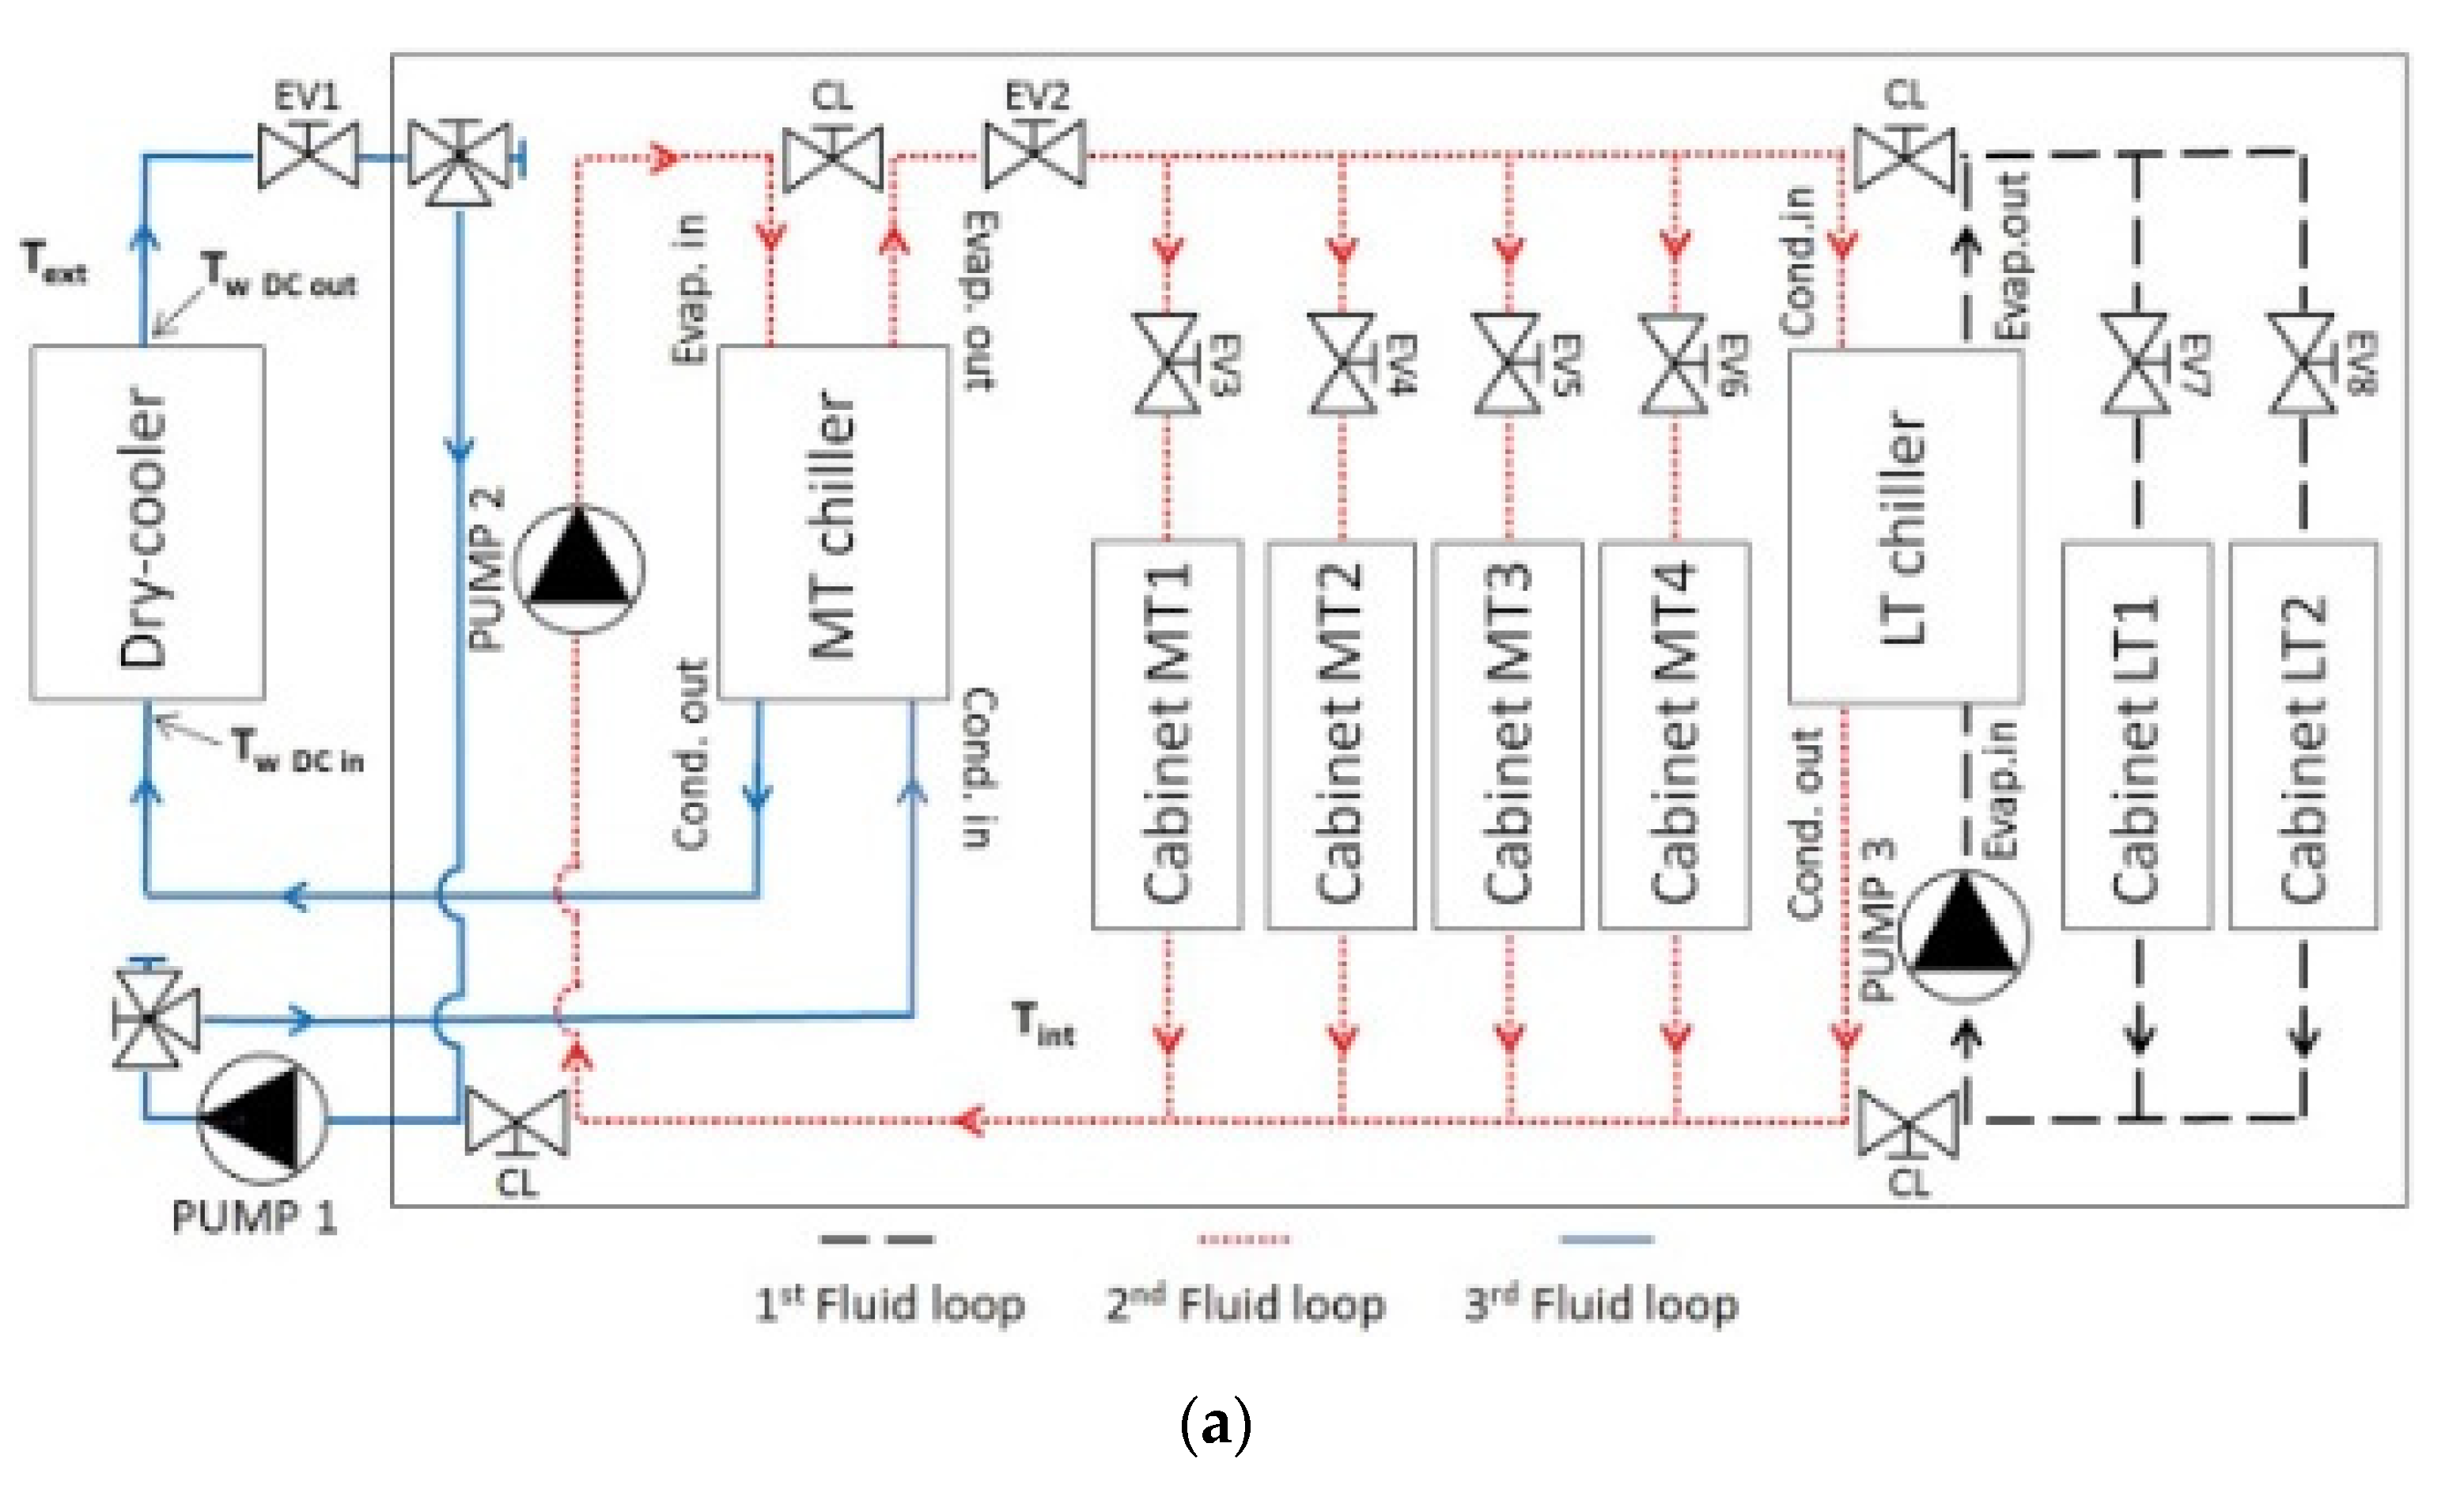
A further analysis by the authors, based on several tests carried out on a real small experimental WLSC system [
42], revealed that the use of a dry cooler should always be preferred to the use of the medium temperature chiller to cool the cold water loop, as it allowed for a 7% energy saving. Furthermore, the solution that implied the exploitation of the evaporative cooling phenomenon by means of direct water evaporation into the air (at the dry cooler inlet) led to appreciable additional energy savings (4%). From an economic perspective, the evaporative cooling solution was revealed to be preferable both in dry and humid climates, due to the possibility to avoid the installation of the MT chiller, thus reducing the initial investment.
2.6. Urban Heat Island Effect in Padova: Theoretic and Experimental Analysis
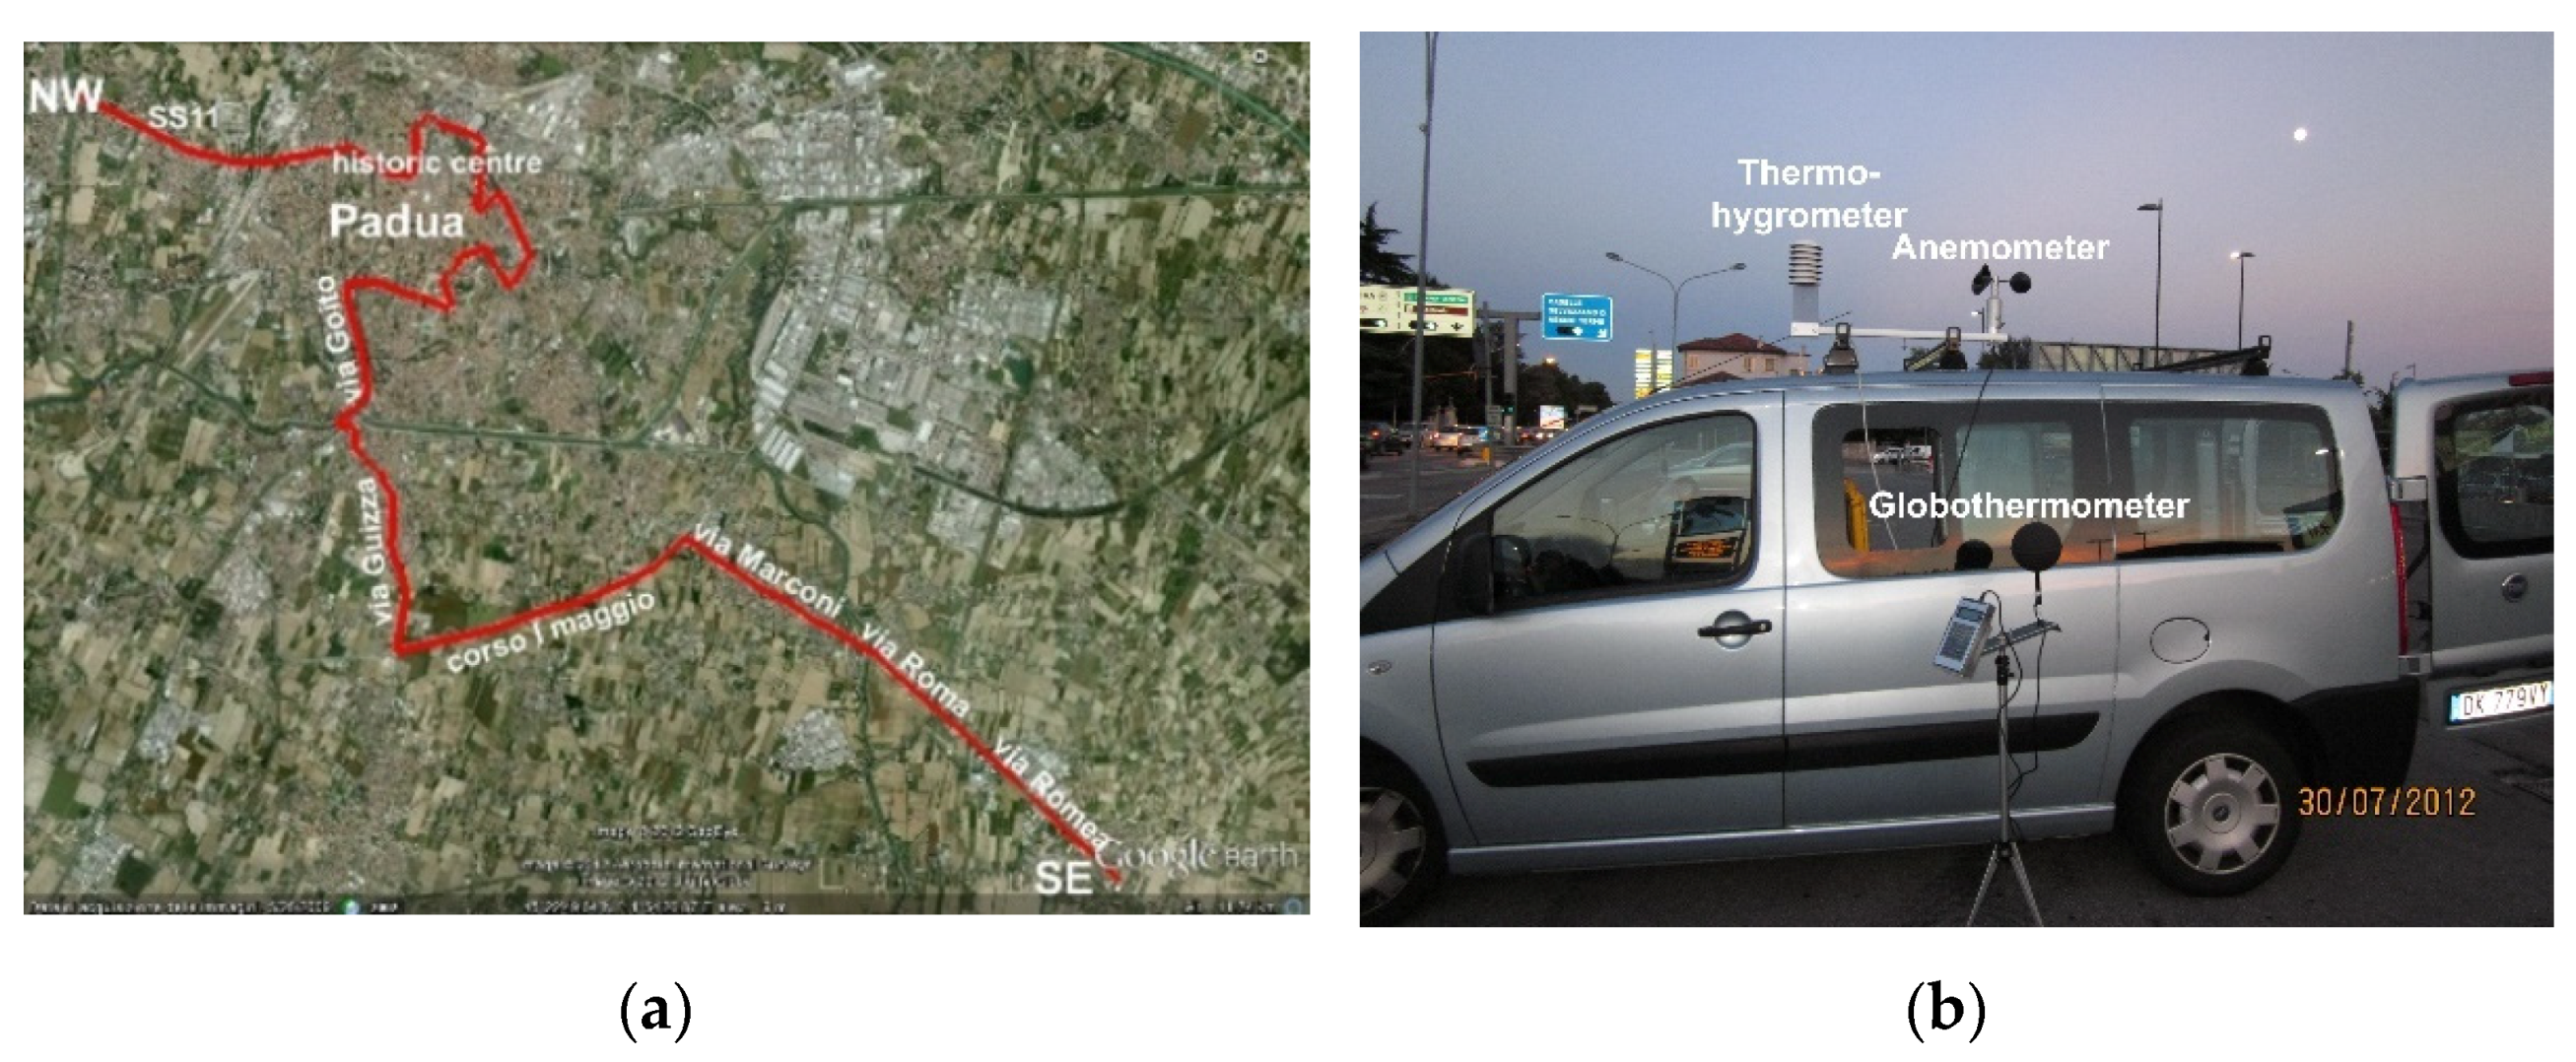
In the period 26 July–9 August 2012 some mobile surveys were conducted by the authors. A vehicle crossing the city of Padova mounted with the measurement instrumentation continuously recorded the data (
Figure 20).
Data were measured during the late afternoon (day measurements) and 1 to 4 h after sunset (night measurements) to evaluate the different intensity of the UHI phenomenon. The main variables detected were solar global radiation on the horizontal, relative humidity, and dry bulb air temperature. The UHI intensity was calculated by the difference between the air temperature by mobile measurement and the simultaneous data recorded by the reference rural meteorological station (8.5 km from the city centre).
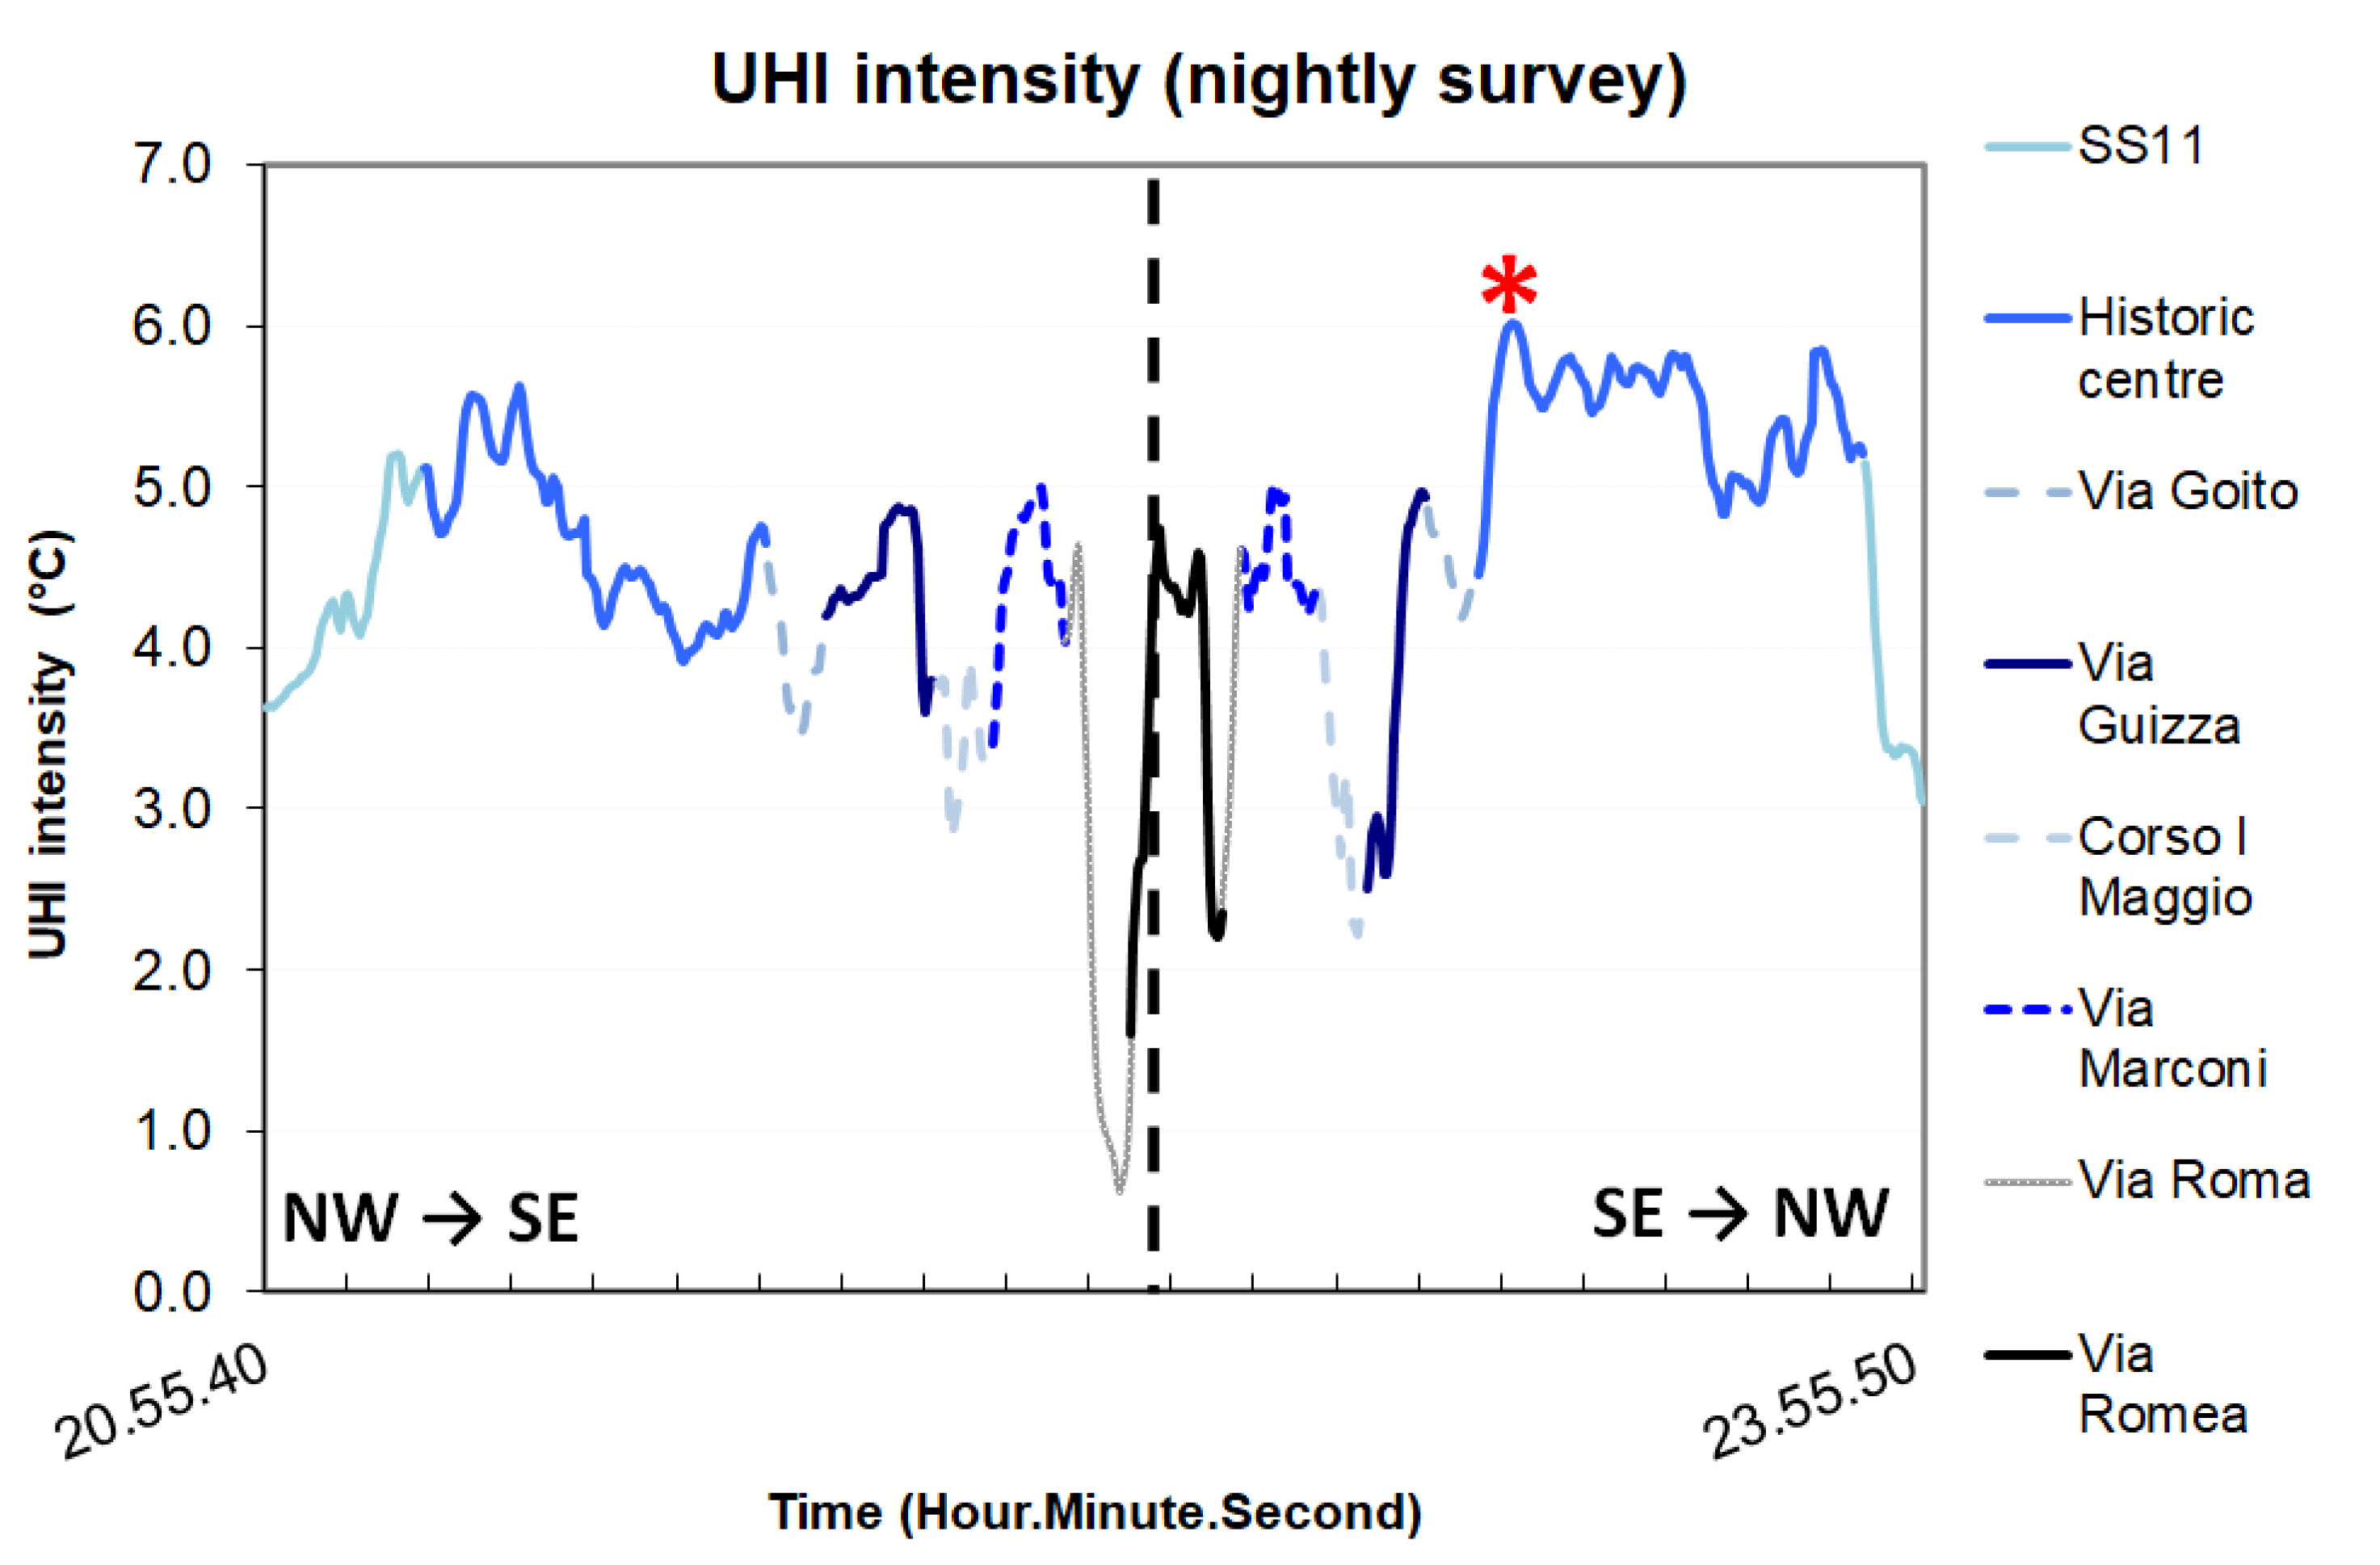
Experimental measurements revealed that the main intensity of the UHI was during the night (3–6 °C), while a lower value was present during the day (1.2–2 °C,
Figure 21). As a methodology note, the evaluation of the intensity of UHI was considered only during the “return” path (SE to NW). In fact, moving from the countryside towards the city centre when the air was cooling allowed to consider this as the most precautionary path. The maximum intensity of UHI was detected when crossing the historic centre with narrow streets (high height-to-width ratio (H/W) of the street).
The increase in impervious surfaces and the H/W ratio along via Guizza, a long road that crosses the suburb to inside the city, were the main causes of the UHI intensity increase (
Figure 21). The following part of the path was along a canal (via Goito): This was the reason the UHI intensity decreased due to the water evaporative cooling effect.
Furthermore, some measurements (wind velocity, air humidity, temperature and mean radiant temperature (MRT)) were realized in some characteristic sites along the path. Here, only the case of Prato della Valle during night measurements is depicted because it is representative of very different situations in the same place (
Table 3). This picturesque circle in the centre of the city is the second largest urban square (about 90,000 m
2) in Europe. A decrease in nightly temperature was expected as green areas and water flows were present; instead, as reported by the red star in
Figure 21, a maximum was measured. This revealed the limited spatial influence of the beneficial effect of the green, as the path passed not inside the circle but within the perimeter.
Based on data from
Table 3, the RayMan model [
58,
59] was used to determine the main outdoor thermal comfort indices: The Predicted Mean Vote (PMV), the Physiological Equivalent Temperature (PET) and the new Standard Effective Temperature (SET*).
Regarding air temperature, the results indicated a difference of 0.5–1 °C between external positions 1, 2, 3, 6 (near the streets) and in the green (position 4). Instead, a larger difference in MRT was measured (with a maximum of 7 °C) due to the different characteristics (water storage capacity, thermal inertia and emissivity) of the surface; moreover, a lower sky view factor (SVF) can be detected in outer positions with respect to the square centre. As a consequence, PMV and PET highlighted a neutral situation in the green and a slightly warm condition in the outer positions. The same air temperature was measured in Pos. 4 (grass) and Pos. 5 (fountain surrounded by dirt patch) (27 °C), due, respectively, to the lower MRT and evaporative cooling.
Table 3.
Data measured in Prato della Valle (2 August 2012) (axes of the ellipse are 180 × 230 m). Reference for thermal comfort indexes: Summer clothing (0.5 clo), activity level 80 W above basal metabolism (Google Earth).
Table 3.
Data measured in Prato della Valle (2 August 2012) (axes of the ellipse are 180 × 230 m). Reference for thermal comfort indexes: Summer clothing (0.5 clo), activity level 80 W above basal metabolism (Google Earth).
| Prato Della Valle |
|---|
![Applsci 11 12155 i001]() |
| | Pos.1 | Pos.2 | Pos.3 | Pos.4 | Pos.5 | Pos.6 |
| Temperature (°C) | 28.4 | 28.4 | 28.1 | 27.0 | 26.9 | 27.4 |
| UHI Intensity (°C) | 3.2 | 3.9 | 4.3 | 3.8 | 3.7 | 4.7 |
| Relative humidity (%) | 48.0 | 48.2 | 49.1 | 52.9 | 53.5 | 51.5 |
| MRT (°C) | 26.5 | 27.4 | 25.2 | 20.1 | 22.2 | 24.8 |
| PMV | 0.8 | 0.8 | 0.6 | 0.0 | 0.1 | 0.5 |
| PET (°C) | 26.1 | 26.5 | 25.3 | 22.5 | 23.3 | 24.7 |
| SET* (°C) | 20.1 | 20.5 | 19.3 | 16.5 | 17.6 | 19.0 |
The study was completed by selecting seven specific points to evaluate the effect of UHI mitigation actions in terms of dry bulb air temperature (AT), MRT and PMV (
Table 4). The scenario “green ground” provided an increase in the pervious surfaces (from 23 to 43% of the total area) by planting 10 m tall trees and grass within and around the ellipse. In this scenario, the UHI maximum intensity decreased by 1 °C and 2 °C in night-time and day-time, respectively. The greatest improvement was found at points 1 and 2, on asphalt (it was greater at point 2 because of the lower SVF). The study concluded that even small areas near green were beneficial because they reduced the intensity of AT and UHI.
In the UHI mitigation strategy “cool pavement”, all traditional surfaces (concrete and asphalt with albedo 0.4 and 0.2, respectively) were substituted by “cool materials”. These are materials with different radiation characteristics, that is, high albedo (0.5) and high infrared radiation emissivity. Such a scenario allowed for a 1.5–2 °C decrease in UHI intensity at 3 am, but even 3–4 °C at 3 pm. The main reason was the greater albedo of asphalt and, therefore, a reduced surface temperature. In Pos. 1 at 3 pm, a decrease from 51.9 °C to 42.6 °C in the asphalt temperature was calculated. The positive effect of the “cool pavement” mitigation action revealed considering MRT as well, as it featured a greater decrease with respect to the “green ground” and “AsIs” scenarios. As a consequence, this scenario allowed the PMV to remain in the −0.5/+0.5 comfort range for most positions during the night.
Table 4.
Characteristic points of Prato della Valle for two simulated scenarios.
Table 4.
Characteristic points of Prato della Valle for two simulated scenarios.
| | ![Applsci 11 12155 i002]() | ![Applsci 11 12155 i003]() |
| Position | Scenario “AsIs” | Scenario “Green Ground” |
| 1 | Asphalt—far from buildings | Green—far from water |
| 2 | Asphalt—near to buildings | Asphalt—near to buildings |
| 3 | Gravel—near to water | Gravel—near to water |
| 4 | Gravel—far from water | Gravel—far from water |
| 5 | Green—far from water | Green—Trees |
| 6 | Green—near to water | Green—Trees |
| 7 | Green—Trees | Green—Trees |
In conclusion, the experimental analyses carried out by the authors highlighted that medium cities such as Padova had a not negligible UHI effect, up to 6–7 °C. The main intensity of the phenomenon was in the centre, where the streets have a high H/W ratio, a small SVF and the majority of impervious surfaces. Instead, the intensity of the UHI was lower in residential areas, generally decreasing with the transition from more to less densely populated streets.
The simulation models developed by the authors revealed the effects of different mitigation actions in some characteristic sites of the city. Substituting impervious surfaces with new green areas allowed for a decrease of some degrees Celsius in AT and even some ten degrees in MRT. More effective results were obtained using cool materials [
47].


 ,
, 


