Article

Development of an Online Detection Setup for Dissolved Gas in Transformer Insulating Oil

School of Instrumentation Science and Engineering, Harbin Institute of Technology, No. 92, Xidazhi Street, Harbin 150001, China
*
Author to whom correspondence should be addressed.
Appl. Sci. 2021, 11(24), 12149; https://doi.org/10.3390/app112412149
Submission received: 18 November 2021 / Revised: 8 December 2021 / Accepted: 17 December 2021 / Published: 20 December 2021

Abstract

:
The type and concentration of dissolved gases in transformer insulating oil are used to assess transformer conditions. In this paper, an online detection setup for measuring the concentration of multicomponent gases dissolved in transformer insulating oil is developed, which consists of an oil-gas separation system and an optical system for acquiring the transformer status in real time. The oil-gas separation system uses low pressure, constant temperature, and low-frequency stirring as working conditions for degassing large-volume oil samples based on modified headspace degassing. The optical system uses tunable diode laser absorption spectroscopy (TDLAS) to determine the gas concentration. Six target gases (methane, ethylene, ethane, acetylene, carbon monoxide, and carbon dioxide) were detected by three near-infrared lasers (1569, 1684, and 1532 nm). The stability of the optical system was improved by the common optical path formed by time-division multiplexing (TDM) technology. The calibration experiments show that the second harmonics and the concentrations of the six gases are linear. A comparison experiment with gas chromatography (GC) demonstrates that the error of acetylene reaches the nL / L level, while the other gases reach the μ L / L level. The data conforms to the power industry testing standards, and the state of the transformer is analyzed by the detected six characteristic gases. The setup provides an effective basis for the online detection of dissolved gas in transformer insulating oil.

1. Introduction

Transformers are the central electrical component of power grids, providing a reliable power supply, and their stable operation is of great importance to grid safety [1,2]. Transformer insulating oil is composed of paraffin with 20 or more carbon molecules, which play the roles of cooling, insulating, and arc extinguishing during transformer operation. When alkanes are subjected to the energy levels generated by the transformer, their chemical bonds are broken, resulting in the formation of corresponding gases (methane, ethane, ethylene, acetylene, carbon monoxide, and carbon dioxide) [3]. The gases are fully dissolved in the insulating oil in a confined space. Therefore, the status of the transformer can be assessed by the type and content of the dissolved gases [4]. The development of transformer maintenance plans based on dissolved gas analysis (DGA) in transformer insulating oil is currently one of the main methods in the power industry for improving the reliability of the grid power supply [5]. As a result, maintenance decisions in the grid can be optimized by obtaining more timely information on transformer operation through the online detection of dissolved gases in transformer oil.
The gases that reflect information regarding the transformer’s condition are those dissolved in the insulating oil. Consequently, online detection of dissolved gases differs from conventional online gas detection. Both oil-gas separation and gas detection need to be considered. Oil-gas separation methods are divided into two main types: Vacuum degassing and dissolved equilibrium. Vacuum degassing requires the use of equipment with a high vacuum level. Therefore, the dissolved equilibrium method is the most commonly used separation method [6]. Membrane separation is the main method used in online oil-gas separation equipment. It has a simple structure but requires a long degassing time [7]. This degassing method does not provide information regarding the transformer in real time. The headspace degassing process, a type of dissolved equilibrium method, has the advantages of fast degassing and high repeatability. This method is meant to be used by an online testing device. Volatile organic compounds (VOCs) detection conventional methods include catalytic combustion [8], semiconductor gas sensor [9], thermal conductivity detection [10], electrochemical detection [11], and gas chromatography [12]. These methods have certain limitations, especially in multicomponent gas detection. With the development of VOCs detection technology, some scholars use various types of sensors for multi-component gas detection [13] in many fields, such as purified essential oil detection in commercial plant products [14], alcoholic beverages and perfume quality control [15], bakery food product classification [16], and coffee processing [17]. However, in the field of DGA real-time detection, it is necessary to use the high anti-interference, fast response time and high-performance detection method that does not consume the test samples [18]. Therefore, optical detection technology can effectively satisfy the above requirements.
Hussain, K., Mt, S. et al. [19,20] used UV-visible and FTIR spectroscopy to measure dissolved gases in oil. Zou, J. et al. [21] used Raman spectroscopy to evaluate the aging state of transformer insulation oil. Norazhar, Abu. et al. [22] used Fourier spectroscopy to analyze oil samples and a fuzzy algorithm to estimate the concentration of dissolved gas. However, these spectroscopic devices are complicated and unsuitable for field applications. As a result, the photoacoustic spectroscopy (PAS) technique has been used for the online detection of dissolved gases in transformer oil [3,23]. The detection sensitivity of the photoacoustic phenomenon is heavily influenced by background noise, which cannot be eliminated in field applications. To reduce the effect of field noise on optical detection sensitivity, absorption spectroscopy techniques are used. TDLAS is an absorption spectroscopy technique that is the most direct and efficient way of detecting molecules. It has achieved remarkable results in atmospheric environmental monitoring and combustion detection [24,25]. TDLAS is also more resistant to interference than photoacoustic spectroscopy. In the field of DGA, Ma, G. M. et al. [26] used TDLAS to measure acetylene at the μ L / L level in the laboratory. Jiang J et al. [27] measured methane in a field environment, with a detection error of 4 μ L / L . X Tian et al. [28] developed a CH4/C2H6 sensor with a detection range of 100 μ L / L . In addition, Jun et al. [29] used a four-laser device to detect four kinds of hydrocarbon gases, due to the fact that a small amount of the gas species reflects limited information regarding the transformer status. However, carbon monoxide and carbon dioxide are characteristic gases that contain transformer condition information that cannot be ignored.
In summary, this paper investigates and presents an online detection setup for dissolved gases in transformer insulating oil based on headspace degassing and tunable laser absorption spectroscopy. The oil-gas separation system degases large volumes of insulating oil samples at low pressure, constant temperature, and low frequency agitation. The gas detection system uses a near-infrared wavelength for detection. The characteristic wavelengths of the gases are selected appropriately to reduce cross interference. Therefore, six target gases can be accurately detected by three lasers. Detection sensitivity is improved by the wavelength modulation technique and a long optical path structure (optical path length = 12 m). The complexity of the optical path is reduced by the common optical path formed by the time division multiplexing (TDM) technology. After the setup was completed, the performance was verified experimentally, and detection results are used to analyze the transformer status.

2. Principles of Detection

2.1. Oil-Gas Separation Theory

According to the principle of dissolution equilibrium, when the insulating oil is in a confined container, the dissolved gas molecules gradually diffuse from the oil due to the molecular thermal motion. Therefore, a state of gas-liquid dynamic equilibrium is achieved inside the container. The dissolution equilibrium model is shown in Figure 1.
As described by Fick’s law, the rate of gas molecule diffusion is proportional to the density difference on both sides of the oil surface. The gas molecule diffusion rate equation is:
d n g i d t = ( C t o i K i C t g i ) D i
where n g i is the amount of the i-th gas in the container; C t o i and C t g i are the concentrations of the i -th gas in the liquid and gas phases, respectively (at time t); K i is the Oswald coefficient of the i -th gas; and D i is the molecular diffusion factor. For a constant volume of the oil sample, the total amount of the substance is conserved, and the concentration of gas in the container can be described as:
U o i V o = C t o i V o + C t g i V g
where V o represents the volume of the oil sample; V g indicates the volume of the gas chamber in the container; and U o i denotes the concentration of the gas in the oil at the time of sampling. According to Equations (1) and (2), the relationship between the time and the amount of substance of gas can be formulated as follows:
n gi = U o i ( 1 V o + K i V g ) · { 1 e x p [ t · ( 1 V o + K i V g ) · D i ] }
At dynamic equilibrium, the gas phase concentration of the i -th gas can be expressed as:
C g i = U o i / ( K i + V g V o )
The equilibrium time τ in Figure 2, which can be calculated with Equation (5), is the time required for C t g i = ( 1 e 2.5 ) C g i .
τ = 2.5 ( 1 V o + K i V g ) D i

2.2. TDLAS Detection Theory

Different molecules need to absorb different wavelengths of light to achieve vibration. Therefore, every gas has its own characteristic spectrum. The TDLAS technique uses both the narrow line width and the tunable features of the laser to scan a single characteristic absorption line of the target gas, as shown in Figure 3.
The intensity of the laser light passing through the target gas can be expressed by the Beer-Lambert law:
I t ( v ) = I o ( v ) e x p [ α ( v ) C L ]
where I o ( v ) is the incident light intensity; I t ( v ) is the transmitted light intensity; α ( v ) is the absorption coefficient at frequency v per unit concentration and per unit length; C is the volume fraction of the gas; and L is the length of the optical path.
Wavelength modulation and harmonic detection techniques are used to improve detection sensitivity. A high-frequency sinusoidal modulation signal is superimposed on the laser scanning signal. The instantaneous frequency of the laser can be expressed as:
v ( t ) = v ¯ + a cos ( 2 π f t )
where a represents the modulation amplitude and v ¯ is the laser center frequency. The incident light intensity was assumed to remain essentially constant with sufficiently minor modulations. Therefore, the modulated input intensity I o [ v ( t ) ] is equivalent to the intensity at the center frequency of the absorption spectrum I o ( v o ) . As a result, the high-frequency modulated transmitted light intensity can be calculated as follows:
I t [ v ( t ) ] = I o [ ( v ( t ) ] e x p { α [ v ¯ + a cos ( 2 π f t ) ] C L } = I o ( v o ) n = 0 H n ( v ¯ ) cos ( 2 π n f t )
where H n ( v ) ¯ is the Fourier coefficient with a modulated absorption factor; and H n ( v ) ¯ can be demodulated by a lock-in amplifier. Reid et al. determined that the magnitude of the second harmonic amplitude is related to the gas concentration. As a result, the second harmonic amplitude was used to calculate the gas concentration. Figure 4a depicts the signal received by the photoelectric detector in the absence of gas absorption. With the onset of gas absorption, the sunken shape of the signal appeared, as shown in Figure 4b. In Figure 4c, the second harmonic signal was obtained by demodulating the concave region.
The presence of baseline drift and residual amplitude modulation caused the second harmonic to appear asymmetrical, which occurred during the detection and modulation processes. Consequently, to suppress this phenomenon, the second harmonic amplitude was defined as the sum of the absolute values of the maximum and minimum of the second harmonic. The definition of the second harmonic amplitude is shown in Figure 5.

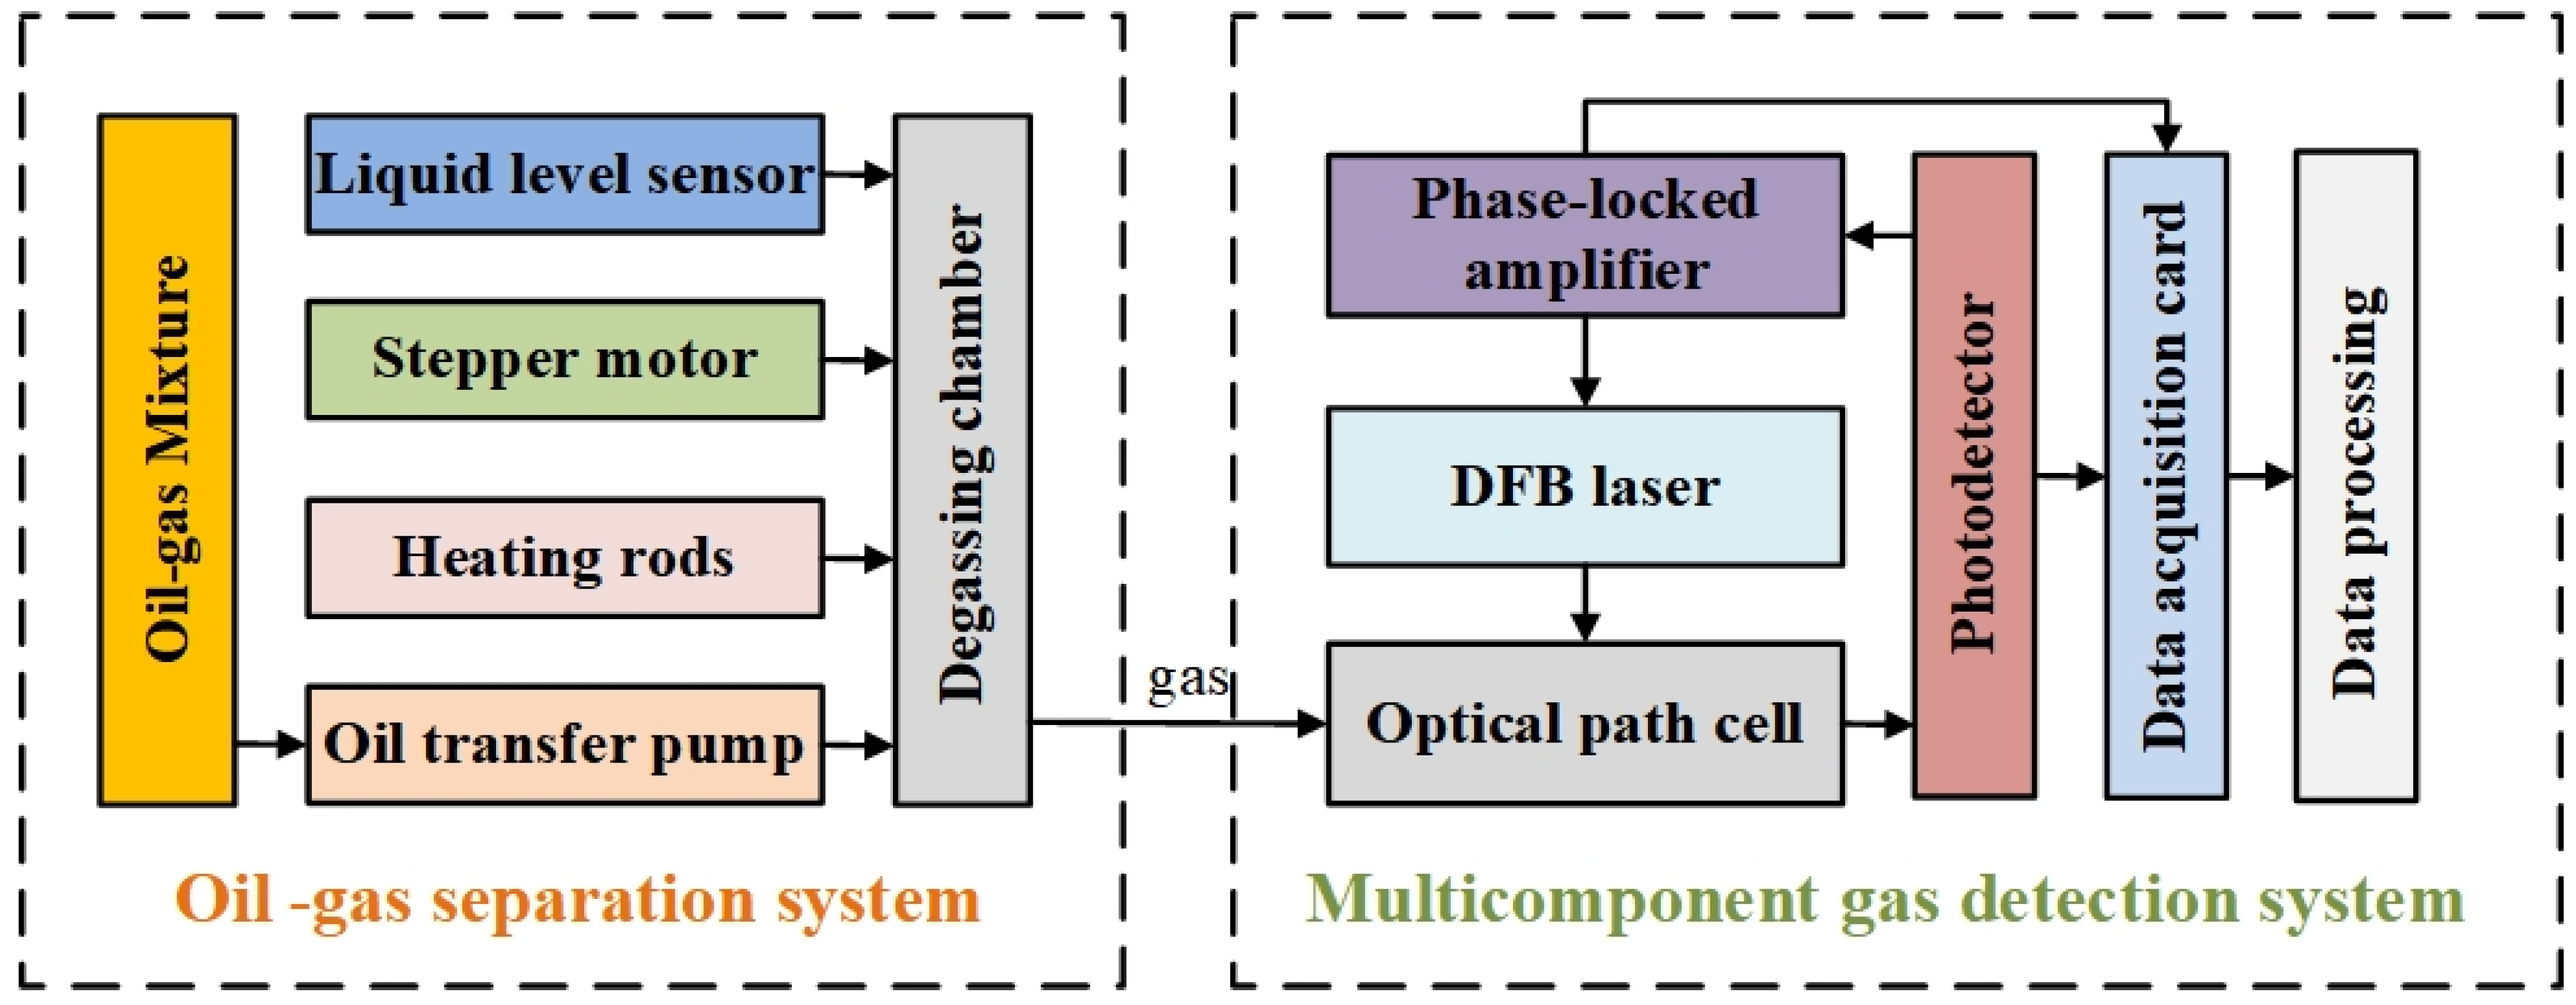
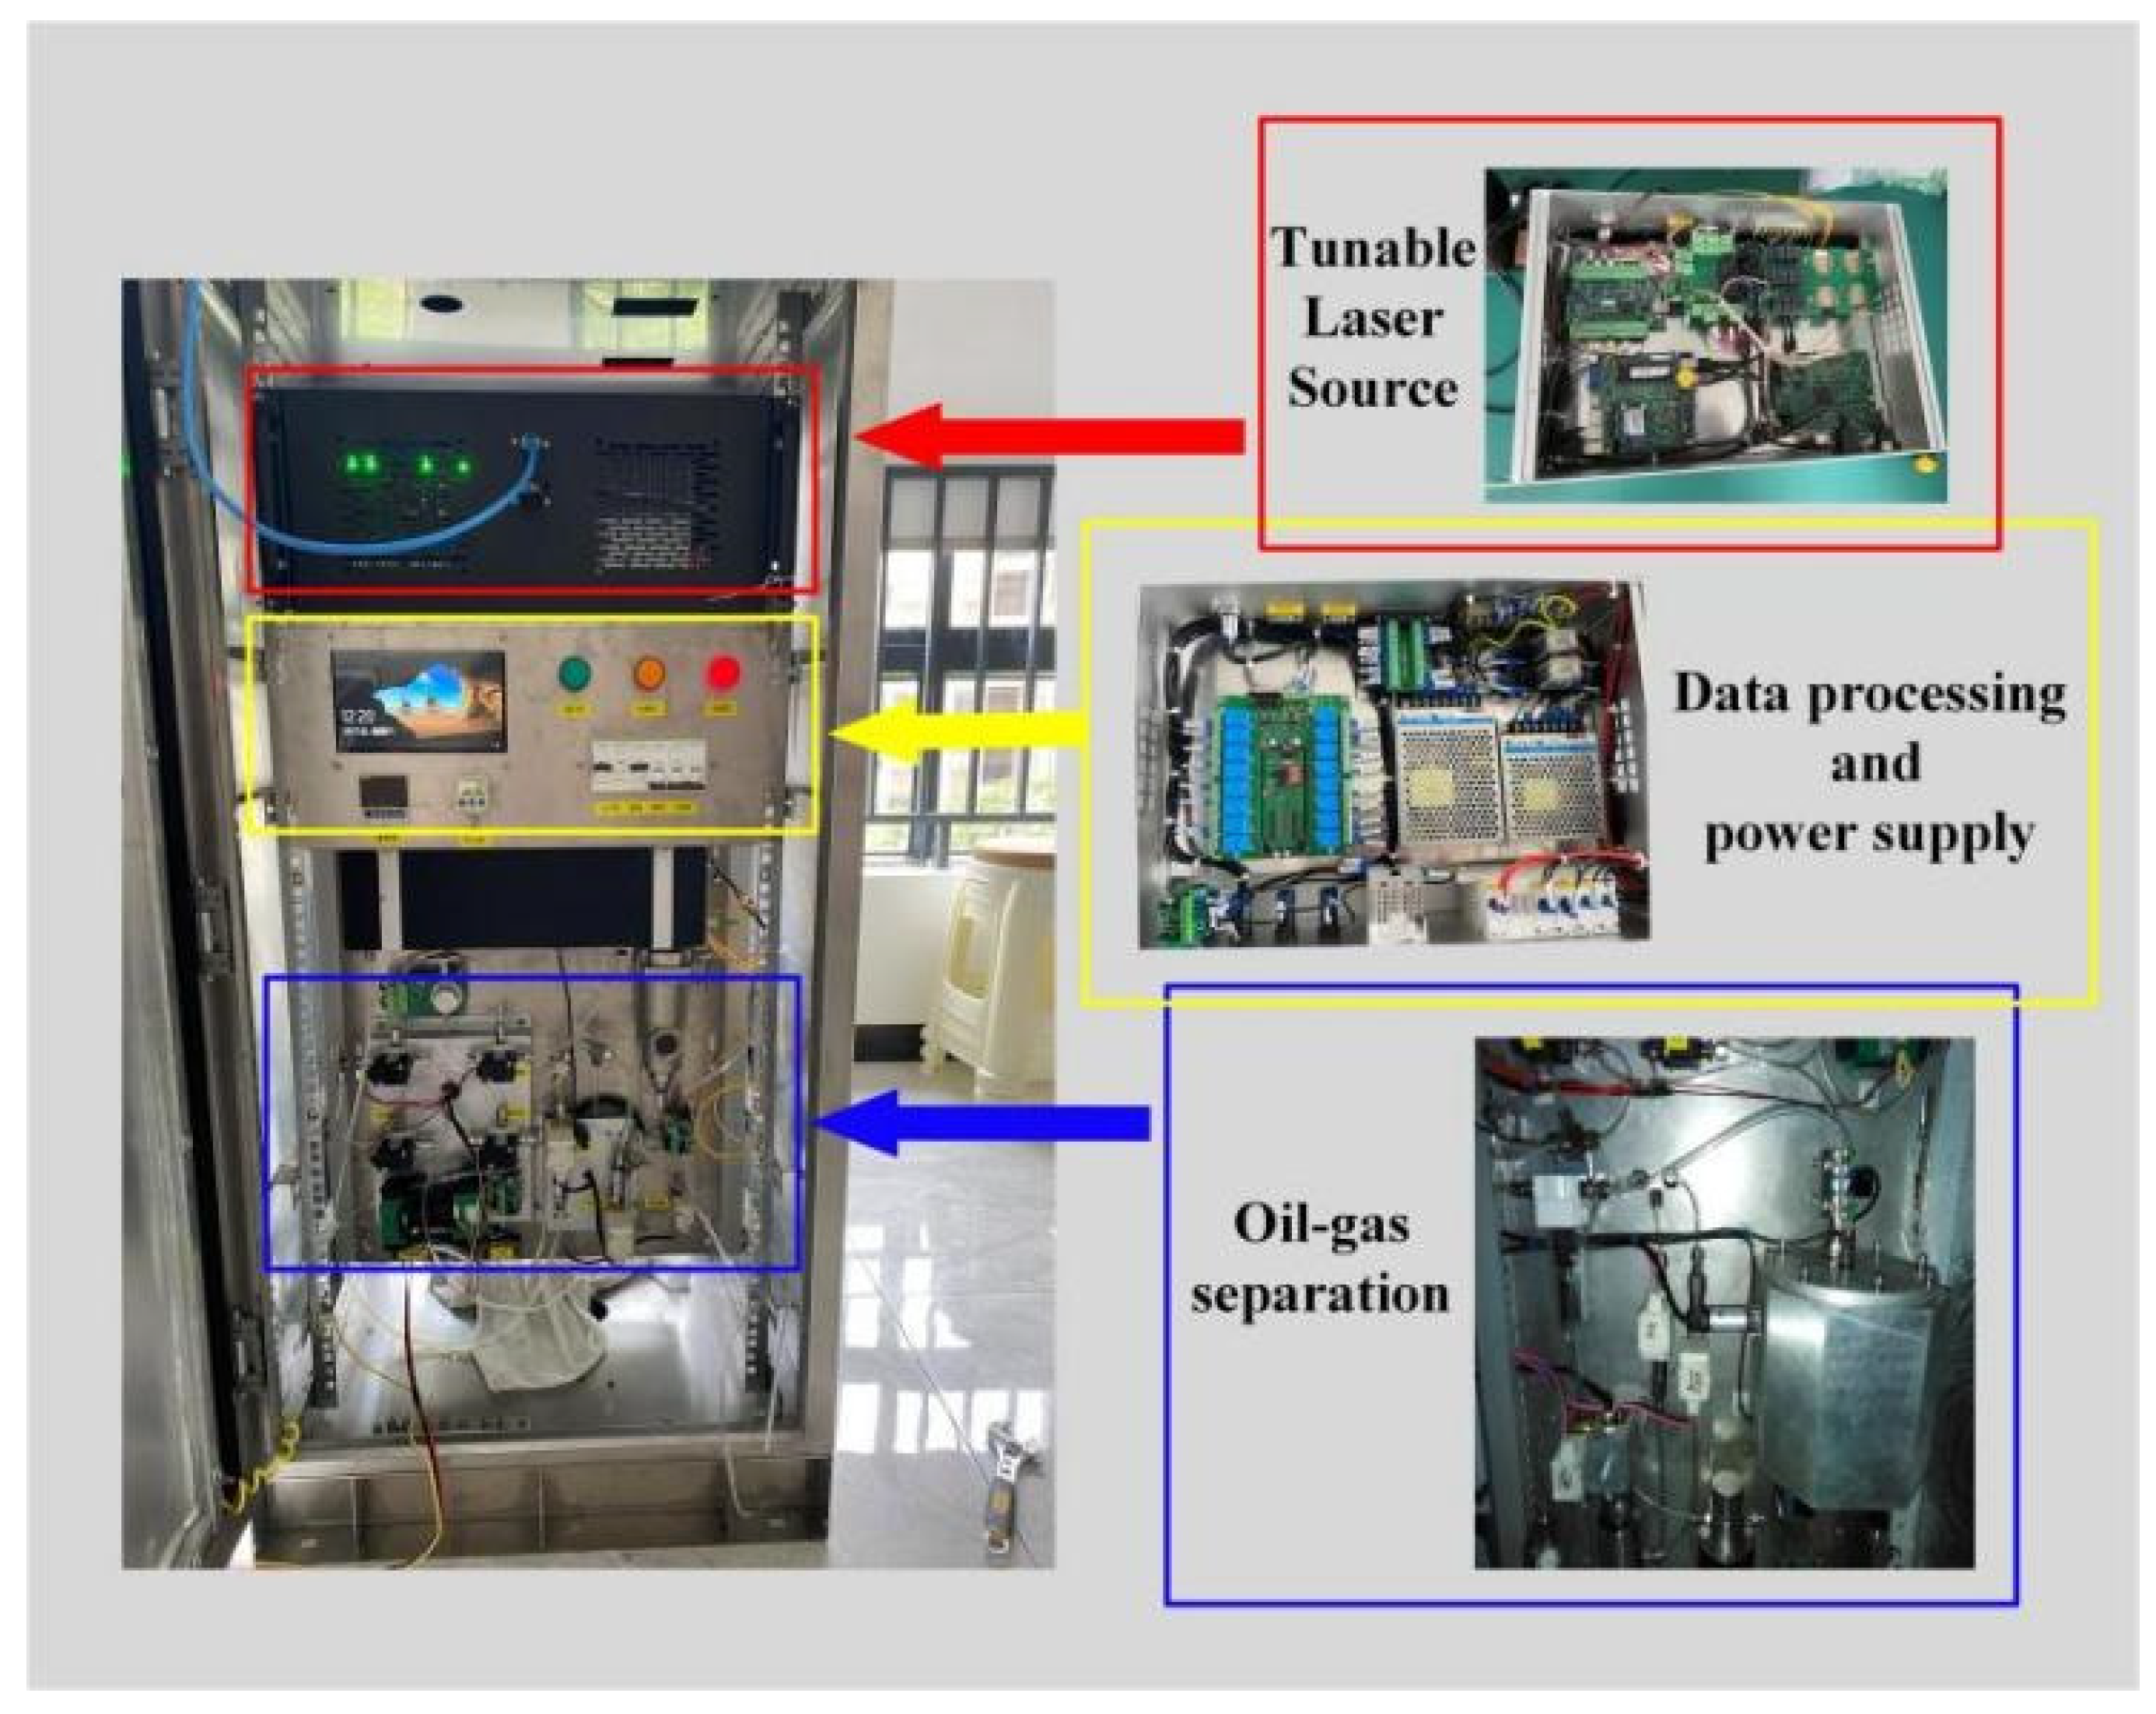
3. Experimental Setup Design

The experimental setup consists of an oil-gas separation system and a gas detection system. A schematic diagram of the setup is shown in Figure 6.

3.1. Oil-Gas Separation System

The degassing rate is dependent on the diffusion coefficient D i , the volume of the oil sample V o , and the volume of the gas chamber V g . V o and V g are determined by the volume of the customized optical path cell (400 mL). D i is a function of temperature, pressure, stirring frequency, and the oil sample cross-section. The temperature, pressure, and stirring rate are used as improvement conditions in the oil-gas separation system. As a result, a constant-temperature and low-pressure dynamic headspace degassing chamber was constructed. The structure of the degassing chamber is shown in Figure 7.
The low-pressure and constant-temperature environment in the degassing chamber was created as follows: First, the pressure in the chamber was reduced to a stable 28 kPa. Second, the insulating oil was pumped into the chamber. Finally, the oil sample was evenly heated via thermal resistance and low-frequency stirring. The main parameters of the degassing chamber are shown in Table 1.

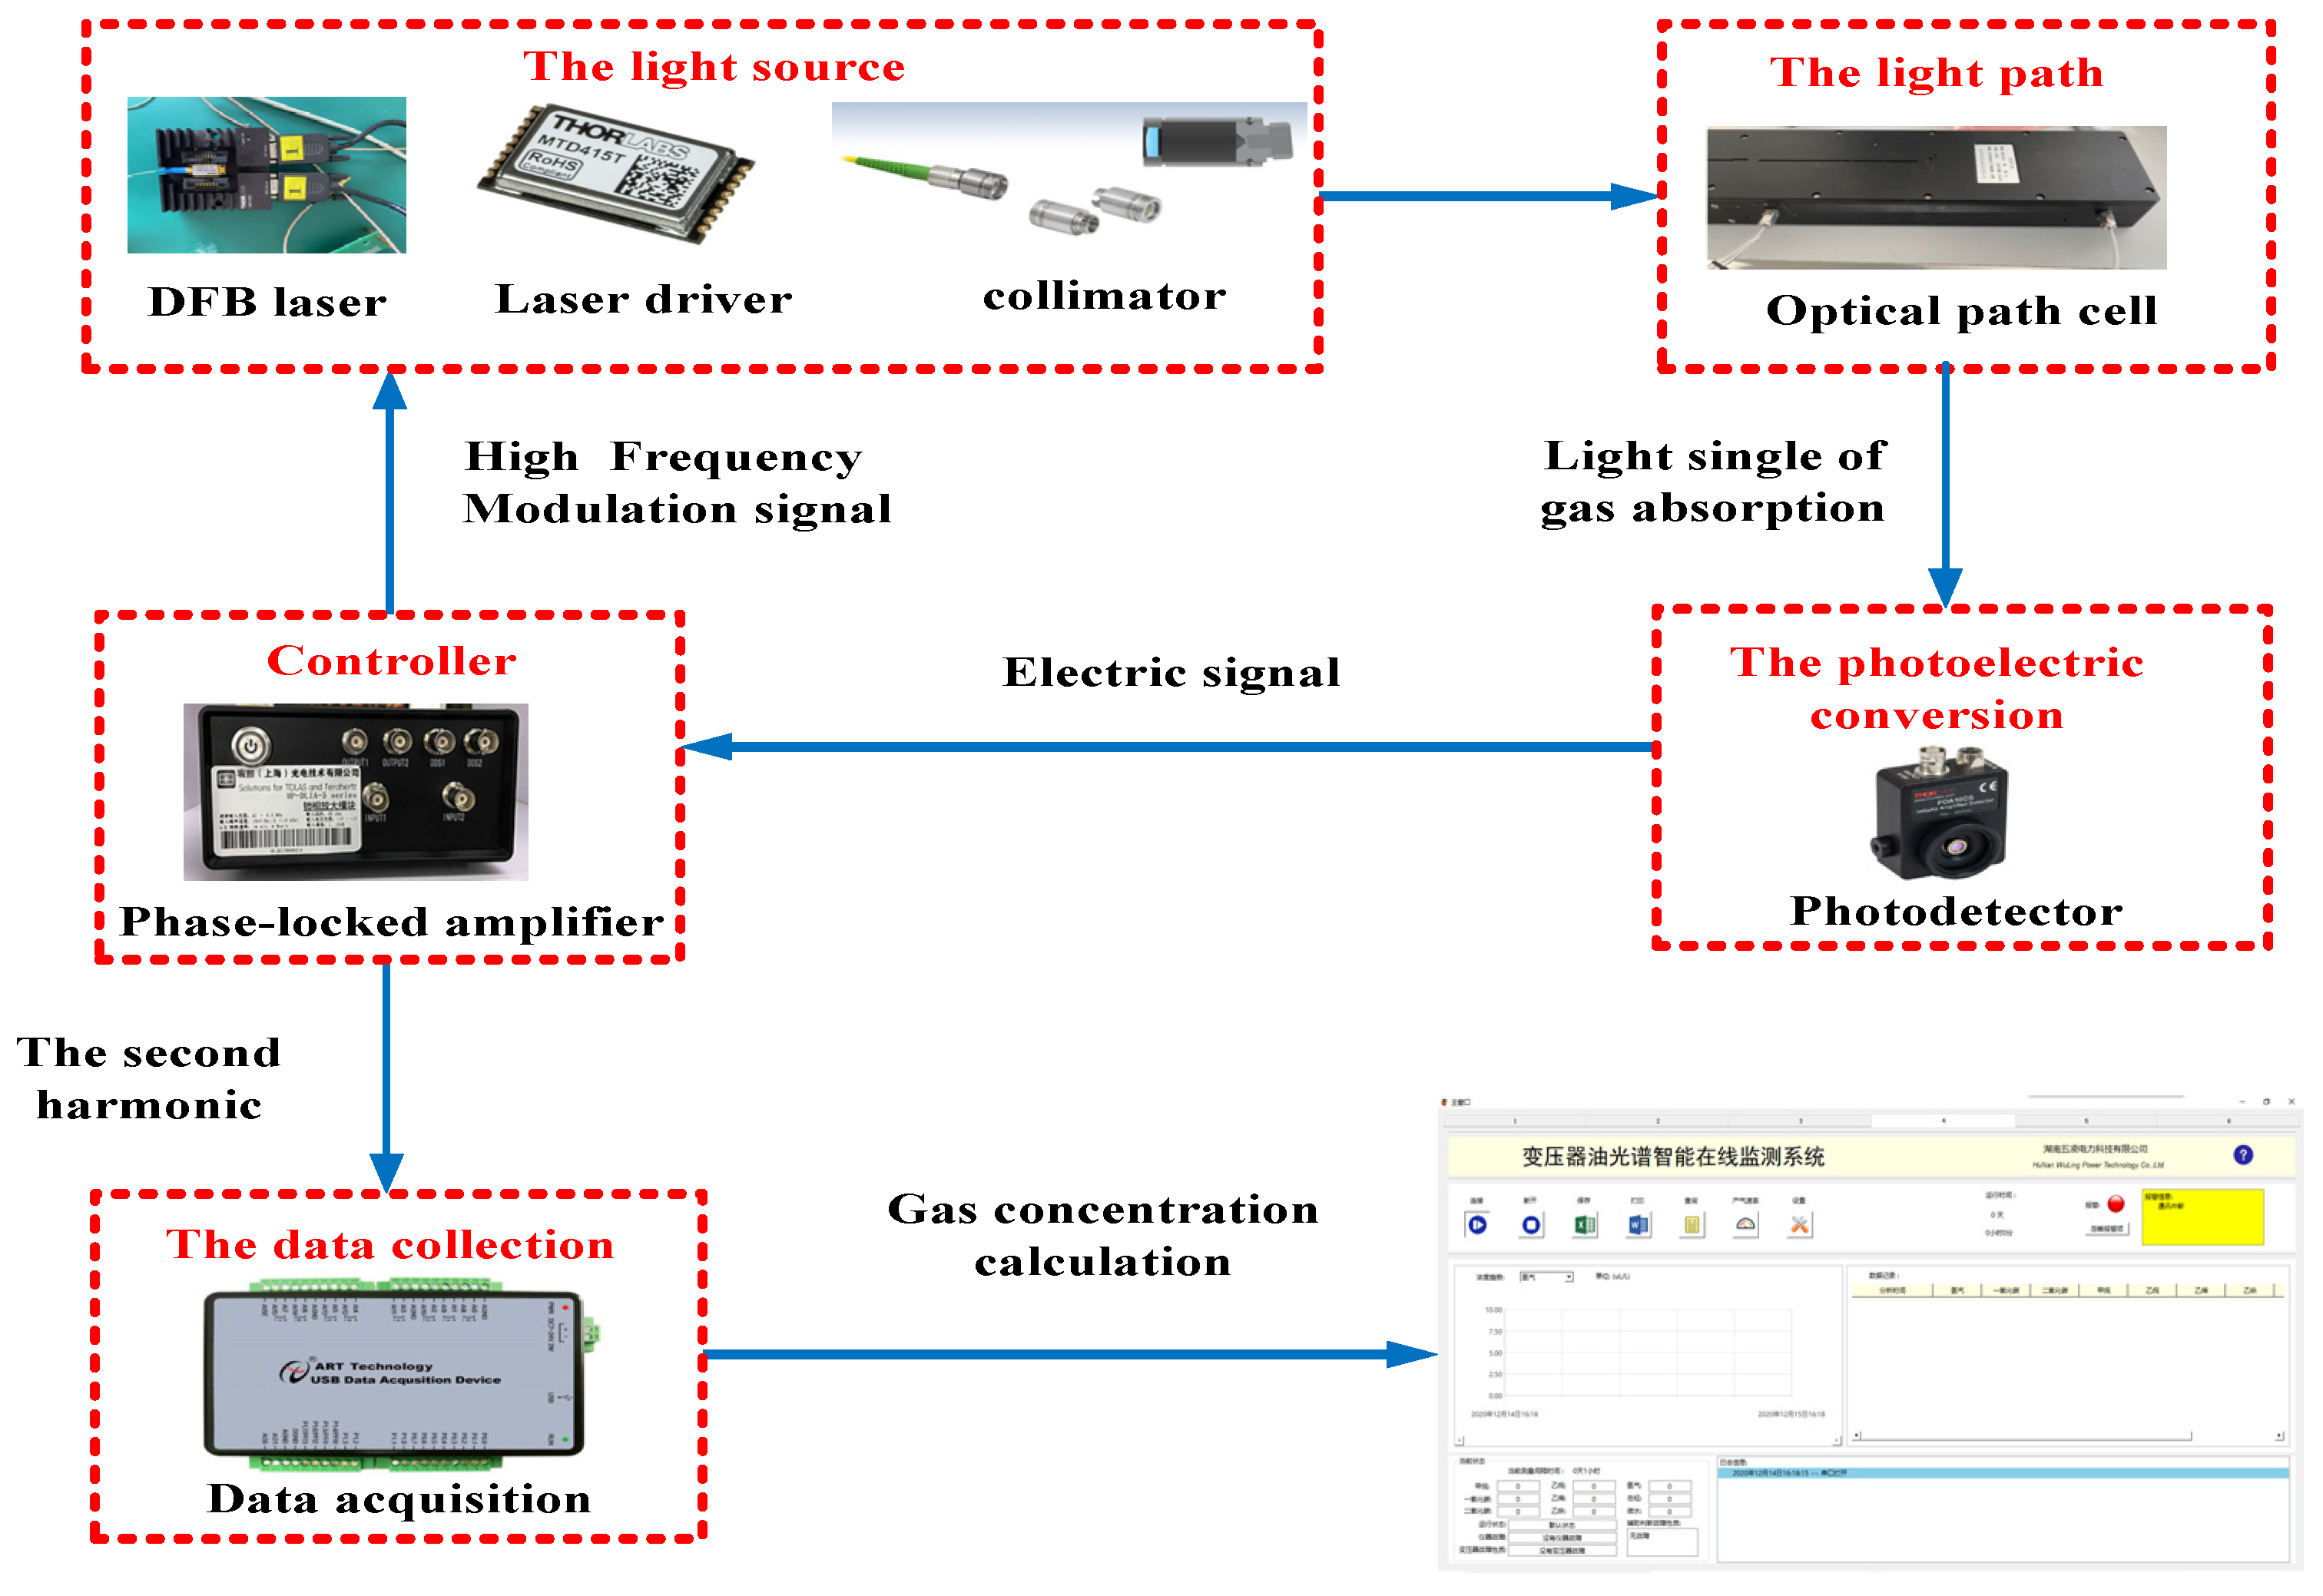
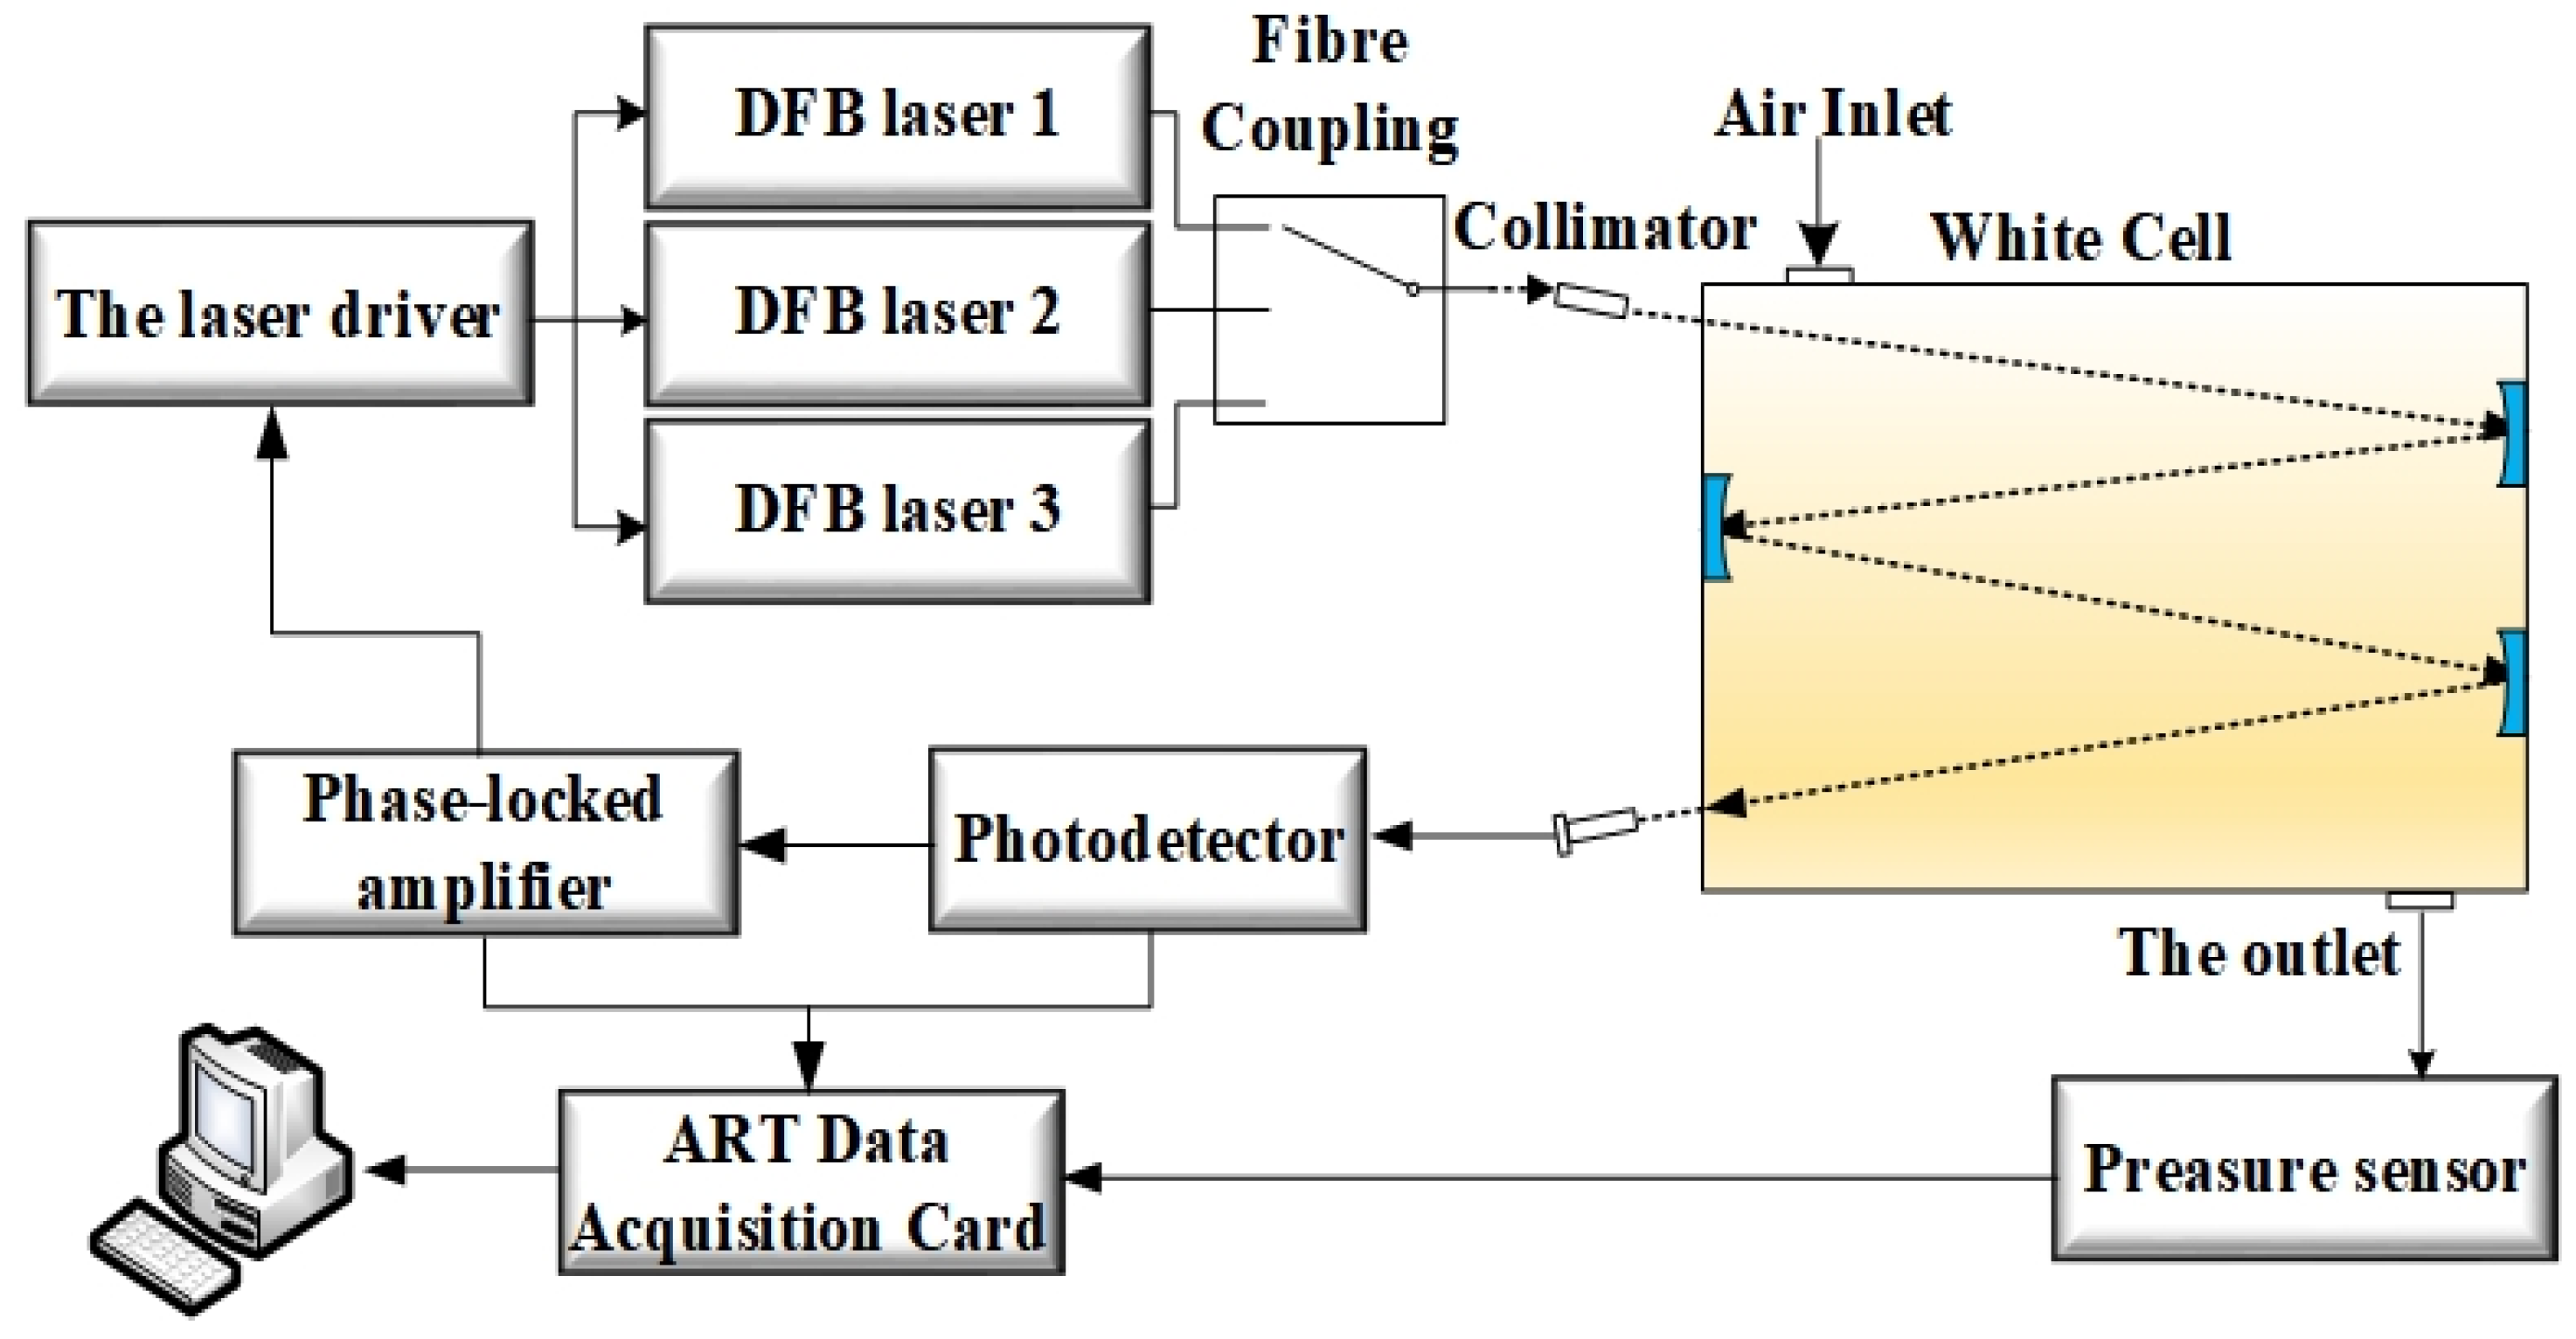
3.2. Multicomponent Gas Detection System

The TDLAS gas detection system with wavelength modulation, as shown in Figure 8, consists of a laser, an optical path cell, a photodetector, and a lock-in amplifier. Increasing the number of lasers is a common strategy for this system to detect multiple types of gas. However, industrial applications need to consider environmental factors, such as integration, stability, and vibration.
During system integration, the waveband and the number of lasers for detecting gas must be considered. Gas absorption lines in the mid-infrared region are intense, but the distance between the spectral lines is relatively large. In addition, the temperature requirement of a mid-infrared laser complicates the system. Therefore, the mid-infrared band is not conducive for system integration. In this paper, near-infrared spectra with relatively close spectral line spacings were selected to reduce the number of lasers. The detection sensitivity was improved by wavelength modulation and a long optical path cell (the customized optical path is 12 m). The absorption intensities of carbon monoxide, carbon dioxide, methane, and acetylene in the 5800–6600 cm−1 spectral range are shown in Figure 9. The VPL spectral database [30] was used as a reference to select the near-infrared absorption spectra of ethylene and ethane.
The 1532.83 nm wavelength was chosen as the central wavelength for the C2H2 absorption spectra. The central wavelengths for CO and CO2 were 1597.57 and 1579.74 nm, respectively. The wavelengths 1684.04, 1683.10, and 1683.35 nm were selected sequentially for CH4, C2H6, and C2H4. The central wavelengths of the laser output are shown in Table 2.
An optical coupler was used in the optical path. Using time-division multiplexing (TDM), different wavelengths of lasers enter the gas cell sequentially to form a common optical path. In this way, the complexity of the optical path is reduced, enhancing the structural strength of the system. The structure of the gas detection system is shown in Figure 10. The high-frequency modulated signal (20 kHz) and the laser scanning signal (10 Hz) were coloaded on DFB lasers, and the second harmonics of the characteristic gases were obtained by the lock-in amplifier.

4. Experiment and Discussion

4.1. Gas Detection Experiment

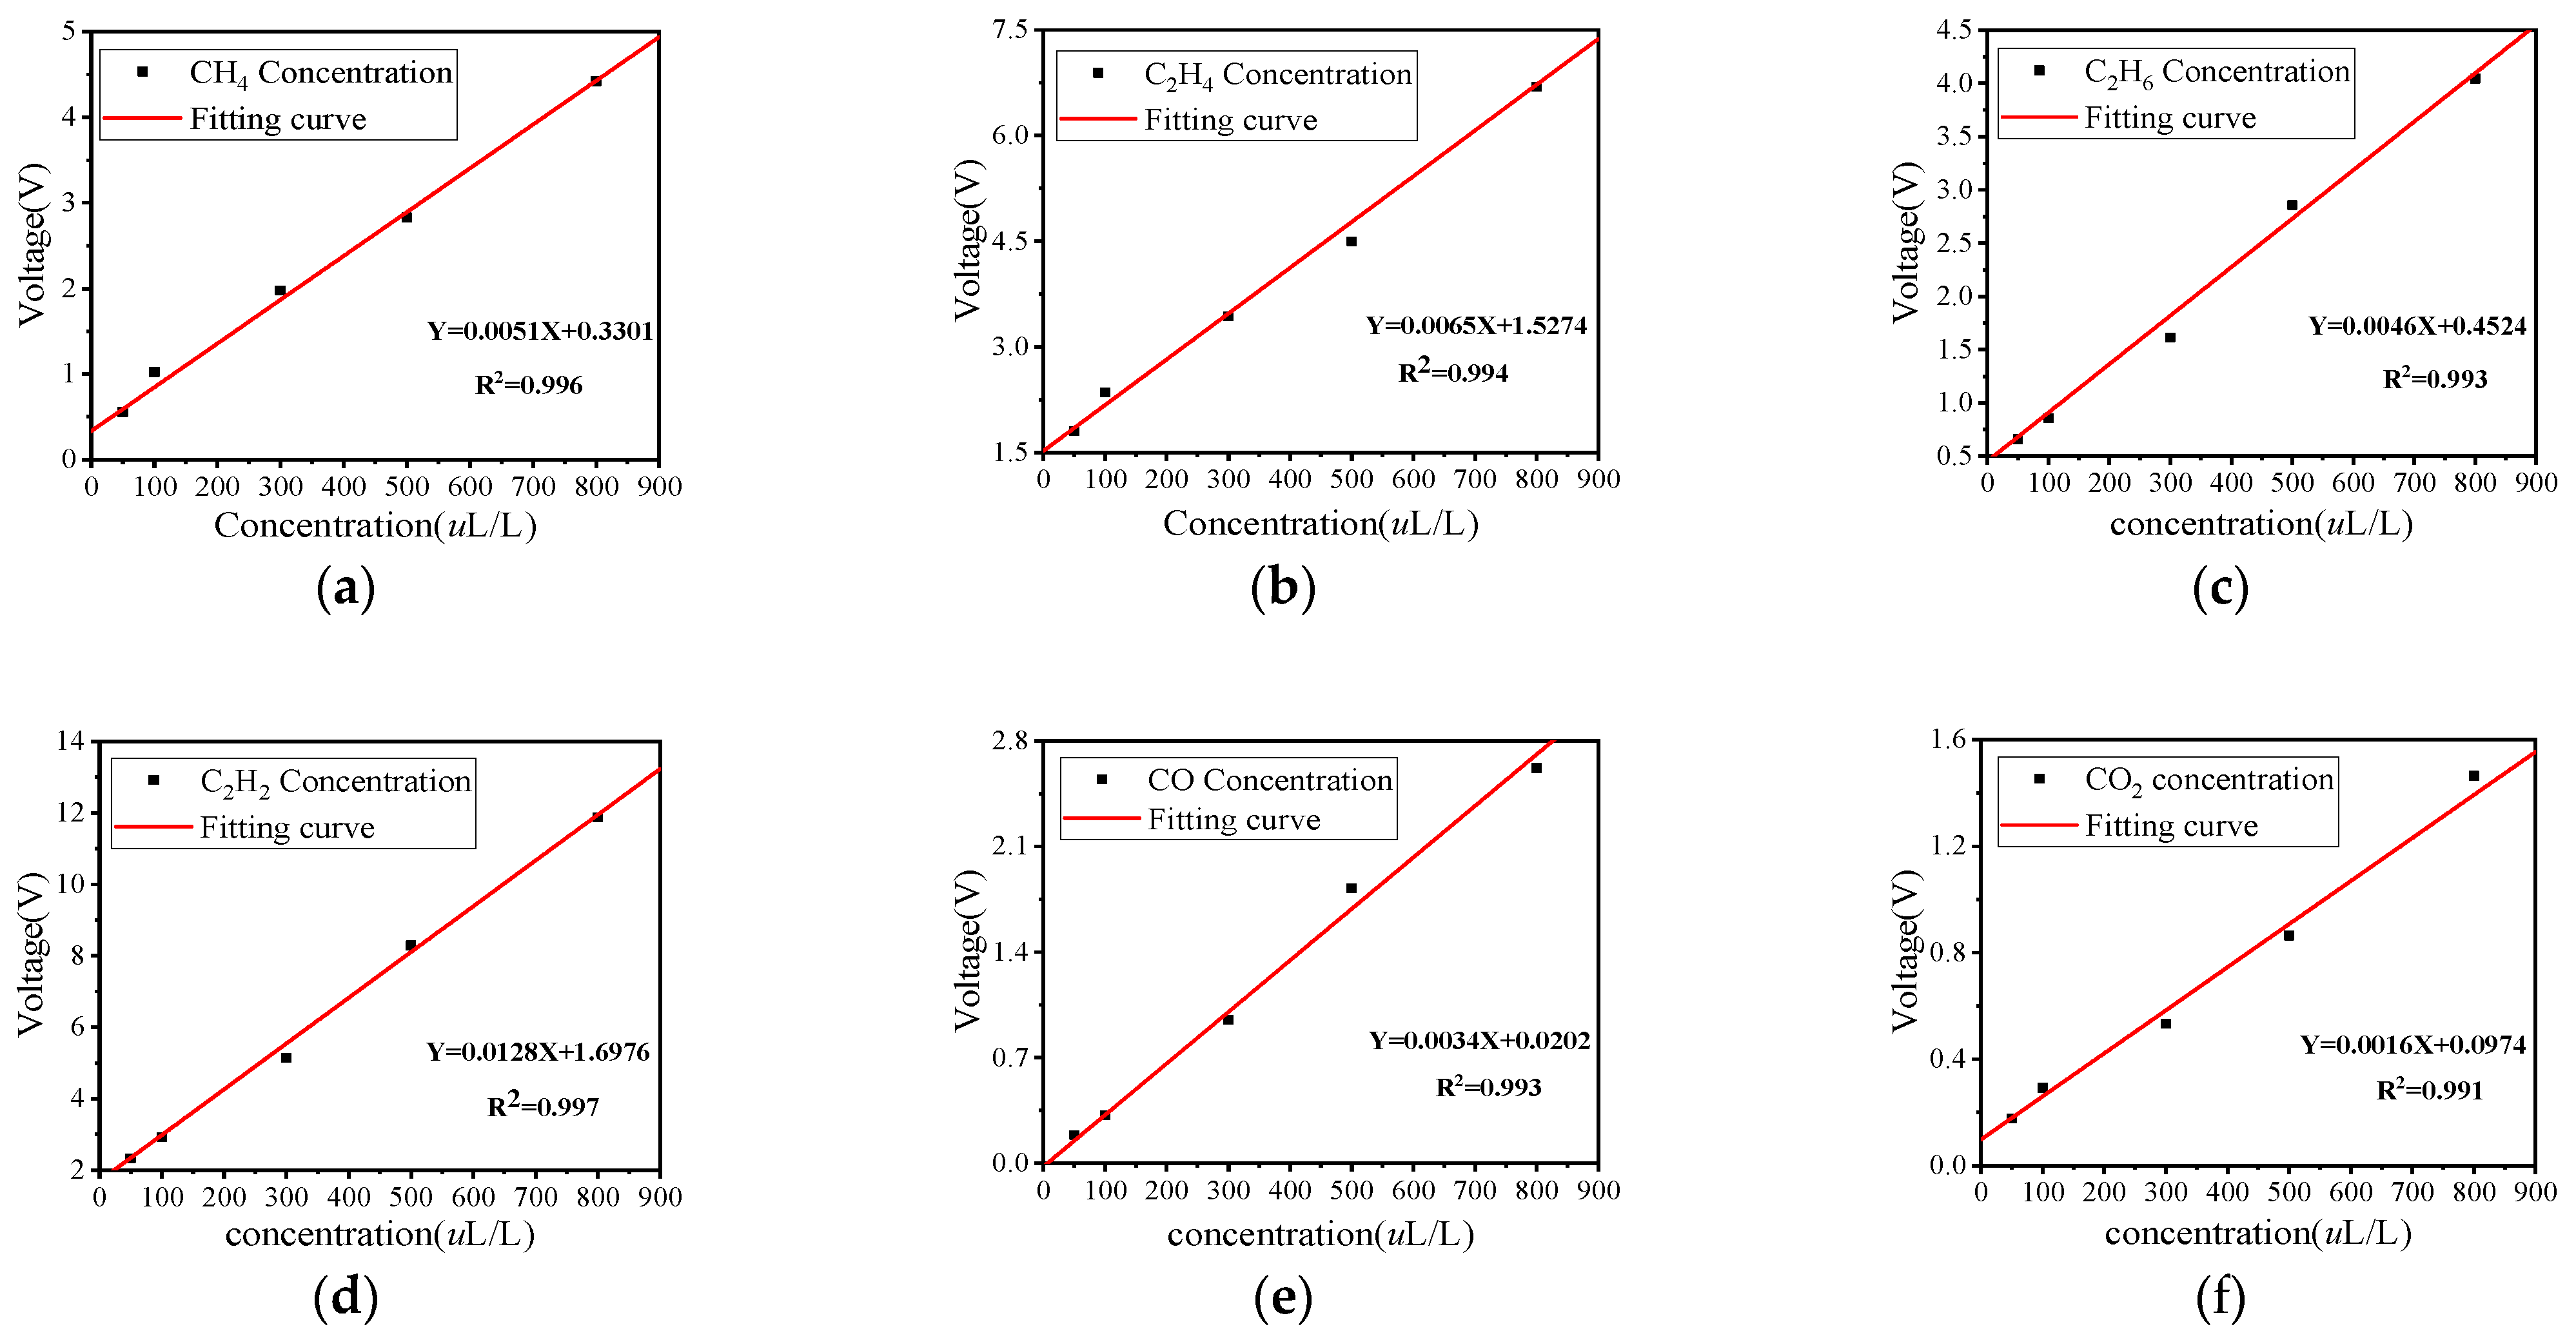
4.1.1. Calibration Experiment

The amplitude of the second harmonic reflects only the relative change in gas concentration, not the exact value. Therefore, it is necessary to establish a relationship between a certain concentration and the corresponding amplitude of the second harmonic. A gas dividing instrument was used to mix different concentrations of gases in the gas cell. The second harmonic signals of various gas concentrations are shown in Figure 11. Figure 12 shows the linear relationship between the amplitudes of the second harmonics and the corresponding concentrations.
The amplitudes of the second harmonic of the gases at different concentrations are different in Figure 11. Therefore, the gas concentration can be described by the magnitude of the second harmonic. The second harmonic signals are used for linear fitting. Figure 12 shows the linear relationship between the amplitudes of the second harmonics and the corresponding concentrations.
The second harmonic has a good linear relation with the concentration in Figure 12. Therefore, detection sensitivity can be expressed by the slope of the fitting curve. This is consistent with the situation in the literature research [26,27,29]. The detection sensitivities of methane, ethylene, ethane, carbon monoxide, carbon dioxide, and acetylene are 5.1, 6.4, 4.6, 3.4, 1.6, and 12.8 mV / μ L · L 1 , respectively.

4.1.2. Comparison Experiment

In this paper, the dedicated power system gas chromatography (Model: ZTGC-TD-2014D) was used as a reference device for assessing the performance of the gas detection system. The TDLAS and the GC systems detected the same sample. Optical detection does not consume the test samples. Therefore, averaging multiple measurement data points can be used to minimize the impact of system random noise on the absorption signal. The TDLAS system collects 14 periodic signal data points at a time and averages the second harmonic signals from all periods to produce a single measurement value. To reduce random errors, the average value of 30 measurements was used as the evaluation standard. The measurement results of the TDLAS system are shown in Figure 13.
According to Figure 13, the standard deviations of methane, ethylene, and ethane are 2.0, 2.5, and 2.3 μ L / L , respectively. The standard deviations of carbon monoxide and carbon dioxide are 2.4 and 2.8 μ L / L , respectively. The standard deviation of acetylene is 0.5 μ L / L . The average detection values of the TDLAS system and the data from the reference device are shown in Table 3.
Table 3 shows the relative errors of the reference device, which are 1.67 μ L / L for CO, 13.47 μ L / L for CO2, 0.05 μ L / L for CH4, 1.96 μ L / L for C2H6, 3.16 μ L / L for C2H4, and 0.09 μ L / L for C2H2. Therefore, the detection error of the TDLAS system meets the requirements of the power industry and it can be applied to the detection of dissolved gases in transformer insulating oil.

4.2. Dissolved Gas Detection Experiment

The setup described in this paper, as shown in Figure 14, was assessed in a laboratory environment (temperature 25 °C, pressure 101 kPa).
To detect dissolved gases in insulating oil, it is necessary to determine the time required for an oil-gas mixture (650 mL) to achieve dynamic equilibrium in an oil-gas separation system. The system operates at a temperature of 50 ± 1.3 °C, a pressure of 28 ± 2.7 kPa, and a stirring speed of 72 ± 2 r/min.
As shown in Figure 15, the degassing of the hydrocarbons takes 35 min. Carbon monoxide requires approximately 55 min to reach dynamic equilibrium.
The degassing situation conforms to the trend of the gas separation time [6,31], and the oil-gas separation system is able to separate the gas dissolved in oil. After determining the degassing time, three standard oil samples were used for testing. The comparison results are shown in Table 4.
In detection of standard oil samples, the relative error of hydrocarbons at NO.1 oil and NO.2 oil is less than 2.4 μ L / L , carbon monoxide is less than 3.4 μ L / L , and carbon dioxide is less than 10.8%. In addition, the error of carbon monoxide and carbon dioxide in NO.3 oil is less than 4% and 13.4%, respectively, and the error of hydrocarbons does not exceed 3%. The test errors conform to the standards (GB/T7252-2001, DL/T722-2014) provided by the Power Industry Equipment Quality Inspection and Testing Center of the People’s Republic of China. The setup can be applied to online detection of dissolved gas in transformer insulating oil.

4.3. Dissolved Gas Analysis

In order to determine the operating status of the transformer, dissolved gases in the detected oil samples are analyzed. The total hydrocarbons (THC) and CO2/CO value of the oil samples are shown in Table 5.
According to the guidelines of the electric power industry (IEEE Std C57.104-2019 and IEC60599), the acetylene concentration is used as the criterion. The attention value is 5 μ L / L . When it reaches 35 μ L / L , it indicates that the transformer will malfunction if it continues to operate. Some scholars [6,26,32] have measured acetylene and provided early warning to the transformer. However, acetylene can only be used as a caution indicator for judging the state of the transformer. When the concentration of acetylene is between the caution value and the serious warning value, it is impossible to further analyze the state of the transformer (such as the fact that the concentration of acetylene in No.1 oil sample is about 10 μ L / L ). At this time, only the measurement of acetylene does not meet the requirements. Therefore, it is necessary to measure other characteristic gases to analyze the further state of the transformer.
The type of transformer fault is judged by the Duval triangle [33]. It needs ethylene and methane dissolved in the oil samples to assist. The analysis results of the Duval triangle are shown in Figure 16.
According to the definition of Duval triangle, the formula for the proportion of C2H2, C2H4, and CH4 is as follows:
% C 2 H 2 = 100 X X + Y + Z ;   % C 2 H 4 = 100 Y X + Y + Z ;   % C H 4 = 100 Z X + Y + Z
X; Y; Z are the concentrations of acetylene, ethylene, and methane in transformer insulating oil.
The measured value and standard value of No.1 oil sample are both in the D+T area, and the transformer status is the electrical and thermal mixed fault. The results of No.2 and No.3 oil samples are in the D2 area, and arc discharges have occurred in transformers. Although the Duval triangle can classify the types of faults, it cannot determine whether the transformer fault involves the deterioration of the insulation material [34]. The insulation deterioration in the transformer will aggravate the electrical and thermal fault of the transformer and reduce the life of the transformer. Therefore, the ratio of CO2 and CO is used to assist in judging the insulation aging of the transformer [35,36]. When CO2/CO > 20 (such as No.1 oil sample), the solid insulation material will degrade at low temperature (<140 °C). When CO2/CO > 7, the solid insulation material deteriorates. When CO2/CO is more than 3 and less than 7 (such as No.2 oil sample), the insulation material is normally aging. When CO2/CO is less than 3 and a large amount of total hydrocarbons are generated (such as No.3 oil sample), the solid insulating material deteriorates. In this paper, through the measurement and analysis of the six kinds of dissolved gas in oil, the transformer state obtained is shown in Table 6.
In summary, a small amount of gas is not comprehensive enough to obtain transformer status information, and the transformer status needs to be judged from multiple aspects. The transformer status information obtained by multicomponent gas online detection is more detailed than the small amount of gas. Consequently, the setup described in this paper is able to reveal the operating conditions of the transformer, relatively.

5. Conclusions

In this paper, an online detection system for dissolved gases in transformer insulating oil based on modified headspace degassing and tunable laser absorption spectroscopy, was proposed. The oil-gas separation system degassed large-volume oil samples using low pressure, constant temperature, and low-frequency stirring as working conditions. An oil-gas separation experiment showed that the equipment can degas a 650 mL oil sample in 1 h. The optical coupler and time-division multiplexing (TDM) technology were used to form a common optical path to improve the structural strength of the optical system. By analyzing the absorption spectra, the near-infrared center wavelengths of six target gases (carbon dioxide 1579.57 nm, carbon monoxide 1579.74 nm, methane 1684.04 nm, ethylene 1683.35 nm, ethane 1683.1 nm, acetylene 1532.83 nm) are determined. Three lasers (1569, 1684, 1532 nm) are used to detect those six gases, respectively. Laser (1684 nm) is adopted to detect three gases (methane, ethylene, ethane), laser (1579 nm) for two gases (carbon dioxide, carbon monoxide), and laser (1532 nm) for acetylene. The detection sensitivity of the target gases achieved by the gas detection experiment were 5.1 mV / μ L · L 1 for methane, 6.4 mV / μ L · L 1 for ethylene, 4.6 mV / μ L · L 1 for ethane, 3.4 mV / μ L · L 1 for carbon monoxide, 1.6 mV / μ L · L 1 for carbon dioxide, and 12.8 mV / μ L · L 1 for acetylene. The experimental results of the detection of dissolved gases in insulating oil demonstrate that the setup described in this paper conforms to the standards required by the electric power industry. In addition, the six kinds of gases detected can analyze additional transformer status information. Therefore, the system developed in this paper is a relatively accurate online detection setup for determining the transformer status.

Author Contributions

Conceptualization and writing original draft preparation, Y.C.; methodology, Y.C.; software, Y.C. and Z.L.; validation, J.D.; formal analysis, Z.L.; investigation, H.Z. and Z.W.; resources, J.D. All authors have read and agreed to the published version of the manuscript.

Funding

This research received no external funding.

Institutional Review Board Statement

Not applicable.

Informed Consent Statement

Not applicable.

Data Availability Statement

The data presented in this study are available on request from the corresponding author.

Conflicts of Interest

The authors declare no conflict of interest.

References

  1. Aizpurua, J.I.; Catterson, V.M.; Stewart, B.G.; McArthur, S.; Lambert, B.; Ampofo, B.; Pereira, G.; Cross, J.G. Power transformer dissolved gas analysis through Bayesian networks and hypothesis testing. IEEE Trans. Dielectr. Electr. Insul. 2018, 25, 494–506. [Google Scholar] [CrossRef] [Green Version]
  2. Arvind, D.; Khushdeep, S.; Deepak, K. Condition monitoring of power transformer: A review. In Proceedings of the Transmission & Distribution Conference & Exposition, Chicago, IL, USA, 21–24 April 2008. [Google Scholar]
  3. Bakar, N.; Abu-Si Ada, A.; Islam, S. A review of dissolved gas analysis measurement and interpretation techniques. IEEE Electr. Insul. Mag. 2014, 30, 39–49. [Google Scholar] [CrossRef]
  4. Faiz, J.; Soleimani, M. Dissolved gas analysis evaluation in electric power transformers using conventional methods a review. IEEE Trans. Dielectr. Electr. Insul. 2017, 24, 1239–1248. [Google Scholar] [CrossRef]
  5. Bustamante, S.; Manana, M.; Arroyo, A.; Castro, P.; Martinez, R. Dissolved gas analysis equipment for online monitoring of transformer oil: A review. Sensors 2019, 19, 4057. [Google Scholar] [CrossRef] [Green Version]
  6. Chen, T.; Ma, F.; Zhao, Y.; Wan, L.; Li, K.; Zhang, G. Portable ppb-level acetylene photoacoustic sensor for transformer on-field measurement. Optik 2021, 243, 167440. [Google Scholar] [CrossRef]
  7. Liu, S.; Ma, L.C.; Chen, C.H.; Chen, C.; Lin, Y.S. Highly gas permeable, ultrathin Teflon AF2400/gamma-alumina composite hollow fiber membranes for dissolved gas analysis. J. Membr. Sci. 2017, 540, 243–250. [Google Scholar] [CrossRef]
  8. Ding, J.; Li, X.; Jian, C.; Sheng, L.; Yin, L.; Xu, X. New sensor for gases dissolved in transformer oil based on solid oxide fuel cell. Sens. Actuators B Chem. 2014, 202, 232–239. [Google Scholar] [CrossRef]
  9. Uddin, A.; Yaqoob, U.; Chung, G.S. Dissolved hydrogen gas analysis in transformer oil using Pd catalyst decorated on ZnO nanorod array. Sens. Actuators B Chem. 2016, 226, 90–95. [Google Scholar] [CrossRef]
  10. Tan, T.; Sun, J.; Chen, T.; Zhang, X.; Zhu, X. Fabrication of thermal conductivity detector based on mems for monitoring dissolved gases in power transformer. Sensors 2020, 20, 106. [Google Scholar] [CrossRef] [Green Version]
  11. Suhaimi, N.S.; Din, M.F.M.; Rahman, A.R.A.; Hamid, M.H.A.; Wang, J. Optimum electrical and dielectric performance of multi-walled carbon nanotubes doped disposed transformer oil. Energies 2020, 13, 3181. [Google Scholar] [CrossRef]
  12. Fan, J.; Feng, W.; Sun, Q.; Feng, B.; Ye, H.; Liu, Y. An online monitoring system for oil immersed power transformer based on SnO2 GC detector with a new quantification approach. IEEE Sens. J. 2017, 17, 6662–6671. [Google Scholar] [CrossRef]
  13. Granato, D.; Santos, J.S.; Escher, G.B.; Ferreira, B.L.; Maggio, R.M. Use of principal component analysis (pca) and hierarchical cluster analysis (hca) for multivariate association between bioactive compounds and functional properties in foods: A critical perspective. Trends Food Sci. Technol. 2018, 72, 83–90. [Google Scholar] [CrossRef]
  14. Rasekh, M.; Karami, H.; Wilson, A.D.; Gancarz, M. Performance analysis of mau-9 electronic-nose mos sensor array components and ann classification methods for discrimination of herb and fruit essential oils. Chemosensors 2021, 9, 243. [Google Scholar] [CrossRef]
  15. Slimani, S.; Bultel, E.; Cubizolle, T.; Herrier, C.; Livache, T. Opto-electronic nose coupled to a silicon micro pre-concentrator device for selective sensing of flavored waters. Chemosensors 2020, 8, 60. [Google Scholar] [CrossRef]
  16. Rusinek, R.; Gawrysiak-Witulska, M.; Siger, A.; Oniszczuk, A.; Gancarz, M. Effect of supplementation of flour with fruit fiber on the volatile compound profile in bread. Sensors 2021, 21, 2812. [Google Scholar] [CrossRef]
  17. Dong, W.; Tan, L.; Zhao, J.; Hu, R.; Lu, M. Characterization of fatty acid, amino acid and volatile compound compositions and bioactive components of seven coffee (coffea robusta) cultivars grown in Hainan province, China. Molecules 2015, 20, 16687–16708. [Google Scholar] [CrossRef]
  18. Ma, G.M.; Wang, Y.; Qin, W.Q.; Zhou, H.Y.; Yan, C.; Jiang, J.; Ju, Y. Optical sensors for power transformer monitoring: A review. High Volt. 2021, 6, 367–386. [Google Scholar] [CrossRef]
  19. Hussain, K.; Karmakar, S. Incipient fault diagnosis of power transformers using optical spectro-photometric technique. Int. Soc. Opt. Photonics 2015, 9654, 96540R. [Google Scholar]
  20. Mariprasath, T.; Kirubakaran, V.; Madichetty, S.; Amaresh, K. An experimental study on spectroscopic analysis of alternating liquid dielectrics for transformer. Electr. Eng. 2021, 103, 921–929. [Google Scholar] [CrossRef]
  21. Zou, J.; Chen, W.; Fu, W.; Zhou, F.; Du, L. Raman spectral characteristics of oil-paper insulation and its application to ageing stage assessment of oil-immersed transformers. Energies 2016, 9, 946. [Google Scholar] [CrossRef] [Green Version]
  22. Bakar, N.A.; Abu-Siada, A. A new method to detect dissolved gases in transformer oil using nir-ir spectroscopy. IEEE Trans. Dielectr. Electr. Insul. 2017, 24, 409–419. [Google Scholar] [CrossRef]
  23. Mao, X.; Zhou, X.; Gong, Z.; Yu, Q. An all-optical photoacoustic spectrometer for multi-gas analysis. Sens. Actuators B Chem. 2016, 232, 251–256. [Google Scholar] [CrossRef]
  24. So, S.; Jeong, N.; Song, A.; Hwang, J.; Lee, C. Measurement of temperature and H2O concentration in premixed ch4/air flame using two partially overlapped H2O absorption signals in the near infrared region. Appl. Sci. 2021, 11, 3701. [Google Scholar] [CrossRef]
  25. Sepman, A.; Fredirksson, C.; Ogren, Y. Laser-Based, Optical, and Traditional Diagnostics of NO and Temperature in 400kW Pilot-Scale Furnace. Appl. Sci. 2021, 11, 7048. [Google Scholar] [CrossRef]
  26. Ma, G.-M.; Zhao, S.-J.; Jiang, J.; Song, H.-T.; Li, C.-R.; Luo, Y.-T.; Wu, H. Tracing Acetylene Dissolved in Transformer Oil by Tunable Diode Laser Absorption Spectrum. Sci. Rep. 2017, 7, 14961. [Google Scholar] [CrossRef] [PubMed] [Green Version]
  27. Jiang, J.; Zhao, M.; Ma, G.-M.; Song, H.-T.; Li, C.-R.; Han, X.; Zhang, C. TDLAS-Based Detection of Dissolved Methane in Power Transformer Oil and Field Application. IEEE Sens. J. 2018, 18, 2318–2325. [Google Scholar] [CrossRef]
  28. Tian, X.; Cao, Y.; Chen, J.; Liu, K.; Wang, G.; Tan, T.; Mei, J.; Chen, Y.; Gao, X. Dual-gas sensor of CH4/C2H6 based on wavelength modulation spectroscopy coupled to a home-made compact dense-pattern multipass cell. Sensors 2019, 19, 820. [Google Scholar] [CrossRef] [Green Version]
  29. Jiang, J.; Wang, Z.; Han, X.; Zhang, C.; Ma, G.; Li, C.; Luo, Y. Multi-gas detection in power transformer oil based on tunable diode laser absorption spectrum. IEEE Trans. Dielectr. Electr. Insul. 2019, 26, 153–161. [Google Scholar] [CrossRef]
  30. VPL Molecular Spectroscopic Database. Available online: http://vpl.astro.washington.edu/spectra/frontpage.htm (accessed on 15 October 2021).
  31. Rusinek, R.; Kmiecik, D.; Gawrysiak-Witulska, M.; Malaga-Tobola, U.; Gancarz, M. Identification of the olfactory profile of rapeseed oil as a function of heating time and ratio of volume and surface area of contact with oxygen using an electronic nose. Sensors 2021, 21, 303. [Google Scholar] [CrossRef]
  32. Wang, Y.; Ma, G.; Zheng, D.; Liao, W.; Qin, W. Detection of dissolved acetylene in power transformer oil based on photonic crystal fiber. IEEE Sens. J. 2020, 20, 10981–10988. [Google Scholar] [CrossRef]
  33. James, D.; Zachary, D.; Tomasz, P. Diagnostic simplexes for Dissolved-gas analysis. Energies 2020, 13, 6459. [Google Scholar]
  34. Gouda, O.E.; El-Hoshy, S.H.; L-Tamaly, H. Condition assessment of power transformers based on dissolved gas analysis. IET Gener. Transm. Distrib. 2019, 13, 2299–2310. [Google Scholar] [CrossRef]
  35. Ding, N.; Wang, C.; Mu, H.; Zhan, J.; Yao, H.; Jin, L.; Qian, P.; Li, C.; Zhang, G. The insulation characteristics of optical fiber in transformer oil under long-term thermal aging. In Proceedings of the International Conference on Electrical Materials and Power Equipment (ICEMPE), Chongqing, China, 11–15 April 2020. [Google Scholar]
  36. Syafruddin, H.; Nugroho, H.P. Dissolved Gas Analysis (DGA) for Diagnosis of Fault in Oil-Immersed Power Transformers: A case study. In Proceedings of the 2020 4rd International Conference on Electrical, Telecommunication and Computer Engineering (ELTICOM), Medan, Indonesia, 3–4 September 2020. [Google Scholar]
Figure 1. Model of dissolution equilibrium.
Applsci 11 12149 g001
Figure 2. Schematic diagram of degassing time.
Applsci 11 12149 g002
Figure 3. Schematic diagram of laser absorption spectrum detection.
Applsci 11 12149 g003
Figure 4. Process of TDLAS gas detection: (a) Original signal; (b) absorption signal; (c) second harmonic.
Applsci 11 12149 g004
Figure 5. The definition of the second harmonic amplitude.
Applsci 11 12149 g005
Figure 6. The schematic diagram of the setup.
Applsci 11 12149 g006
Figure 7. Structure of the degassing chamber.
Applsci 11 12149 g007
Figure 8. TDLAS measurement system of wavelength modulation.
Applsci 11 12149 g008
Figure 9. Absorption lines of four target gases (CO, CO2, CH4, C2H4) in 5800–6600 cm−1.
Applsci 11 12149 g009
Figure 10. Structure diagram of the gas detection system.
Applsci 11 12149 g010
Figure 11. Second harmonics of different concentrations of six target gases: (a) CH4; (b) C2H4; (c) C2H6; (d) C2H2; (e) CO; (f) CO2.
Applsci 11 12149 g011
Figure 12. The fitting curves of the second harmonic amplitudes of six target gases and the corresponding concentrations: (a) CH4; (b) C2H4; (c) C2H6; (d) C2H2; (e) CO; (f) CO2.
Applsci 11 12149 g012
Figure 13. Measured results of the TDLAS system: (a) CH4; (b) C2H4; (c) C2H6; (d) C2H2; (e) CO; (f) CO2.
Applsci 11 12149 g013
Figure 14. Experimental setup.
Applsci 11 12149 g014
Figure 15. Dynamic equilibrium time: (a) CH4; (b) C2H4; (c) C2H6; (d)C2H2; (e) CO; (f) CO2.
Applsci 11 12149 g015aApplsci 11 12149 g015b
Figure 16. The results of Duval triangle.
Applsci 11 12149 g016
Table 1. Main parameters of the degassing chamber.
Main ParametersSpecifications
Chamber volume1300 mL
Operating temperature50 °C
Operating pressure28 kPa
Stirring speed72 r/min
Oil sample volume650 mL
Table 2. The center wavelength of laser devices output.
DFB LASER
Devices
Operating
Temperature (°C)
Output Center
Wavelength (nm)
Type of Detected Gas
1579 nm laser29.61579.74CO
27.91579.57CO2
1684 nm laser171684.04CH4
9.41683.1C2H6
12.91683.35C2H4
1532 nm laser21.31532.83C2H2
Table 3. Data of the TDLAS system and the reference device.
TESTS CO ( μ L / L ) CO 2
( μ L / L )
CH 4
( μ L / L )
C 2 H 6
( μ L / L )
C 2 H 4
( μ L / L )
C 2 H 2
( μ L / L )
Average data of TDLAS9.21765.268.4613.2852.481.09
Reference data of GC7.54778.738.4111.3249.321.00
Error value1.6713.470.051.963.160.09
Table 4. Comparison result of experimental setup measurement data and standard oil sample.
Oil Sample NumberType of Gas Measurement   Result   ( μ L / L ) Standard
Value   ( μ L / L )
Error Value
( μ L / L   or   % )
1CO12.115.53.4
CO2735.6711.53.4%
CH411.912.70.8
C2H437.836.21.6
C2H688.791.12.4
C2H29.610.81.2
2CO236.7234.22.5
CO21127.31263.110.8%
CH467.970.22.3
C2H493.291.41.8
C2H6159.7161.21.5
C2H253.154.51.4
3CO3906.13755.64.0%
CO211,920.310,510.313.4%
CH4841.9851.21.1%
C2H4793.7780.21.7%
C2H6803.2823.72.6%
C2H2821.8811.41.3%
Table 5. The value of THC and CO2/CO.
Oil 1Oil 2Oil 3
MeasurementStandardMeasurementStandardMeasurementStandard
CH4 ( μ L / L ) 11.912.767.970.2841.9851.2
C2H4 ( μ L / L ) 37.836.293.291.4793.7780.2
C2H6 ( μ L / L ) 88.791.1159.7161.2803.2823.7
C2H2 ( μ L / L ) 9.610.853.154.5821.8811.4
THC ( μ L / L ) 148150.8373.9377.33260.63266.5
CO ( μ L / L ) 12.115.5236.7234.23906.13755.6
CO2 ( μ L / L ) 735.6711.51127.31263.111,920.310,510.3
CO2/CO60.845.94.85.43.12.8
Table 6. Transformer status result.
Oil SampleTransformer Status
1Warning;
Mix of thermal and electrical fault;
Low temperature degradation of solid insulating materials
2Malfunction;
Arc discharge;
Normal aging of solid insulating materials
3Malfunction;
Arc discharge;
Deterioration of solid insulating materials
Publisher’s Note: MDPI stays neutral with regard to jurisdictional claims in published maps and institutional affiliations.

