
Detection of Pitt–Hopkins Syndrome Based on Morphological Facial Features

 , , and
Abstract
:1. Introduction
2. Materials and Methods
2.1. Database
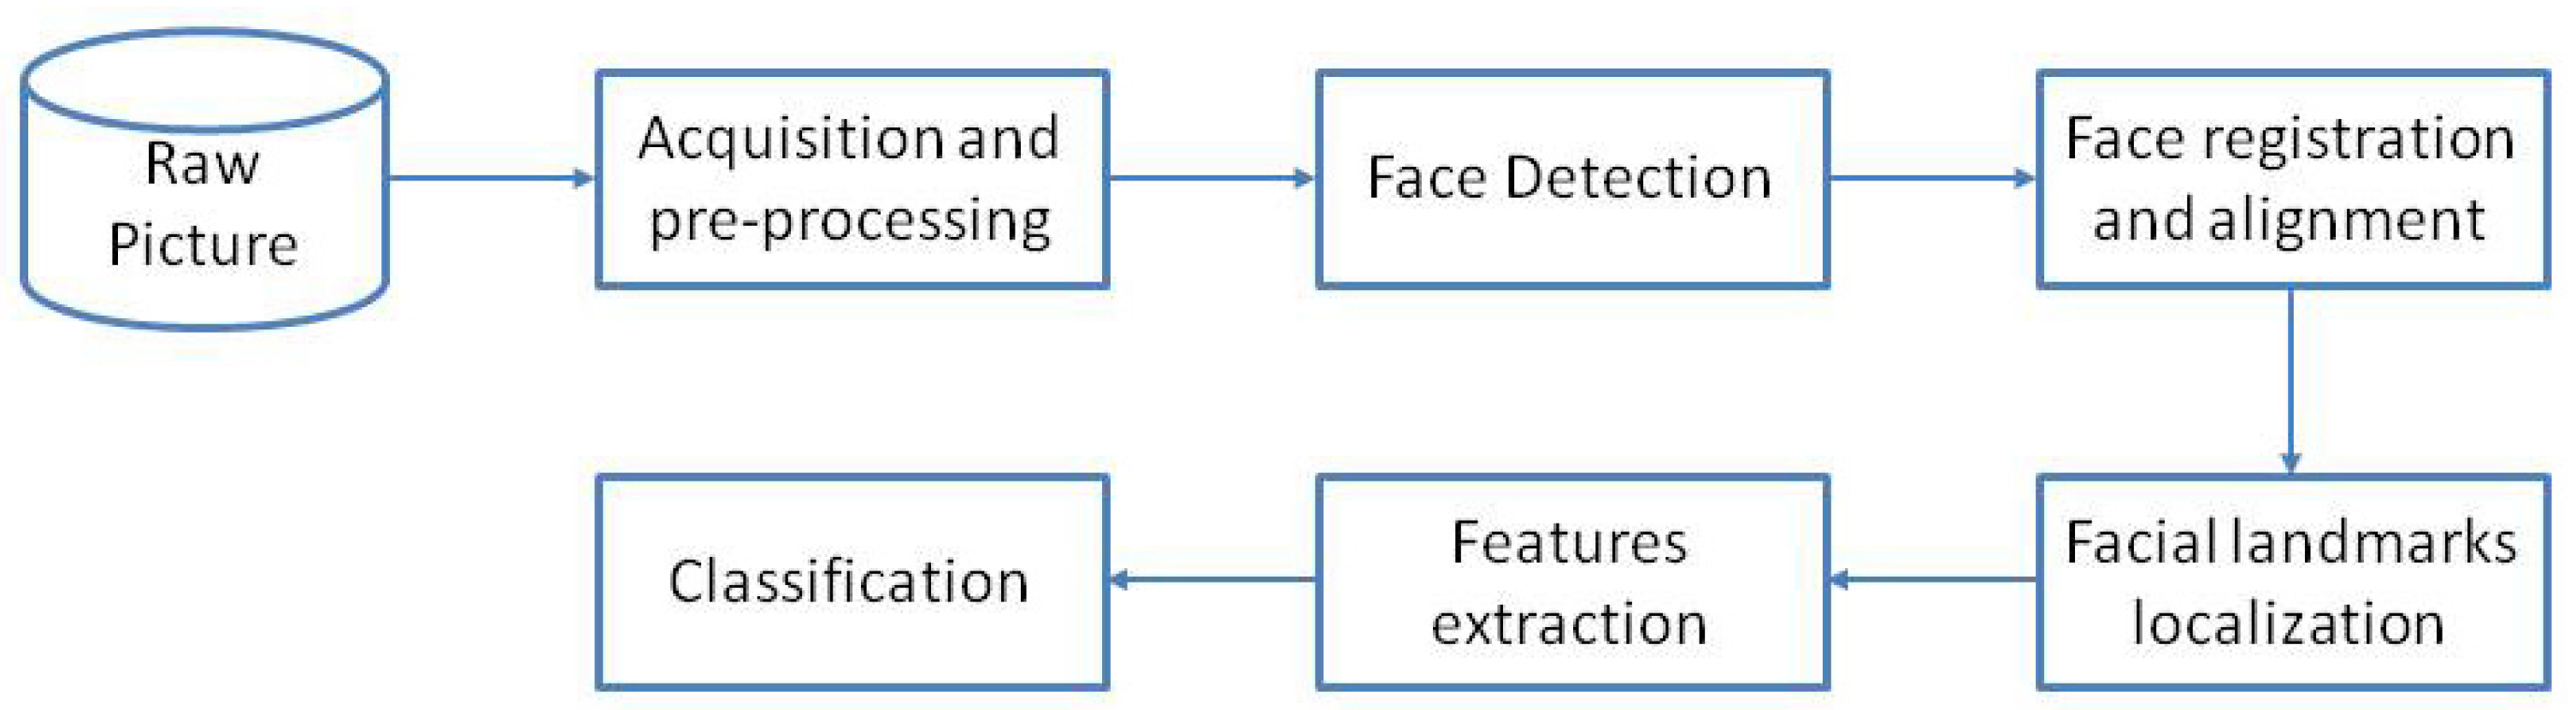
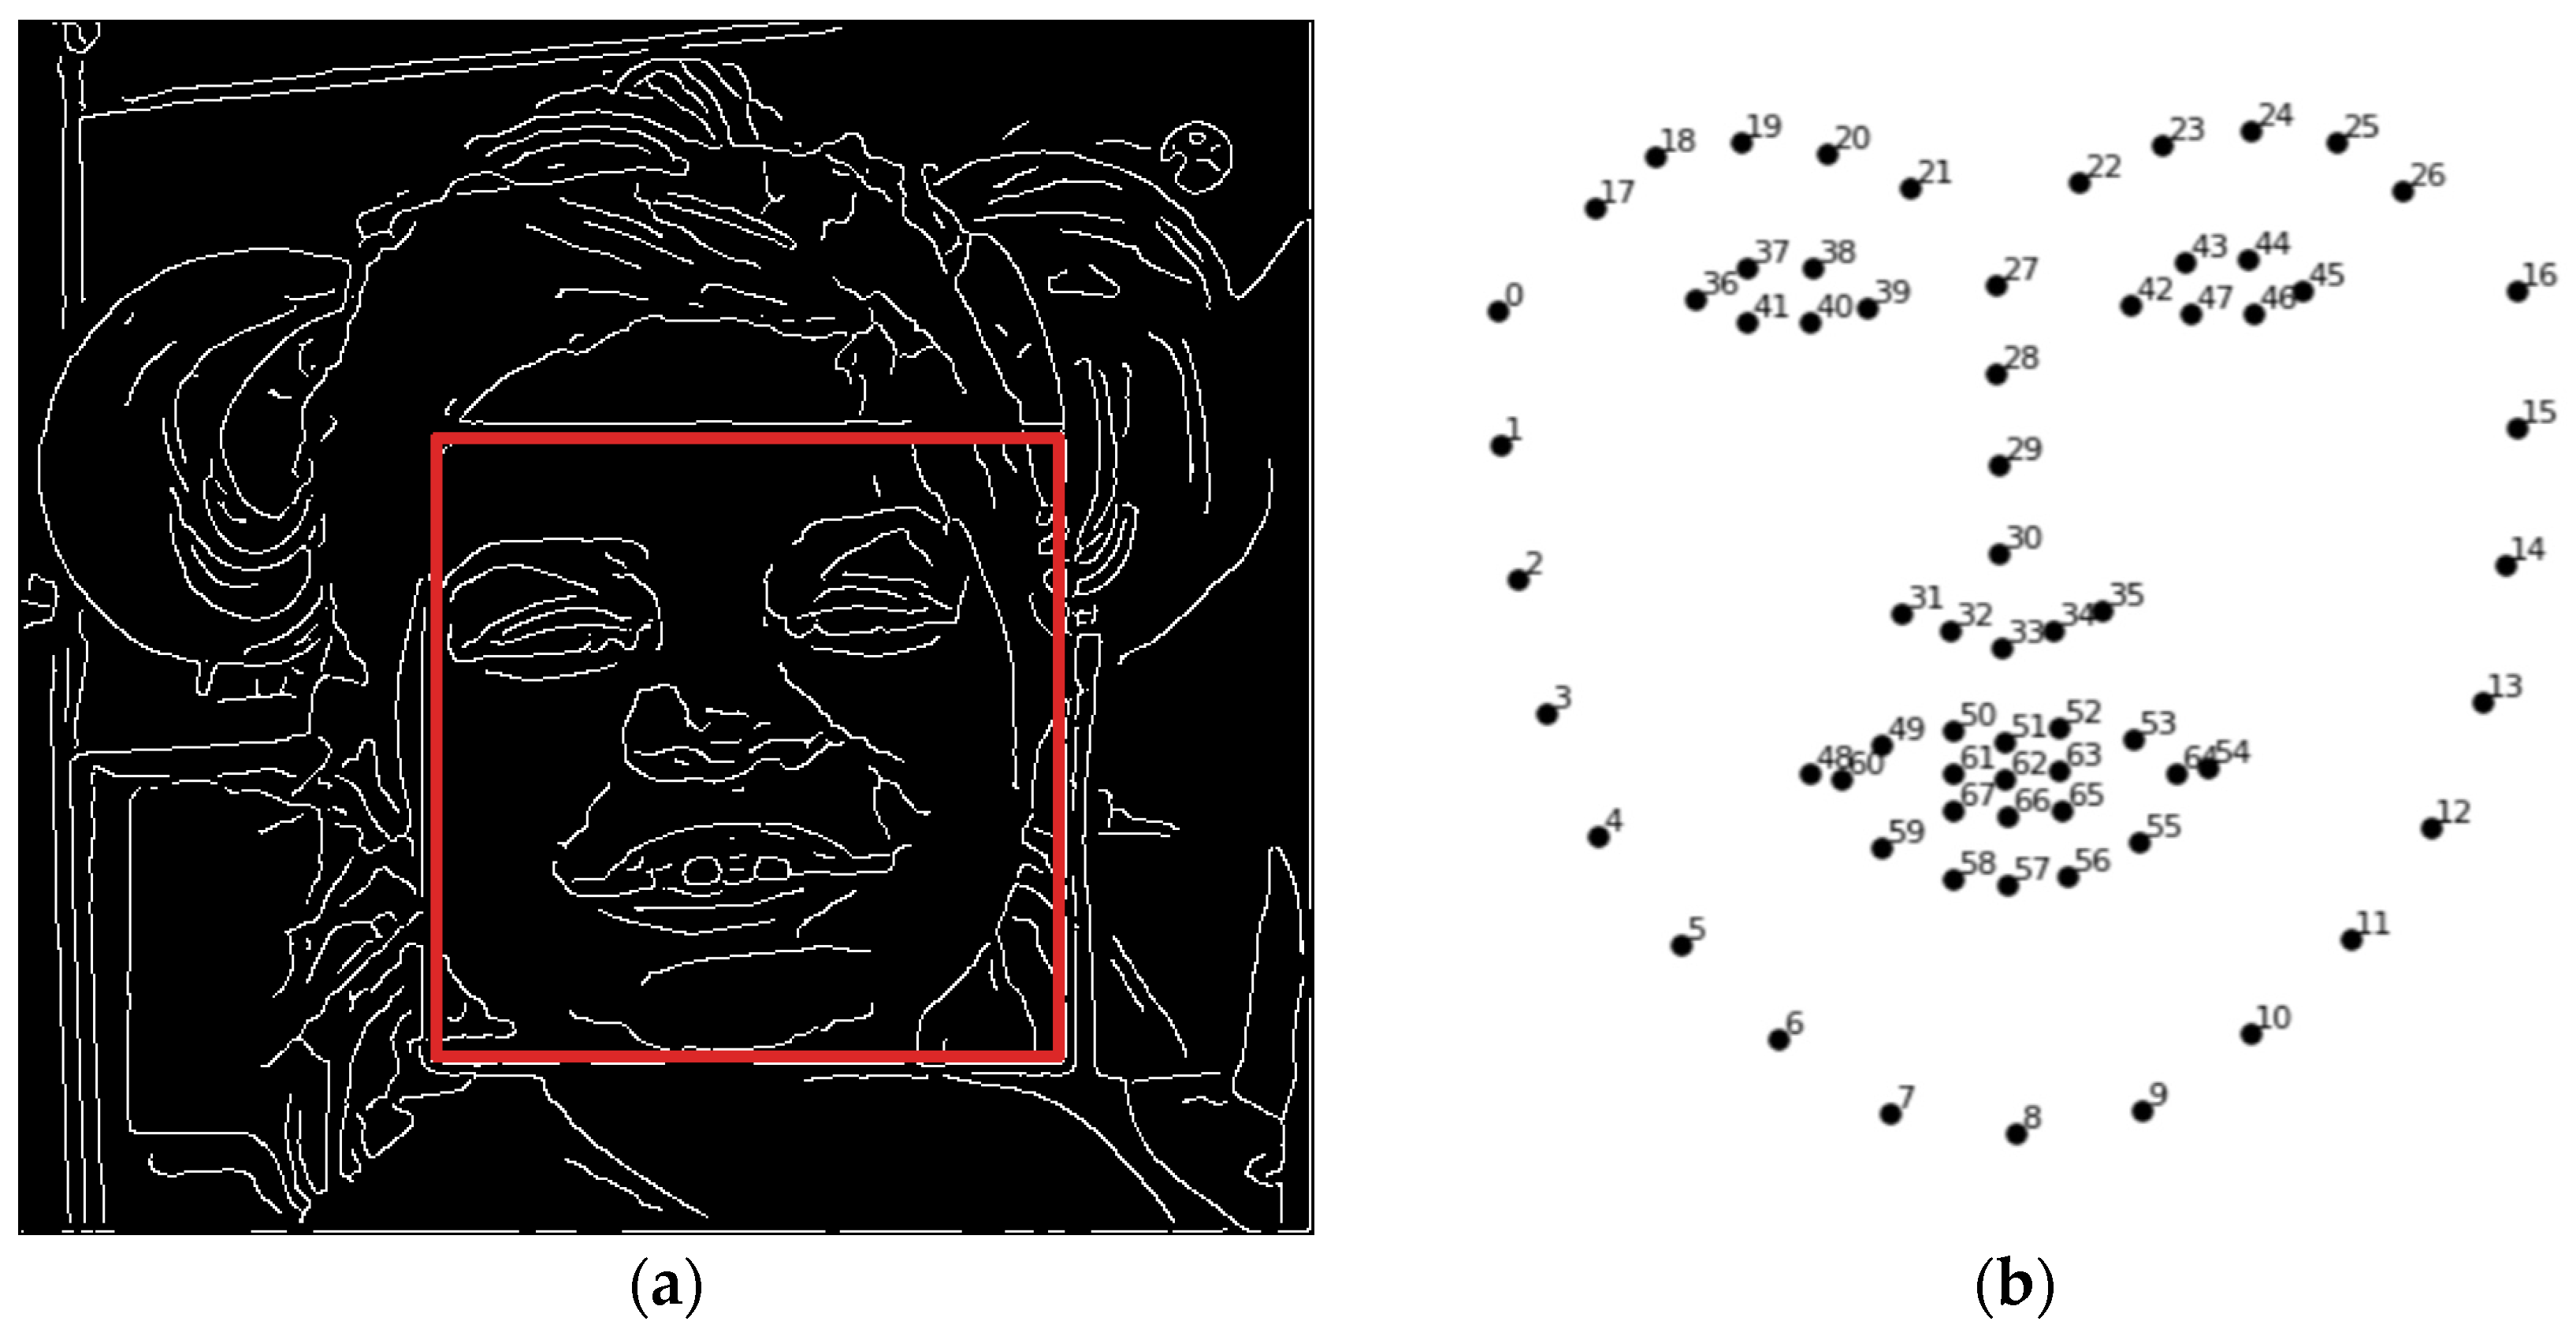
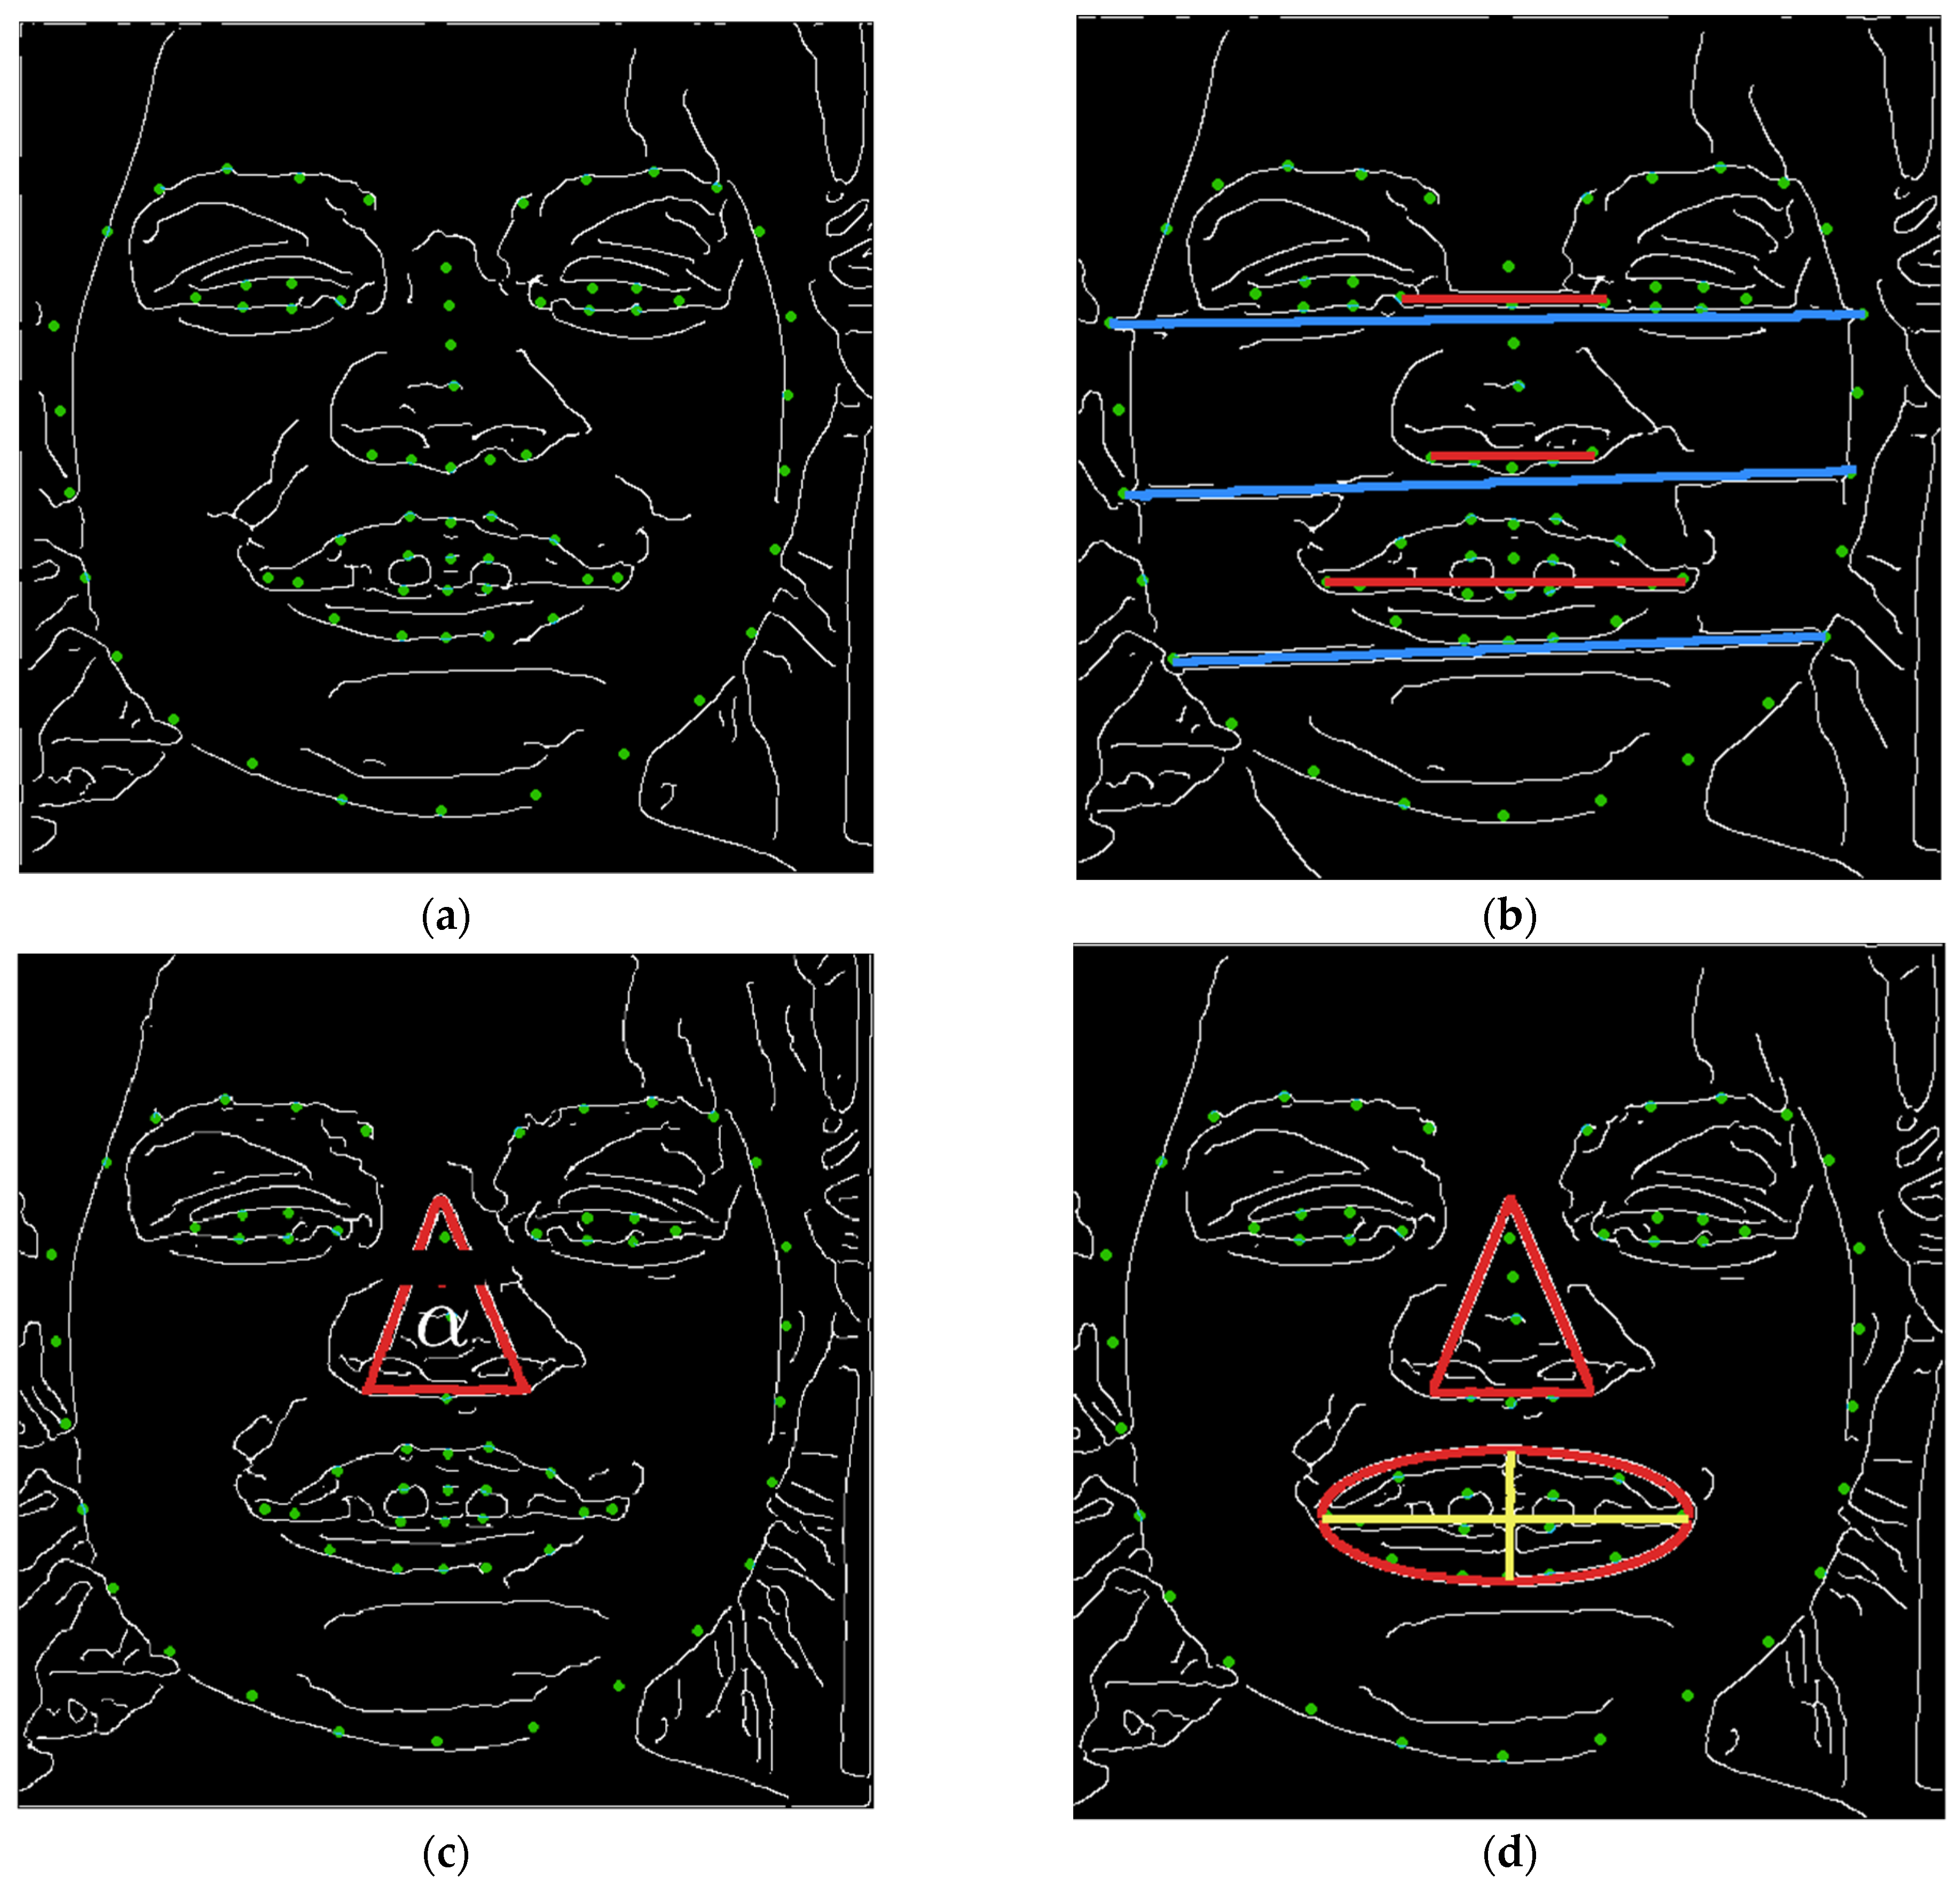
2.2. Methodology
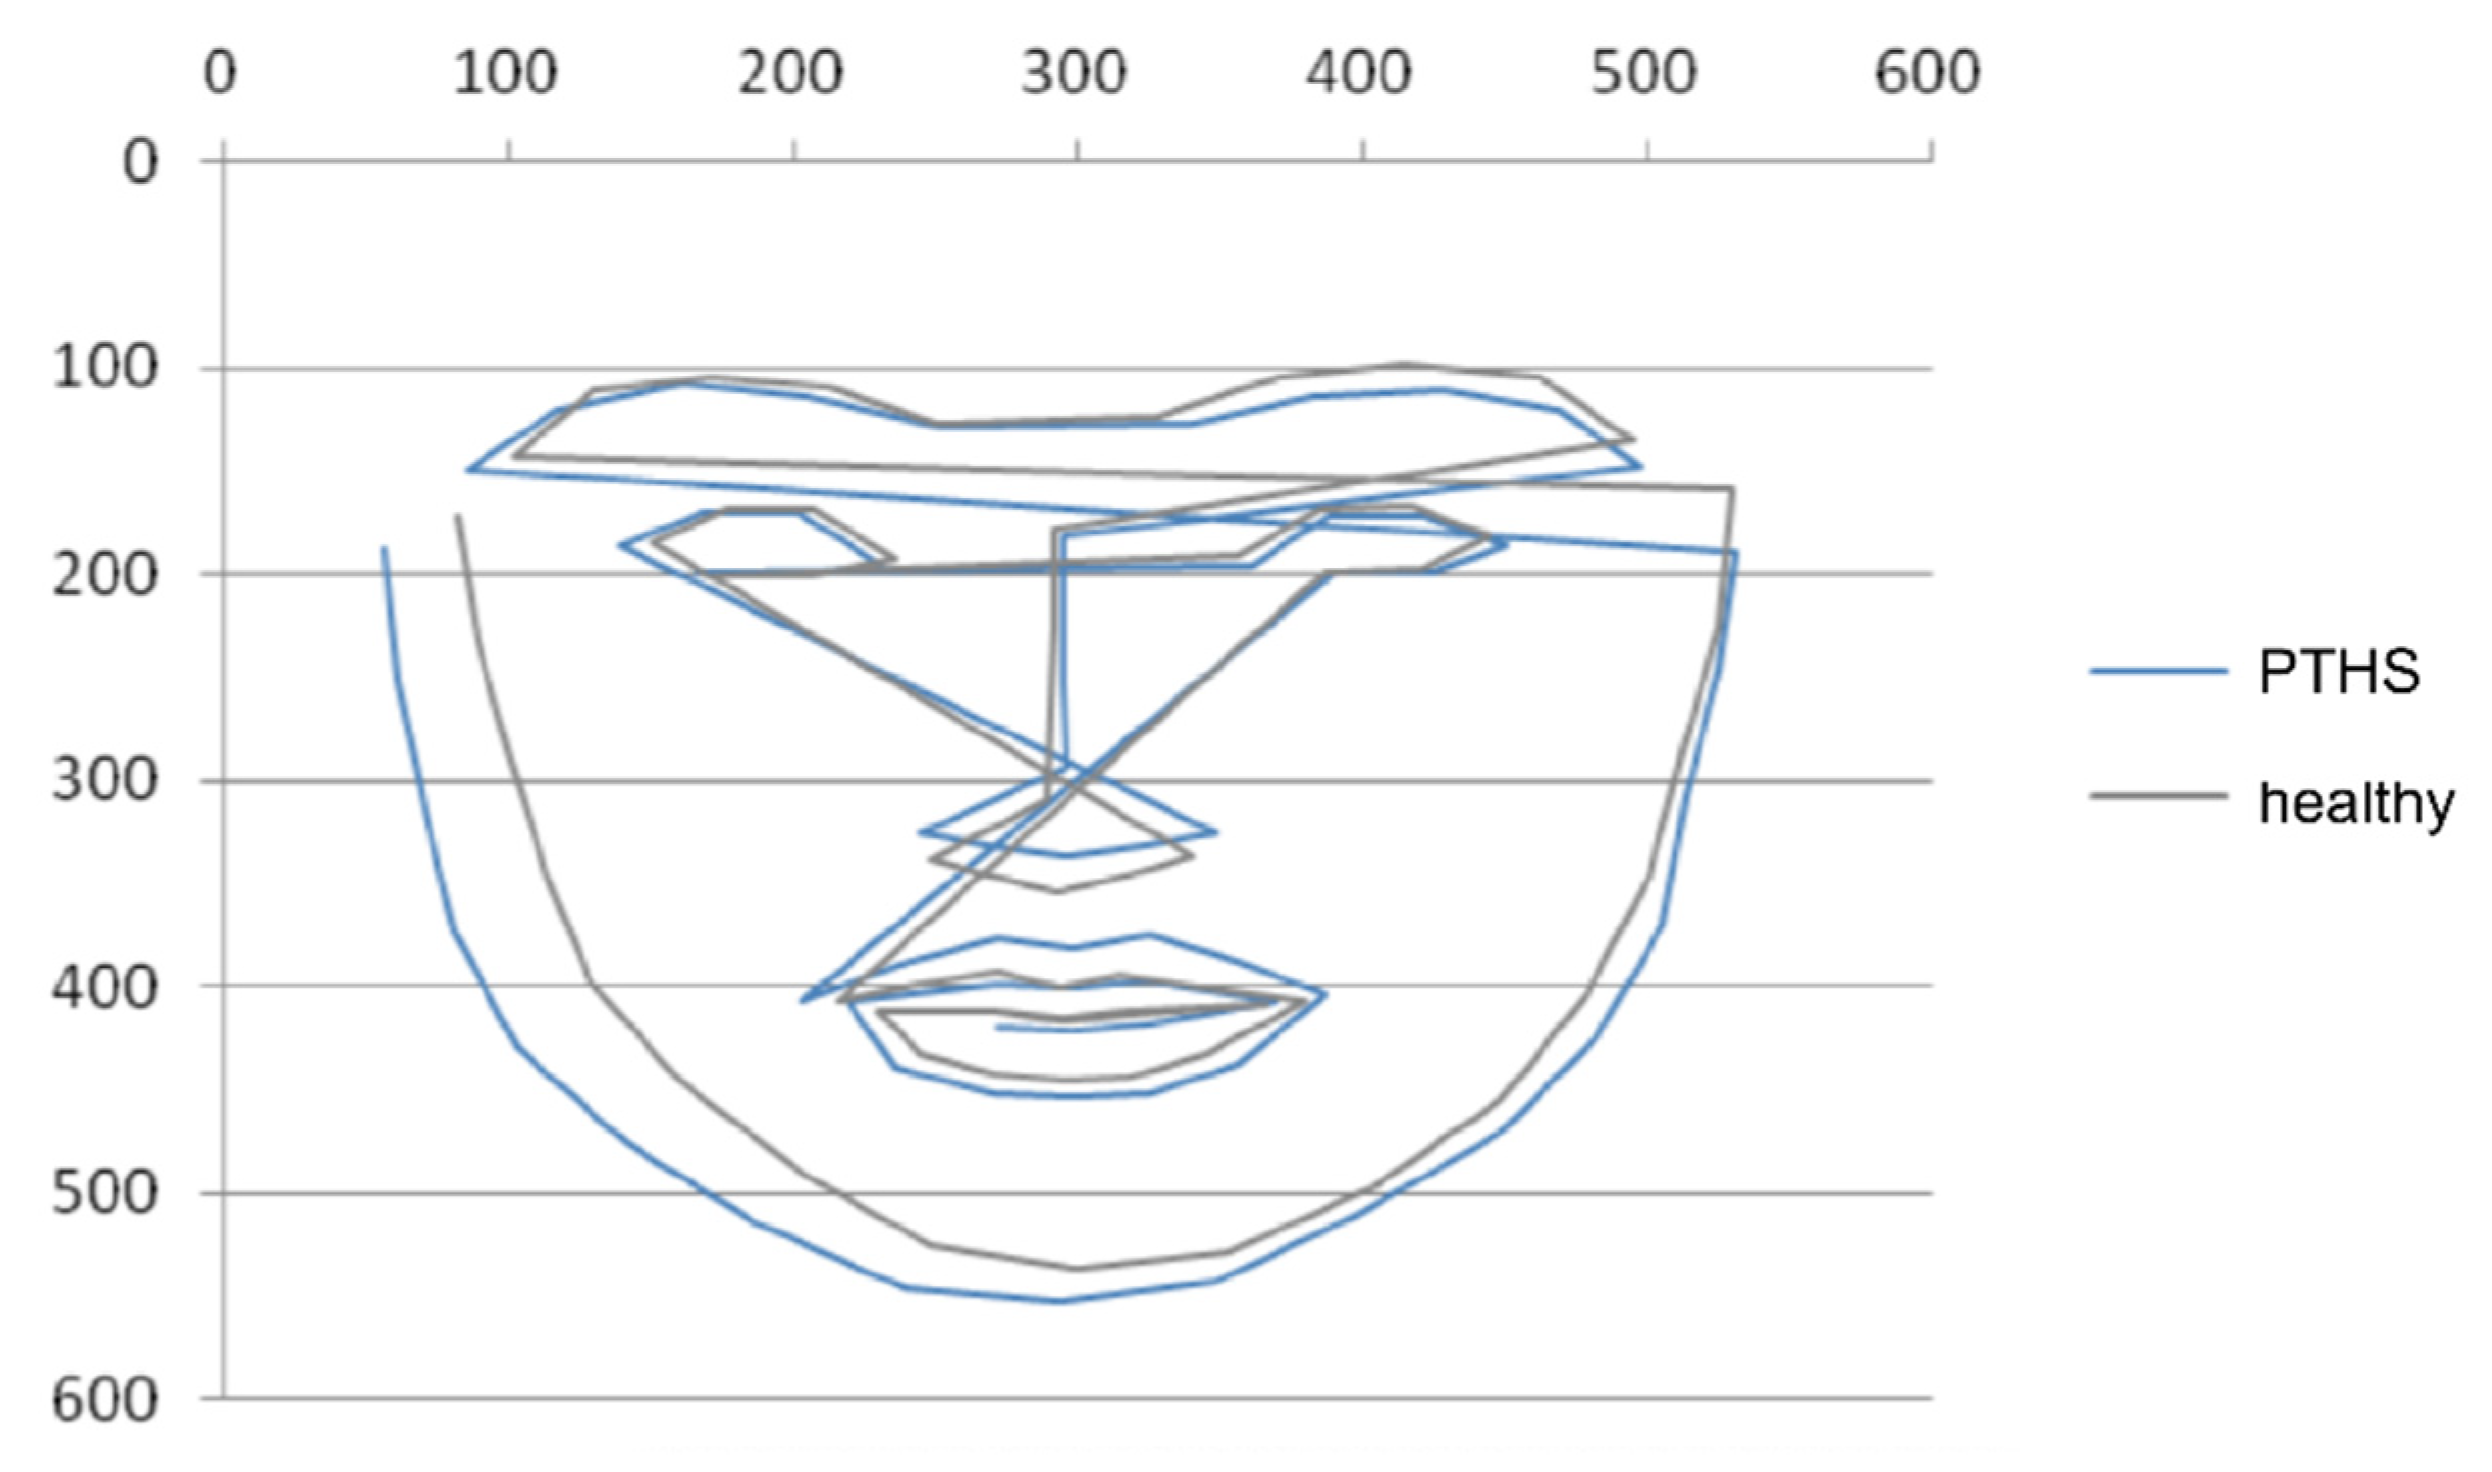
2.3. Statistical Analysis
3. Results
4. Discussion
5. Conclusions
Author Contributions
Funding
Institutional Review Board Statement
Informed Consent Statement
Data Availability Statement
Conflicts of Interest
References
- Zollino, M.; Zweier, C.; Van Balkom, I.D.; Sweetser, D.A.; Alaimo, J.; Bijlsma, E.K.; Cody, J.; Elsea, S.H.; Giurgea, I.; Macchiaiolo, M.; et al. Diagnosis and management in Pitt-Hopkins syndrome: First international consensus statement. Clin. Genet. 2019, 95, 462–478. [Google Scholar] [CrossRef] [PubMed]
- Goodspeed, K.; Newsom, C.; Morris, M.A.; Powell, C.; Evans, P.; Golla, S. Pitt-Hopkins Syndrome: A Review of Current Literature, Clinical Approach, and 23-Patient Case Series. J. Child. Neurol. 2018, 33, 233–244. [Google Scholar] [CrossRef] [PubMed]
- Pitt, D.; Hopkins, I. A Syndrome of Mental Retardation, Wide Mouth and Intermittent Overbreathing. Aust. Paediatr. J. 1978, 14, 182–184. [Google Scholar] [CrossRef]
- Peippo, M.; Ignatius, J. Pitt-Hopkins Syndrome. Mol. Syndromol. 2012, 2, 171–180. [Google Scholar] [CrossRef]
- Amiel, J.; Rio, M.; de Pontual, L.; Redon, R.; Malan, V.; Boddaert, N.; Plouin, P.; Carter, N.P.; Lyonnet, S.; Munnich, A.; et al. Mutations in TCF4, Encoding a Class I Basic Helix-Loop-Helix Transcription Factor, Are Responsible for Pitt-Hopkins Syndrome, a Severe Epileptic Encephalopathy Associated with Autonomic Dysfunction. Am. J. Hum. Genet. 2007, 80, 988–993. [Google Scholar] [CrossRef] [Green Version]
- Brockschmidt, A.; Todt, U.; Ryu, S.; Hoischen, A.; Landwehr, C.; Birnbaum, S.; Frenck, W.; Radlwimmer, B.; Lichter, P.; Engels, H.; et al. Severe Mental Retardation with Breathing Abnormalities (Pitt-Hopkins Syndrome) Is Caused by Haploinsufficiency of the Neuronal BHLH Transcription Factor TCF4. Hum. Mol. Genet. 2007, 16, 1488–1494. [Google Scholar] [CrossRef] [PubMed] [Green Version]
- de Winter, C.F.; Baas, M.; Bijlsma, E.K.; van Heukelingen, J.; Routledge, S.; Hennekam, R.C.M. Phenotype and Natural History in 101 Individuals with Pitt-Hopkins Syndrome through an Internet Questionnaire System. Orphanet J. Rare Dis. 2016, 11, 37. [Google Scholar] [CrossRef] [PubMed] [Green Version]
- Whalen, S.; Héron, D.; Gaillon, T.; Moldovan, O.; Rossi, M.; Devillard, F.; Giuliano, F.; Soares, G.; Mathieu-Dramard, M.; Afenjar, A.; et al. Novel Comprehensive Diagnostic Strategy in Pitt–Hopkins Syndrome: Clinical Score and Further Delineation of the TCF4 Mutational Spectrum. Hum. Mutat. 2012, 33, 64–72. [Google Scholar] [CrossRef]
- Van Balkom, I.D.C.; Vuijk, P.J.; Franssens, M.; Hoek, H.W.; Hennekam, R.C.M. Development, Cognition, and Behaviour in Pitt-Hopkins Syndrome. Dev. Med. Child. Neurol. 2012, 54, 925–931. [Google Scholar] [CrossRef] [Green Version]
- Sweetser, D.A.; Elsharkawi, I.; Yonker, L.; Steeves, M.; Parkin, K.; Thibert, R. Pitt-Hopkins Syndrome. In GeneReviews®; Adam, M.P., Ardinger, H.H., Pagon, R.A., Wallace, S.E., Bean, L.J., Mirzaa, G., Amemiya, A., Eds.; University of Washington: Seattle, WA, USA, 1993. [Google Scholar]
- Kuru, K.; Niranjan, M.; Tunca, Y.; Osvank, E.; Azim, T. Biomedical Visual Data Analysis to Build an Intelligent Diagnostic Decision Support System in Medical Genetics. Artif. Intell. Med. 2014, 62, 105–118. [Google Scholar] [CrossRef]
- Samal, A.; Iyengar, P.A. Automatic Recognition and Analysis of Human Faces and Facial Expressions: A Survey. Pattern Recognit. 1992, 25, 65–77. [Google Scholar] [CrossRef]
- Schroff, F.; Kalenichenko, D.; Philbin, J. FaceNet: A Unified Embedding for Face Recognition and Clustering. In Proceedings of the 2015 IEEE Conference on Computer Vision and Pattern Recognition (CVPR), Boston, MA, USA, 7–12 June 2015; pp. 815–823. [Google Scholar]
- Farnell, D.J.J.; Galloway, J.; Zhurov, A.; Richmond, S.; Perttiniemi, P.; Katic, V. Initial Results of Multilevel Principal Components Analysis of Facial Shape. In Proceedings of the Medical Image Understanding and Analysis, Oxford, UK, 12–14 July 2021; Valdés Hernández, M., González-Castro, V., Eds.; Springer International Publishing: Cham, Switzerland, 2017; pp. 674–685. [Google Scholar]
- Gurovich, Y.; Hanani, Y.; Bar, O.; Nadav, G.; Fleischer, N.; Gelbman, D.; Basel-Salmon, L.; Krawitz, P.M.; Kamphausen, S.B.; Zenker, M.; et al. Identifying Facial Phenotypes of Genetic Disorders Using Deep Learning. Nat. Med. 2019, 25, 60–64. [Google Scholar] [CrossRef] [PubMed]
- Shu, T.; Zhang, B.; Yan Tang, Y. An Extensive Analysis of Various Texture Feature Extractors to Detect Diabetes Mellitus Using Facial Specific Regions. Comput. Biol. Med. 2017, 83, 69–83. [Google Scholar] [CrossRef]
- Zhang, B.; Vijaya kumar, B.V.K.; Zhang, D. Noninvasive Diabetes Mellitus Detection Using Facial Block Color with a Sparse Representation Classifier. IEEE Trans. Biomed. Eng. 2014, 61, 1027–1033. [Google Scholar] [CrossRef] [PubMed]
- Wang, X.; Zhang, B.; Guo, Z.; Zhang, D. Facial Image Medical Analysis System Using Quantitative Chromatic Feature. Expert Syst. Appl. 2013, 40, 3738–3746. [Google Scholar] [CrossRef]
- Porras, A.R.; Rosenbaum, K.; Tor-Diez, C.; Summar, M.; Linguraru, M.G. Development and Evaluation of a Machine Learning-Based Point-of-Care Screening Tool for Genetic Syndromes in Children: A Multinational Retrospective Study. Lancet Digit. Health 2021, 3, e635–e643. [Google Scholar] [CrossRef]
- Meng, T.; Guo, X.; Lian, W.; Deng, K.; Gao, L.; Wang, Z.; Huang, J.; Wang, X.; Long, X.; Xing, B. Identifying Facial Features and Predicting Patients of Acromegaly Using Three-Dimensional Imaging Techniques and Machine Learning. Front. Endocrinol. 2020, 11, 492. [Google Scholar] [CrossRef]
- Silwal, R.; Alsadoon, A.; Prasad, P.W.C.; Alsadoon, O.H.; Al-Qaraghuli, A. A Novel Deep Learning System for Facial Feature Extraction by Fusing CNN and MB-LBP and Using Enhanced Loss Function. Multimed. Tools Appl. 2020, 79, 31027–31047. [Google Scholar] [CrossRef]
- Castelvecchi, D. Can We Open the Black Box of AI? Nat. News 2016, 538, 20. [Google Scholar] [CrossRef] [Green Version]
- Gaur, M.; Faldu, K.; Sheth, A. Semantics of the Black-Box: Can Knowledge Graphs Help Make Deep Learning Systems More Interpretable and Explainable? IEEE Internet Comput. 2021, 25, 51–59. [Google Scholar] [CrossRef]
- Tjoa, E.; Guan, C. A Survey on Explainable Artificial Intelligence (XAI): Toward Medical XAI. IEEE Trans. Neural Netw. Learn. Syst. 2021, 32, 4793–4813. [Google Scholar] [CrossRef]
- Samek, W.; Müller, K.-R. Towards Explainable Artificial Intelligence. In Explainable AI: Interpreting, Explaining and Visualizing Deep Learning; Samek, W., Montavon, G., Vedaldi, A., Hansen, L.K., Müller, K.-R., Eds.; Lecture Notes in Computer Science; Springer International Publishing: Cham, Switzerland, 2019; pp. 5–22. ISBN 978-3-030-28954-6. [Google Scholar]
- Holzinger, A. From Machine Learning to Explainable AI. In Proceedings of the 2018 World Symposium on Digital Intelligence for Systems and Machines (DISA), Košice, Slovakia, 23–25 August 2018; pp. 55–66. [Google Scholar]
- Ahmad, M.A.; Eckert, C.; Teredesai, A. Interpretable Machine Learning in Healthcare. In Proceedings of the 2018 ACM International Conference on Bioinformatics, Computational Biology, and Health Informatics, Association for Computing Machinery, New York, NY, USA, 15 August 2018; pp. 559–560. [Google Scholar]
- Elton, D.C. Self-Explaining AI as an Alternative to Interpretable AI. In International Conference on Artificial General Intelligence; Goertzel, B., Panov, A.I., Potapov, A., Yampolskiy, R., Eds.; Springer International Publishing: Cham, Switzerland, 2020; pp. 95–106. [Google Scholar]
- Zhang, B.; Zhao, Q.; Zhang, D. Facial Multi-Characteristics and Applications; World Scientific Publishing Company Pte Limited: Singapore, 2018. [Google Scholar]
- Kossaifi, J.; Walecki, R.; Panagakis, Y.; Shen, J.; Schmitt, M.; Ringeval, F.; Han, J.; Pandit, V.; Toisoul, A.; Schuller, B.; et al. SEWA DB: A Rich Database for Audio-Visual Emotion and Sentiment Research in the Wild. IEEE Trans. Pattern Anal. Mach. Intell. 2021, 43, 1022–1040. [Google Scholar] [CrossRef] [PubMed] [Green Version]
- Asthana, A.; Zafeiriou, S.; Tzimiropoulos, G.; Cheng, S.; Pantic, M. From Pixels to Response Maps: Discriminative Image Filtering for Face Alignment in the Wild. IEEE Trans. Pattern Anal. Mach. Intell. 2015, 37, 1312–1320. [Google Scholar] [CrossRef] [Green Version]
- King, D.E. Dlib-Ml: A Machine Learning Toolkit. J. Mach. Learn. Res. 2009, 10, 1755–1758. [Google Scholar]
- PhD, T.E.O. Guide to NumPy: 2nd Edition, 2nd ed.; CreateSpace Independent Publishing Platform: Scotts Valley, CA, USA, 2015; ISBN 978-1-5173-0007-4. [Google Scholar]
- van der Walt, S.; Schönberger, J.L.; Nunez-Iglesias, J.; Boulogne, F.; Warner, J.D.; Yager, N.; Gouillart, E.; Yu, T. Scikit-Image: Image Processing in Python. PeerJ 2014, 2, e453. [Google Scholar] [CrossRef]
- Pedregosa, F.; Varoquaux, G.; Gramfort, A.; Michel, V.; Thirion, B.; Grisel, O.; Blondel, M.; Prettenhofer, P.; Weiss, R.; Dubourg, V.; et al. Scikit-Learn: Machine Learning in Python. J. Mach. Learn. Res. 2011, 12, 2825–2830. [Google Scholar]
- Viola, P.; Jones, M.J. Robust Real-Time Face Detection. Int. J. Comput. Vis. 2004, 57, 137–154. [Google Scholar] [CrossRef]
- Dalal, N.; Triggs, B. Histograms of Oriented Gradients for Human Detection. In Proceedings of the 2005 IEEE Computer Society Conference on Computer Vision and Pattern Recognition (CVPR’05), Santa Barbara, CA, USA, 20–25 June 2005; Volume 1, pp. 886–893. [Google Scholar]
- Déniz, O.; Bueno, G.; Salido, J.; De la Torre, F. Face Recognition Using Histograms of Oriented Gradients. Pattern Recognit. Lett. 2011, 32, 1598–1603. [Google Scholar] [CrossRef]
- Cortes, C.; Vapnik, V. Support-Vector Networks. Mach. Learn. 1995, 20, 273–297. [Google Scholar] [CrossRef]
- Kazemi, V.; Sullivan, J. One Millisecond Face Alignment with an Ensemble of Regression Trees. In Proceedings of the 2014 IEEE Conference on Computer Vision and Pattern Recognition, Columbus, OH, USA, 23–28 June 2014; pp. 1867–1874. [Google Scholar]
- Breiman, L. Random Forests, Machine Learning. Mach. Learn. 2001, 45, 5–32. [Google Scholar] [CrossRef] [Green Version]
- Cover, T.M.; Hart, P.E. Nearest neighbor pattern classification. IEEE Trans. Inf. Theory 1967, 13, 21–27. [Google Scholar] [CrossRef]


| Feature | Population | N | Min | Q1 | Median | Q3 | Max | Mean | SD |
|---|---|---|---|---|---|---|---|---|---|
| R1 (Group 1) | PTHS | 32 | 3 | 3.43 | 3.68 | 3.83 | 4.41 | 3.67 | 0.25 |
| R1 (Group 2) | Control | 29 | 3 | 3.58 | 3.66 | 3.85 | 4.23 | 3.72 | 0.26 |
| R2 (Group 3) | PTHS | 32 | 4 | 4.28 | 4.45 | 4.75 | 6.23 | 4.53 | 0.47 |
| R2 (Group 4) | Control | 29 | 4 | 4.35 | 4.56 | 4.84 | 5.31 | 4.57 | 0.36 |
| R3 (Group 5) | PTHS | 32 | 2 | 1.92 | 1.97 | 2.19 | 2.76 | 2.06 | 0.26 |
| R3 (Group 6) | Control | 29 | 2 | 1.99 | 2.17 | 2.27 | 2.52 | 2.14 | 0.21 |
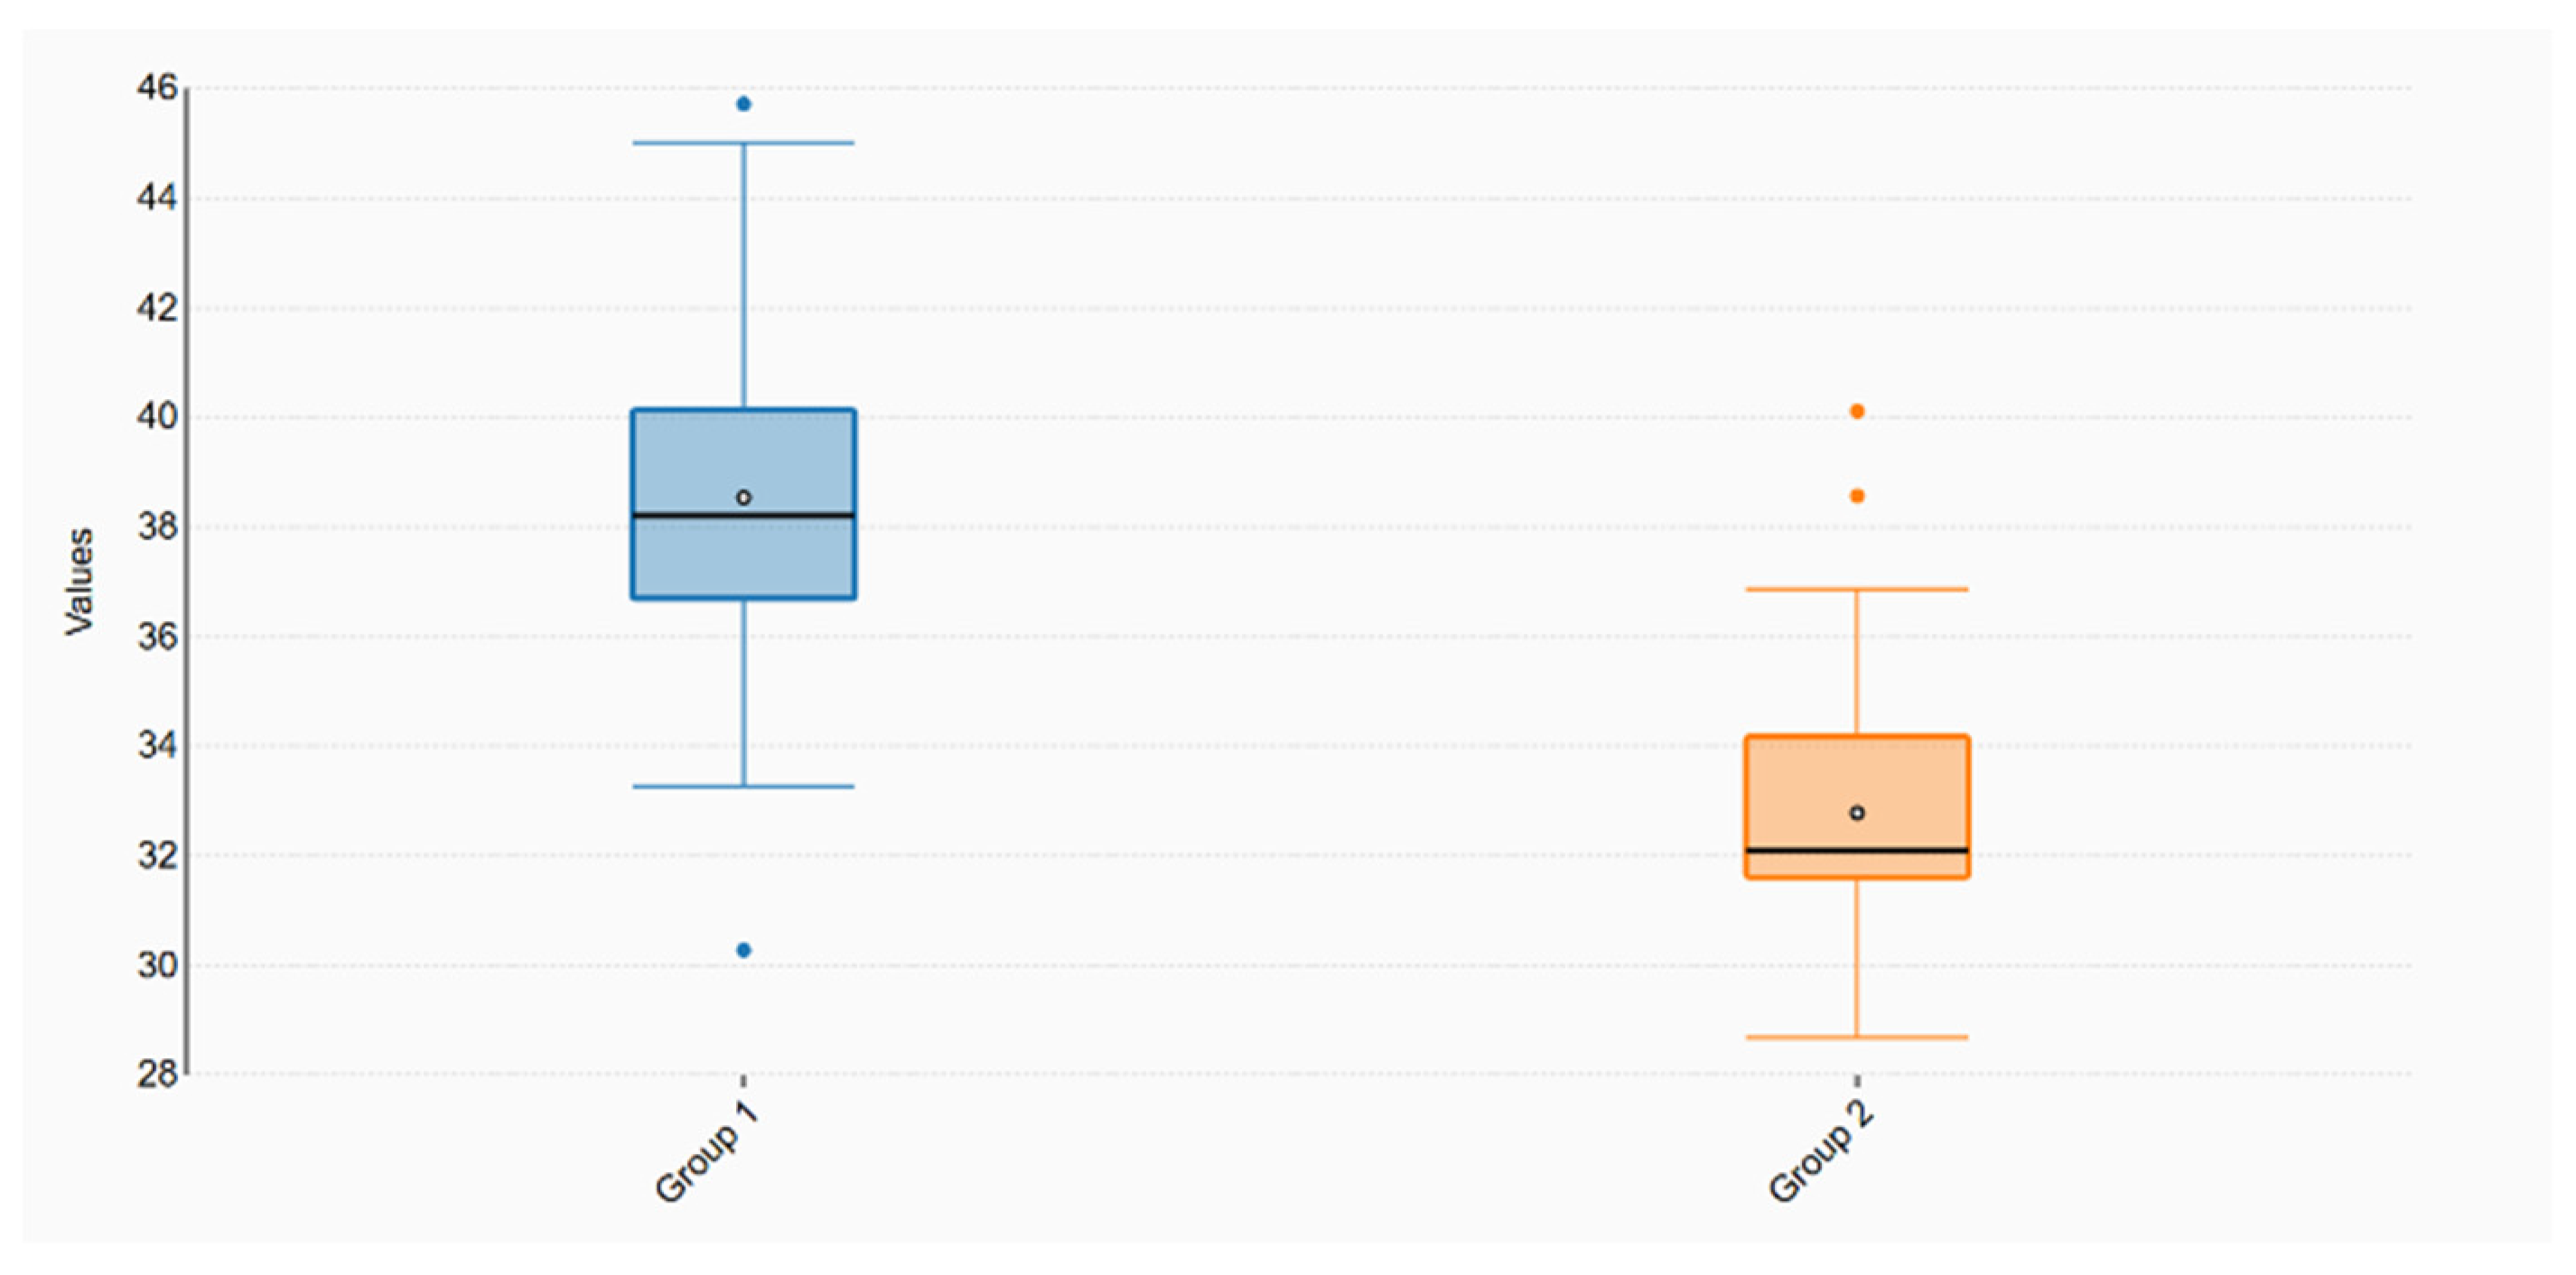
| Feature | Population | N | Min | Q1 | Median | Q3 | Max | Mean | SD |
|---|---|---|---|---|---|---|---|---|---|
| NoseAngle (Group 1) | PTHS | 32 | 30 | 36.69 | 38.20 | 40.13 | 45.72 | 38.54 | 3.33 |
| NoseAngle (Group 2) | Control | 29 | 29 | 31.61 | 32.08 | 34.17 | 40.12 | 32.78 | 2.63 |
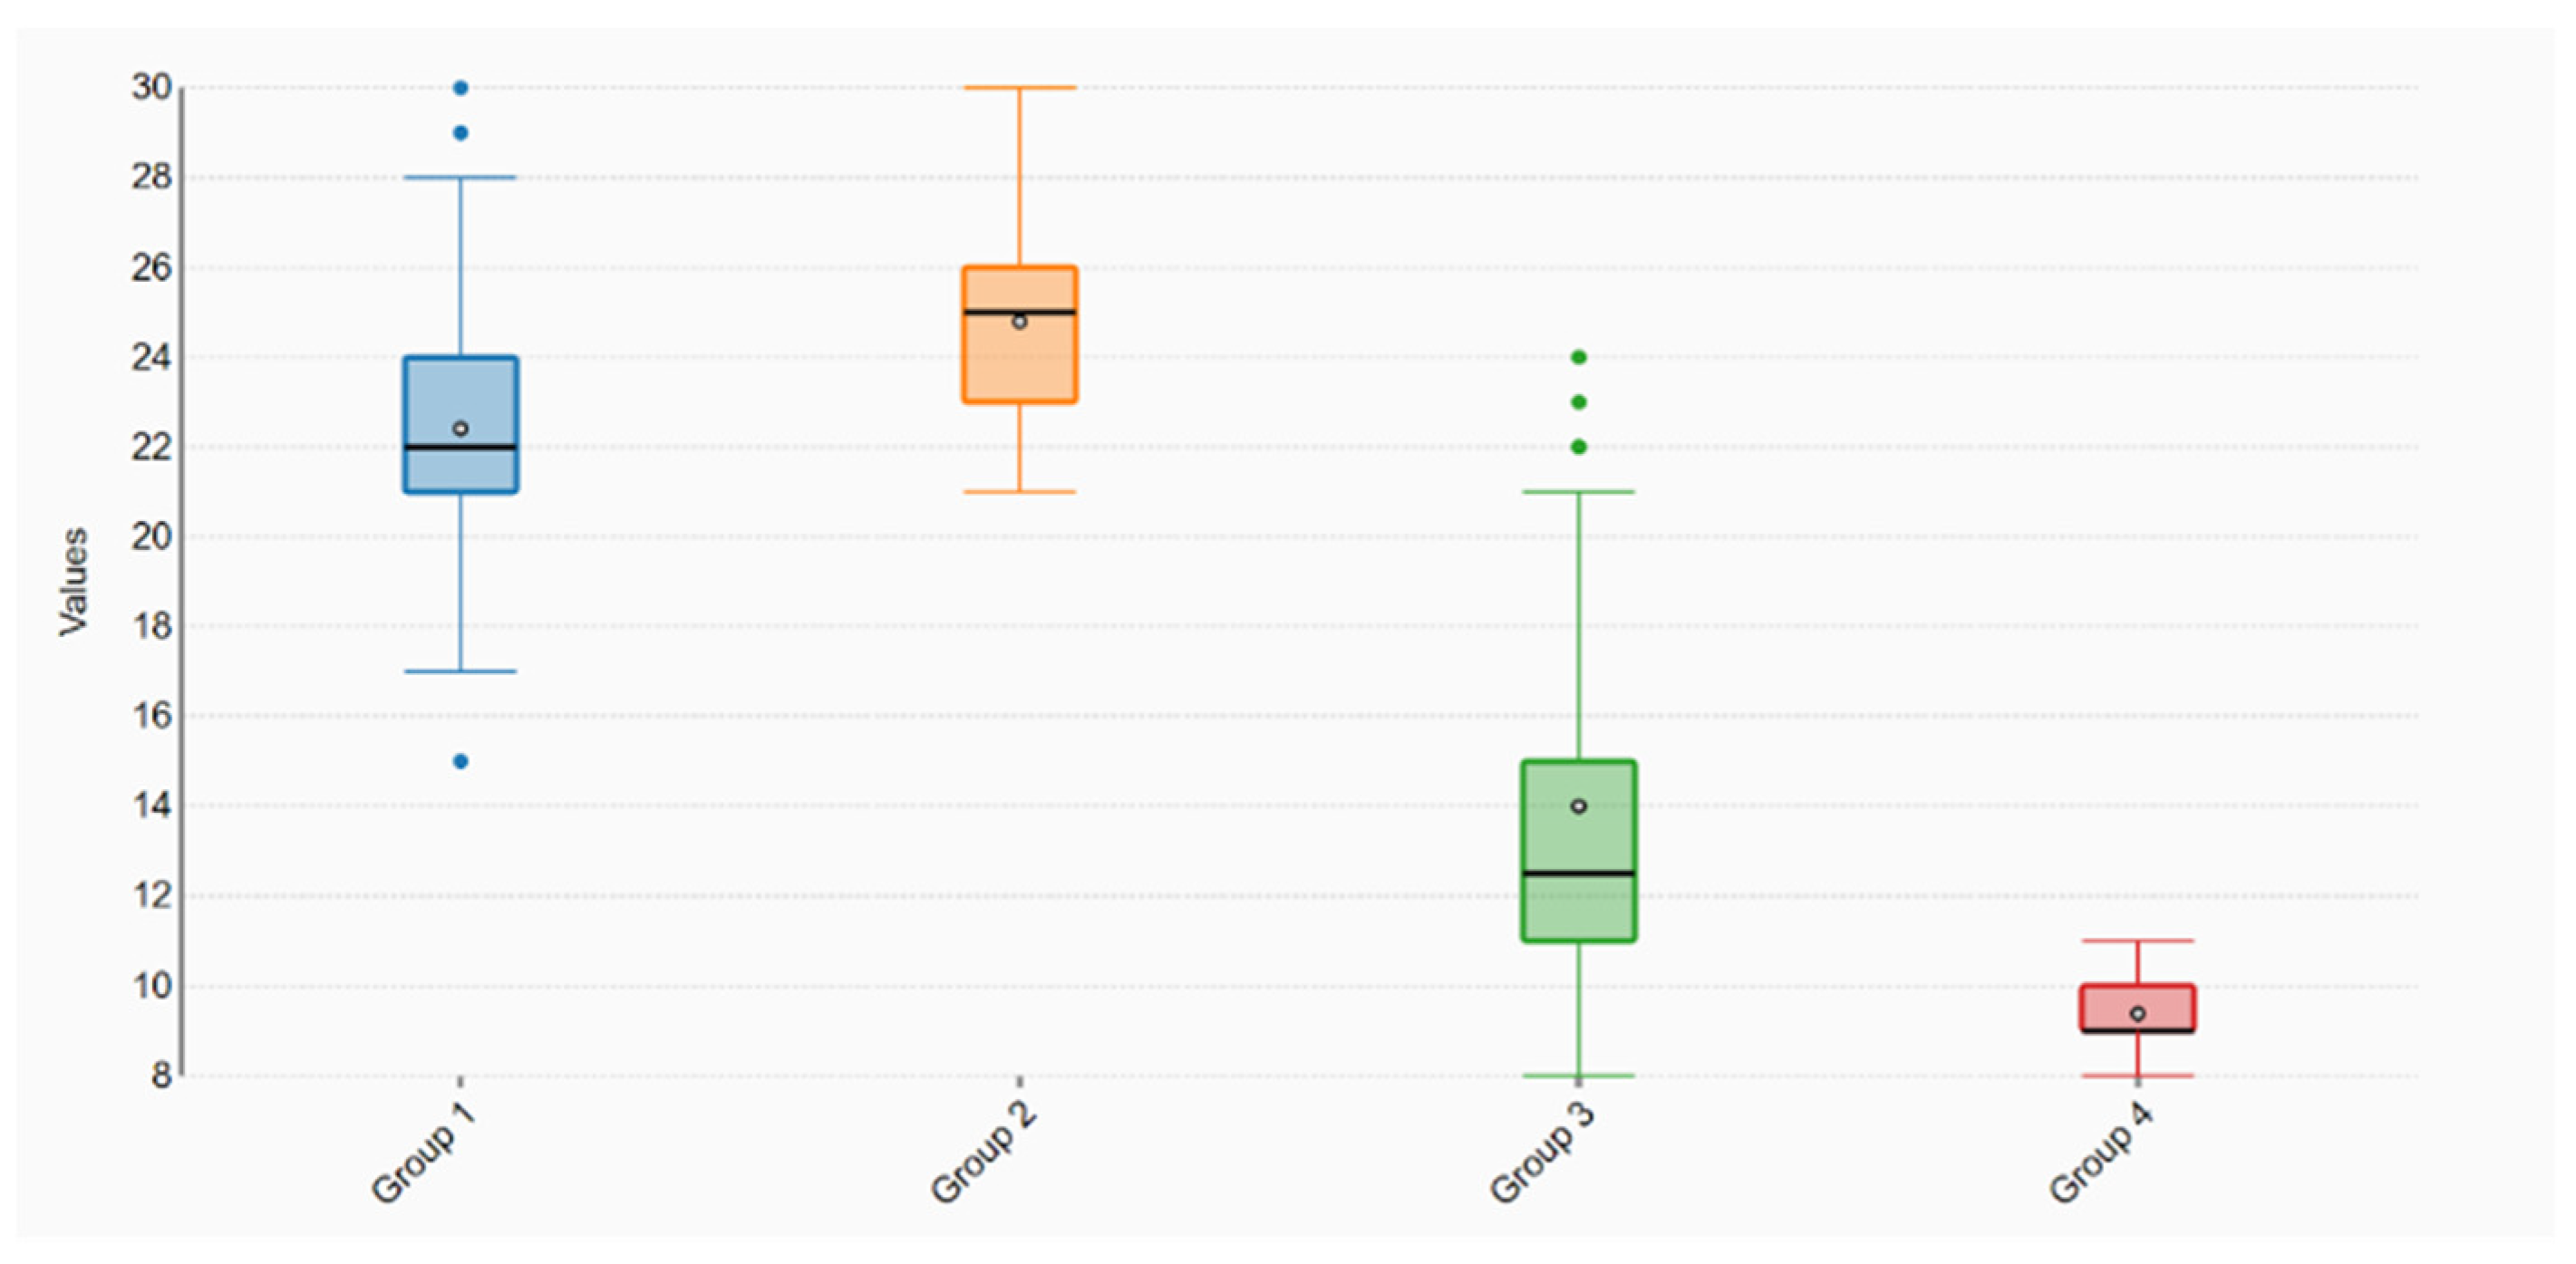
| Feature | Population | N | Min | Q1 | Median | Q3 | Max | Mean | SD |
|---|---|---|---|---|---|---|---|---|---|
| RNose (Group 1) | PTHS | 32 | 15 | 21 | 22 | 24 | 30 | 22.41 | 3.35 |
| RNose (Group 2) | Control | 29 | 21 | 23 | 25 | 26 | 30 | 24.79 | 2.13 |
| RMouth (Group 3) | PTHS | 32 | 8 | 11 | 12.5 | 15 | 24 | 14 | 4.47 |
| RMouth (Group 4) | Control | 29 | 8 | 9 | 9 | 10 | 11 | 9.38 | 0.78 |
| R1 | R2 | R3 | NoseAngle | RNose | RMouth | C | |
|---|---|---|---|---|---|---|---|
| R1 | 1.000000 | 0.631856 | 0.565448 | −0.123501 | 0.448690 | 0.234808 | −0.099263 |
| R2 | 0.631856 | 1.000000 | 0.767697 | −0.184765 | 0.758548 | 0.277656 | −0.048716 |
| R3 | 0.565448 | 0.767697 | 1.000000 | −0.131357 | 0.639932 | 0.438070 | −0.171853 |
| RNose | −0.123501 | −0.184765 | −0.131357 | 1.000000 | 0.329132 | −0.601934 | 0.708482 |
| RMouth | 0.448690 | 0.758548 | 0.639932 | 0.329132 | 1.000000 | −0.150740 | 0.234934 |
| NoseAngle | 0.234808 | 0.277656 | 0.438070 | −0.601934 | −0.150740 | 1.000000 | −0.675969 |
| C | −0.099263 | −0.048716 | −0.171853 | 0.708482 | 0.234934 | −0.675969 | 1.000000 |
| Feature | Pearson (r) | t-Test | p-Value | FDR | Significance |
|---|---|---|---|---|---|
| R1 | 0.09926 | −0.76624 | 0.44659 | 0.53591 | |
| R2 | 0.04872 | −0.37464 | 0.70927 | 0.70927 | |
| R3 | −0.17185 | −1.33997 | 0.18540 | 0.27809 | |
| RNose | 0.23493 | −1.85653 | 0.03419 | 0.06837 | |
| RMouth | −0.57054 | −7.08696 | <0.00001 | <0.0001 | *** |
| NoseAngle | 0.70848 | 7.44448 | <0.00001 | <0.0001 | *** |
Publisher’s Note: MDPI stays neutral with regard to jurisdictional claims in published maps and institutional affiliations. |
© 2021 by the authors. Licensee MDPI, Basel, Switzerland. This article is an open access article distributed under the terms and conditions of the Creative Commons Attribution (CC BY) license (https://creativecommons.org/licenses/by/4.0/).
Share and Cite
D’Amato, E.; Reyes-Aldasoro, C.C.; Consiglio, A.; D’Amato, G.; Faienza, M.F.; Zollino, M. Detection of Pitt–Hopkins Syndrome Based on Morphological Facial Features. Appl. Sci. 2021, 11, 12086. https://doi.org/10.3390/app112412086
D’Amato E, Reyes-Aldasoro CC, Consiglio A, D’Amato G, Faienza MF, Zollino M. Detection of Pitt–Hopkins Syndrome Based on Morphological Facial Features. Applied Sciences. 2021; 11(24):12086. https://doi.org/10.3390/app112412086
Chicago/Turabian StyleD’Amato, Elena, Constantino Carlos Reyes-Aldasoro, Arianna Consiglio, Gabriele D’Amato, Maria Felicia Faienza, and Marcella Zollino. 2021. "Detection of Pitt–Hopkins Syndrome Based on Morphological Facial Features" Applied Sciences 11, no. 24: 12086. https://doi.org/10.3390/app112412086