
Real-Time Detection of Overloads on the Plasma-Facing Components of Wendelstein 7-X

 , , , , , , , , , ,
  , , , ,
Abstract
:1. Introduction
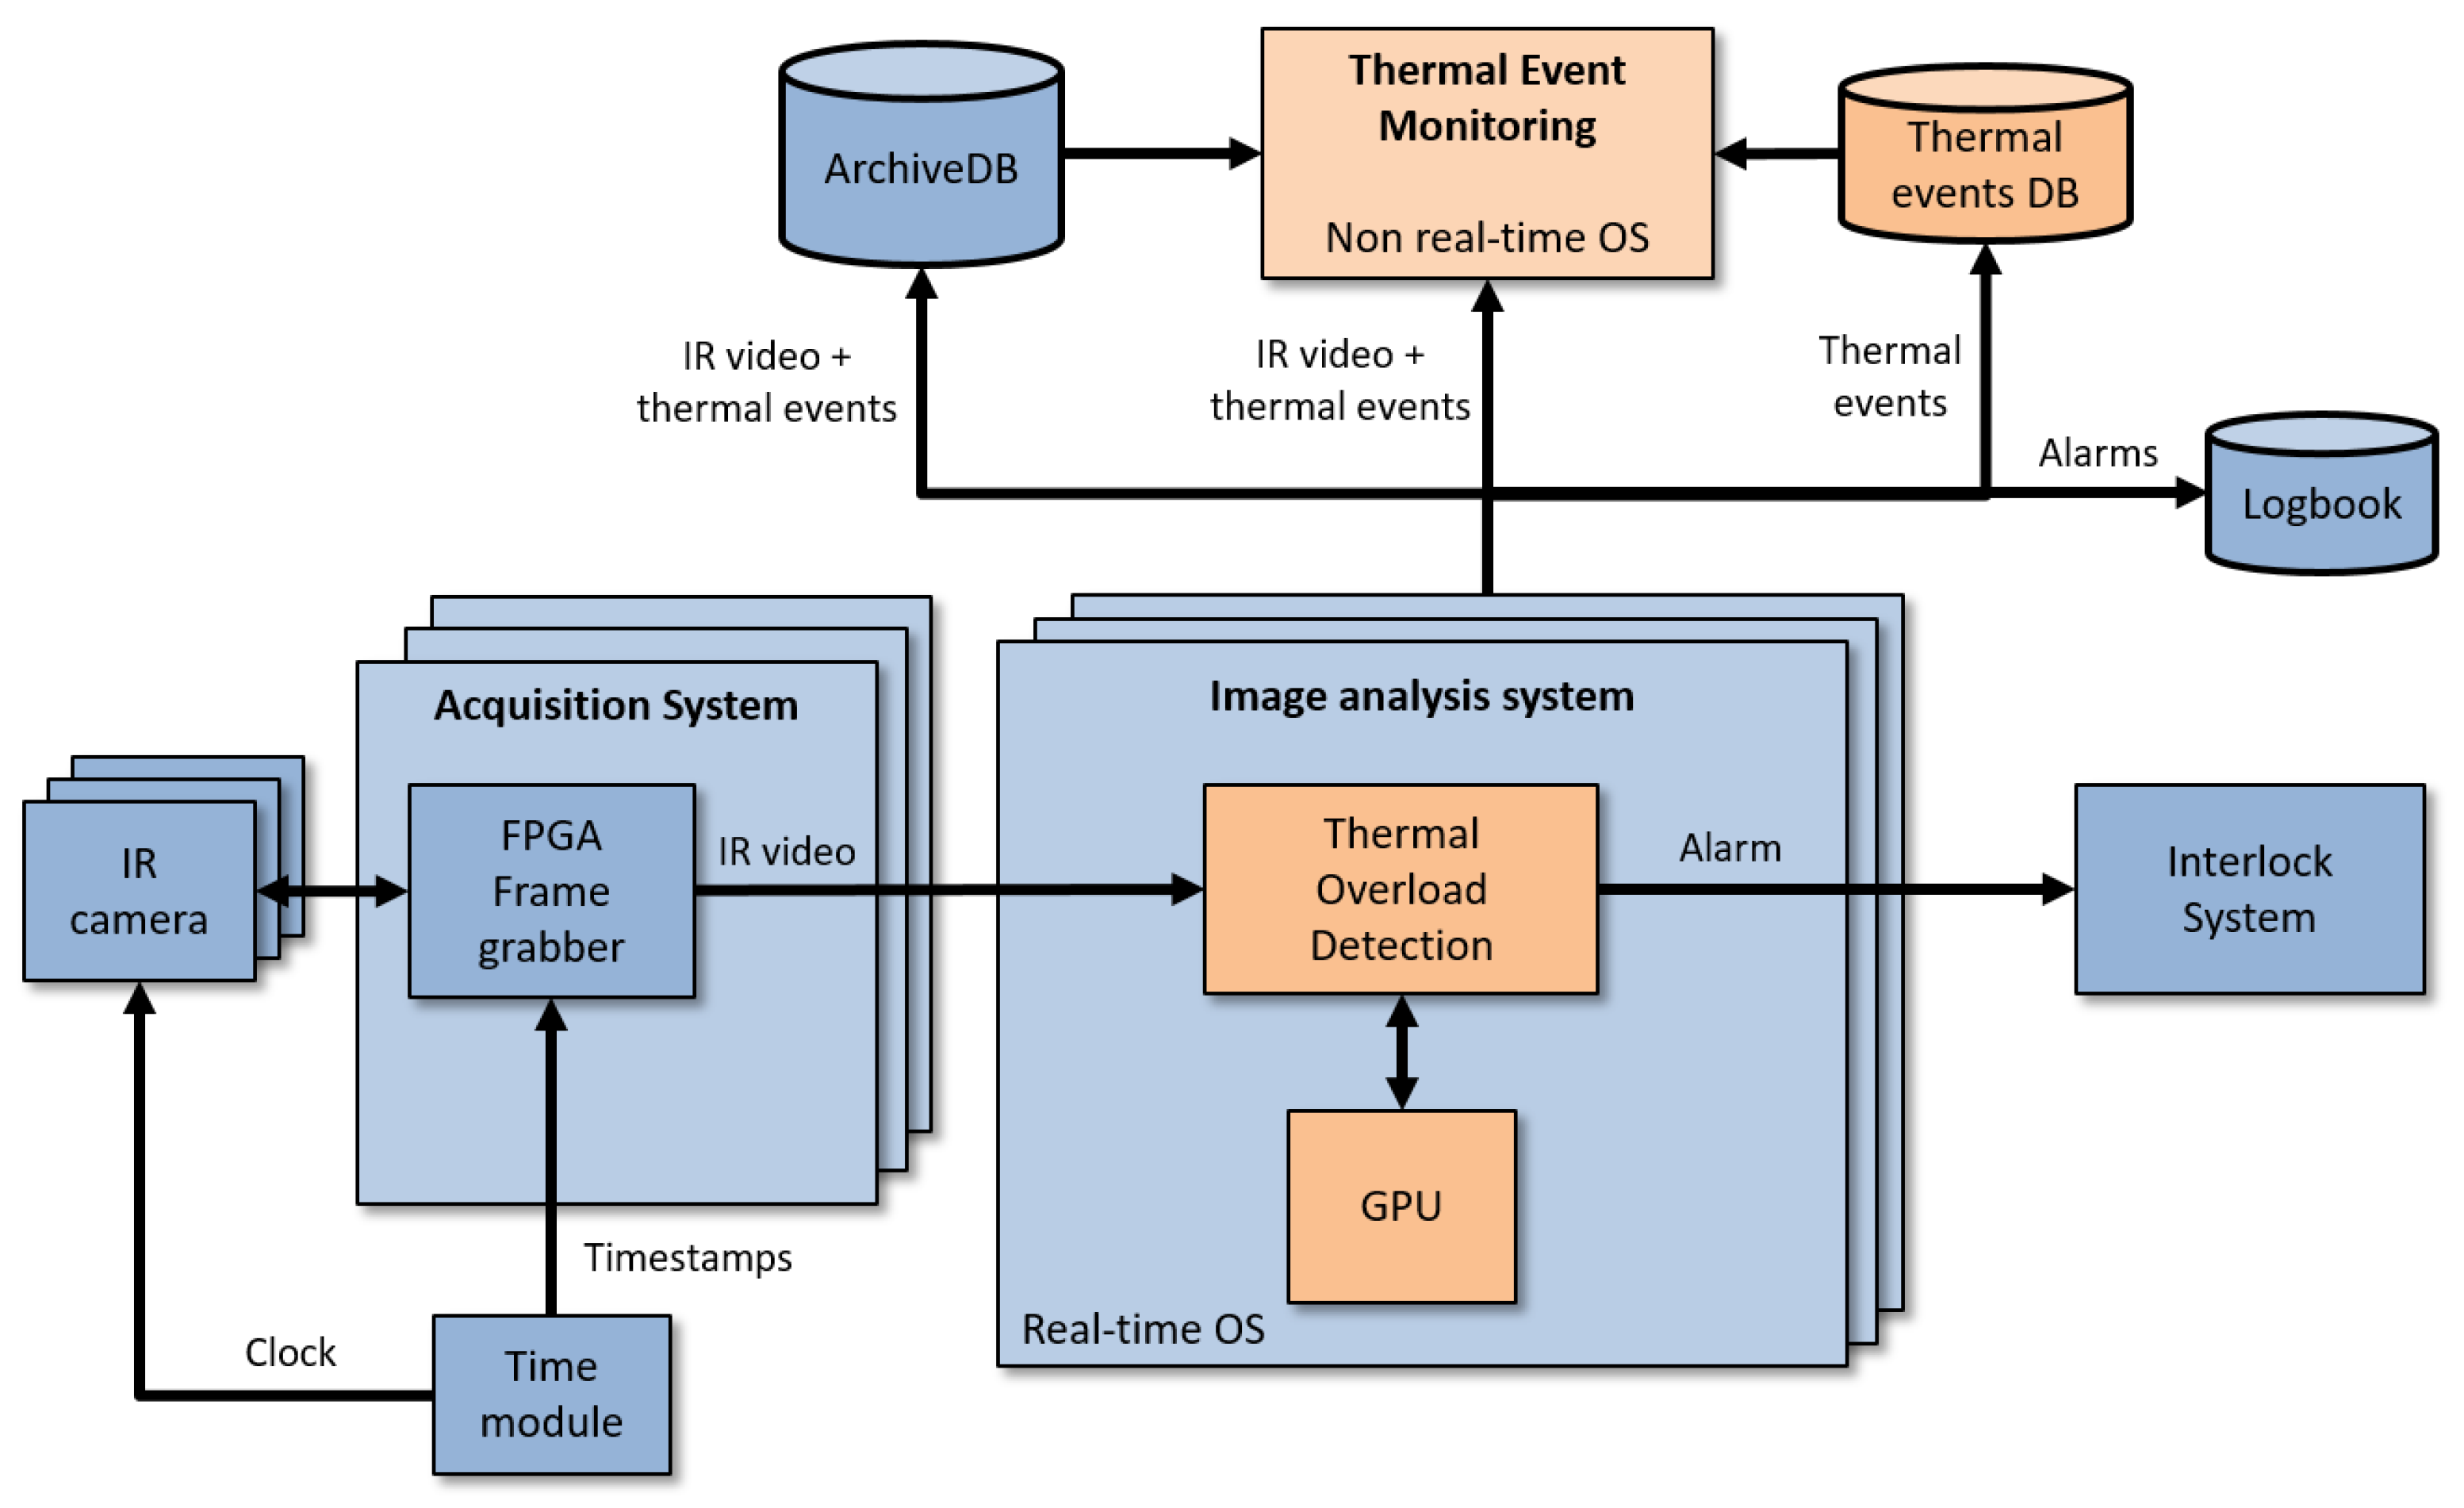
2. Real-Time Imaging System
3. Image Analysis
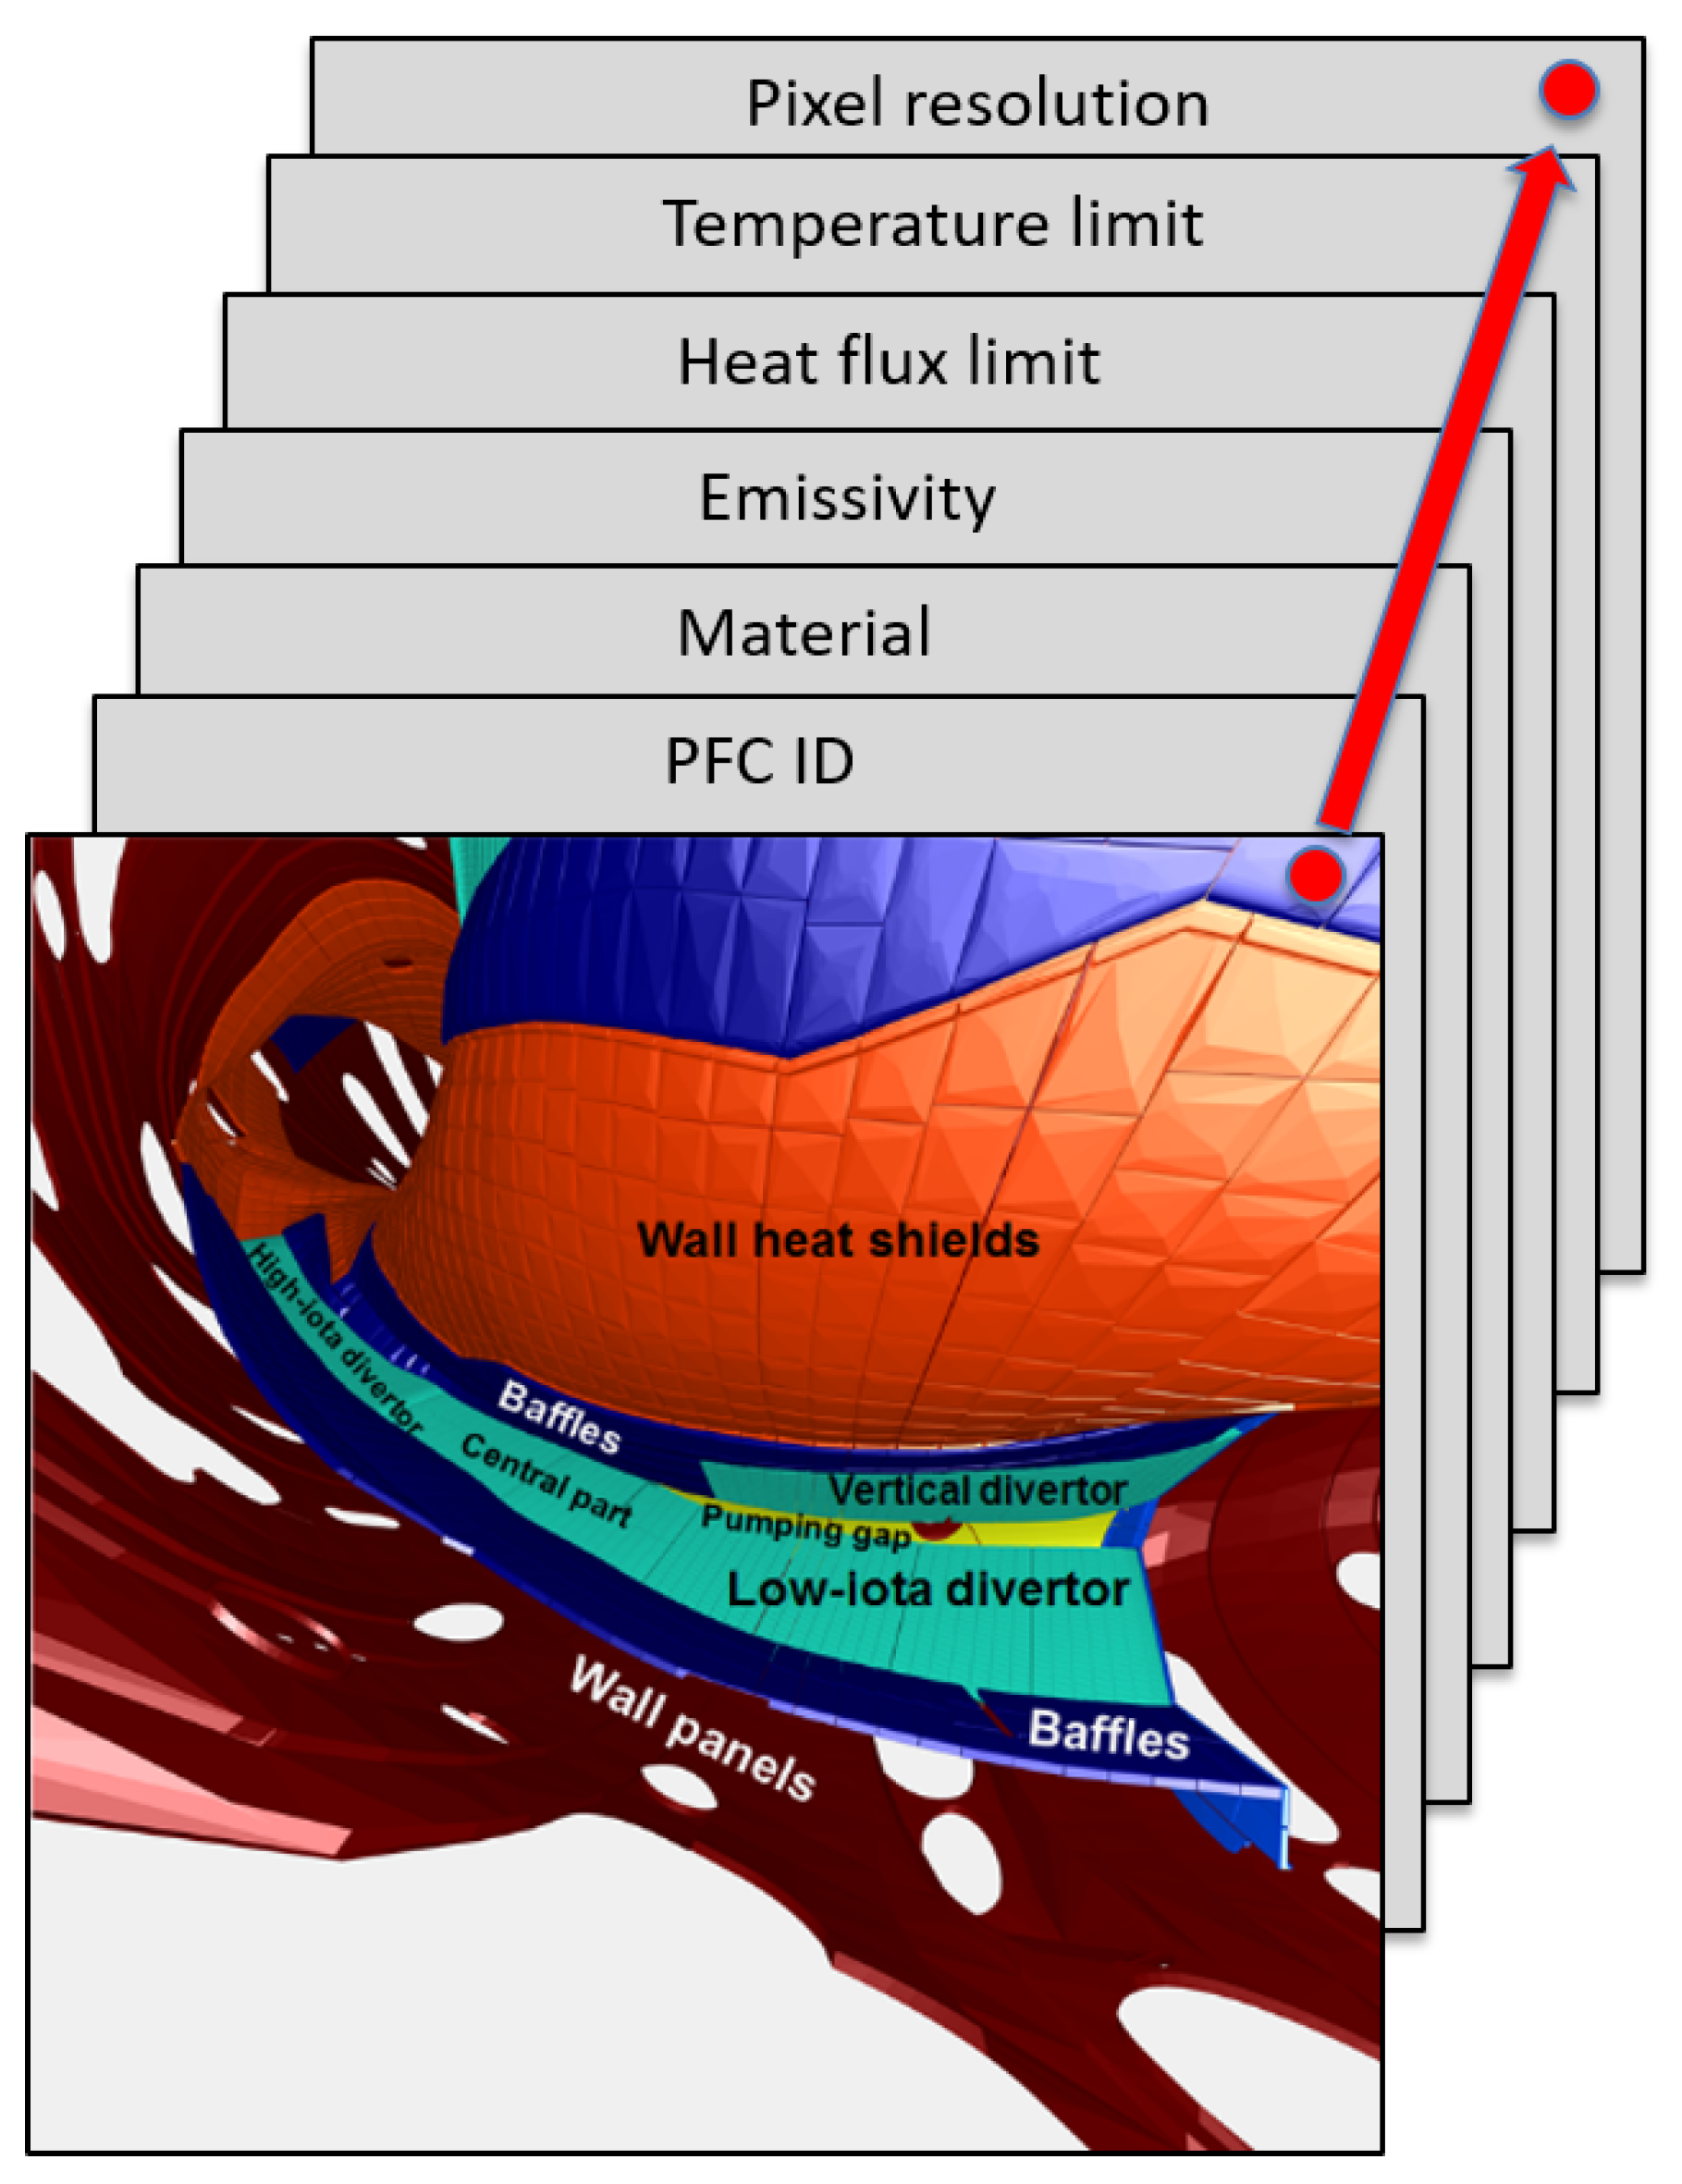
3.1. The Scene Model
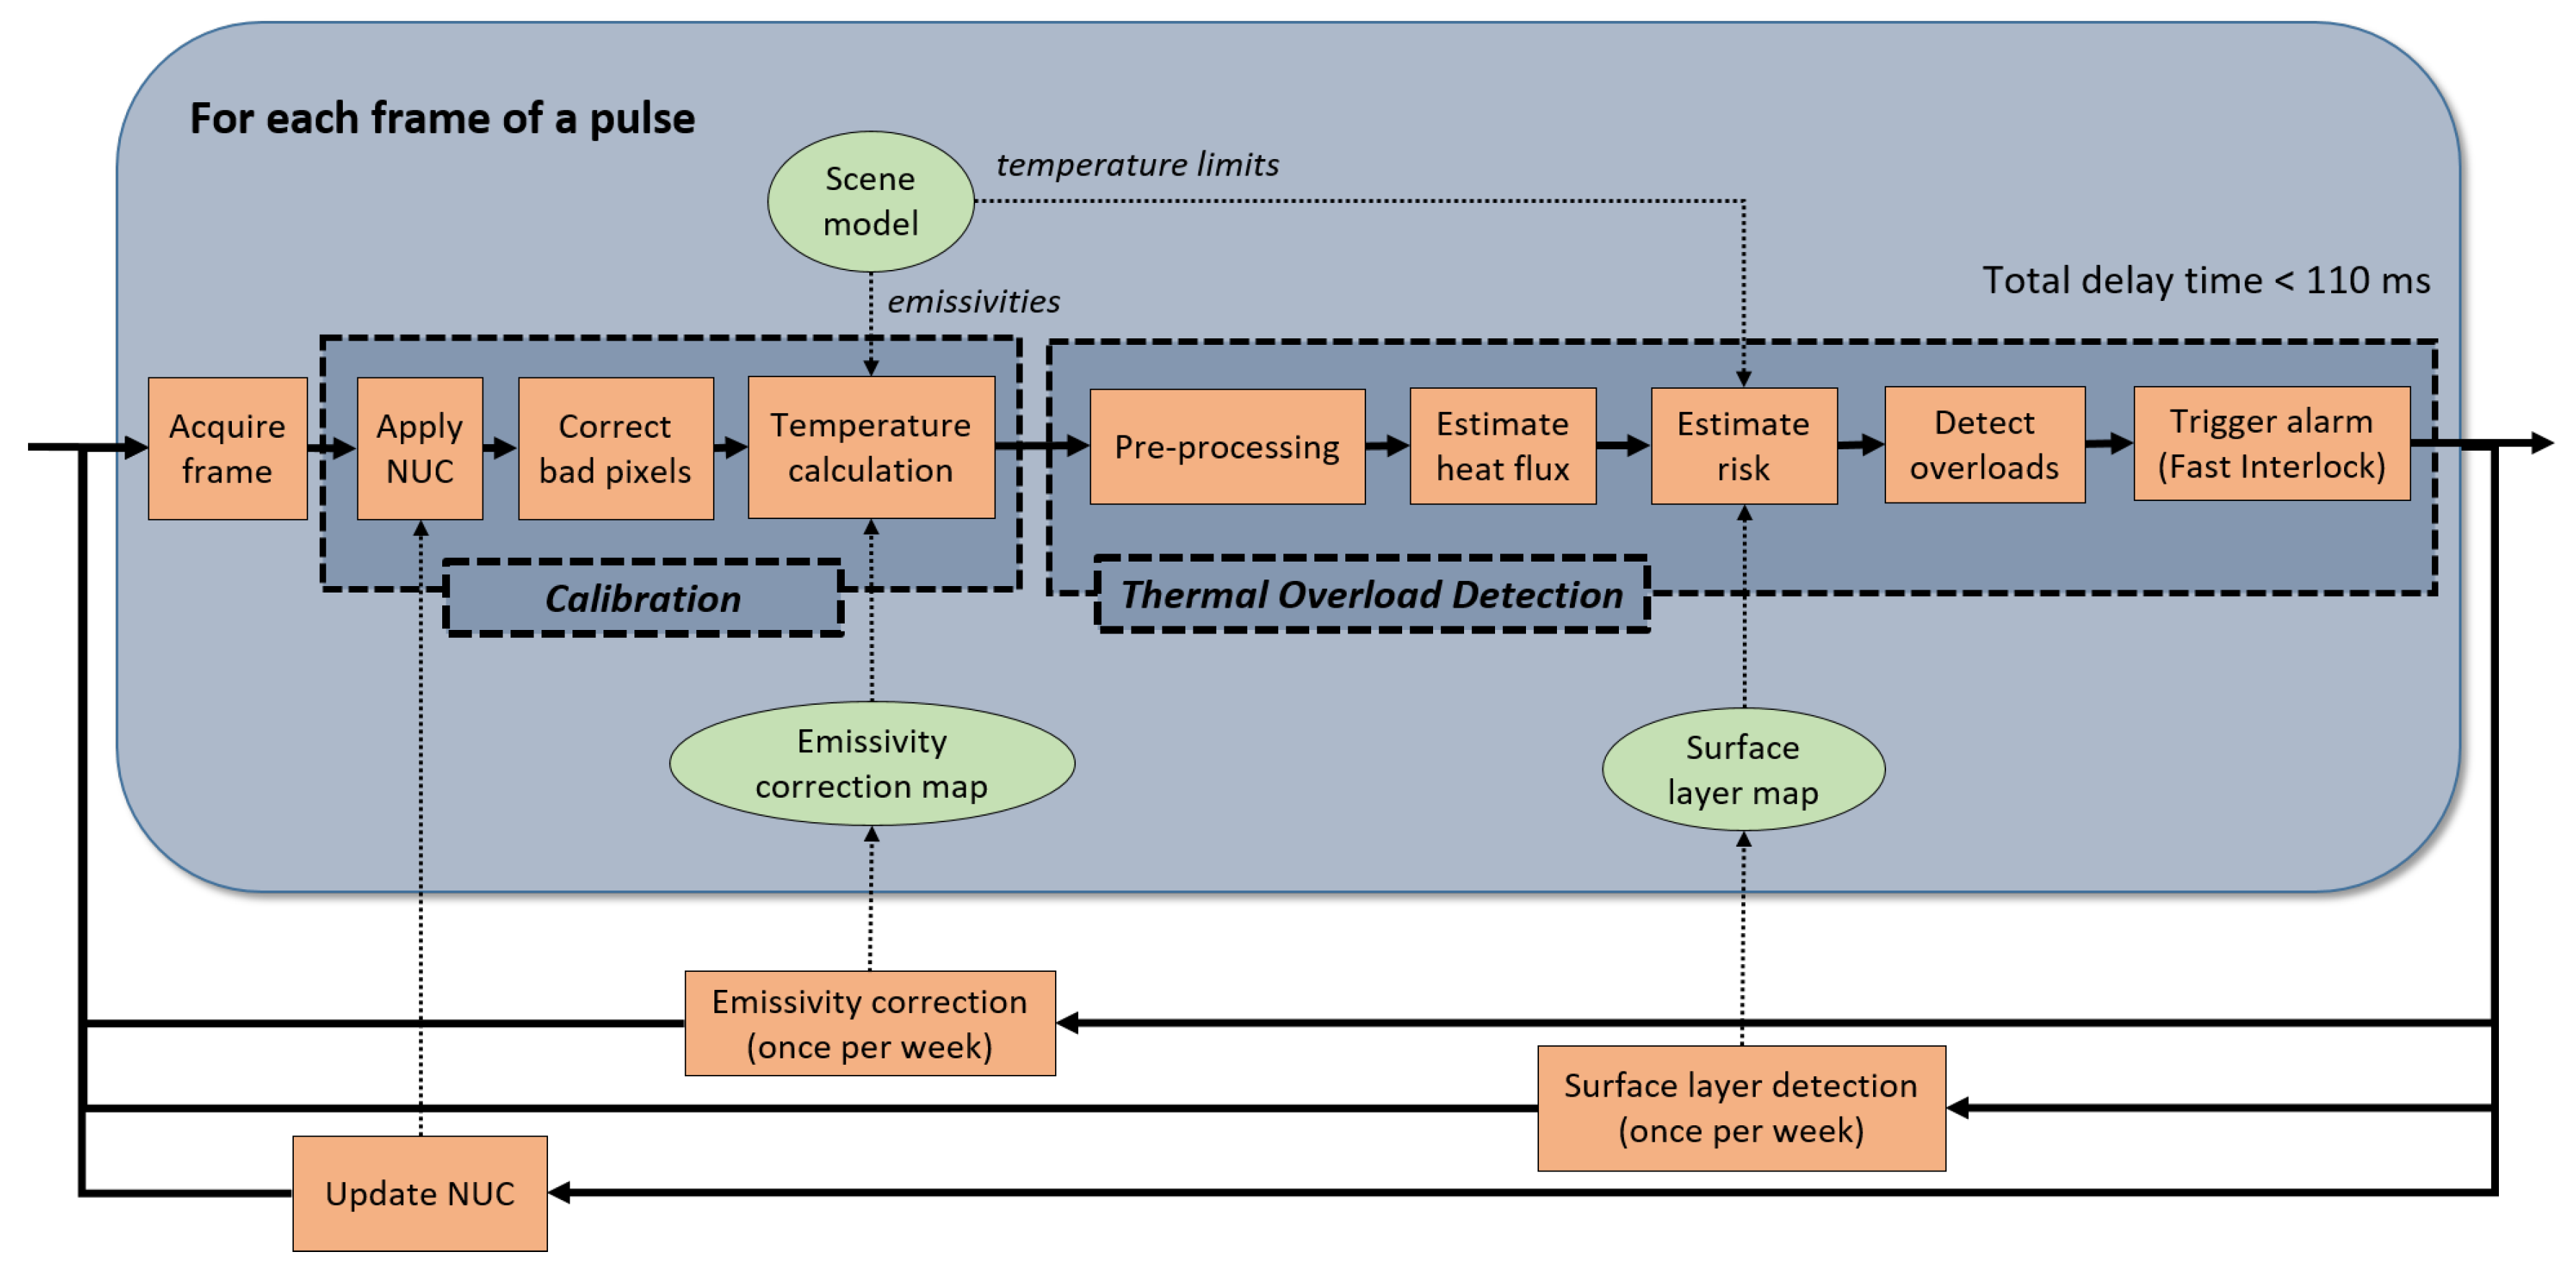
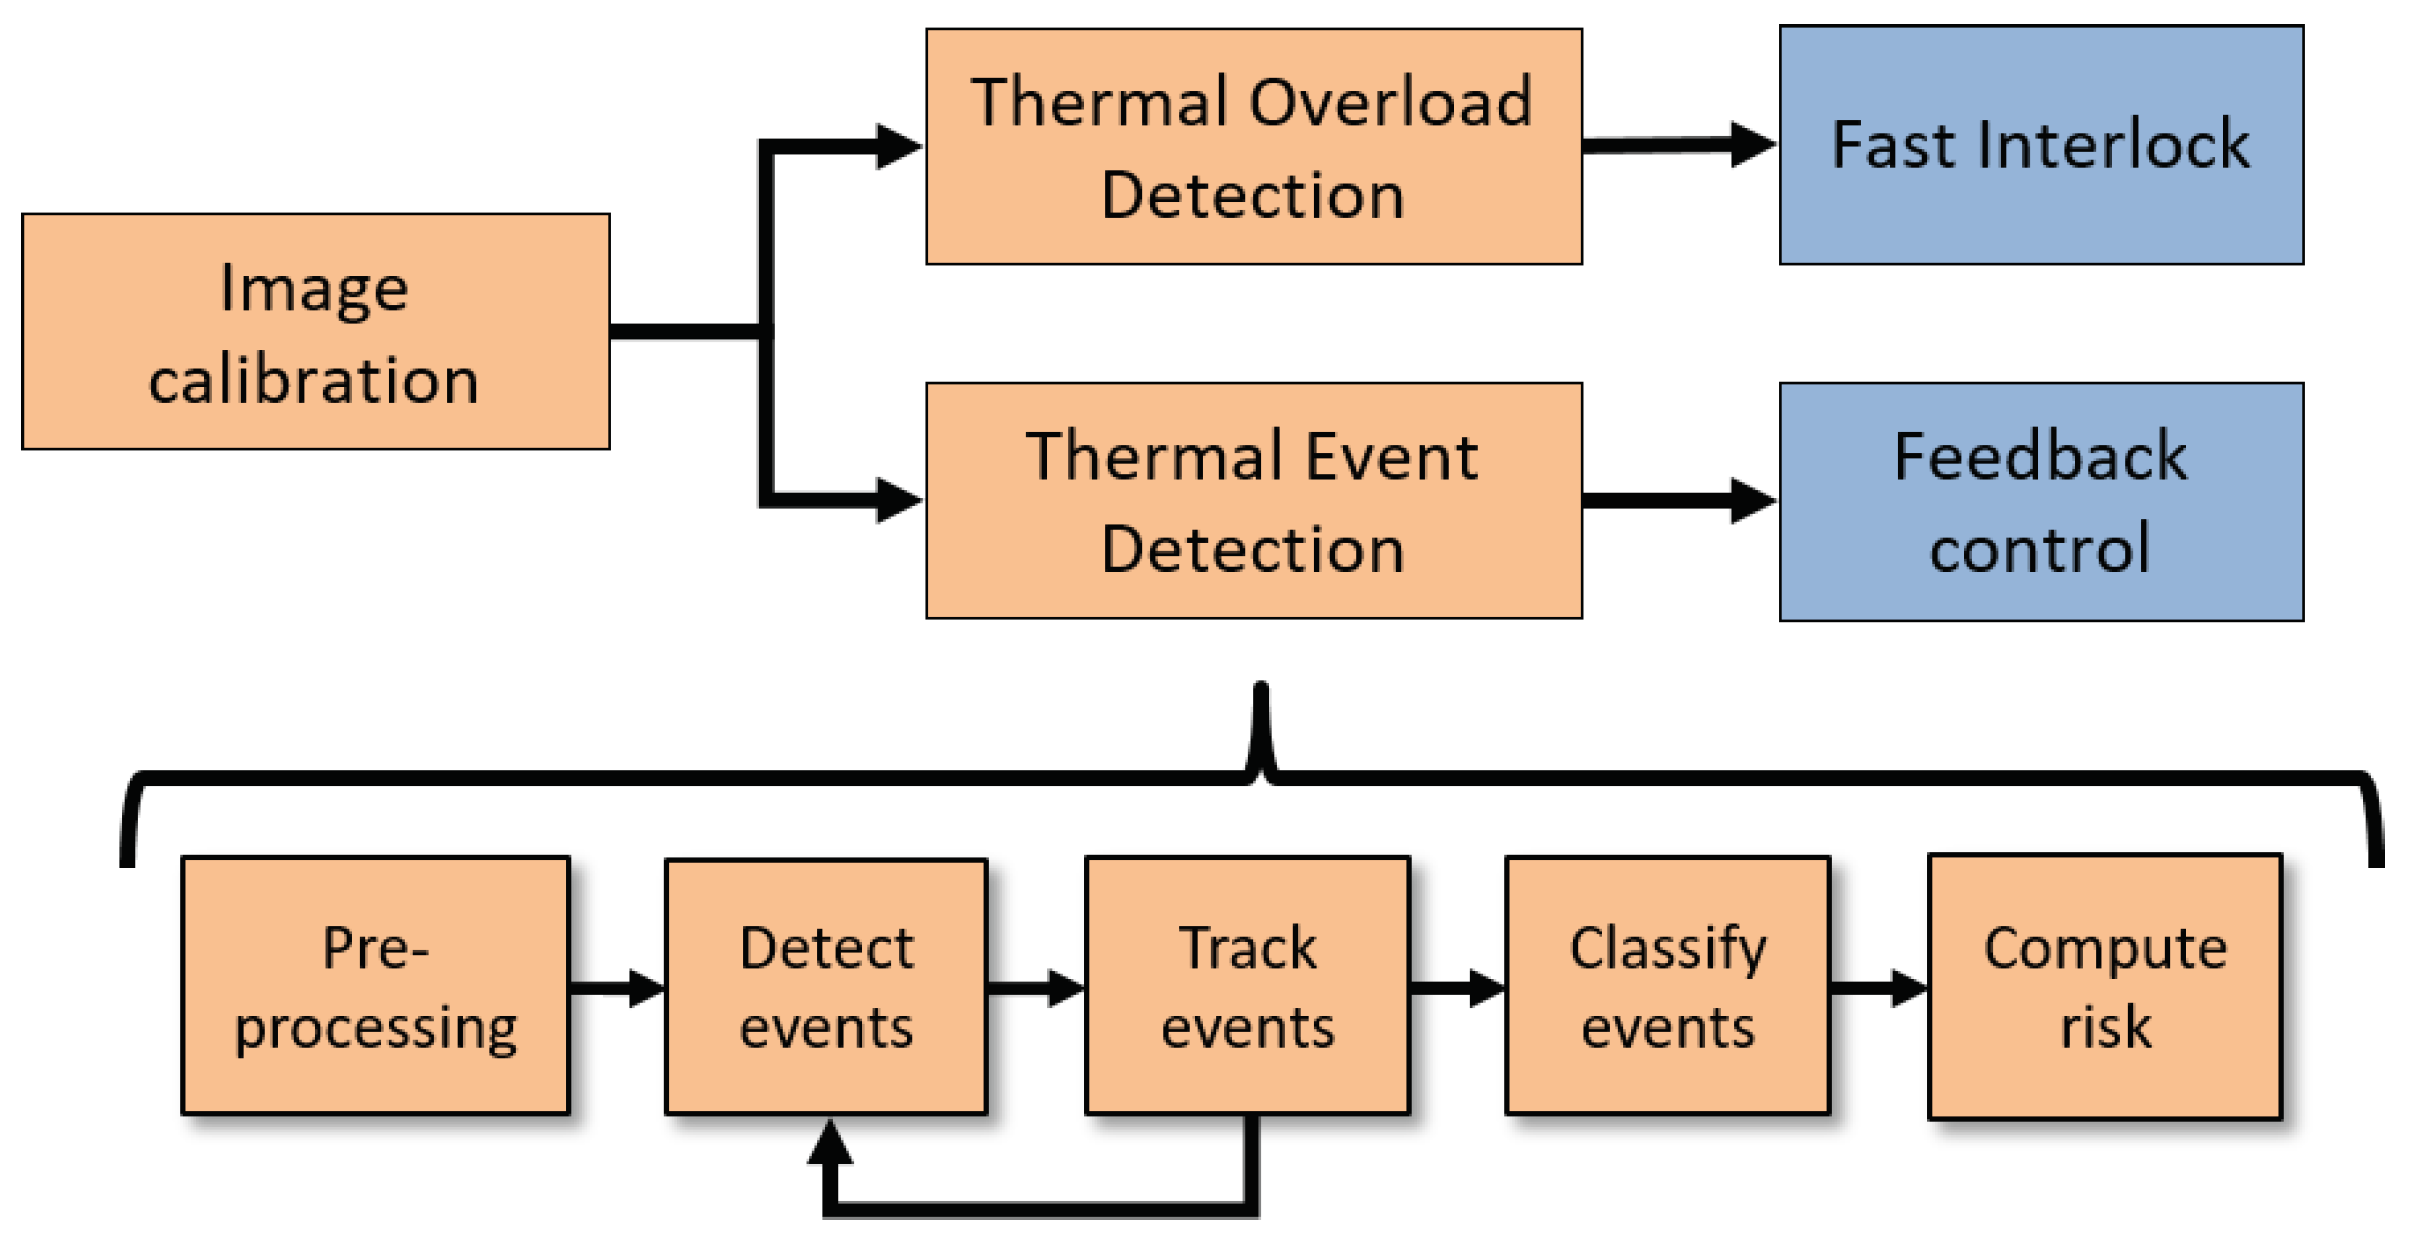
3.2. Image Processing Pipeline
3.3. Thermal Overload Detection Algorithm
- (1)
- After the acquisition and calibration of the thermal image T, the image is filtered to avoid false alarms due to remaining uncorrected bad pixels and noise coming from neutrons. It is clear that hot pixels can trigger false alarms, but also cold pixels must be removed as they can suddenly become hot, creating an apparent (false) peak of heat flux. This may lower the threshold in excess, triggering a false alarm. We remove hot pixels with a spatial filter, a morphological opening with a structuring element of 3 × 3 pixels and 8-connectivity. Cold pixels are removed by a complementary morphological closing followed by a reconstruction [14]. The uncertainty of the temperature calibration is then added to the thermal image resulting in the corrected image .
- (2)
- Following, the corrected thermal image is averaged over time with a moving average to reduce its noise. The average window size n has to be kept small (2 to 5 frames) to avoid adding too much delay to the system.
- (3)
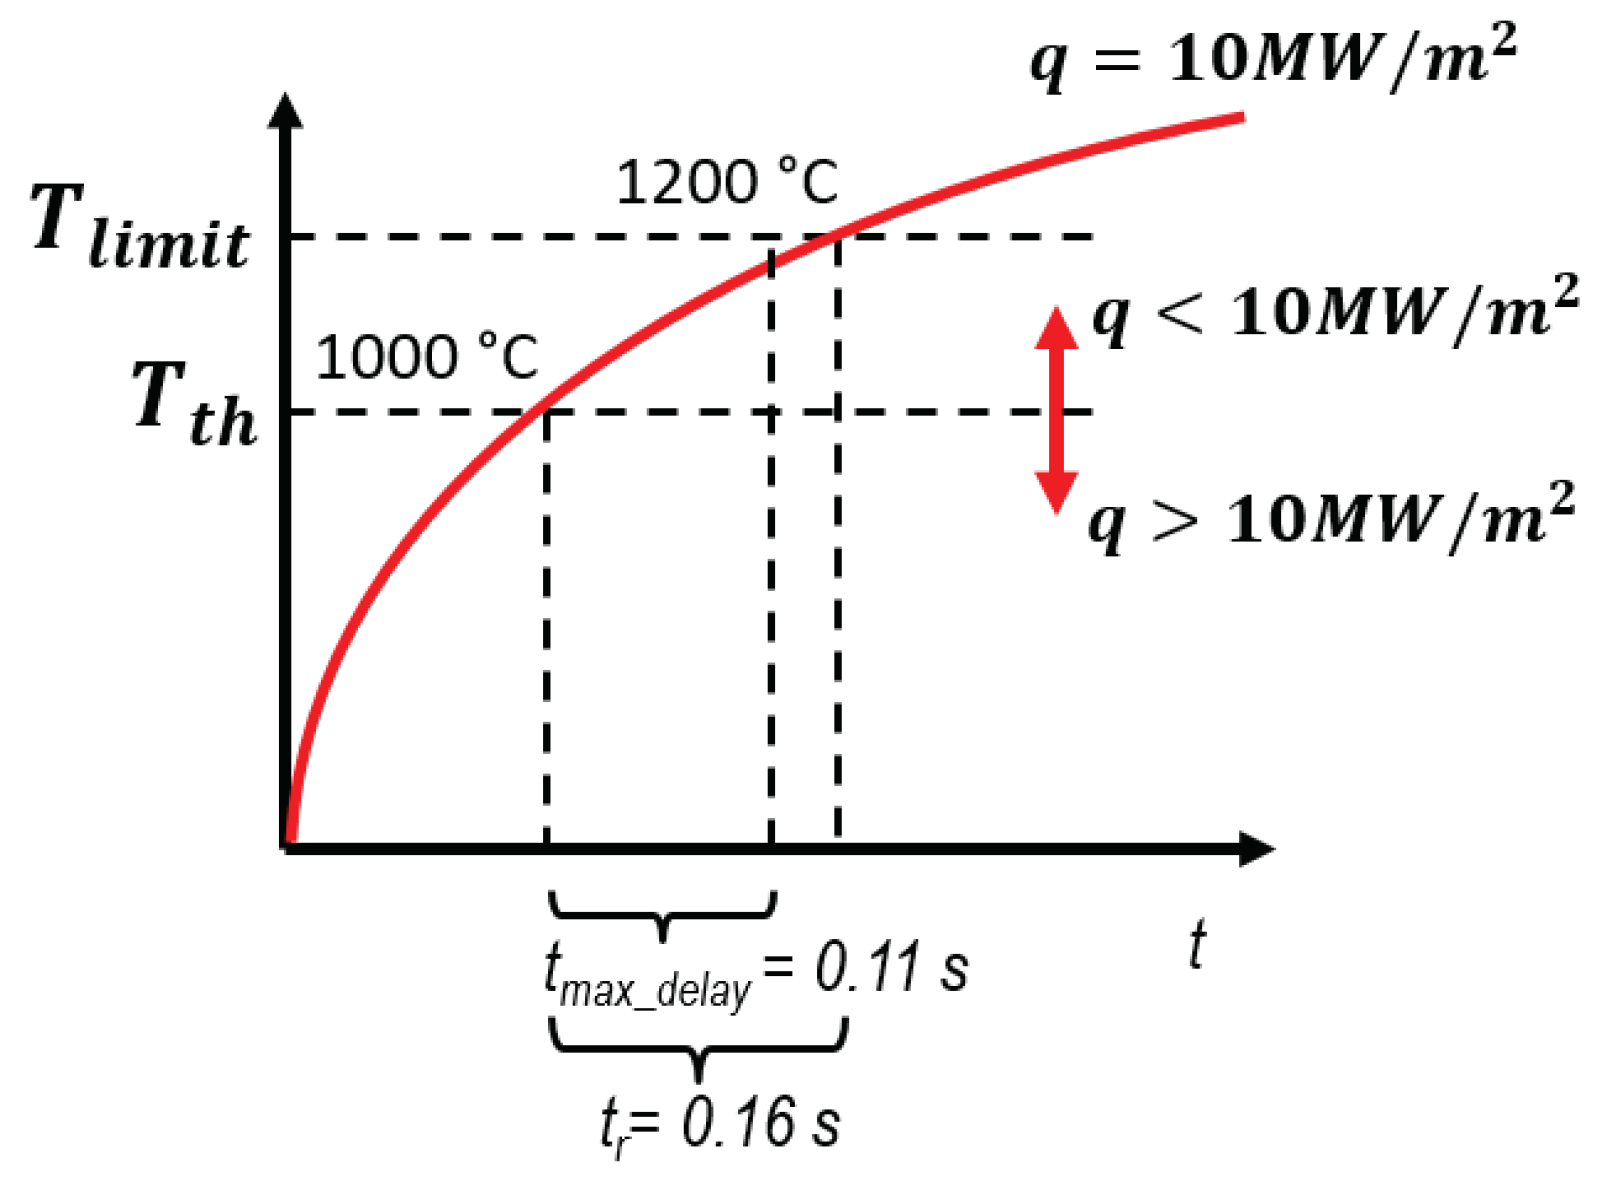
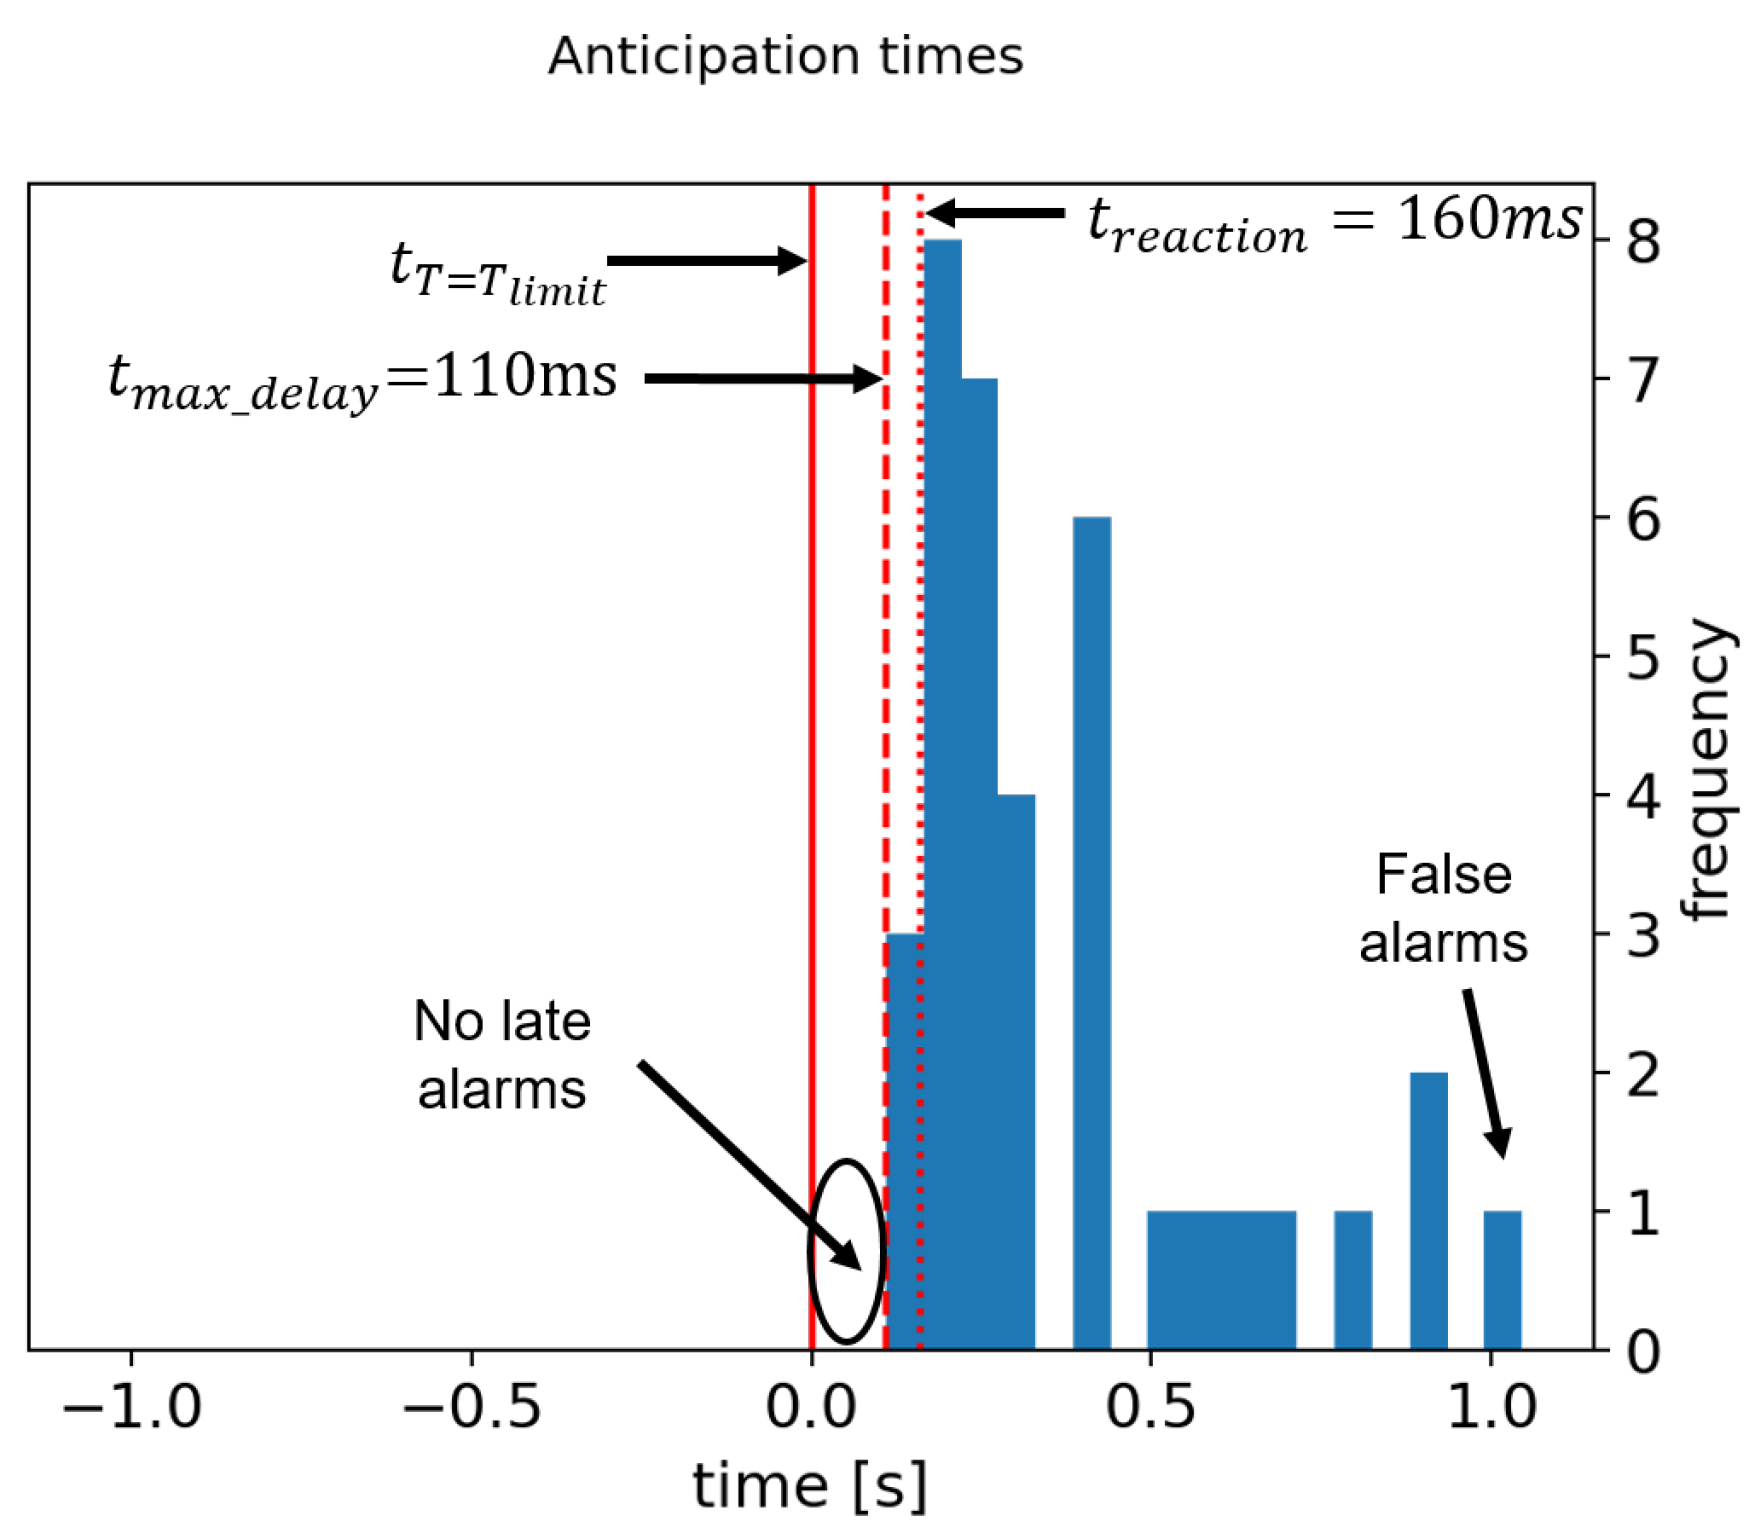
- The temperature threshold [K] is computed with Equation (3) for each pixel in real-time using the model in Equation (2), the reaction time s, the temperature limit [K] of the PFC, the current heat flux [kW/m2], and the material constant [s(kW)2/(m4 K2)]. The scene model provides the temperature limit and material constant for each pixel.where l is a parameter that controls the linearity of the model. In theory, l should be 0.5 (the temperature increases as a square root), but this only holds if the heat-flux is constant. In some situations, when the heat-flux is increasing quickly, the temperature increases faster and the system may react late. We have found that a linear prediction () works better in practice for safety purposes in these cases. The divertor overload case in Section 4 is an example of this: when the heating is increasing in power at the beginning of the discharge, the heat flux is also increasing quickly and the temperature increases faster than the square root model.
- (4)
- Note that Equation (3) requires the computation of the heat-flux in real-time. Currently, 2-dimensional thermal calculations in real-time are not possible at W7-X, since we cannot assume toroidal symmetry [15]. The heat-flux can be estimated roughly according to Equation (1) using the increase of the averaged corrected temperature between two frames and the frame time interval s, resulting in Equation (4).
- (5)
- is then time-filtered in Equation (5) with a learning rate to avoid triggering false alarms due to fast transients.Fast transients refer to fast physical events with high heat flux that last for a short period of time, not enough to actually heat and damage the PFCs. However, the temperature prediction is based on the measured heat flux, and it reacts assuming that the current heat flux is sustained for 0.16 s. A short high increase of heat flux can then trigger a false alarm, even lasting just few ms. To prevent this, the heat flux has to be averaged over time to react only to sustained heat flux changes.
- (6)
- In case the heat-flux calculation under-estimates the real heat flux, we follow a conservative approach to stay on the safe side. The temperature threshold finally used (Equation (6)) is the minimum between the computed according to Equation (3) and an upper-bound :The upper-bound values are:
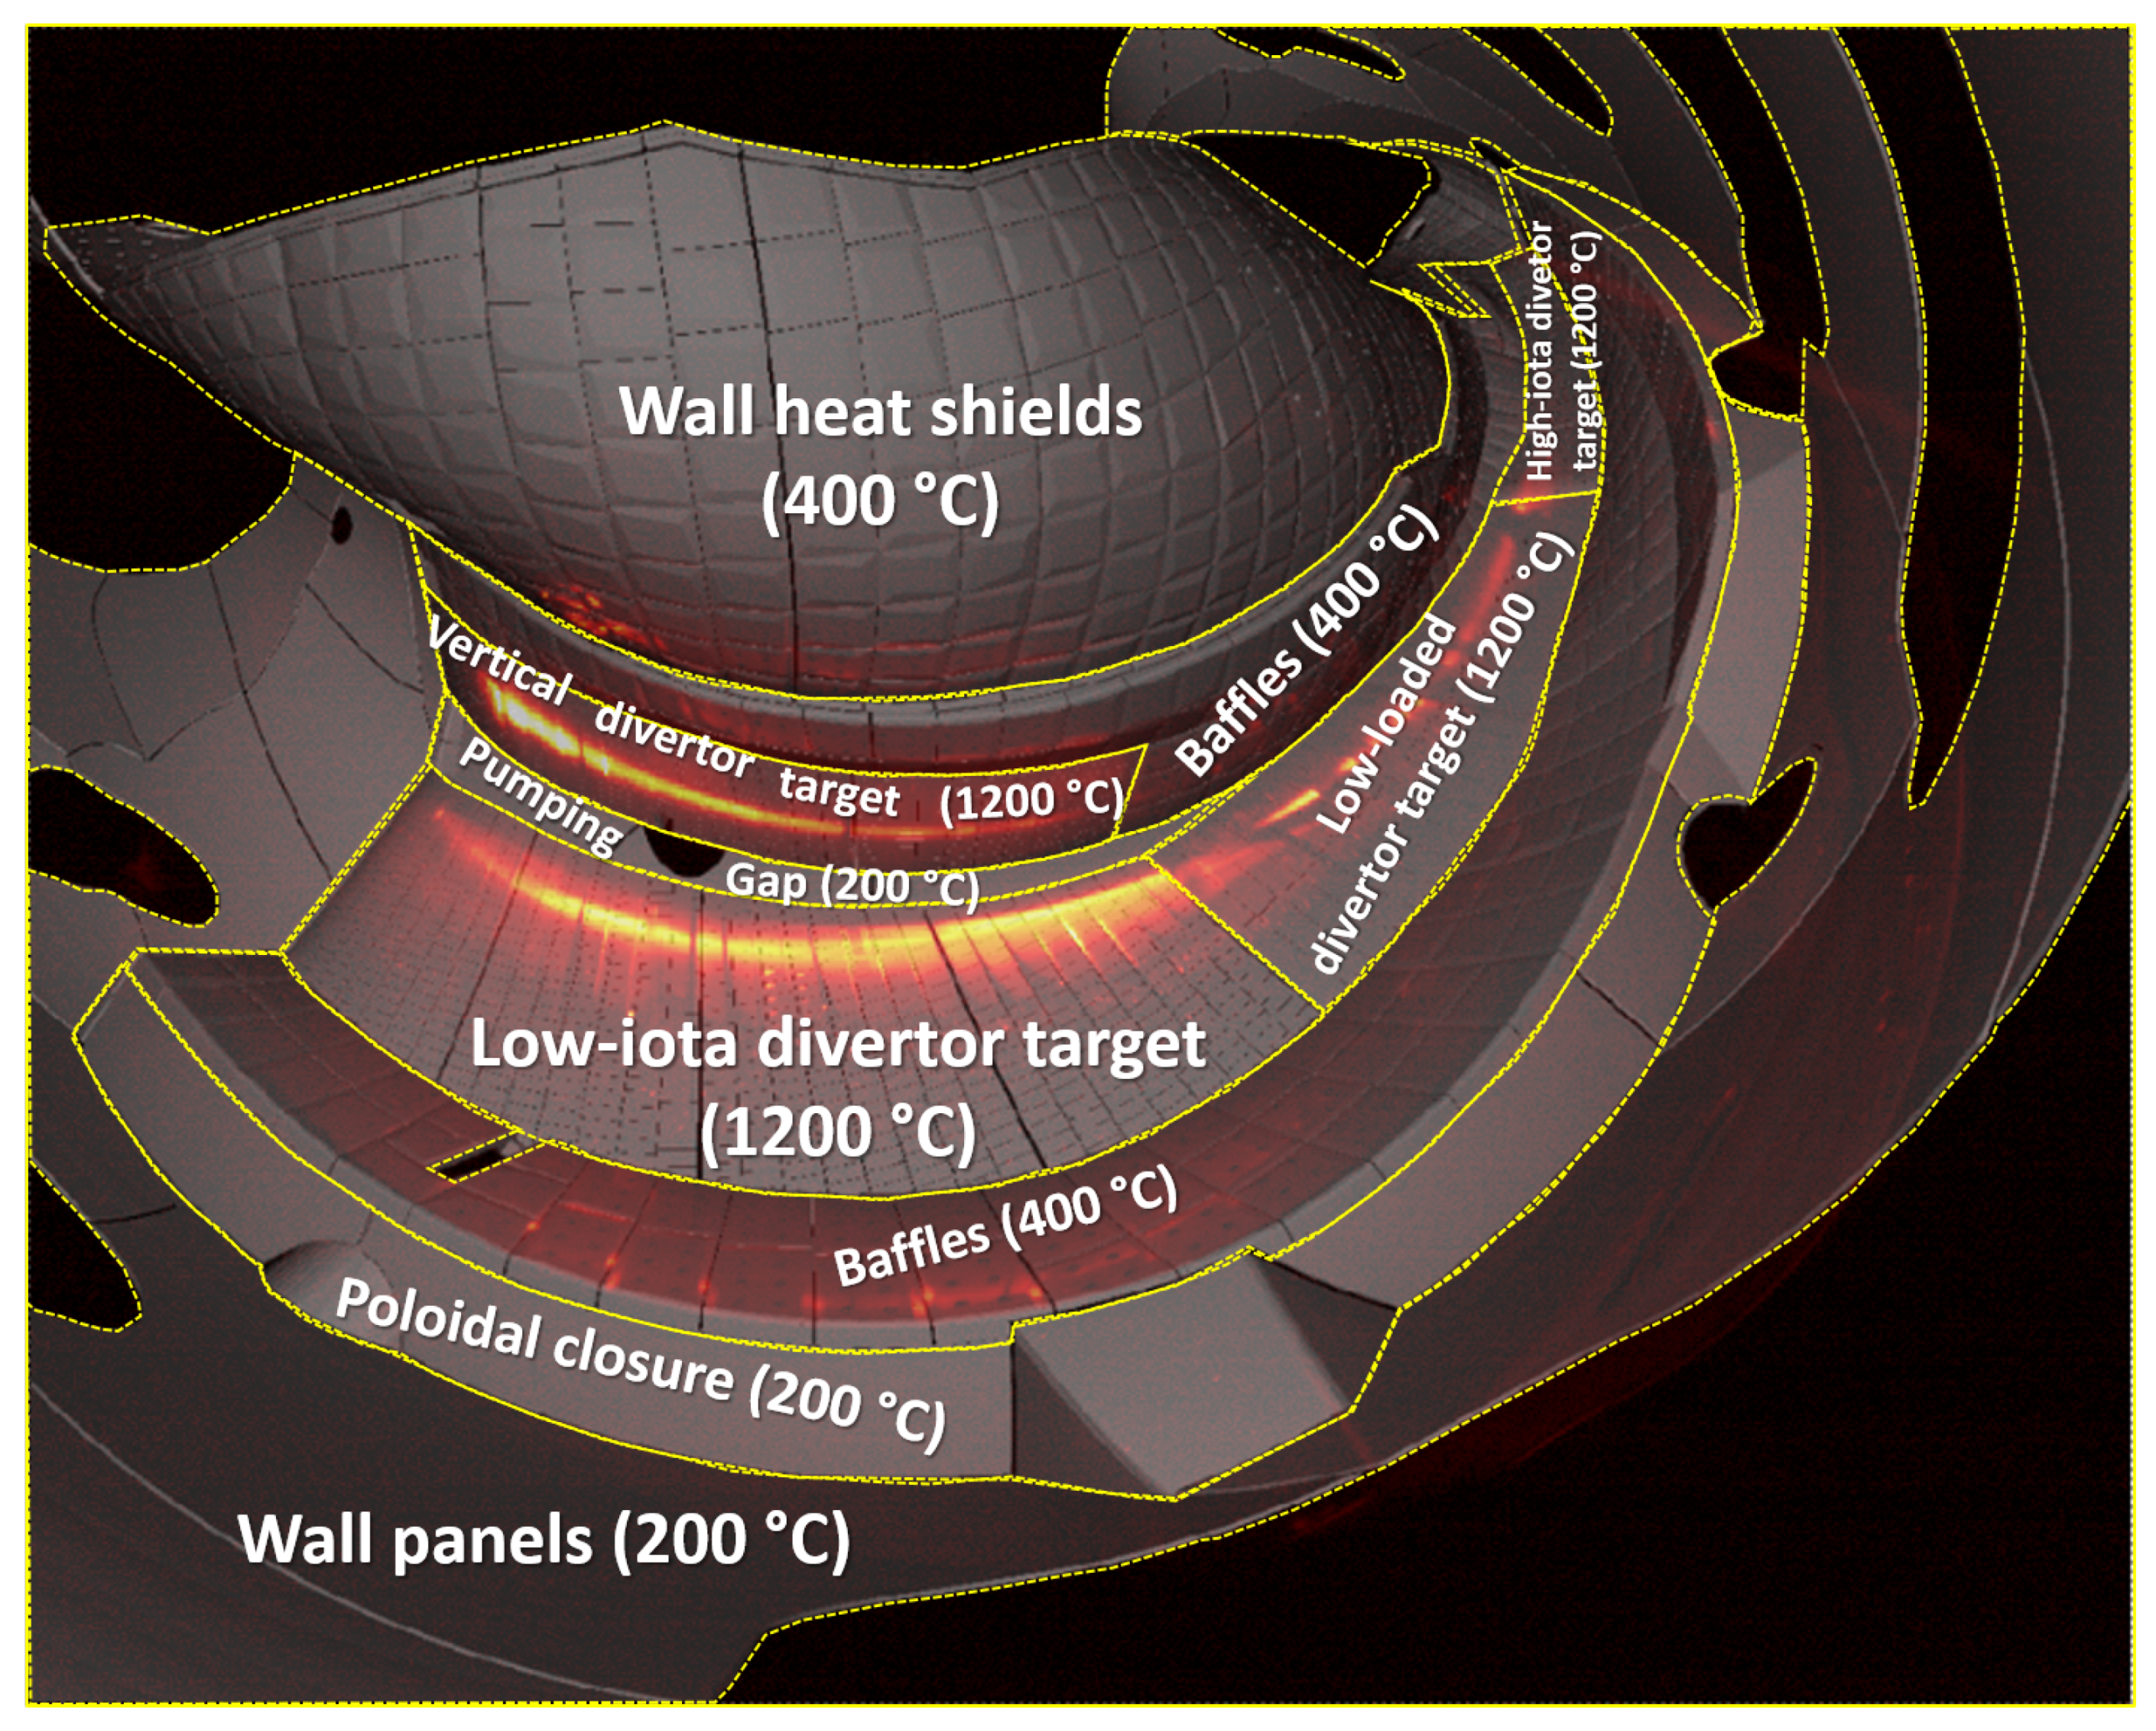
- Divertor targets: 1034 C
- Baffles and heat shields: 387 C
- Pumping gap: 172 C
These values are computed according to Equation (2) considering a s (without safety margin) and assuming a heat-flux of 10 MW/m2 for the divertors, 0.5 MW/m2 for the baffle and heat shields and 0.2 MW/m2 for the pumping gap. Note that we do not require here the safety margin of the reaction time because the calculation of the threshold is deterministic. The safety margin was added to account for the uncertainty of the heat-flux estimation. Also note that setting a temperature threshold upper-bound is equivalent to setting a heat flux lower-bound or a minimum value of the heat flux (see Equation (2)). - (7)
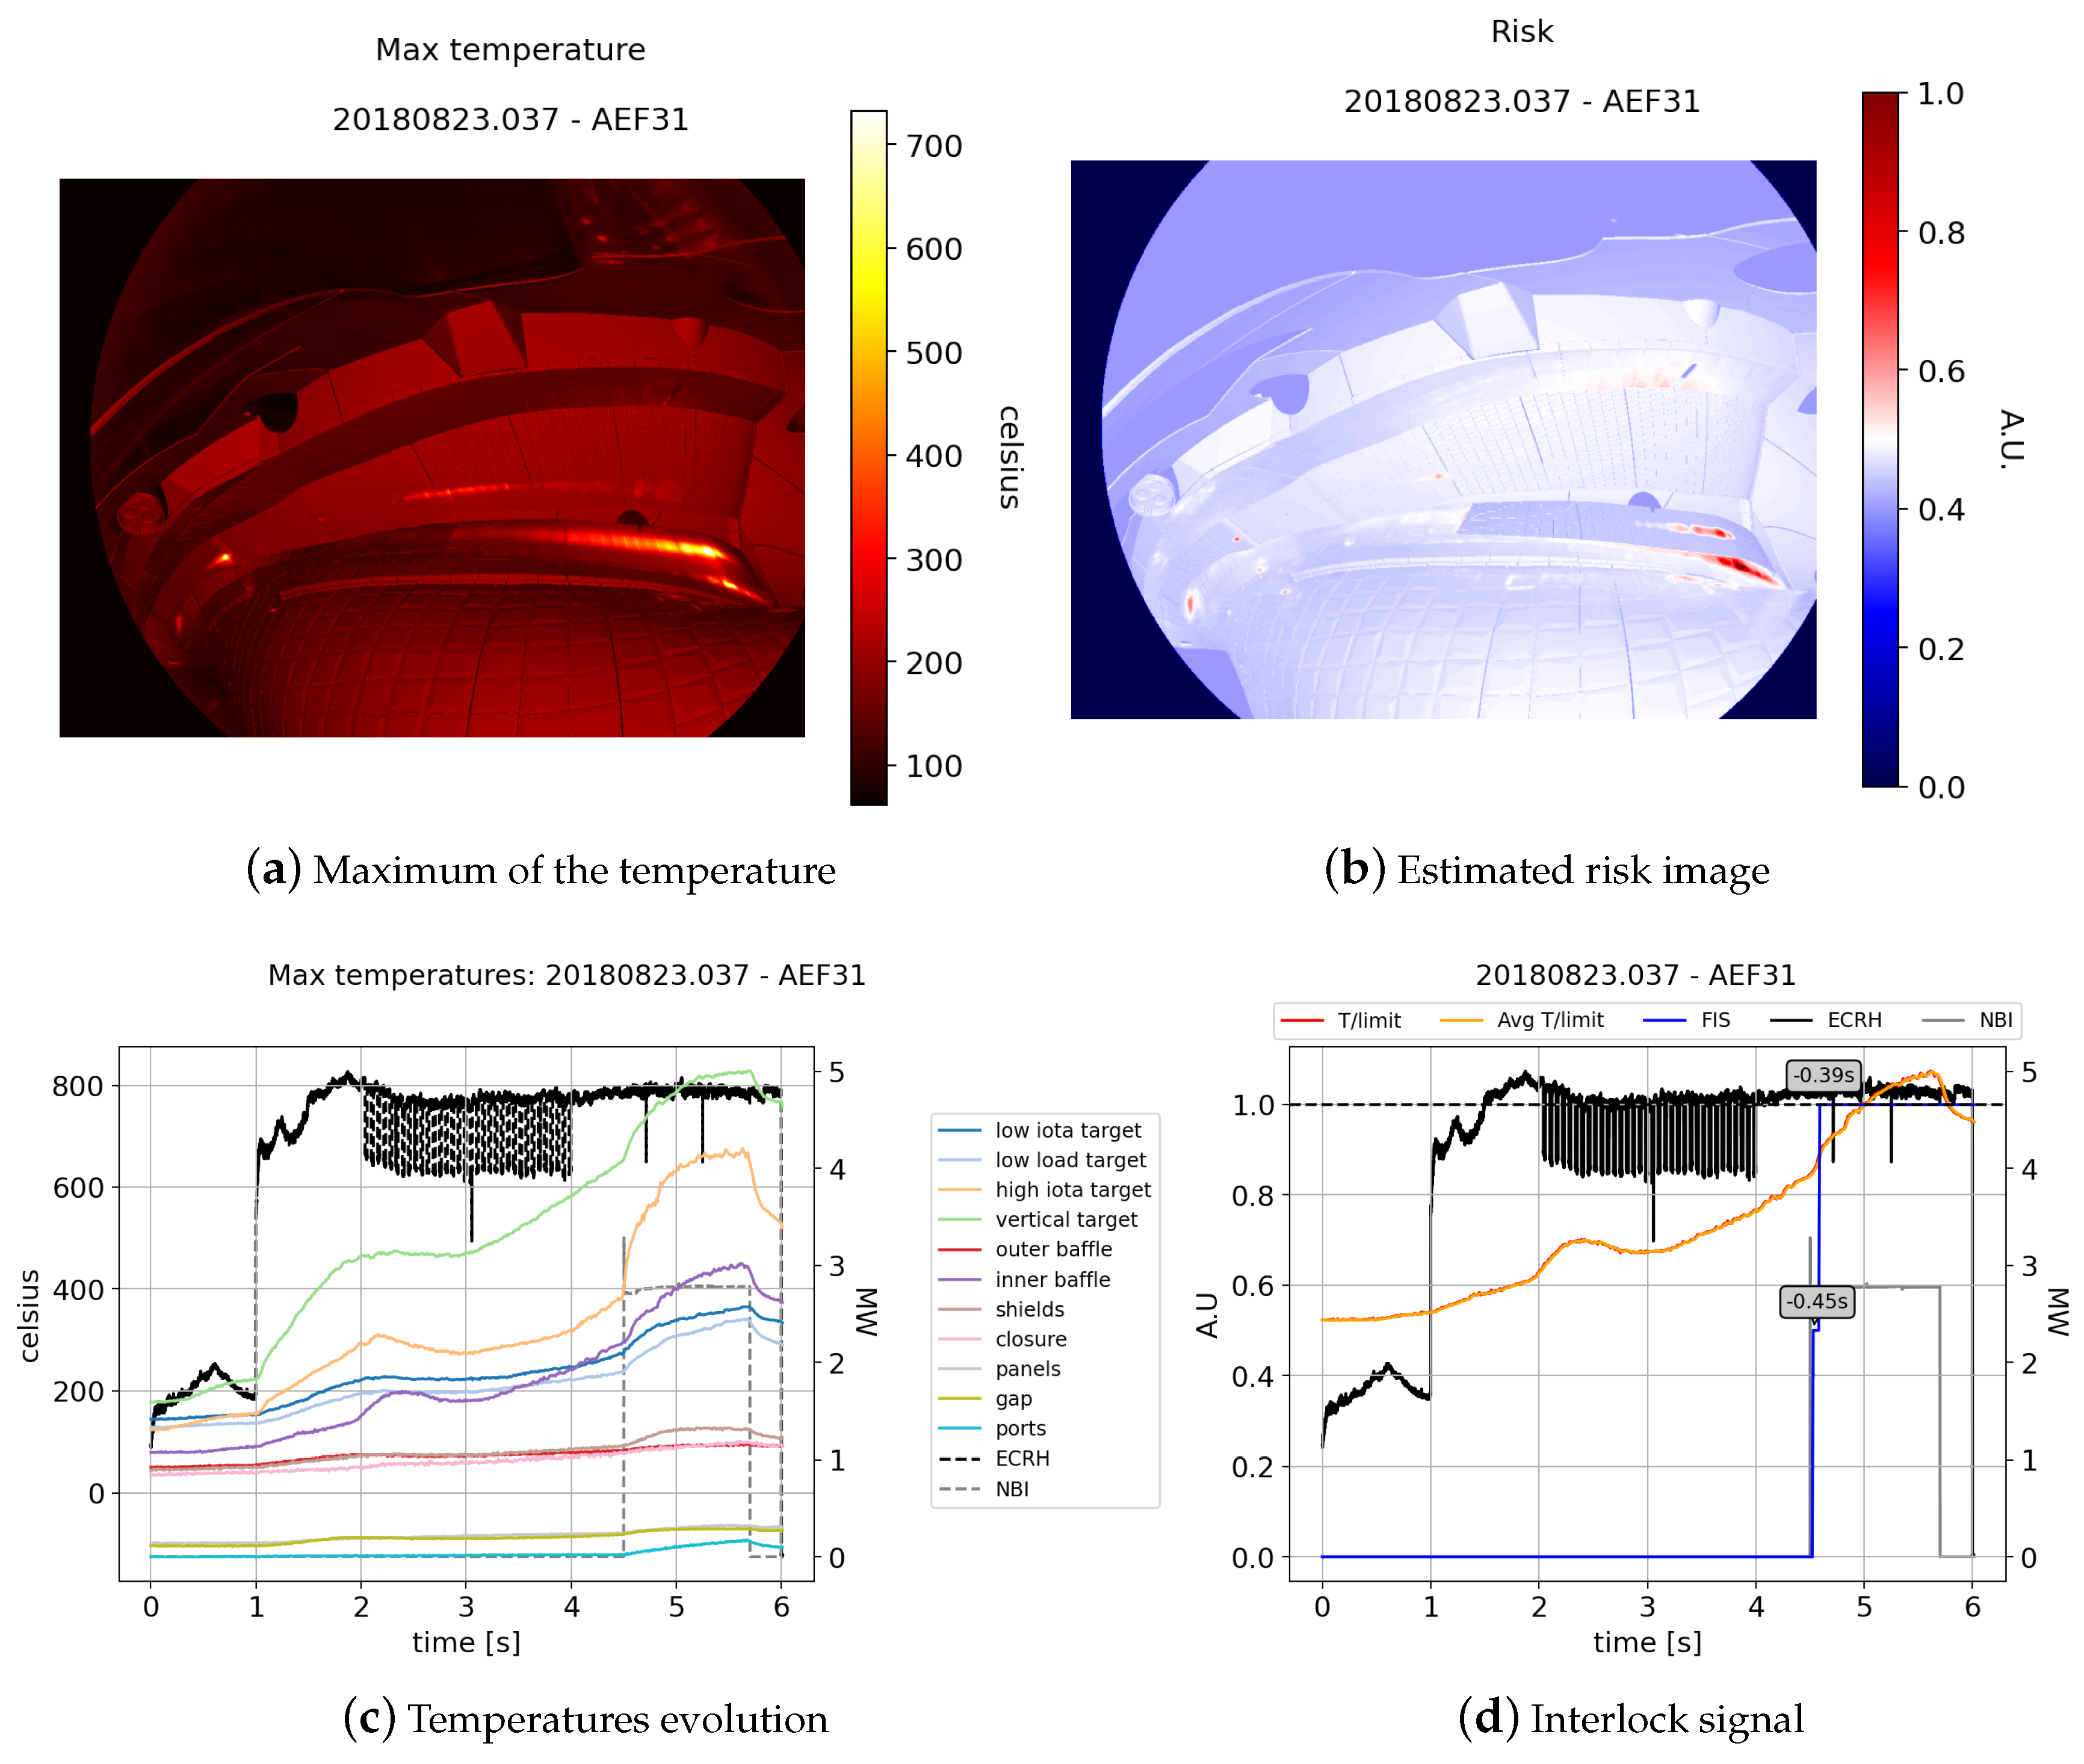
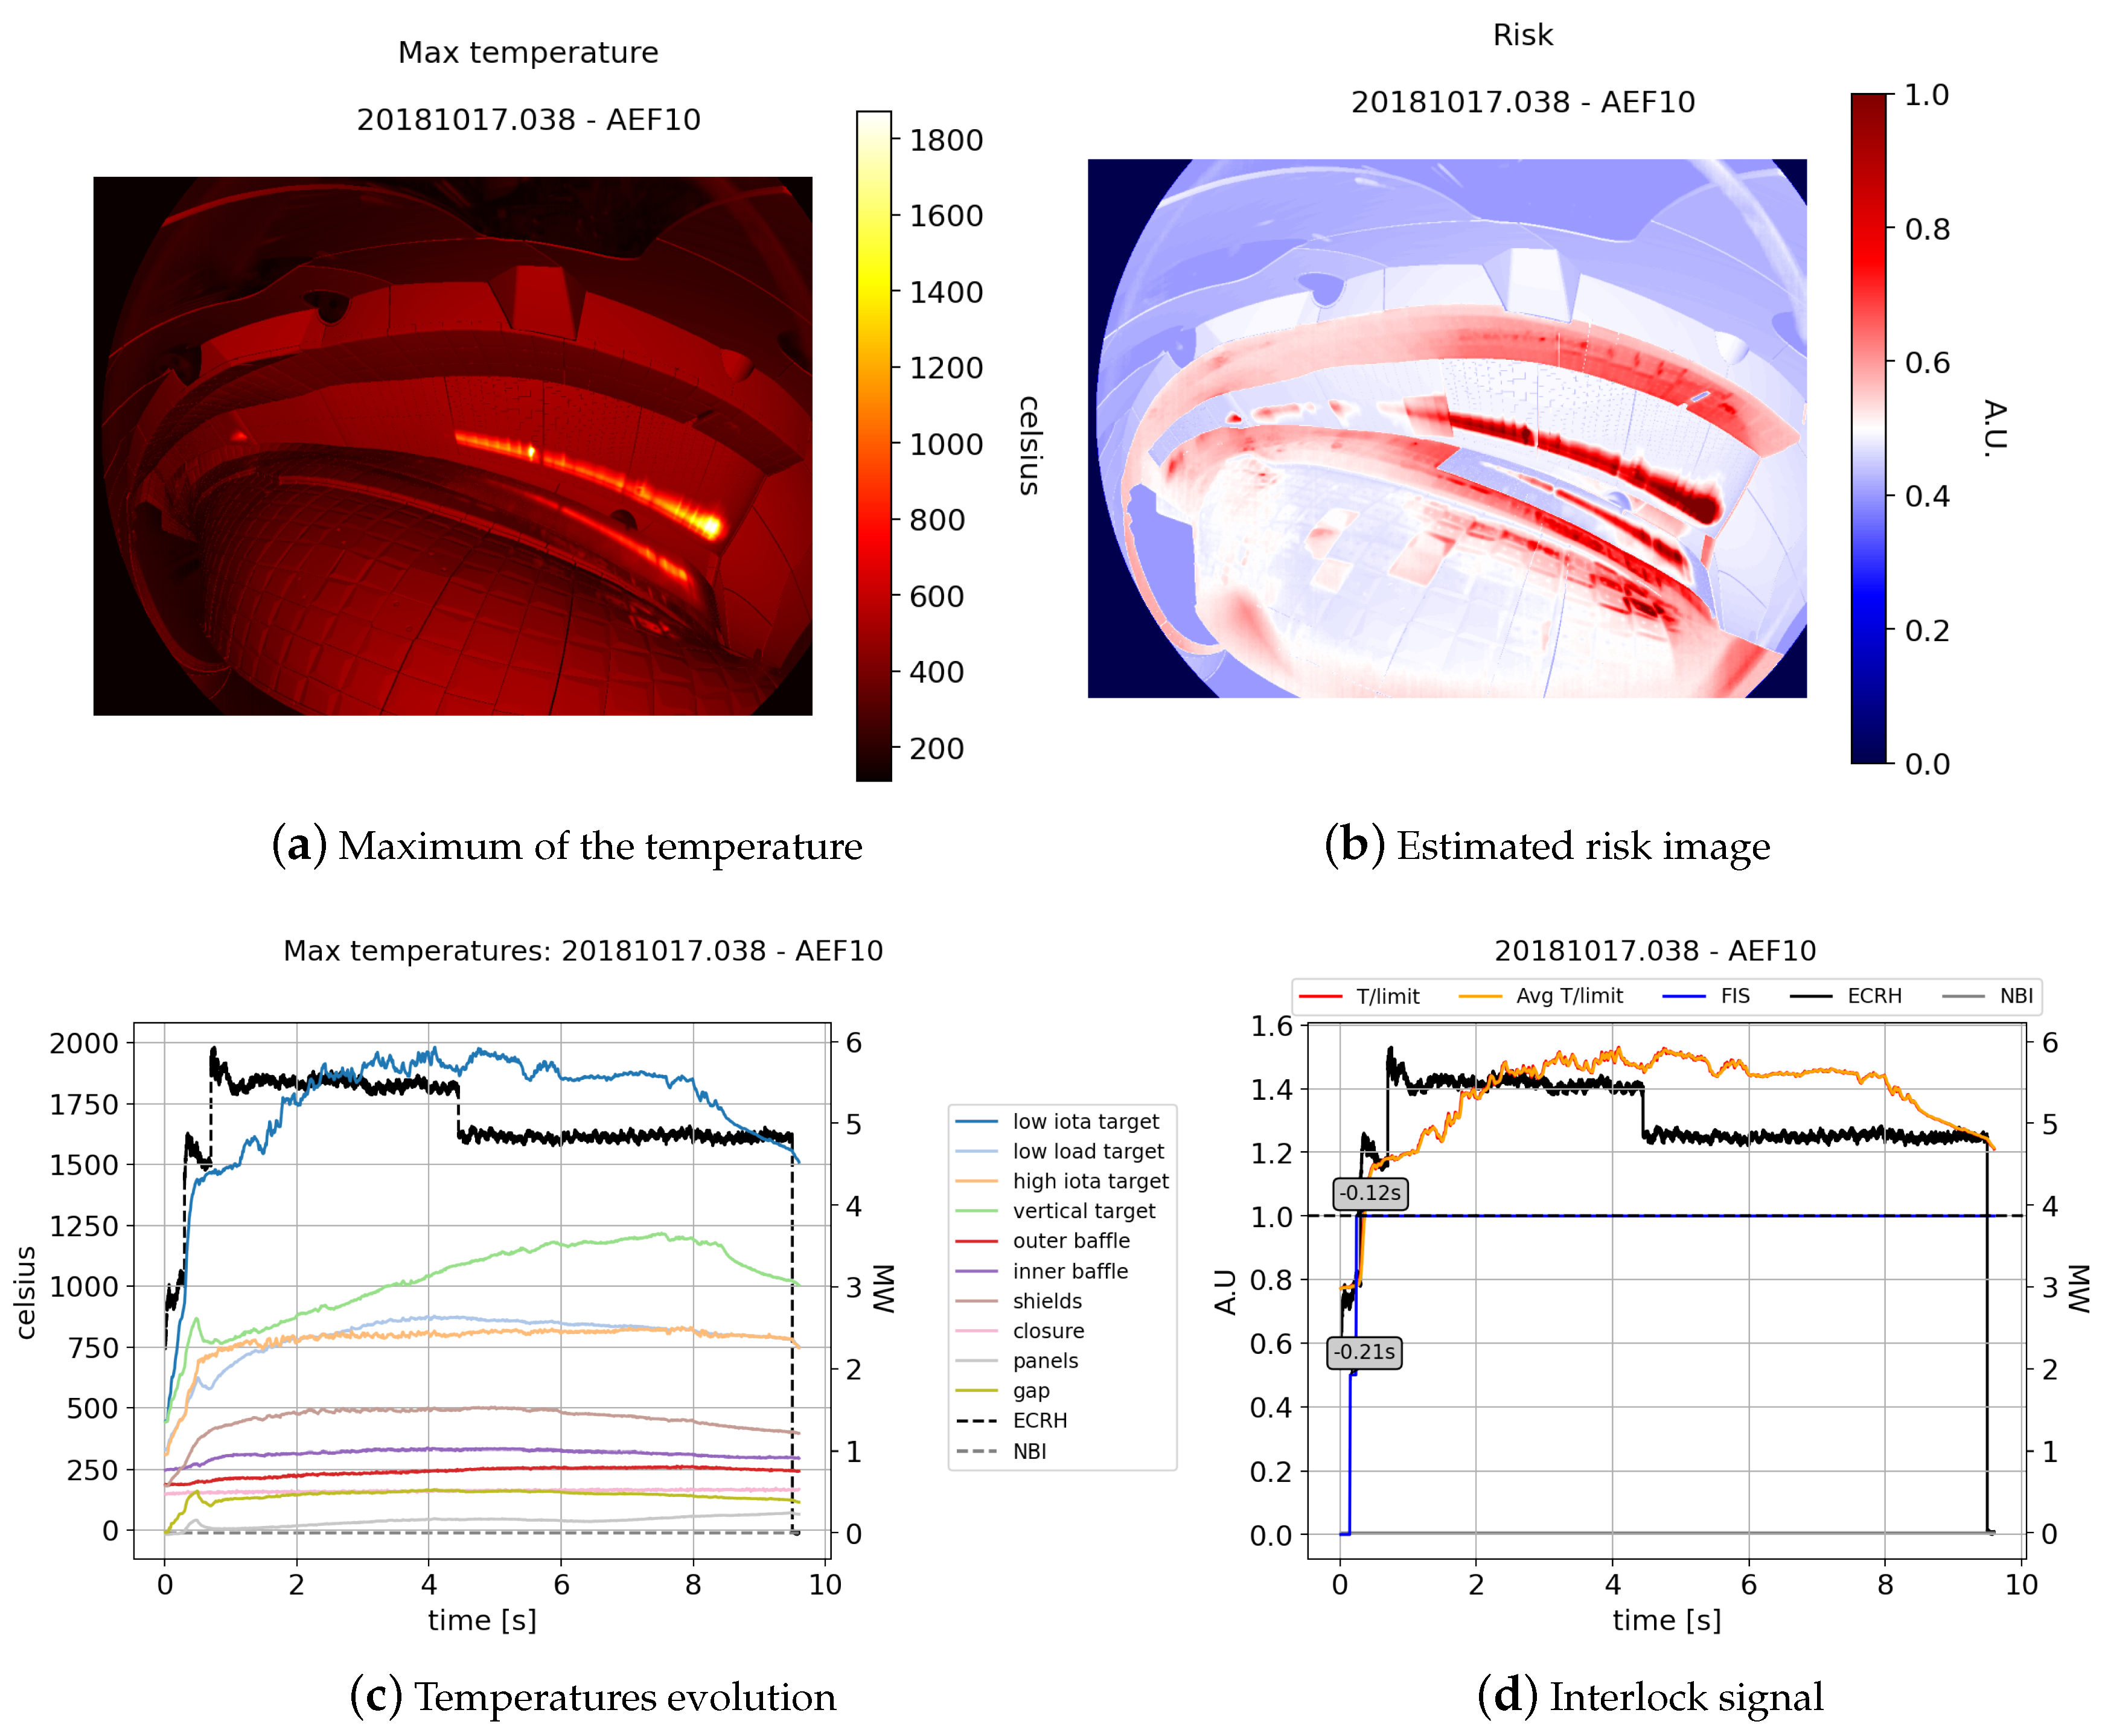
- An estimated risk is then computed in Equation (7) for each pixel with the averaged corrected temperature , the temperature threshold and a correction factor to consider the presence of surface layers [13].Note that the estimated risk image is normalized for the different temperature limits and heat fluxes on the different PFCs, allowing to detect overloaded regions in the entire field of view naturally, avoiding the use of regions of interest.
- (8)
- The overloaded regions are detected by clustering all pixels that have an estimated risk equal or greater than 1. If the cluster’s area (in physical units) is bigger than a minimum area an alarm is triggered. The scene model also provides the physical area covered by each pixel in the image.
4. Results from OP1.2 Campaign
5. Towards Feedback Control of Thermal Loads
6. Conclusions
Author Contributions
Funding
Data Availability Statement
Acknowledgments
Conflicts of Interest
References
- Endler, M.; Baldzuhn, J.; Beidler, C.D.; Bosch, H.S.; Bozhenkov, S.; Buttenschön, B.; Dinklage, A.; Fellinger, J.; Feng, Y.; Fuchert, G.; et al. Wendelstein 7-X on the path to long-pulse high-performance operation. Fusion Eng. Des. 2021, 167, 112381. [Google Scholar] [CrossRef]
- Klinger, T.; Andreeva, T.; Bozhenkov, S.; Brandt, C.; Burhenn, R.; Buttenschön, B.; Fuchert, G.; Geiger, B.; Grulke, O.; Laqua, H.P.; et al. Overview of first Wendelstein 7-X high- performance operation. Nucl. Fusion 2019, 59, 112004. [Google Scholar] [CrossRef]
- Jakubowski, M.; Endler, M.; Feng, Y.; Gao, Y.; Killer, C.; König, R.; Krychowiak, M.; Perseo, V.; Reimold, F.; Schmitz, O.; et al. Overview of the results from divertor experiments with attached and detached plasmas at Wendelstein 7-X and their implications for steady-state operation. Nucl. Fusion 2021, 61, 106003. [Google Scholar] [CrossRef]
- Boscary, J.; Peacock, A.; Stadler, R.; Mendelevitch, B.; Tittes, H.; Tretter, J.; Smirnow, M.; Li, C. Actively Water-Cooled Plasma Facing Components of the Wendelstein 7-X Stellarator. Fusion Sci. Technol. 2017, 64, 263–268. [Google Scholar] [CrossRef]
- Stadler, R.; Vorköper, A.; Boscary, J.; Cardella, A.; Hurd, F.; Li, C.; Mendelevitch, B.; Peacock, A.; Pirsch, H. The in-vessel components of the experiment W7-X. Fusion Eng. Des. 2009, 84, 305–308. [Google Scholar] [CrossRef] [Green Version]
- Huber, A.; Kinna, D.; Huber, V.; Arnoux, G.; Balboa, I.; Balorin, C.; Carman, P.; Carvalho, P.; Collins, S.; Conway, N.; et al. The near infrared imaging system for the real-time protection of the JET ITER-like wall. Phys. Scr. 2017, T170, 014027. [Google Scholar] [CrossRef]
- Huber, V.; Huber, A.; Kinna, D.; Matthews, G.F.; Sergienko, G.; Balboa, I.; Brezinsek, S.; Lomas, P.J.; Mailloux, J.; McCullen, P.; et al. The Software and Hardware Architecture of the Real-Time Protection of In-Vessel Components in JET-ILW. Nucl. Fusion 2019, 59, 076016. [Google Scholar] [CrossRef]
- Herrmann, A.; Drube, R.; Lunt, T.; De Marné, P. Real-time protection of in-vessel components in ASDEX Upgrade. Fusion Eng. Des. 2011, 86, 530–534. [Google Scholar] [CrossRef] [Green Version]
- Sieglin, B.; Faitsch, M.; Herrmann, A.; Brucker, B.; Eich, T.; Kammerloher, L.; Martinov, S. Real-Time capable Infrared Thermography at ASDEX Upgrade. Rev. Sci. Instrum. 2015, 86, 113502. [Google Scholar] [CrossRef] [PubMed]
- Jakubowski, M.; Drewelow, P.; Fellinger, J.; Puig Sitjes, A.; Wurden, G.; Ali, A.; Biedermann, C.; Cannas, B.; Chauvin, D.; Gamradt, M.; et al. Infrared imaging systems for wall protection in the W7-X stellarator. Rev. Sci. Instrum. 2018, 89, 10E116. [Google Scholar] [CrossRef]
- Pisano, F.; Cannas, B.; Fanni, A.; Sias, G.; Jakubowski, M.W.; Drewelow, P.; Niemann, H.; Puig Sitjes, A.; Gao, Y.; Moncada, V.; et al. Tools for Image Analysis and First Wall Protection at W7-X. Fusion Sci. Technol. 2020, 76, 933–941. [Google Scholar] [CrossRef]
- Herrmann, A.; Sieglin, B.; Faitsch, M.; Team, A.U. Surface Temperature Measurement of In-Vessel Components and Its Real-Time Validation. Fusion Sci. Technol. 2016, 69, 569–579. [Google Scholar] [CrossRef]
- Ali, A.; Niemann, H.; Jakubowski, M.; Pedersen, T.S.; Neu, R.; Corre, Y.; Drewelow, P.; Sitjes, A.P.; Wurden, G.; Pisano, F.; et al. Initial results from the hotspot detection scheme for protection of plasma facing components in Wendelstein 7-X. Nucl. Mater. Energy 2019, 19, 335–339. [Google Scholar] [CrossRef]
- Vincent, L. Morphological Grayscale Reconstruction in Image Analysis: Applications and Efficient Algorithms. IEEE Trans. Image Process. 1993, 2, 176–201. [Google Scholar] [CrossRef] [Green Version]
- Sieglin, B.; Faitsch, M.; Herrmann, A.; Martinov, S.; Eich, T.; Team, A.U. Real-Time infrared thermography at ASDEX Upgrade. Fusion Sci. Technol. 2016, 69, 580–585. [Google Scholar] [CrossRef]
- Sitjes, A.P.; Gao, Y.; Jakubowski, M.; Drewelow, P.; Niemann, H.; Ali, A.; Moncada, V.; Pisano, F.; Ngo, T.T.; Cannas, B.; et al. Observation of thermal events on the plasma facing components of Wendelstein 7-X. J. Instrum. 2019, 14, C11002. [Google Scholar] [CrossRef]
- Mitteau, R.; Belafdil, C.; Balorin, C.; Courtois, X.; Moncada, V.; Nouailletas, R.; Santraine, B. WEST operation with real time feed back control based on wall component temperature toward machine protection in a steady state tungsten environment. Fusion Eng. Des. 2021, 165, 112223. [Google Scholar] [CrossRef]
- Martin, V.; Moncada, V.; Travere, J.M.; Loarer, T.; Brémond, F.; Charpiat, G.; Thonnat, M. A Cognitive Vision System for Nuclear Fusion Device Monitoring. In International Conference on Computer Vision Systems; Springer: Berlin/Heidelberg, Germany, 2011; pp. 163–172. [Google Scholar]
- Gao, Y.; Geiger, J.; Jakubowski, M.W.; Drewelow, P.; Endler, M.; Rahbarnia, K.; Bozhenkov, S.; Otte, M.; Suzuki, Y.; Feng, Y.; et al. Effects of toroidal plasma current on divertor power depositions on Wendelstein 7-X. Nucl. Fusion 2019, 59, 106015. [Google Scholar] [CrossRef]
- Pisano, F.; Cannas, B.; Fanni, A.; Sias, G.; Gao, Y.; Jakubowski, M.; Niemann, H.; Sitjes, A.P. Learning control coil currents from heat-flux images using convolutional neural networks at Wendelstein 7-X. Plasma Phys. Control. Fusion 2020, 63, 025009. [Google Scholar] [CrossRef]
- Böckenhoff, D.; Blatzheim, M. Application of improved analysis of convective heat loads on plasma facing components to Wendelstein 7-X. Nucl. Fusion 2019, 59, 086031. [Google Scholar] [CrossRef]
- Böckenhoff, D.; Blatzheim, M.; Hölbe, H.; Niemann, H.; Pisano, F.; Labahn, R.; Pedersen, T.S. Reconstruction of Magnetic Configurations in W7-X using Artifical Neural Networks. Nucl. Fusion 2018, 58, 056009. [Google Scholar] [CrossRef] [Green Version]


Publisher’s Note: MDPI stays neutral with regard to jurisdictional claims in published maps and institutional affiliations. |
© 2021 by the authors. Licensee MDPI, Basel, Switzerland. This article is an open access article distributed under the terms and conditions of the Creative Commons Attribution (CC BY) license (https://creativecommons.org/licenses/by/4.0/).
Share and Cite
Puig Sitjes, A.; Jakubowski, M.; Naujoks, D.; Gao, Y.; Drewelow, P.; Niemann, H.; Fellinger, J.; Moncada, V.; Pisano, F.; Belafdil, C.; et al. Real-Time Detection of Overloads on the Plasma-Facing Components of Wendelstein 7-X. Appl. Sci. 2021, 11, 11969. https://doi.org/10.3390/app112411969
Puig Sitjes A, Jakubowski M, Naujoks D, Gao Y, Drewelow P, Niemann H, Fellinger J, Moncada V, Pisano F, Belafdil C, et al. Real-Time Detection of Overloads on the Plasma-Facing Components of Wendelstein 7-X. Applied Sciences. 2021; 11(24):11969. https://doi.org/10.3390/app112411969
Chicago/Turabian StylePuig Sitjes, Aleix, Marcin Jakubowski, Dirk Naujoks, Yu Gao, Peter Drewelow, Holger Niemann, Joris Fellinger, Victor Moncada, Fabio Pisano, Chakib Belafdil, and et al. 2021. "Real-Time Detection of Overloads on the Plasma-Facing Components of Wendelstein 7-X" Applied Sciences 11, no. 24: 11969. https://doi.org/10.3390/app112411969